Banca Transilvania S.A. - de.marketscreener.com€¦Banca Transilvania S.A. 1 Consolidated and...
61
Banca Transilvania S.A. CONDENSED CONSOLIDATED AND INDIVIDUAL INTERIM FINANCIAL STATEMENTS Prepared in accordance with International Financial Reporting Standards as endorsed by the European Union As at 30 June 2017
Transcript of Banca Transilvania S.A. - de.marketscreener.com€¦Banca Transilvania S.A. 1 Consolidated and...
Banca Transilvania S.A. CONDENSED CONSOLIDATED AND INDIVIDUAL INTERIM FINANCIAL STATEMENTS Prepared in accordance with International Financial Reporting Standards as endorsed by the European Union As at 30 June 2017
Banca Transilvania S.A.
CONTENTS
Consolidated and Individual Statement of Profit or Loss and Other Comprehensive Income
1-2
Consolidated and Individual Statement of Financial Position 3
Consolidated and Individual Statement of changes in Equity 4-7
Consolidated and Individual Statement of Cash Flows 8-9
Notes to the Condensed Consolidated and Individual Interim Financial Statements
10-57
Banca Transilvania S.A.
1
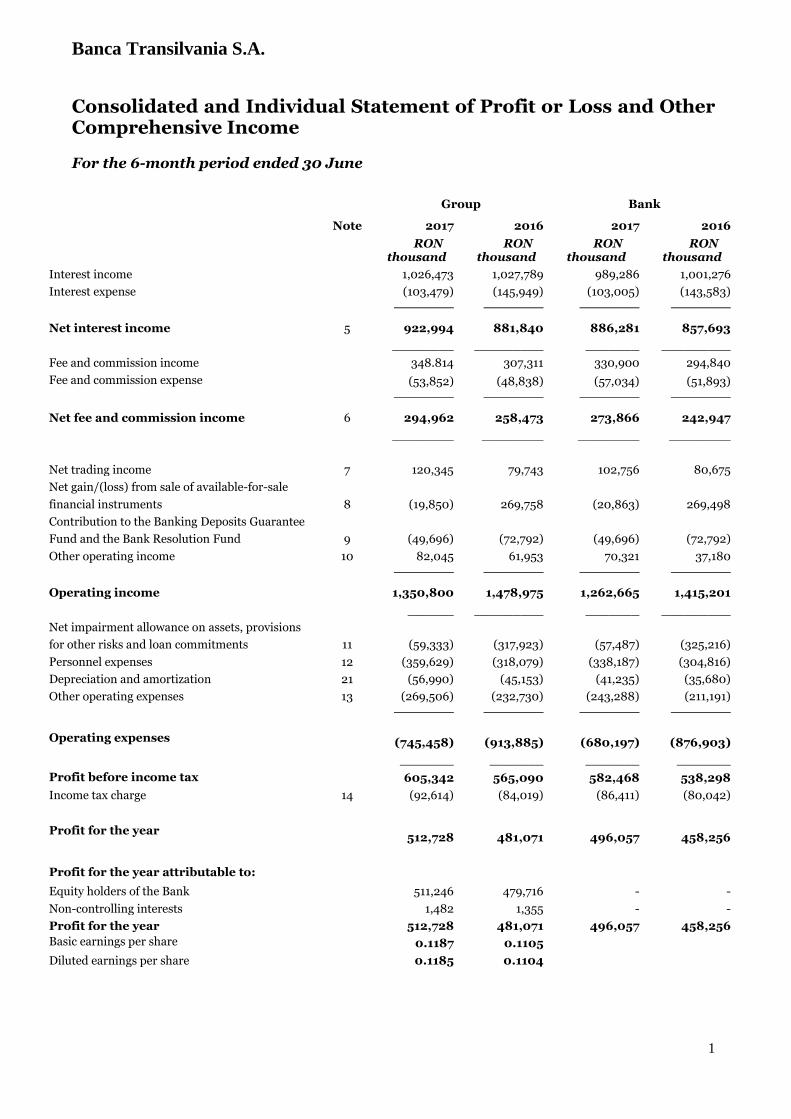
Consolidated and Individual Statement of Profit or Loss and Other Comprehensive Income For the 6-month period ended 30 June
Group Bank
Note 2017 2016 2017 2016
RON thousand
RON thousand
RON thousand
RON thousand
Interest income 1,026,473 1,027,789 989,286 1,001,276
Interest expense (103,479) (145,949) (103,005) (143,583)
__________ __________ __________ __________
Net interest income 5 922,994 881,840 886,281 857,693
________ _________ _______ _________
Fee and commission income 348.814 307,311 330,900 294,840
Fee and commission expense (53,852) (48,838) (57,034) (51,893)
__________ __________ __________ __________
Net fee and commission income 6 294,962 258,473 273,866 242,947
________ ________ ________ ________
Net trading income 7 120,345 79,743 102,756 80,675
Net gain/(loss) from sale of available-for-sale
financial instruments 8 (19,850) 269,758 (20,863) 269,498
Contribution to the Banking Deposits Guarantee
Fund and the Bank Resolution Fund 9 (49,696) (72,792) (49,696) (72,792)
Other operating income 10 82,045 61,953 70,321 37,180
__________ __________ __________ __________
Operating income 1,350,800 1,478,975 1,262,665 1,415,201
______ _________ _______ _________
Net impairment allowance on assets, provisions
for other risks and loan commitments 11 (59,333) (317,923) (57,487) (325,216)
Personnel expenses 12 (359,629) (318,079) (338,187) (304,816)
Depreciation and amortization 21 (56,990) (45,153) (41,235) (35,680)
Other operating expenses 13 (269,506) (232,730) (243,288) (211,191)
__________ __________ __________ __________
Operating expenses (745,458) (913,885) (680,197) (876,903)
_______ _______ _______ _______
Profit before income tax 605,342 565,090 582,468 538,298
Income tax charge 14 (92,614) (84,019) (86,411) (80,042)
Profit for the year 512,728 481,071 496,057 458,256
Profit for the year attributable to:
Equity holders of the Bank 511,246 479,716 - -
Non-controlling interests 1,482 1,355 - -
Profit for the year 512,728 481,071 496,057 458,256
Basic earnings per share 0.1187 0.1105
Diluted earnings per share 0.1185 0.1104

Banca Transilvania S.A.
2
Consolidated and Individual Statement of Profit or Loss and Other Comprehensive Income (continued) For the 6-month period ended 30 June
Group Bank
Note 2017 2016 2017 2016
RON thousand
RON thousand
RON thousand
RON thousand
Profit for the year 512,728 481,071 496,057 458,256
Items that cannot be reclassified as profit or
loss, net of tax
Other elements of comprehensive income (163) (81) (45) 7
Items which are or may be reclassified as profit
or loss
Fair value reserve (available-for-sale financial assets),
out of which:
134,942 (100,274) 159,180 (107,209)
Net gain/(loss) from the sale of available-for-sale
financial instruments transferred to profit and loss
account
19,850 (269,758) 20,863 (269,498)
Fair value changes of available-for-sale financial
instruments
115,092 169,484 138,317 162,289
Income tax directly booked into other elements of
comprehensive income
(21,566) 16,057 (25,462) 17,152
Total comprehensive income 625,941 396,773 629,730 368,206
Total comprehensive income attributable to:
Equity holders of the Bank 624,459 395,418 - -
Non-controlling interest 1,482 1,355 - -
Total comprehensive income 625,941 396,773 629,730 368,206
Ӧmer Tetik George Călinescu
CEO Deputy CEO
Banca Transilvania S.A.
The explanatory notes to the financial statements pages 10 to 57 are an integral part of these financial
statements
3
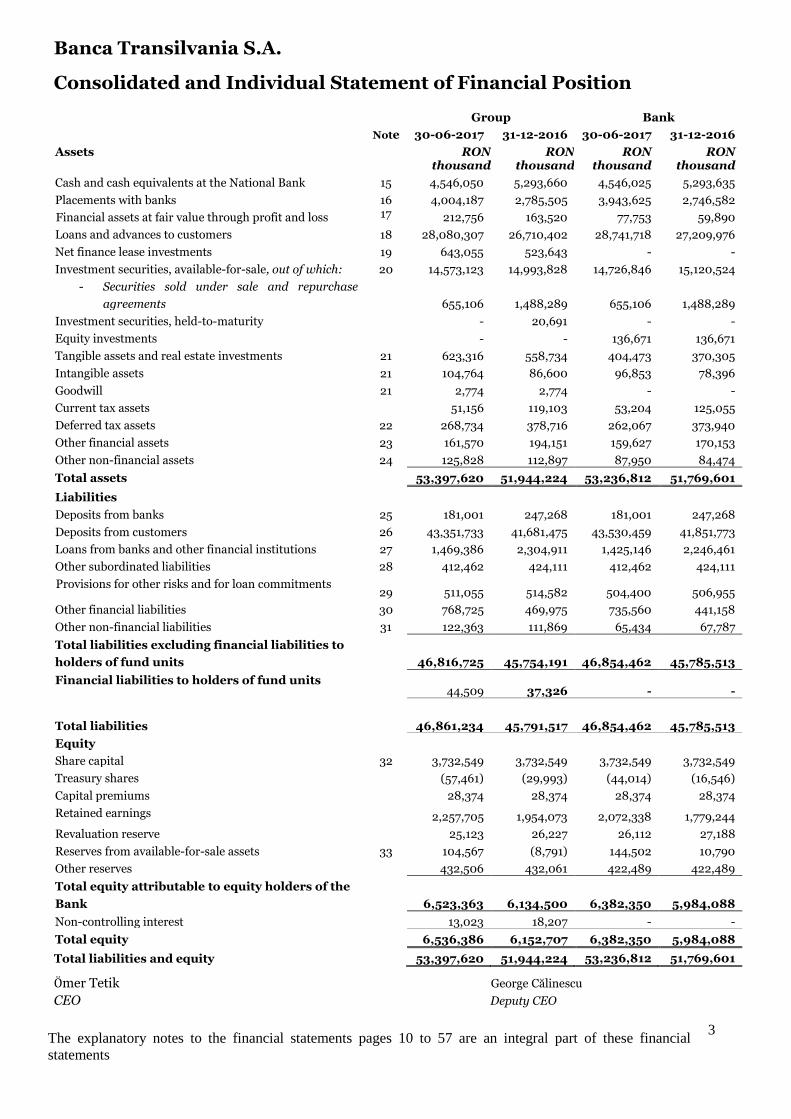
Consolidated and Individual Statement of Financial Position Group Bank
Notes
30-06-2017 31-12-2016 30-06-2017 31-12-2016
Assets RON thousand
RON thousand
RON thousand
RON thousand
Cash and cash equivalents at the National Bank 15 4,546,050 5,293,660 4,546,025 5,293,635
Placements with banks 16 4,004,187 2,785,505 3,943,625 2,746,582
Financial assets at fair value through profit and loss 17 212,756 163,520 77,753 59,890
Loans and advances to customers 18 28,080,307 26,710,402 28,741,718 27,209,976
Net finance lease investments 19 643,055 523,643 - -
Investment securities, available-for-sale, out of which: 20 14,573,123 14,993,828 14,726,846 15,120,524
- Securities sold under sale and repurchase
agreements 655,106 1,488,289 655,106 1,488,289
Investment securities, held-to-maturity - 20,691 - -
Equity investments - - 136,671 136,671
Tangible assets and real estate investments 21 623,316 558,734 404,473 370,305
Intangible assets 21 104,764 86,600 96,853 78,396
Goodwill 21 2,774 2,774 - -
Current tax assets 51,156 119,103 53,204 125,055
Deferred tax assets 22 268,734 378,716 262,067 373,940
Other financial assets 23 161,570 194,151 159,627 170,153
Other non-financial assets 24 125,828 112,897 87,950 84,474
Total assets 53,397,620 51,944,224 53,236,812 51,769,601
Liabilities
Deposits from banks 25 181,001 247,268 181,001 247,268
Deposits from customers 26 43,351,733 41,681,475 43,530,459 41,851,773
Loans from banks and other financial institutions 27 1,469,386 2,304,911 1,425,146 2,246,461
Other subordinated liabilities 28 412,462 424,111 412,462 424,111
Provisions for other risks and for loan commitments 29 511,055 514,582 504,400 506,955
Other financial liabilities 30 768,725 469,975 735,560 441,158
Other non-financial liabilities 31 122,363 111,869 65,434 67,787
Total liabilities excluding financial liabilities to
holders of fund units 46,816,725 45,754,191
46,854,462 45,785,513
Financial liabilities to holders of fund units 44,509 37,326 - -
Total liabilities 46,861,234 45,791,517 46,854,462 45,785,513
Equity
Share capital 32 3,732,549 3,732,549 3,732,549 3,732,549
Treasury shares (57,461) (29,993) (44,014) (16,546)
Capital premiums 28,374 28,374 28,374 28,374
Retained earnings 2,257,705 1,954,073 2,072,338 1,779,244
Revaluation reserve 25,123 26,227 26,112 27,188
Reserves from available-for-sale assets 33 104,567 (8,791) 144,502 10,790
Other reserves 432,506 432,061 422,489 422,489
Total equity attributable to equity holders of the
Bank 6,523,363 6,134,500 6,382,350 5,984,088
Non-controlling interest 13,023 18,207 - -
Total equity 6,536,386 6,152,707 6,382,350 5,984,088
Total liabilities and equity 53,397,620
51,944,224 53,236,812 51,769,601
Ӧmer Tetik George Călinescu
CEO Deputy CEO
Banca Transilvania S.A.
The explanatory notes to the financial statements pages 10 to 57 are an integral part of these financial statements.
4
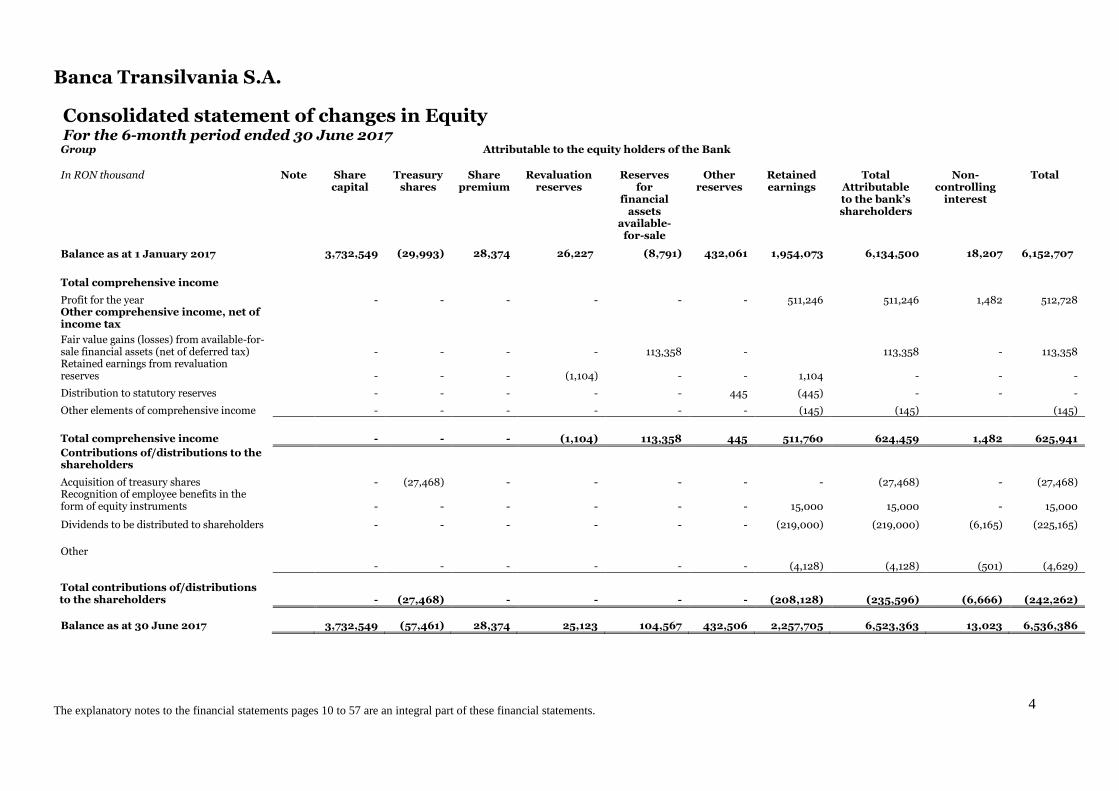
Consolidated statement of changes in Equity For the 6-month period ended 30 June 2017 Group Attributable to the equity holders of the Bank
In RON thousand Note Share capital
Treasury shares
Share premium
Revaluation reserves
Reserves for
financial assets
available-for-sale
Other reserves
Retained earnings
Total Attributable to the bank’s shareholders
Non-controlling
interest
Total
Balance as at 1 January 2017 3,732,549 (29,993) 28,374 26,227 (8,791) 432,061 1,954,073 6,134,500 18,207 6,152,707
Total comprehensive income
Profit for the year - - - - - - 511,246 511,246 1,482 512,728 Other comprehensive income, net of income tax
Fair value gains (losses) from available-for-sale financial assets (net of deferred tax) - - - - 113,358 - 113,358 - 113,358 Retained earnings from revaluation reserves - - - (1,104) - - 1,104 - - -
Distribution to statutory reserves - - - - - 445 (445) - - -
Other elements of comprehensive income - - - - - - (145) (145) (145)
Total comprehensive income - - - (1,104) 113,358 445 511,760 624,459 1,482 625,941
Contributions of/distributions to the shareholders
Acquisition of treasury shares - (27,468) - - - - - (27,468) - (27,468) Recognition of employee benefits in the form of equity instruments - - - - - - 15,000 15,000 - 15,000
Dividends to be distributed to shareholders - - - - - - (219,000) (219,000) (6,165) (225,165)
Other
- - - - - - (4,128) (4,128) (501) (4,629)
Total contributions of/distributions to the shareholders - (27,468) - - - - (208,128) (235,596) (6,666) (242,262)
Balance as at 30 June 2017 3,732,549 (57,461) 28,374 25,123 104,567 432,506 2,257,705 6,523,363 13,023 6,536,386
Banca Transilvania S.A.
The explanatory notes to the financial statements pages 10 to 57 are an integral part of these financial statements.
5
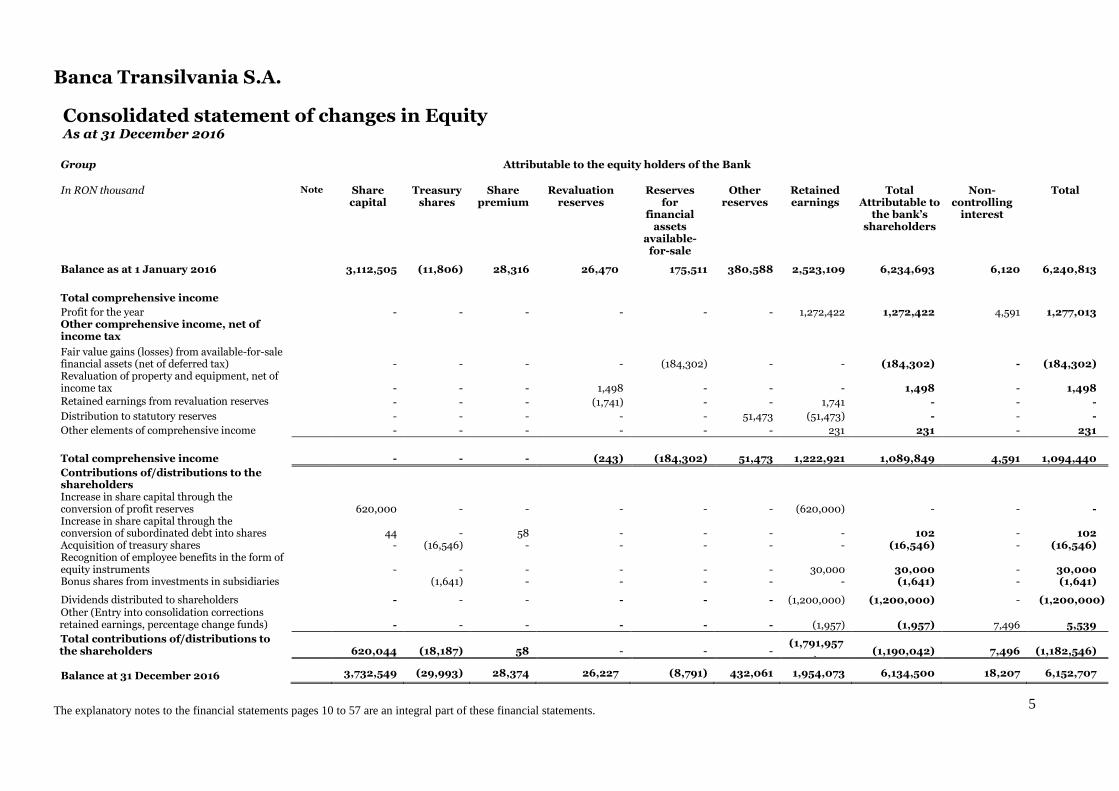
Consolidated statement of changes in Equity As at 31 December 2016
Group Attributable to the equity holders of the Bank
In RON thousand Note Share capital
Treasury shares
Share premium
Revaluation reserves
Reserves for
financial assets
available-for-sale
Other reserves
Retained earnings
Total Attributable to
the bank’s shareholders
Non-controlling
interest
Total
Balance as at 1 January 2016 3,112,505 (11,806) 28,316 26,470 175,511 380,588 2,523,109 6,234,693 6,120 6,240,813
Total comprehensive income
Profit for the year - - - - - - 1,272,422 1,272,422 4,591 1,277,013 Other comprehensive income, net of income tax
Fair value gains (losses) from available-for-sale financial assets (net of deferred tax) - - - - (184,302) - - (184,302) - (184,302) Revaluation of property and equipment, net of income tax - - - 1,498 - - - 1,498 - 1,498
Retained earnings from revaluation reserves - - - (1,741) - - 1,741 - - -
Distribution to statutory reserves - - - - - 51,473 (51,473) - - -
Other elements of comprehensive income - - - - - - 231 231 - 231
Total comprehensive income - - - (243) (184,302) 51,473 1,222,921 1,089,849 4,591 1,094,440
Contributions of/distributions to the shareholders Increase in share capital through the conversion of profit reserves 620,000 - - - - - (620,000) - - - Increase in share capital through the conversion of subordinated debt into shares 44 - 58 - - - - 102 - 102 Acquisition of treasury shares - (16,546) - - - - - (16,546) - (16,546) Recognition of employee benefits in the form of equity instruments - - - - - - 30,000 30,000 - 30,000 Bonus shares from investments in subsidiaries (1,641) - - - - - (1,641) - (1,641)
Dividends distributed to shareholders - - - - - - (1,200,000) (1,200,000) - (1,200,000) Other (Entry into consolidation corrections retained earnings, percentage change funds) - - - - - - (1,957) (1,957) 7,496 5,539
Total contributions of/distributions to the shareholders 620,044 (18,187) 58 - - -
(1,791,957
) (1,190,042) 7,496 (1,182,546)
Balance at 31 December 2016 3,732,549 (29,993) 28,374 26,227 (8,791) 432,061 1,954,073 6,134,500 18,207 6,152,707
Banca Transilvania S.A.
The explanatory notes to the financial statements pages 10 to 57 are an integral part of these financial statements.
6
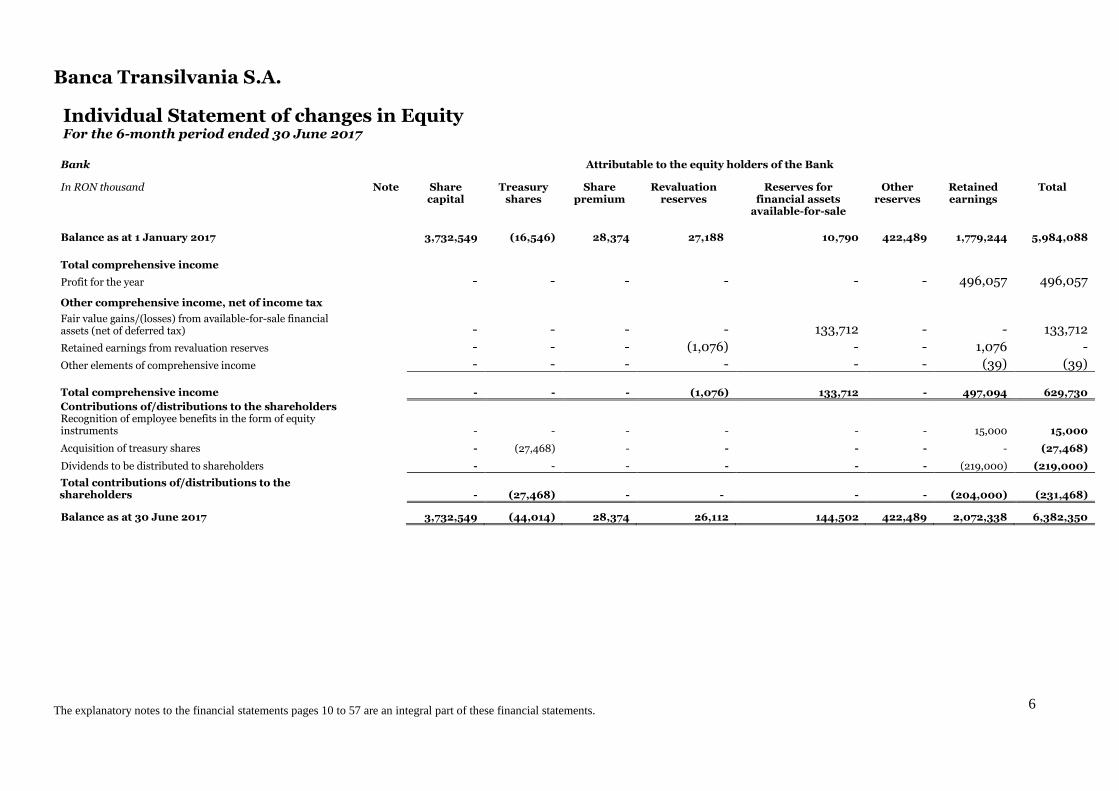
Individual Statement of changes in Equity For the 6-month period ended 30 June 2017
Bank Attributable to the equity holders of the Bank
In RON thousand Note Share capital
Treasury shares
Share premium
Revaluation reserves
Reserves for financial assets
available-for-sale
Other reserves
Retained earnings
Total
Balance as at 1 January 2017 3,732,549 (16,546) 28,374 27,188 10,790 422,489 1,779,244 5,984,088
Total comprehensive income
Profit for the year - - - - - - 496,057 496,057
Other comprehensive income, net of income tax
Fair value gains/(losses) from available-for-sale financial assets (net of deferred tax) - - - - 133,712 - - 133,712
Retained earnings from revaluation reserves - - - (1,076) - - 1,076 -
Other elements of comprehensive income - - - - - - (39) (39)
Total comprehensive income
- - - (1,076) 133,712 - 497,094 629,730
Contributions of/distributions to the shareholders Recognition of employee benefits in the form of equity instruments - - - - - - 15,000 15,000
Acquisition of treasury shares - (27,468) - - - - - (27,468)
Dividends to be distributed to shareholders - - - - - - (219,000) (219,000)
Total contributions of/distributions to the shareholders
- (27,468) - - - - (204,000) (231,468)
Balance as at 30 June 2017 3,732,549 (44,014) 28,374 26,112 144,502 422,489 2,072,338 6,382,350
Banca Transilvania S.A.
The explanatory notes to the financial statements pages 10 to 57 are an integral part of these financial statements.
7
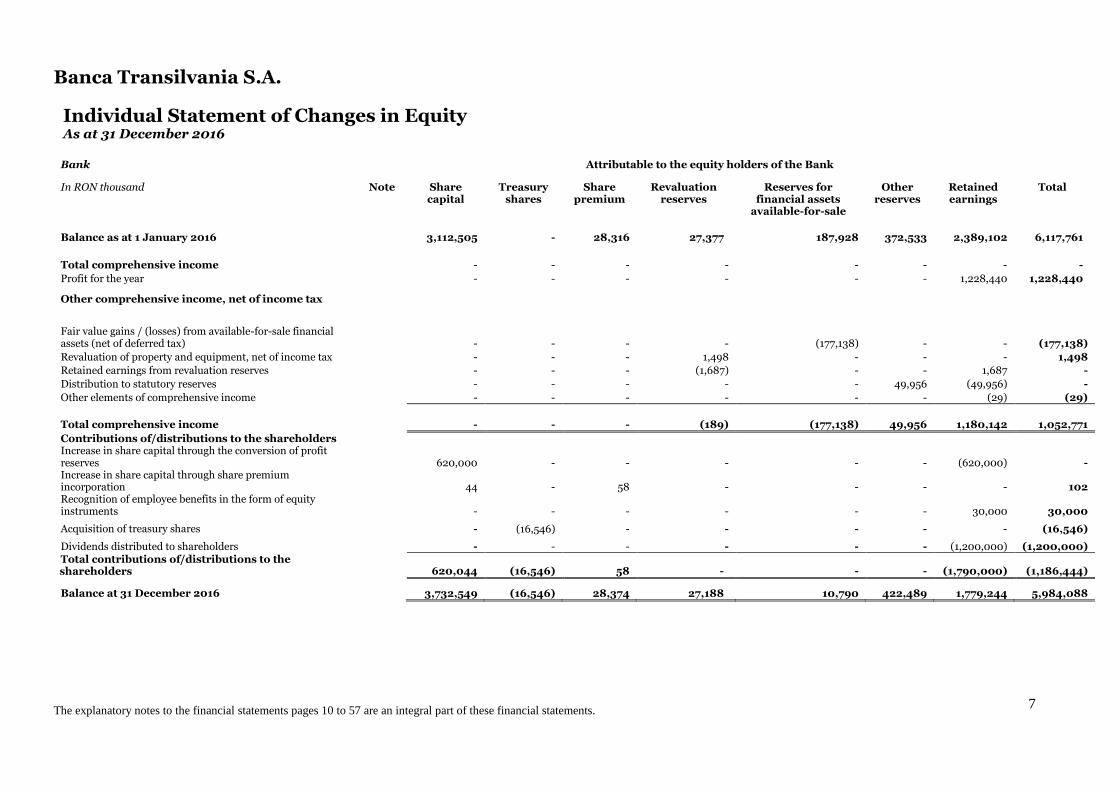
Individual Statement of Changes in Equity As at 31 December 2016
Bank Attributable to the equity holders of the Bank
In RON thousand Note Share capital
Treasury shares
Share premium
Revaluation reserves
Reserves for financial assets
available-for-sale
Other reserves
Retained earnings
Total
Balance as at 1 January 2016 3,112,505 - 28,316 27,377 187,928 372,533 2,389,102 6,117,761
Total comprehensive income
- - - - - - - -
Profit for the year - - - - - - 1,228,440 1,228,440
Other comprehensive income, net of income tax
Fair value gains / (losses) from available-for-sale financial assets (net of deferred tax) - - - - (177,138) - - (177,138)
Revaluation of property and equipment, net of income tax - - - 1,498 - - - 1,498
Retained earnings from revaluation reserves - - - (1,687) - - 1,687 -
Distribution to statutory reserves - - - - - 49,956 (49,956) -
Other elements of comprehensive income - - - - - - (29) (29)
Total comprehensive income
- - - (189) (177,138) 49,956 1,180,142 1,052,771
Contributions of/distributions to the shareholders Increase in share capital through the conversion of profit reserves 620,000 - - - - - (620,000) - Increase in share capital through share premium incorporation 44 - 58 - - - - 102 Recognition of employee benefits in the form of equity instruments - - - - - - 30,000 30,000
Acquisition of treasury shares - (16,546) - - - - - (16,546)
Dividends distributed to shareholders - - - - - - (1,200,000) (1,200,000) Total contributions of/distributions to the shareholders
620,044 (16,546) 58 - - - (1,790,000) (1,186,444)
Balance at 31 December 2016 3,732,549 (16,546) 28,374 27,188 10,790 422,489 1,779,244 5,984,088
Banca Transilvania S.A.
The explanatory notes to the financial statements pages 10 to 57 are an integral part of these financial statements.
8
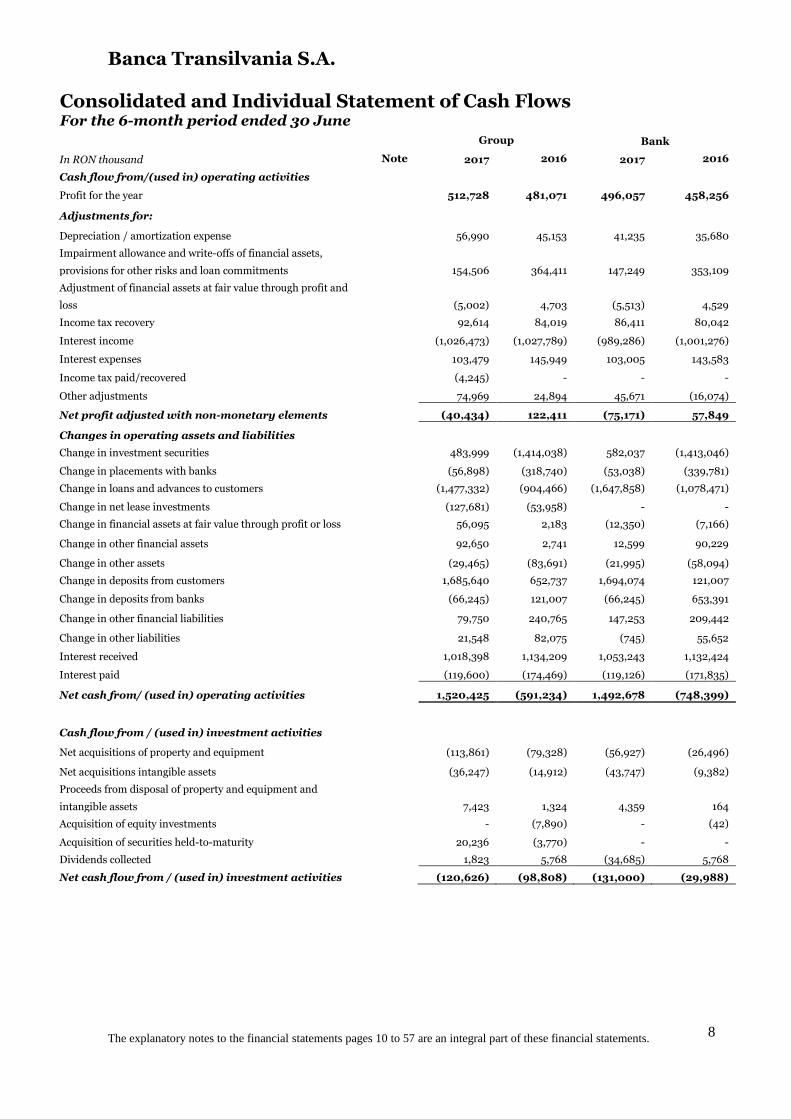
Consolidated and Individual Statement of Cash Flows For the 6-month period ended 30 June
Group Bank
In RON thousand Note 2017 2016 2017 2016
Cash flow from/(used in) operating activities
Profit for the year 512,728 481,071 496,057 458,256
Adjustments for:
Depreciation / amortization expense 56,990 45,153 41,235 35,680
Impairment allowance and write-offs of financial assets,
provisions for other risks and loan commitments 154,506 364,411 147,249 353,109
Adjustment of financial assets at fair value through profit and
loss (5,002) 4,703 (5,513) 4,529
Income tax recovery 92,614 84,019 86,411 80,042
Interest income (1,026,473) (1,027,789) (989,286) (1,001,276)
Interest expenses 103,479 145,949 103,005 143,583
Income tax paid/recovered (4,245) - - -
Other adjustments 74,969 24,894 45,671 (16,074)
Net profit adjusted with non-monetary elements (40,434) 122,411 (75,171) 57,849
Changes in operating assets and liabilities
Change in investment securities 483,999 (1,414,038) 582,037 (1,413,046)
Change in placements with banks (56,898) (318,740) (53,038) (339,781)
Change in loans and advances to customers (1,477,332) (904,466) (1,647,858) (1,078,471)
Change in net lease investments (127,681) (53,958) - -
Change in financial assets at fair value through profit or loss 56,095 2,183 (12,350) (7,166)
Change in other financial assets 92,650 2,741 12,599 90,229
Change in other assets (29,465) (83,691) (21,995) (58,094)
Change in deposits from customers 1,685,640 652,737 1,694,074 121,007
Change in deposits from banks (66,245) 121,007 (66,245) 653,391
Change in other financial liabilities 79,750 240,765 147,253 209,442
Change in other liabilities 21,548 82,075 (745) 55,652
Interest received 1,018,398 1,134,209 1,053,243 1,132,424
Interest paid (119,600) (174,469) (119,126) (171,835)
Net cash from/ (used in) operating activities 1,520,425 (591,234) 1,492,678 (748,399)
Cash flow from / (used in) investment activities
Net acquisitions of property and equipment (113,861) (79,328) (56,927) (26,496)
Net acquisitions intangible assets (36,247) (14,912) (43,747) (9,382)
Proceeds from disposal of property and equipment and
intangible assets
7,423 1,324 4,359 164
Acquisition of equity investments - (7,890) - (42)
Acquisition of securities held-to-maturity 20,236 (3,770) - -
Dividends collected 1,823 5,768 (34,685) 5,768
Net cash flow from / (used in) investment activities (120,626) (98,808) (131,000) (29,988)
Banca Transilvania S.A.
The explanatory notes to the financial statements pages 10 to 57 are an integral part of these financial statements.
9
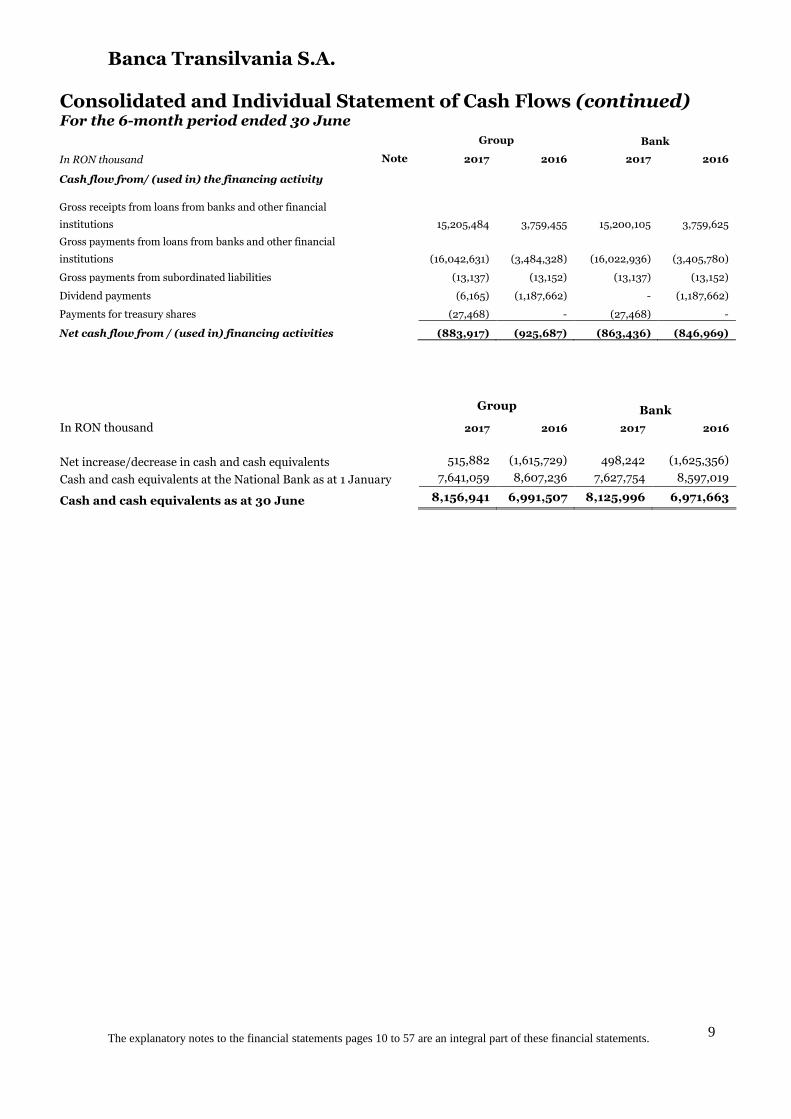
Consolidated and Individual Statement of Cash Flows (continued) For the 6-month period ended 30 June
Group Bank
In RON thousand 2017 2016 2017 2016
Net increase/decrease in cash and cash equivalents 515,882 (1,615,729) 498,242 (1,625,356)
Cash and cash equivalents at the National Bank as at 1 January 7,641,059 8,607,236 7,627,754 8,597,019
Cash and cash equivalents as at 30 June 8,156,941 6,991,507 8,125,996 6,971,663
Group Bank
In RON thousand Note 2017 2016 2017 2016
Cash flow from/ (used in) the financing activity
Gross receipts from loans from banks and other financial
institutions 15,205,484 3,759,455 15,200,105 3,759,625
Gross payments from loans from banks and other financial
institutions (16,042,631) (3,484,328) (16,022,936) (3,405,780)
Gross payments from subordinated liabilities (13,137) (13,152) (13,137) (13,152)
Dividend payments (6,165) (1,187,662) - (1,187,662)
Payments for treasury shares (27,468) - (27,468) -
Net cash flow from / (used in) financing activities (883,917) (925,687) (863,436) (846,969)
Banca Transilvania S.A.
The explanatory notes to the financial statements pages 10 to 57 are an integral part of these financial statements.
10
Notes to the Condensed Consolidated and Individual Interim Financial Statements
1. Reporting entity and basis of preparation
a) Reporting entity
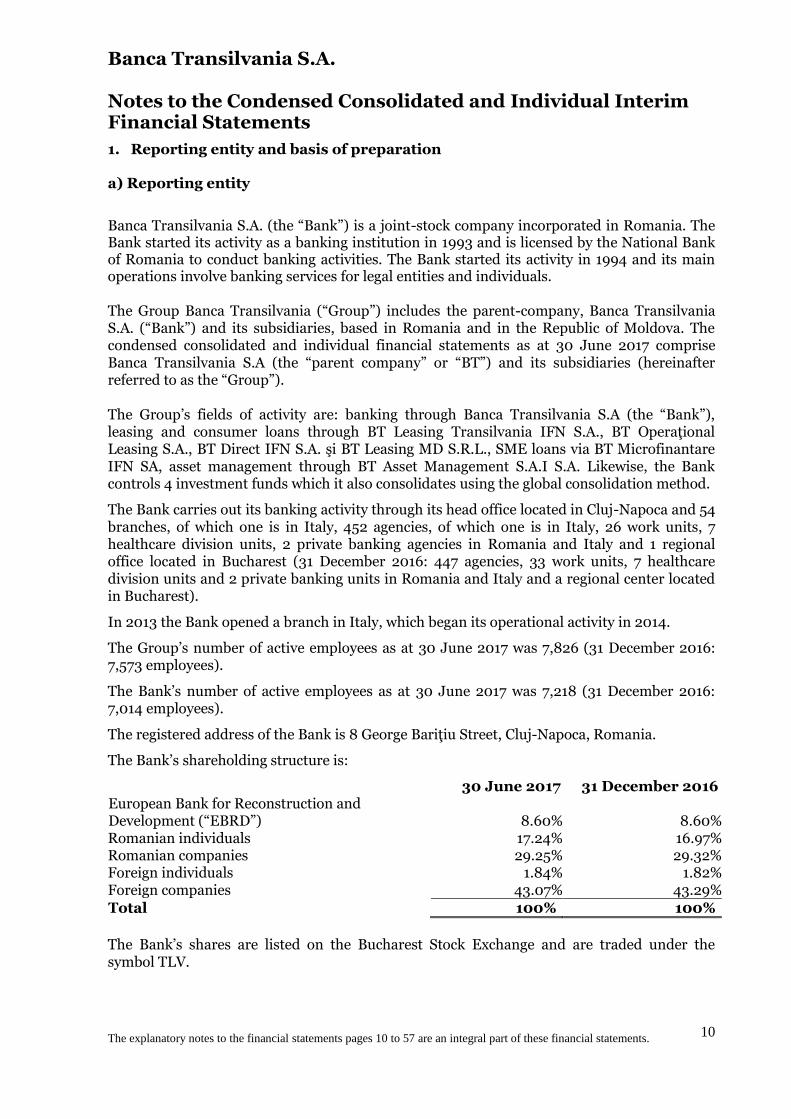
Banca Transilvania S.A. (the “Bank”) is a joint-stock company incorporated in Romania. The Bank started its activity as a banking institution in 1993 and is licensed by the National Bank of Romania to conduct banking activities. The Bank started its activity in 1994 and its main operations involve banking services for legal entities and individuals. The Group Banca Transilvania (“Group”) includes the parent-company, Banca Transilvania S.A. (“Bank”) and its subsidiaries, based in Romania and in the Republic of Moldova. The condensed consolidated and individual financial statements as at 30 June 2017 comprise Banca Transilvania S.A (the “parent company” or “BT”) and its subsidiaries (hereinafter referred to as the “Group”). The Group’s fields of activity are: banking through Banca Transilvania S.A (the “Bank”), leasing and consumer loans through BT Leasing Transilvania IFN S.A., BT Operaţional Leasing S.A., BT Direct IFN S.A. şi BT Leasing MD S.R.L., SME loans via BT Microfinantare IFN SA, asset management through BT Asset Management S.A.I S.A. Likewise, the Bank controls 4 investment funds which it also consolidates using the global consolidation method.
The Bank carries out its banking activity through its head office located in Cluj-Napoca and 54 branches, of which one is in Italy, 452 agencies, of which one is in Italy, 26 work units, 7 healthcare division units, 2 private banking agencies in Romania and Italy and 1 regional office located in Bucharest (31 December 2016: 447 agencies, 33 work units, 7 healthcare division units and 2 private banking units in Romania and Italy and a regional center located in Bucharest).
In 2013 the Bank opened a branch in Italy, which began its operational activity in 2014.
The Group’s number of active employees as at 30 June 2017 was 7,826 (31 December 2016: 7,573 employees).
The Bank’s number of active employees as at 30 June 2017 was 7,218 (31 December 2016: 7,014 employees).
The registered address of the Bank is 8 George Bariţiu Street, Cluj-Napoca, Romania.
The Bank’s shareholding structure is:
30 June 2017 31 December 2016 European Bank for Reconstruction and Development (“EBRD”) 8.60% 8.60% Romanian individuals 17.24% 16.97% Romanian companies 29.25% 29.32% Foreign individuals 1.84% 1.82% Foreign companies 43.07% 43.29%
Total 100% 100%
The Bank’s shares are listed on the Bucharest Stock Exchange and are traded under the symbol TLV.
Banca Transilvania S.A.
The explanatory notes to the financial statements pages 10 to 57 are an integral part of these financial statements.
11
Notes to the Condensed Consolidated and Individual Interim Financial Statements
1. Reporting entity and basis of preparation (continued)
b) Declaration of conformity
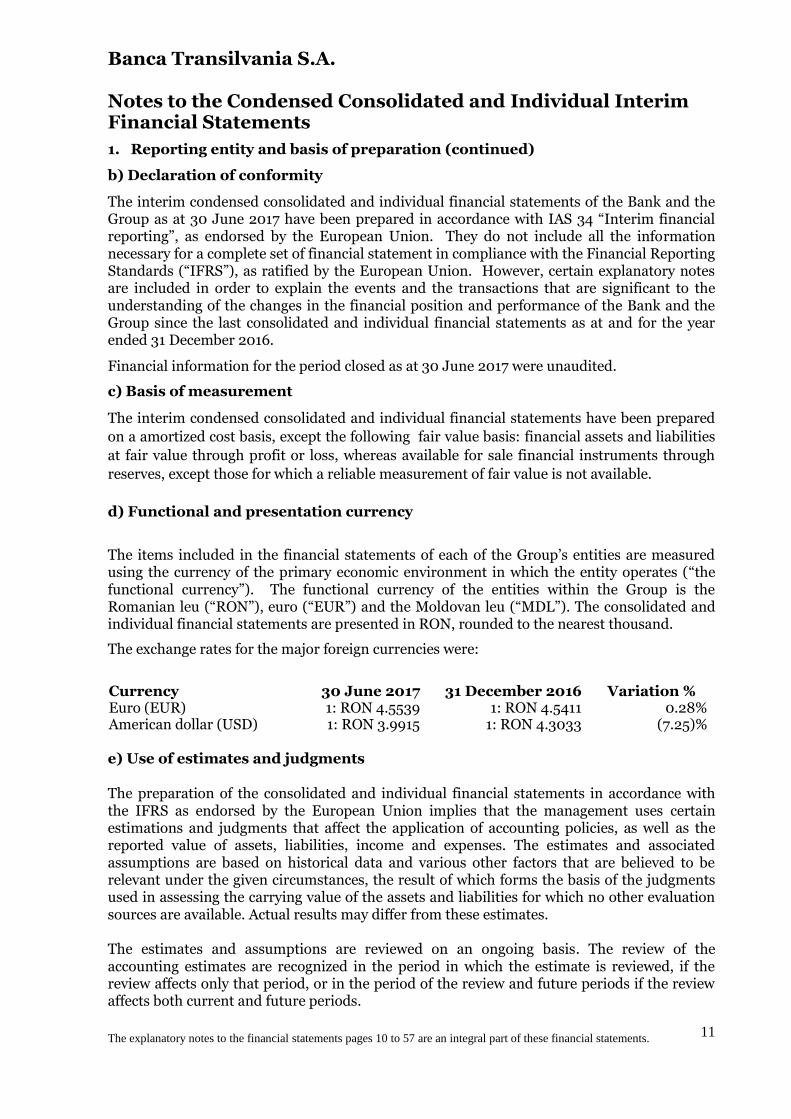
The interim condensed consolidated and individual financial statements of the Bank and the Group as at 30 June 2017 have been prepared in accordance with IAS 34 “Interim financial reporting”, as endorsed by the European Union. They do not include all the information necessary for a complete set of financial statement in compliance with the Financial Reporting Standards (“IFRS”), as ratified by the European Union. However, certain explanatory notes are included in order to explain the events and the transactions that are significant to the understanding of the changes in the financial position and performance of the Bank and the Group since the last consolidated and individual financial statements as at and for the year ended 31 December 2016.
Financial information for the period closed as at 30 June 2017 were unaudited.
c) Basis of measurement
The interim condensed consolidated and individual financial statements have been prepared
on a amortized cost basis, except the following fair value basis: financial assets and liabilities
at fair value through profit or loss, whereas available for sale financial instruments through
reserves, except those for which a reliable measurement of fair value is not available.
d) Functional and presentation currency
The items included in the financial statements of each of the Group’s entities are measured using the currency of the primary economic environment in which the entity operates (“the functional currency”). The functional currency of the entities within the Group is the Romanian leu (“RON”), euro (“EUR”) and the Moldovan leu (“MDL”). The consolidated and individual financial statements are presented in RON, rounded to the nearest thousand.
The exchange rates for the major foreign currencies were:
e) Use of estimates and judgments The preparation of the consolidated and individual financial statements in accordance with the IFRS as endorsed by the European Union implies that the management uses certain estimations and judgments that affect the application of accounting policies, as well as the reported value of assets, liabilities, income and expenses. The estimates and associated assumptions are based on historical data and various other factors that are believed to be relevant under the given circumstances, the result of which forms the basis of the judgments used in assessing the carrying value of the assets and liabilities for which no other evaluation sources are available. Actual results may differ from these estimates. The estimates and assumptions are reviewed on an ongoing basis. The review of the accounting estimates are recognized in the period in which the estimate is reviewed, if the review affects only that period, or in the period of the review and future periods if the review affects both current and future periods.
Currency 30 June 2017 31 December 2016 Variation % Euro (EUR) 1: RON 4.5539 1: RON 4.5411 0.28% American dollar (USD) 1: RON 3.9915 1: RON 4.3033 (7.25)%

Banca Transilvania S.A.
The explanatory notes to the financial statements pages 10 to 57 are an integral part of these financial statements.
12
Notes to the Condensed Consolidated and Individual Interim Financial Statements
1. Reporting entity and basis of preparation (continued)
e) Use of estimates and judgments (continued) Deed in Payment Law 77/2016 regarding datum in solutum ("DIS" / Romanian "DIP") of certain residential real estate properties which debtors having mortgage loans collateralised by these assets may give them to the financing banks and the loans are to be considered closed irrespective if the fair value (or subsequentl price of sold property) covers the existing gross exposure or not was adopted and is in force. The Law entered in force from 13 May 2016. DIP is applicable only to natural persons, residential real estate mortgages under EUR 250,000. The Law is applicable for both active, ongoing loan contracts but also for future loans to be originated.The Law was claimed by various banks as being non-Constitutional and was analyzed by CCR (Constitutional Court of Romania). As such, the debtor could close the loan by passing the mortgaged asset only if hardship is demonstrated. CCR provided its view on 25 October 2016. Hardship is defined by art. 1271 from the New Civil Code - if respecting the provision of a contract became excessively onerous due to exceptional changes which would make clearly unfair to oblidge the debtor to comply to contracts' provisions. Merely the fall in value of the real estate properties or the increase in foreign currency rate for foreign currency denominated loans does not demonstrate by default hardship. The decision regarding the hardship may only be judged in Court. Approach of the Bank The Bank calculated specific provisions for all clients that requested the application of DIP. The rest of the population for which the provisions of the law might be applicable was collectively assessed by the Bank. The management made judgements to assess the required level of provision. The judgements concern the population for which the “hardship” may apply and the probability of default for them. In estimating the population the Bank analyzed the loan to value (“LTV”) of the loans and behavioral aspects related to mortgage loan population. The PD’s were constructed based on LTV thresholds and by extrapolating past behavior. In estimating the PD parameters, the Bank took into consideration various thresholds of LTV and extrapolated the historical behavior of the loan portfolio. Anticipated individual fiscal solution (“SFIA”) During 2016, the Bank also requested the Romanian Fiscal Authorities an official fiscal solution for the fiscal treatment of bargain gain (“SFIA”). As at 30 June 2017, the Bank has one case pending before the Court, challenging the position of the tax authorities regarding the individual tax treatment of the bargain gain. Based on the Bank’s management current expectations the litigation could take between 1 to 3-5 years to settle. The management of the Bank considers that it has strong arguments to win the litigation on the legal merits based on the arguments presented above. However, this is an uncertain tax position and in the scenario in which the Bank will unfortunately lose its challenge to the fiscal authorities (the Court case), it will have to consider the bargain gain as taxable income and settle associated fines and penalties (if any).
Banca Transilvania S.A.
The explanatory notes to the financial statements pages 10 to 57 are an integral part of these financial statements.
13
Notes to the Condensed Consolidated and Individual Interim Financial Statements
2. Significant accounting policies
The methods and accounting policies applied by the Bank and the Group entities in these interim condensed consolidated and individual financial statements are the ones applied in the consolidated and individual financial statements as at and for the period ended 31 December 2016.
As compared to the standards presented in the consolidated and individual financial statements as at 31 December 2016 applicable as of 2017 or later, on 7 June 2017 IFRIC 23 "Uncertainty over Income Tax Treatments" was issued, being effective for annual periods beginning on or after 1 January 2019; the provisions therein are summarized as follows:
IAS 12 specifies how to account for current and deferred tax, but not how to reflect the effects of uncertainty. The interpretation clarifies how to apply the recognition and measurement requirements in IAS 12 when there is uncertainty over income tax treatments.
An entity should determine whether to consider each uncertain tax treatment separately or together with one or more other uncertain tax treatments based on which approach better predicts the resolution of the uncertainty. An entity should assume that a taxation authority will examine amounts it has a right to examine and have full knowledge of all related information when making those examinations. If an entity concludes it is not probable that the taxation authority will accept an uncertain tax treatment, the effect of uncertainty will be reflected in determining the related taxable profit or loss, tax bases, unused tax losses, unused tax credits or tax rates, by using either the most likely amount or the expected value, depending on which method the entity expects to better predict the resolution of the uncertainty.
An entity will reflect the effect of a change in facts and circumstances or of new information that affects the judgments or estimates required by the interpretation as a change in accounting estimate. Examples of changes in facts and circumstances or new information that can result in the reassessment of a judgment or estimate include, but are not limited to, examinations or actions by a taxation authority, changes in rules established by a taxation authority or the expiry of a taxation authority's right to examine or re-examine a tax treatment. The absence of agreement or disagreement by a taxation authority with a tax treatment, in isolation, is unlikely to constitute a change in facts and circumstances or new information that affects the judgments and estimates required by the Interpretation.
The Group is currently assessing the impact of the amendments on its financial statements. These amendments have not been endorsed by the European Union, yet.
Taxes on income in the interim periods are accrued using the tax rate that would be applicable to expected total annual profit or loss.
Banca Transilvania S.A.
The explanatory notes to the financial statements pages 10 to 57 are an integral part of these financial statements.
14
Banca Transilvania S.A.
The explanatory notes to the financial statements pages 10 to 57 are an integral part of these financial statements.
15
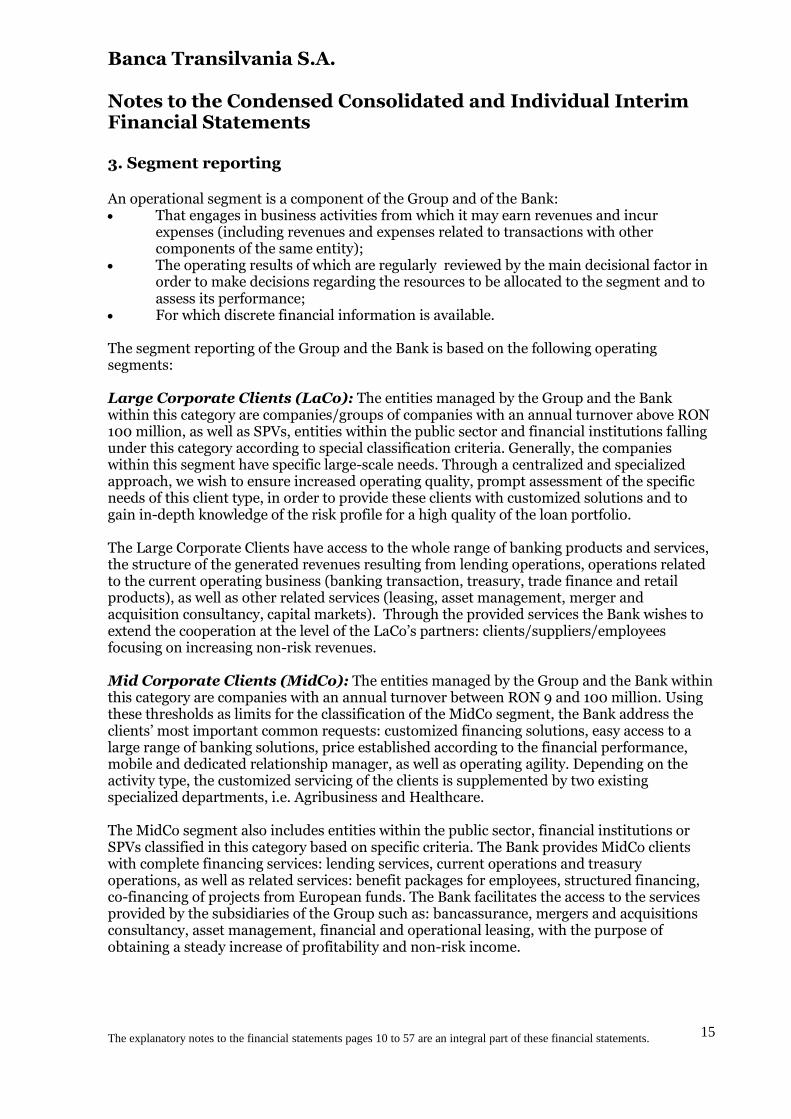
Notes to the Condensed Consolidated and Individual Interim Financial Statements 3. Segment reporting An operational segment is a component of the Group and of the Bank: That engages in business activities from which it may earn revenues and incur
expenses (including revenues and expenses related to transactions with other components of the same entity);
The operating results of which are regularly reviewed by the main decisional factor in order to make decisions regarding the resources to be allocated to the segment and to assess its performance;
For which discrete financial information is available. The segment reporting of the Group and the Bank is based on the following operating segments: Large Corporate Clients (LaCo): The entities managed by the Group and the Bank within this category are companies/groups of companies with an annual turnover above RON 100 million, as well as SPVs, entities within the public sector and financial institutions falling under this category according to special classification criteria. Generally, the companies within this segment have specific large-scale needs. Through a centralized and specialized approach, we wish to ensure increased operating quality, prompt assessment of the specific needs of this client type, in order to provide these clients with customized solutions and to gain in-depth knowledge of the risk profile for a high quality of the loan portfolio. The Large Corporate Clients have access to the whole range of banking products and services, the structure of the generated revenues resulting from lending operations, operations related to the current operating business (banking transaction, treasury, trade finance and retail products), as well as other related services (leasing, asset management, merger and acquisition consultancy, capital markets). Through the provided services the Bank wishes to extend the cooperation at the level of the LaCo’s partners: clients/suppliers/employees focusing on increasing non-risk revenues. Mid Corporate Clients (MidCo): The entities managed by the Group and the Bank within this category are companies with an annual turnover between RON 9 and 100 million. Using these thresholds as limits for the classification of the MidCo segment, the Bank address the clients’ most important common requests: customized financing solutions, easy access to a large range of banking solutions, price established according to the financial performance, mobile and dedicated relationship manager, as well as operating agility. Depending on the activity type, the customized servicing of the clients is supplemented by two existing specialized departments, i.e. Agribusiness and Healthcare. The MidCo segment also includes entities within the public sector, financial institutions or SPVs classified in this category based on specific criteria. The Bank provides MidCo clients with complete financing services: lending services, current operations and treasury operations, as well as related services: benefit packages for employees, structured financing, co-financing of projects from European funds. The Bank facilitates the access to the services provided by the subsidiaries of the Group such as: bancassurance, mergers and acquisitions consultancy, asset management, financial and operational leasing, with the purpose of obtaining a steady increase of profitability and non-risk income.
Banca Transilvania S.A.
The explanatory notes to the financial statements pages 10 to 57 are an integral part of these financial statements.
16
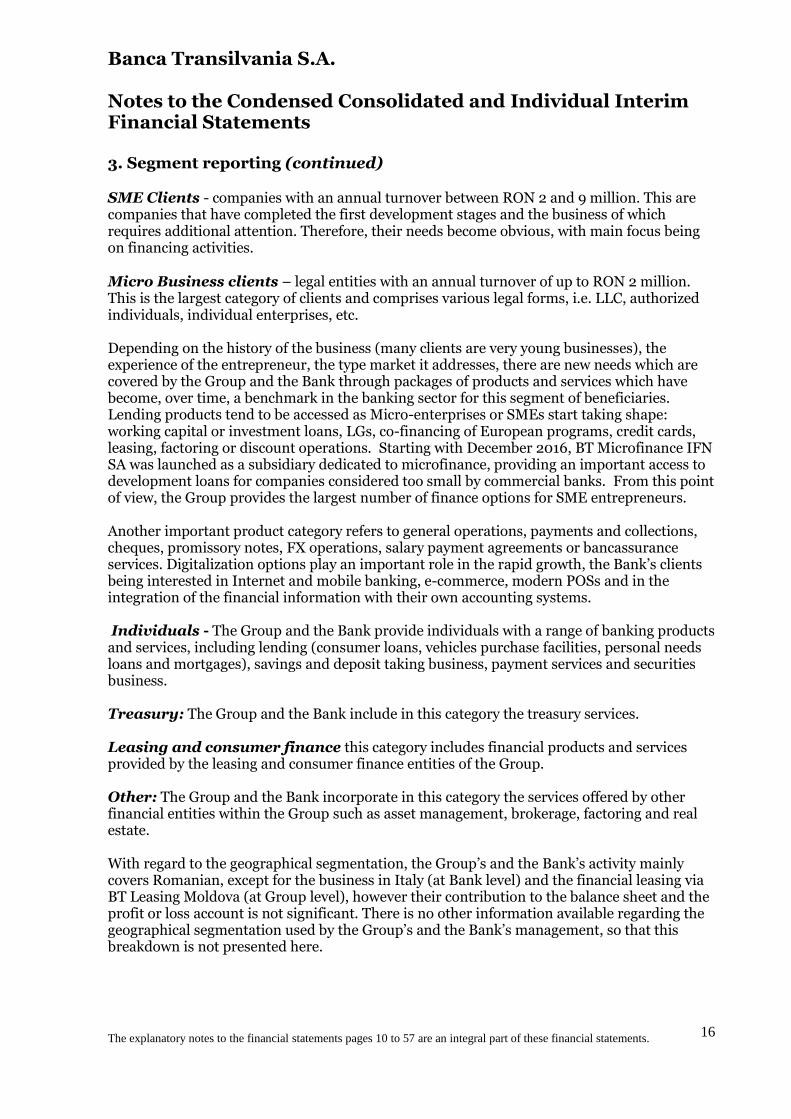
Notes to the Condensed Consolidated and Individual Interim Financial Statements 3. Segment reporting (continued) SME Clients - companies with an annual turnover between RON 2 and 9 million. This are companies that have completed the first development stages and the business of which requires additional attention. Therefore, their needs become obvious, with main focus being on financing activities. Micro Business clients – legal entities with an annual turnover of up to RON 2 million. This is the largest category of clients and comprises various legal forms, i.e. LLC, authorized individuals, individual enterprises, etc. Depending on the history of the business (many clients are very young businesses), the experience of the entrepreneur, the type market it addresses, there are new needs which are covered by the Group and the Bank through packages of products and services which have become, over time, a benchmark in the banking sector for this segment of beneficiaries. Lending products tend to be accessed as Micro-enterprises or SMEs start taking shape: working capital or investment loans, LGs, co-financing of European programs, credit cards, leasing, factoring or discount operations. Starting with December 2016, BT Microfinance IFN SA was launched as a subsidiary dedicated to microfinance, providing an important access to development loans for companies considered too small by commercial banks. From this point of view, the Group provides the largest number of finance options for SME entrepreneurs. Another important product category refers to general operations, payments and collections, cheques, promissory notes, FX operations, salary payment agreements or bancassurance services. Digitalization options play an important role in the rapid growth, the Bank’s clients being interested in Internet and mobile banking, e-commerce, modern POSs and in the integration of the financial information with their own accounting systems. Individuals - The Group and the Bank provide individuals with a range of banking products and services, including lending (consumer loans, vehicles purchase facilities, personal needs loans and mortgages), savings and deposit taking business, payment services and securities business. Treasury: The Group and the Bank include in this category the treasury services. Leasing and consumer finance this category includes financial products and services provided by the leasing and consumer finance entities of the Group. Other: The Group and the Bank incorporate in this category the services offered by other financial entities within the Group such as asset management, brokerage, factoring and real estate. With regard to the geographical segmentation, the Group’s and the Bank’s activity mainly covers Romanian, except for the business in Italy (at Bank level) and the financial leasing via BT Leasing Moldova (at Group level), however their contribution to the balance sheet and the profit or loss account is not significant. There is no other information available regarding the geographical segmentation used by the Group’s and the Bank’s management, so that this breakdown is not presented here.

Banca Transilvania S.A.
The explanatory notes to the financial statements pages 10 to 57 are an integral part of these financial statements.
17
Notes to the Condensed Consolidated and Individual Interim Financial Statements
3. Segment reporting (continued)
The tables below present the financial information per segments in the consolidated statement of financial position and the operational result before net expenses with the impairment allowance for loans and advances to customers:
Business segments as at 30 June 2017
In RON thousand
Large Corporate
Medium Corporate
SME Micro Retail
Banking Treasury
Leasing and
consumer loans
Others Eliminations
and adjustments
Total
GROUP 30 June 2017
Gross loans 5,456,985 5,523,342 1,450,809 2,626,370 15,759,996 - 876,665 13,878 (915,150) 30,792,895
Provisions (775,287) (409,221) (54,330) (105,447) (651,484) - (78,658) (59) 4,953 (2,069,533)
Loans net of provisions 4,681,698 5,114,121 1,396,479 2,520,923 15,108,512 - 798,007 13,819 (910,197) 28,723,362 Portfolio Debt instruments and Equity instruments net of provisions - - - - - 15.024.306 - 165.397 (184.117) 15.005.586 Treasury and inter-bank operations - - - 23,603 - 8,269,943 39,094 180,164 (182,274) 8,330,530
Intangible assets 57,272 72,729 31,249 62,797 260,941 17,913 158,521 70,479 (1,047) 730,854
Other assets 122,388 125,800 33,120 58,424 360,143 - 34,774 63,378 (190,739) 607,288
Total assets 4,861,358 5,312,650 1,460,848 2,665,747 15,729,596 23,312,162 1,030,396 493,237 (1,468,374) 53,397,620 Deposits from customers 4,406,286 4,905,187 1,254,575 4,944,365 28,020,046 181,001 268 1,991 (180,985) 43,532,734 Loans from banks and other financial institutions 73.929 277.690 154.440 326.225 8.568 661.382 830.004 46.332 (909.184) 1.469.386 Other subordinated liabilities - - - - - 412,462 - -
412,462
Other liabilities 228,392 234,760 61,806 109,049 672,074 - 31,796 122,272 (13,497) 1,446,652
Total liabilities 4,708,607 5,417,637 1,470,821 5,379,639 28,700,688 1,254,845 862,068 170,595 (1,103,666) 46,861,234
Equity and related items - - - - - - - 6,536,386 - 6,536,386
Total liabilities 4,708,607 5,417,637 1,470,821 5,379,639 28,700,688 1,254,845 862,068 6,706,981 (1,103,666) 53,397,620
Banca Transilvania S.A.
The explanatory notes to the financial statements pages 10 to 57 are an integral part of these financial statements.
18
Notes to the Condensed Consolidated and Individual Interim Financial Statements
3. Segment reporting (continued)
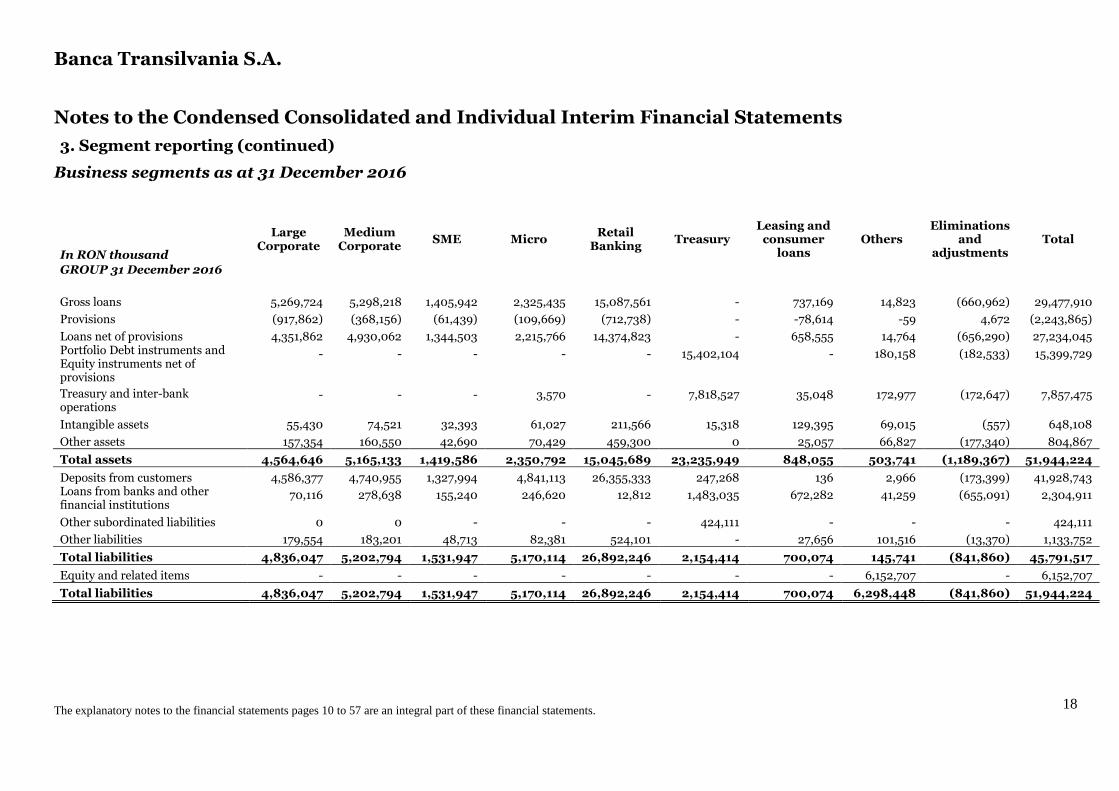
Business segments as at 31 December 2016
In RON thousand
Large Corporate
Medium Corporate
SME Micro Retail
Banking Treasury
Leasing and consumer
loans Others
Eliminations and
adjustments Total
GROUP 31 December 2016
Gross loans 5,269,724 5,298,218 1,405,942 2,325,435 15,087,561 - 737,169 14,823 (660,962) 29,477,910
Provisions (917,862) (368,156) (61,439) (109,669) (712,738) - -78,614 -59 4,672 (2,243,865)
Loans net of provisions 4,351,862 4,930,062 1,344,503 2,215,766 14,374,823 - 658,555 14,764 (656,290) 27,234,045 Portfolio Debt instruments and Equity instruments net of provisions
- - - - - 15,402,104 - 180,158 (182,533) 15,399,729
Treasury and inter-bank operations
- - - 3,570 - 7,818,527 35,048 172,977 (172,647) 7,857,475
Intangible assets 55,430 74,521 32,393 61,027 211,566 15,318 129,395 69,015 (557) 648,108
Other assets 157,354 160,550 42,690 70,429 459,300 0 25,057 66,827 (177,340) 804,867
Total assets 4,564,646 5,165,133 1,419,586 2,350,792 15,045,689 23,235,949 848,055 503,741 (1,189,367) 51,944,224
Deposits from customers 4,586,377 4,740,955 1,327,994 4,841,113 26,355,333 247,268 136 2,966 (173,399) 41,928,743 Loans from banks and other financial institutions
70,116 278,638 155,240 246,620 12,812 1,483,035 672,282 41,259 (655,091) 2,304,911
Other subordinated liabilities 0 0 - - - 424,111 - - - 424,111
Other liabilities 179,554 183,201 48,713 82,381 524,101 - 27,656 101,516 (13,370) 1,133,752
Total liabilities 4,836,047 5,202,794 1,531,947 5,170,114 26,892,246 2,154,414 700,074 145,741 (841,860) 45,791,517
Equity and related items - - - - - - - 6,152,707 - 6,152,707
Total liabilities 4,836,047 5,202,794 1,531,947 5,170,114 26,892,246 2,154,414 700,074 6,298,448 (841,860) 51,944,224
Banca Transilvania S.A.
The explanatory notes to the financial statements pages 10 to 57 are an integral part of these financial statements.
19
Notes to the Condensed Consolidated and Individual Interim Financial Statements
3. Segment reporting (continued)
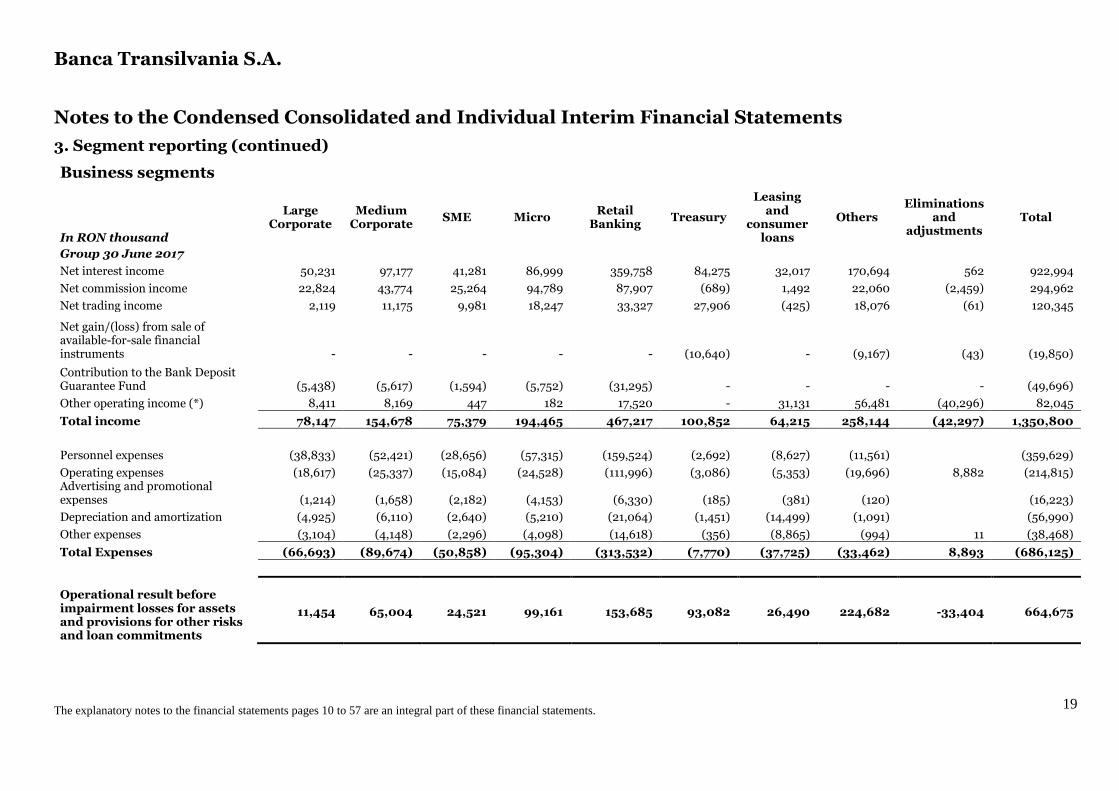
Business segments
In RON thousand
Large Corporate
Medium Corporate
SME Micro Retail
Banking Treasury
Leasing and
consumer loans
Others Eliminations
and adjustments
Total
Group 30 June 2017 Net interest income 50,231 97,177 41,281 86,999 359,758 84,275 32,017 170,694 562 922,994
Net commission income 22,824 43,774 25,264 94,789 87,907 (689) 1,492 22,060 (2,459) 294,962
Net trading income 2,119 11,175 9,981 18,247 33,327 27,906 (425) 18,076 (61) 120,345
Net gain/(loss) from sale of available-for-sale financial instruments - - - - - (10,640) - (9,167) (43) (19,850)
Contribution to the Bank Deposit Guarantee Fund (5,438) (5,617) (1,594) (5,752) (31,295) - - - - (49,696)
Other operating income (*) 8,411 8,169 447 182 17,520 - 31,131 56,481 (40,296) 82,045
Total income 78,147 154,678 75,379 194,465 467,217 100,852 64,215 258,144 (42,297) 1,350,800
Personnel expenses (38,833) (52,421) (28,656) (57,315) (159,524) (2,692) (8,627) (11,561)
(359,629)
Operating expenses (18,617) (25,337) (15,084) (24,528) (111,996) (3,086) (5,353) (19,696) 8,882 (214,815) Advertising and promotional expenses (1,214) (1,658) (2,182) (4,153) (6,330) (185) (381) (120)
(16,223)
Depreciation and amortization (4,925) (6,110) (2,640) (5,210) (21,064) (1,451) (14,499) (1,091)
(56,990)
Other expenses (3,104) (4,148) (2,296) (4,098) (14,618) (356) (8,865) (994) 11 (38,468)
Total Expenses (66,693) (89,674) (50,858) (95,304) (313,532) (7,770) (37,725) (33,462) 8,893 (686,125)
Operational result before impairment losses for assets and provisions for other risks and loan commitments
11,454 65,004 24,521 99,161 153,685 93,082 26,490 224,682 -33,404 664,675
Banca Transilvania S.A.
The explanatory notes to the financial statements pages 10 to 57 are an integral part of these financial statements.
20
Notes to the Condensed Consolidated and Individual Interim Financial Statements
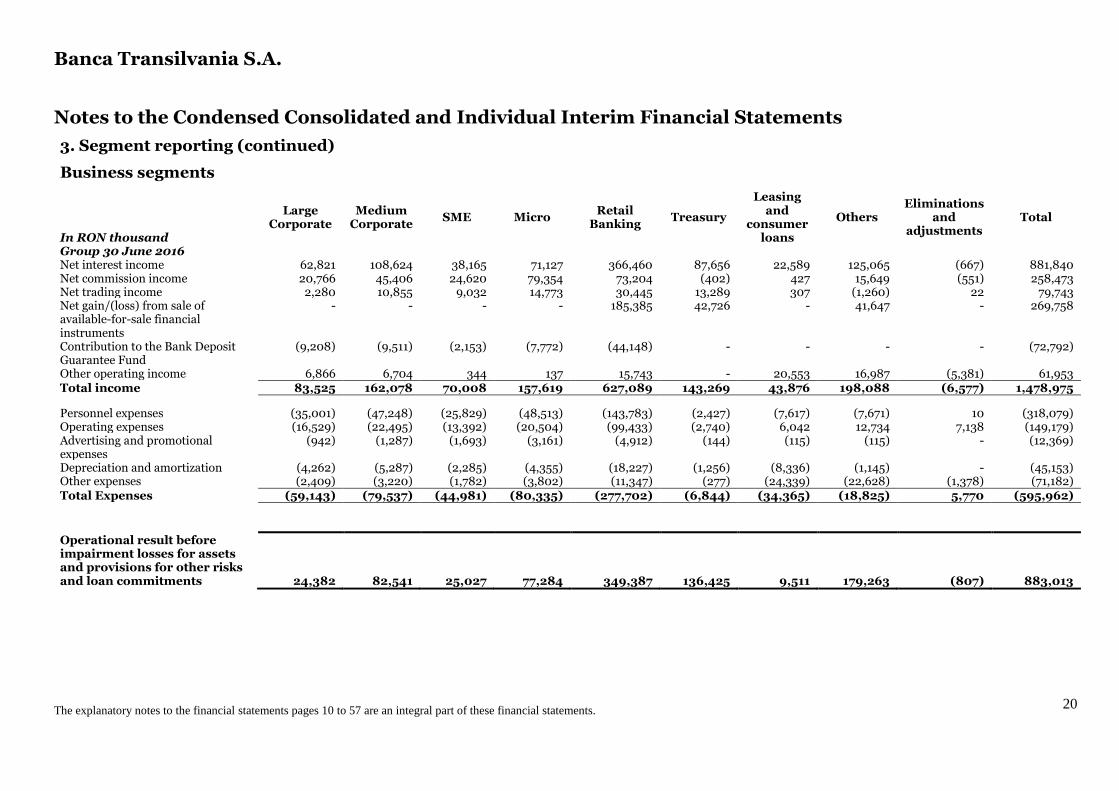
3. Segment reporting (continued)
Business segments
In RON thousand
Large Corporate
Medium Corporate
SME Micro Retail
Banking Treasury
Leasing and
consumer loans
Others Eliminations
and adjustments
Total
Group 30 June 2016 Net interest income 62,821 108,624 38,165 71,127 366,460 87,656 22,589 125,065 (667) 881,840
Net commission income 20,766 45,406 24,620 79,354 73,204 (402) 427 15,649 (551) 258,473 Net trading income 2,280 10,855 9,032 14,773 30,445 13,289 307 (1,260) 22 79,743 Net gain/(loss) from sale of available-for-sale financial instruments
- - - - 185,385 42,726 - 41,647 - 269,758
Contribution to the Bank Deposit Guarantee Fund
(9,208) (9,511) (2,153) (7,772) (44,148) - - - - (72,792)
Other operating income 6,866 6,704 344 137 15,743 - 20,553 16,987 (5,381) 61,953 Total income 83,525 162,078 70,008 157,619 627,089 143,269 43,876 198,088 (6,577) 1,478,975
Personnel expenses (35,001) (47,248) (25,829) (48,513) (143,783) (2,427) (7,617) (7,671) 10 (318,079) Operating expenses (16,529) (22,495) (13,392) (20,504) (99,433) (2,740) 6,042 12,734 7,138 (149,179) Advertising and promotional expenses
(942) (1,287) (1,693) (3,161) (4,912) (144) (115) (115) - (12,369)
Depreciation and amortization (4,262) (5,287) (2,285) (4,355) (18,227) (1,256) (8,336) (1,145) - (45,153) Other expenses (2,409) (3,220) (1,782) (3,802) (11,347) (277) (24,339) (22,628) (1,378) (71,182) Total Expenses (59,143) (79,537) (44,981) (80,335) (277,702) (6,844) (34,365) (18,825) 5,770 (595,962)
Operational result before impairment losses for assets and provisions for other risks and loan commitments 24,382 82,541 25,027 77,284 349,387 136,425 9,511 179,263 (807) 883,013
Banca Transilvania S.A.
The explanatory notes to the financial statements pages 10 to 57 are an integral part of these financial statements.
21
Notes to the Condensed Consolidated and Individual Interim Financial Statements
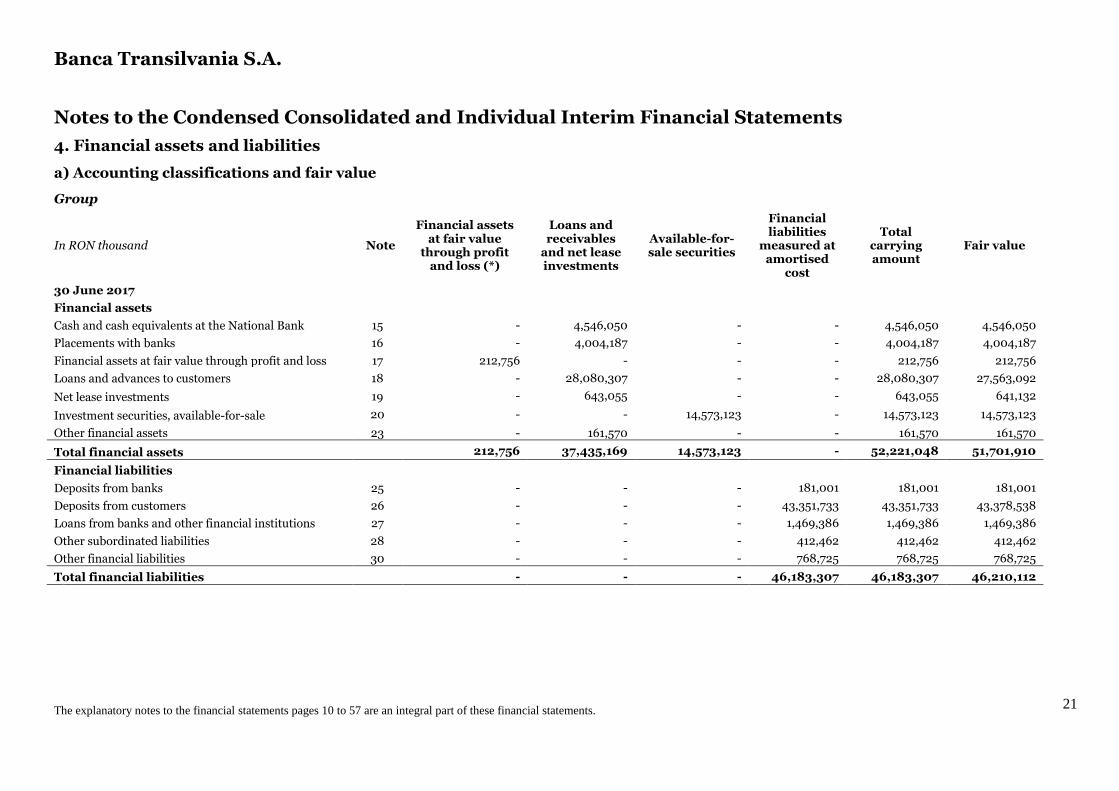
4. Financial assets and liabilities
a) Accounting classifications and fair value
Group
In RON thousand Note
Financial assets at fair value
through profit and loss (*)
Loans and receivables
and net lease investments
Available-for-sale securities
Financial liabilities
measured at amortised
cost
Total carrying amount
Fair value
30 June 2017
Financial assets
Cash and cash equivalents at the National Bank 15 - 4,546,050 - - 4,546,050 4,546,050
Placements with banks 16 - 4,004,187 - - 4,004,187 4,004,187
Financial assets at fair value through profit and loss 17 212,756 - - - 212,756 212,756
Loans and advances to customers 18 - 28,080,307 - - 28,080,307 27,563,092
Net lease investments 19 - 643,055 - - 643,055 641,132
Investment securities, available-for-sale 20 - - 14,573,123 - 14,573,123 14,573,123
Other financial assets 23 - 161,570 - - 161,570 161,570
Total financial assets 212,756 37,435,169 14,573,123 - 52,221,048 51,701,910
Financial liabilities
Deposits from banks 25 - - - 181,001 181,001 181,001
Deposits from customers 26 - - - 43,351,733 43,351,733 43,378,538
Loans from banks and other financial institutions 27 - - - 1,469,386 1,469,386 1,469,386
Other subordinated liabilities 28 - - - 412,462 412,462 412,462
Other financial liabilities 30 - - - 768,725 768,725 768,725
Total financial liabilities - - - 46,183,307 46,183,307 46,210,112
Banca Transilvania S.A.
The explanatory notes to the financial statements pages 10 to 57 are an integral part of these financial statements.
22
Notes to the Condensed Consolidated and Individual Interim Financial Statements
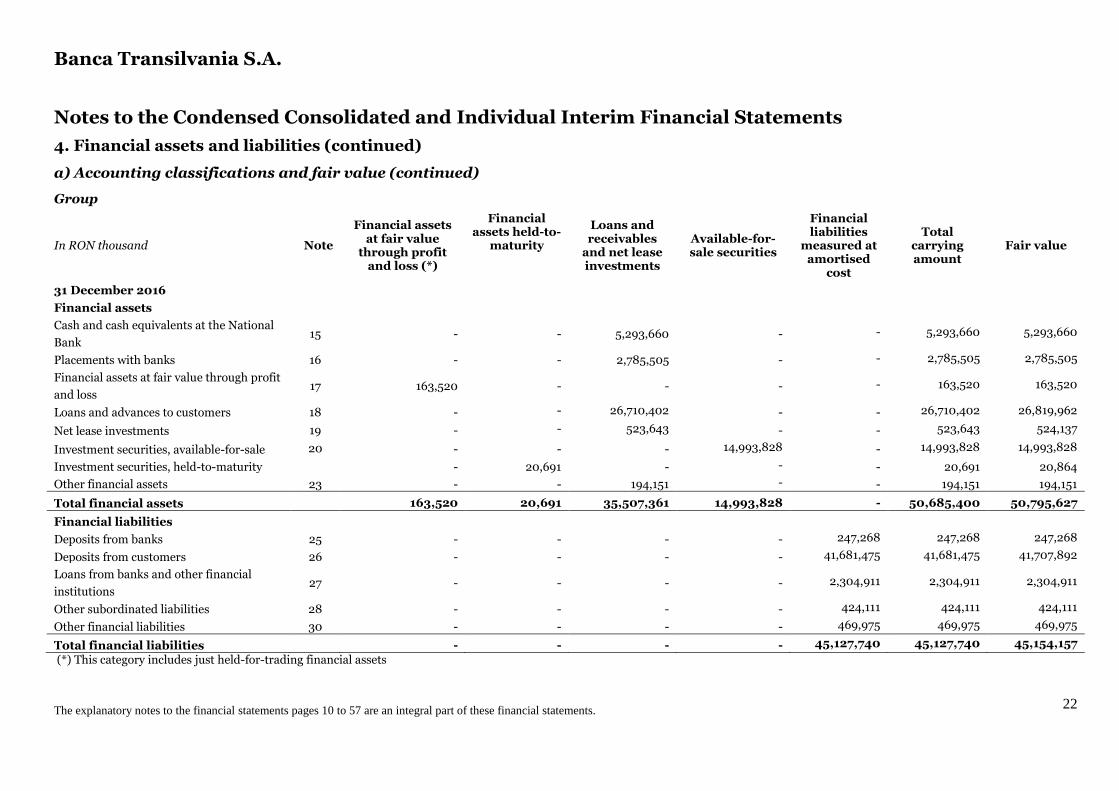
4. Financial assets and liabilities (continued)
a) Accounting classifications and fair value (continued)
Group
In RON thousand Note
Financial assets at fair value
through profit and loss (*)
Financial assets held-to-
maturity
Loans and receivables
and net lease investments
Available-for-sale securities
Financial liabilities
measured at amortised
cost
Total carrying amount
Fair value
31 December 2016
Financial assets
Cash and cash equivalents at the National
Bank 15 - - 5,293,660 - - 5,293,660 5,293,660
Placements with banks 16 - - 2,785,505 - - 2,785,505 2,785,505
Financial assets at fair value through profit
and loss 17 163,520 - - - - 163,520 163,520
Loans and advances to customers 18 - - 26,710,402 - - 26,710,402 26,819,962
Net lease investments 19 - - 523,643 - - 523,643 524,137
Investment securities, available-for-sale 20 - - - 14,993,828 - 14,993,828 14,993,828
Investment securities, held-to-maturity - 20,691 - - - 20,691 20,864
Other financial assets 23 - - 194,151 - - 194,151 194,151
Total financial assets 163,520 20,691 35,507,361 14,993,828 - 50,685,400 50,795,627
Financial liabilities
Deposits from banks 25 - - - - 247,268 247,268 247,268
Deposits from customers 26 - - - - 41,681,475 41,681,475 41,707,892
Loans from banks and other financial
institutions 27 - - - - 2,304,911 2,304,911 2,304,911
Other subordinated liabilities 28 - - - - 424,111 424,111 424,111
Other financial liabilities 30 - - - - 469,975 469,975 469,975
Total financial liabilities - - - - 45,127,740 45,127,740 45,154,157
(*) This category includes just held-for-trading financial assets
Banca Transilvania S.A.
The explanatory notes to the financial statements pages 10 to 57 are an integral part of these financial statements.
23
Notes to the Condensed Consolidated and Individual Interim Financial Statements
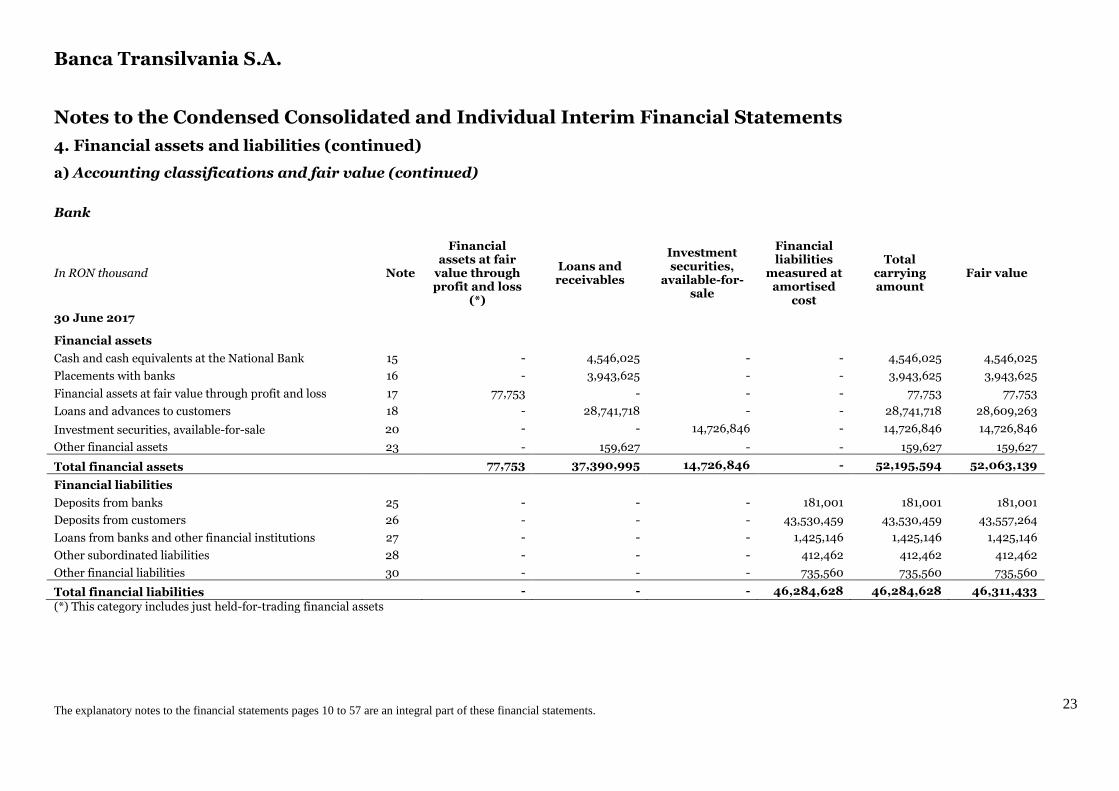
4. Financial assets and liabilities (continued)
a) Accounting classifications and fair value (continued)
Bank
In RON thousand Note
Financial assets at fair
value through profit and loss
(*)
Loans and receivables
Investment securities,
available-for-sale
Financial liabilities
measured at amortised
cost
Total carrying amount
Fair value
30 June 2017
Financial assets
Cash and cash equivalents at the National Bank 15 - 4,546,025 - - 4,546,025 4,546,025
Placements with banks 16 - 3,943,625 - - 3,943,625 3,943,625
Financial assets at fair value through profit and loss 17 77,753 - - - 77,753 77,753
Loans and advances to customers 18 - 28,741,718 - - 28,741,718 28,609,263
Investment securities, available-for-sale 20 - - 14,726,846 - 14,726,846 14,726,846
Other financial assets 23 - 159,627 - - 159,627 159,627
Total financial assets 77,753 37,390,995 14,726,846 - 52,195,594 52,063,139
Financial liabilities
Deposits from banks 25 - - - 181,001 181,001 181,001
Deposits from customers 26 - - - 43,530,459 43,530,459 43,557,264
Loans from banks and other financial institutions 27 - - - 1,425,146 1,425,146 1,425,146
Other subordinated liabilities 28 - - - 412,462 412,462 412,462
Other financial liabilities 30 - - - 735,560 735,560 735,560
Total financial liabilities - - - 46,284,628 46,284,628 46,311,433
(*) This category includes just held-for-trading financial assets
Banca Transilvania S.A.
The explanatory notes to the financial statements pages 10 to 57 are an integral part of these financial statements.
24
Notes to the Condensed Consolidated and Individual Interim Financial Statements
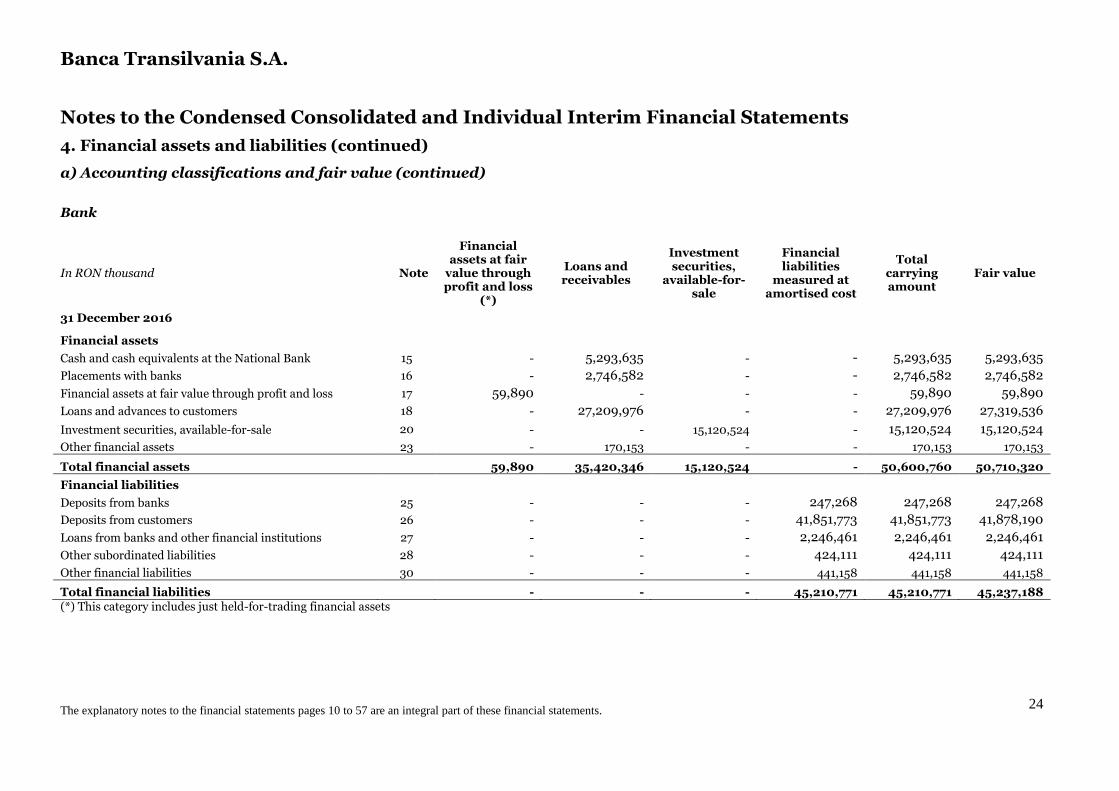
4. Financial assets and liabilities (continued)
a) Accounting classifications and fair value (continued)
Bank
In RON thousand Note
Financial assets at fair
value through profit and loss
(*)
Loans and receivables
Investment securities,
available-for-sale
Financial liabilities
measured at amortised cost
Total carrying amount
Fair value
31 December 2016
Financial assets
Cash and cash equivalents at the National Bank 15 - 5,293,635 - - 5,293,635 5,293,635
Placements with banks 16 - 2,746,582 - - 2,746,582 2,746,582
Financial assets at fair value through profit and loss 17 59,890 - - - 59,890 59,890
Loans and advances to customers 18 - 27,209,976 - - 27,209,976 27,319,536
Investment securities, available-for-sale 20 - - 15,120,524 - 15,120,524 15,120,524
Other financial assets 23 - 170,153 - - 170,153 170,153
Total financial assets 59,890 35,420,346 15,120,524 - 50,600,760 50,710,320
Financial liabilities
Deposits from banks 25 - - - 247,268 247,268 247,268
Deposits from customers 26 - - - 41,851,773 41,851,773 41,878,190
Loans from banks and other financial institutions 27 - - - 2,246,461 2,246,461 2,246,461
Other subordinated liabilities 28 - - - 424,111 424,111 424,111
Other financial liabilities 30 - - - 441,158 441,158 441,158
Total financial liabilities - - - 45,210,771 45,210,771 45,237,188 (*) This category includes just held-for-trading financial assets
Banca Transilvania S.A.
The explanatory notes to the financial statements pages 10 to 57 are an integral part of these financial statements.
25
Notes to the Condensed Consolidated and Individual Interim Financial Statements
4. Financial assets and liabilities (continued)
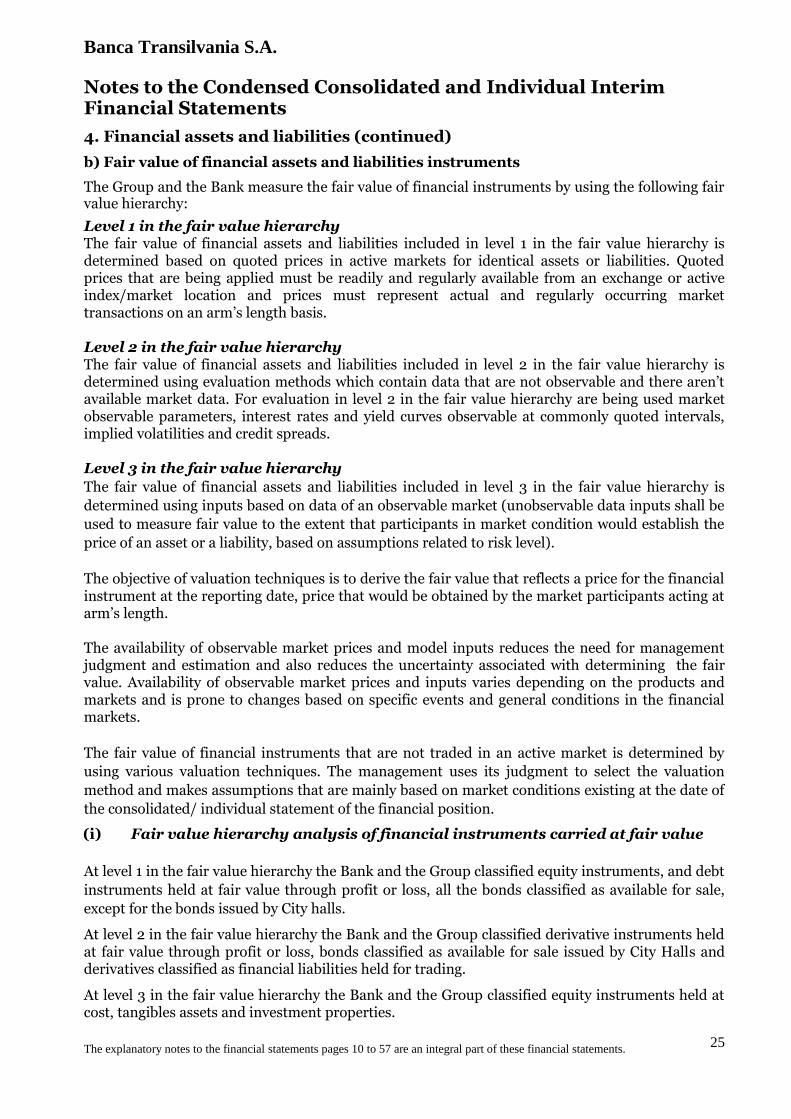
b) Fair value of financial assets and liabilities instruments
The Group and the Bank measure the fair value of financial instruments by using the following fair value hierarchy:
Level 1 in the fair value hierarchy The fair value of financial assets and liabilities included in level 1 in the fair value hierarchy is determined based on quoted prices in active markets for identical assets or liabilities. Quoted prices that are being applied must be readily and regularly available from an exchange or active index/market location and prices must represent actual and regularly occurring market transactions on an arm’s length basis. Level 2 in the fair value hierarchy The fair value of financial assets and liabilities included in level 2 in the fair value hierarchy is determined using evaluation methods which contain data that are not observable and there aren’t available market data. For evaluation in level 2 in the fair value hierarchy are being used market observable parameters, interest rates and yield curves observable at commonly quoted intervals, implied volatilities and credit spreads. Level 3 in the fair value hierarchy
The fair value of financial assets and liabilities included in level 3 in the fair value hierarchy is
determined using inputs based on data of an observable market (unobservable data inputs shall be
used to measure fair value to the extent that participants in market condition would establish the
price of an asset or a liability, based on assumptions related to risk level).
The objective of valuation techniques is to derive the fair value that reflects a price for the financial instrument at the reporting date, price that would be obtained by the market participants acting at arm’s length. The availability of observable market prices and model inputs reduces the need for management judgment and estimation and also reduces the uncertainty associated with determining the fair value. Availability of observable market prices and inputs varies depending on the products and markets and is prone to changes based on specific events and general conditions in the financial markets.
The fair value of financial instruments that are not traded in an active market is determined by
using various valuation techniques. The management uses its judgment to select the valuation
method and makes assumptions that are mainly based on market conditions existing at the date of
the consolidated/ individual statement of the financial position.
(i) Fair value hierarchy analysis of financial instruments carried at fair value
At level 1 in the fair value hierarchy the Bank and the Group classified equity instruments, and debt
instruments held at fair value through profit or loss, all the bonds classified as available for sale,
except for the bonds issued by City halls.
At level 2 in the fair value hierarchy the Bank and the Group classified derivative instruments held at fair value through profit or loss, bonds classified as available for sale issued by City Halls and derivatives classified as financial liabilities held for trading.
At level 3 in the fair value hierarchy the Bank and the Group classified equity instruments held at cost, tangibles assets and investment properties.
Banca Transilvania S.A.
The explanatory notes to the financial statements pages 10 to 57 are an integral part of these financial statements.
26
Notes to the Condensed Consolidated and Individual Interim Financial Statements
4. Financial assets and liabilities (continued)
b) Fair value of financial assets and liabilities instruments (continued)
i) Fair value hierarchy analysis of financial instruments carried at fair value
(continued)
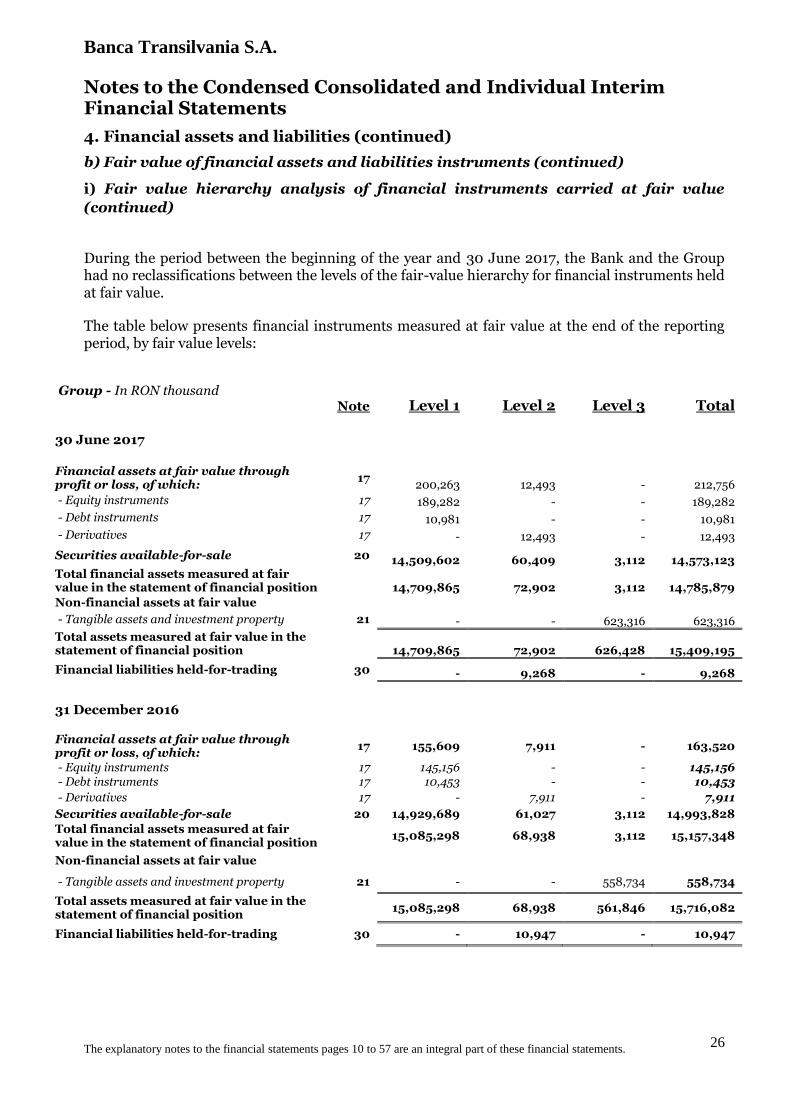
During the period between the beginning of the year and 30 June 2017, the Bank and the Group had no reclassifications between the levels of the fair-value hierarchy for financial instruments held at fair value.
The table below presents financial instruments measured at fair value at the end of the reporting period, by fair value levels:
Group - In RON thousand Note Level 1 Level 2 Level 3 Total
30 June 2017
Financial assets at fair value through profit or loss, of which:
17 200,263 12,493 - 212,756
- Equity instruments 17 189,282 - - 189,282
- Debt instruments 17 10,981 - - 10,981
- Derivatives 17 - 12,493 - 12,493
Securities available-for-sale 20 14,509,602 60,409 3,112 14,573,123 Total financial assets measured at fair value in the statement of financial position
14,709,865 72,902 3,112 14,785,879
Non-financial assets at fair value
- Tangible assets and investment property 21 - - 623,316 623,316
Total assets measured at fair value in the statement of financial position
14,709,865 72,902 626,428 15,409,195
Financial liabilities held-for-trading 30 - 9,268 - 9,268
31 December 2016
Financial assets at fair value through profit or loss, of which:
17 155,609 7,911 - 163,520
- Equity instruments 17 145,156 - - 145,156 - Debt instruments 17 10,453 - - 10,453
- Derivatives 17 - 7,911 - 7,911
Securities available-for-sale 20 14,929,689 61,027 3,112 14,993,828
Total financial assets measured at fair value in the statement of financial position
15,085,298 68,938 3,112 15,157,348
Non-financial assets at fair value
- Tangible assets and investment property 21 - - 558,734 558,734
Total assets measured at fair value in the statement of financial position
15,085,298 68,938 561,846 15,716,082
Financial liabilities held-for-trading 30 - 10,947 - 10,947

Banca Transilvania S.A.
The explanatory notes to the financial statements pages 10 to 57 are an integral part of these financial statements.
27
Notes to the Condensed Consolidated and Individual Interim Financial Statements
4. Financial assets and liabilities (continued)
b) Fair value of financial assets and liabilities instruments (continued)
(i) Fair value hierarchy analysis of financial instruments carried at fair value
(continued)
Bank - In RON thousand Note Level 1 Level 2 Level 3 Total
30 June 2017
Financial assets at fair value through profit or loss, of which: 17 65,260 12,493 - 77,753
- Equity instruments 17 65,260 - - 65,260
- Derivatives 17 12,493 12,493
Securities available-for-sale 20 14,663,346 60,409 3,092 14,726,847 Total financial assets measured at fair value in the statement of financial position
14,728,606 72,902 3,092 14,804,600
Non-financial assets at fair value
- Tangible assets and investment property
21 - - 404,473 404,473
Total assets measured at fair value in the statement of financial position
14,728,606 72,902 407,565 15,209,073
Financial liabilities held-for-trading 30 - 9,268 - 9,268
31 December 2016
Financial assets at fair value through profit or loss, of which: 17
51,979 7,911 - 59,890
- Equity instruments 17 51,979 - - 51,979
- Derivatives 17 - 7,911 - 7,911
Securities available-for-sale 20 15,056,405 61,027 3,092 15,120,524
Total financial assets measured at fair value in the statement of financial position
15,108,384 68,938 3,092 15,180,414
Non-financial assets at fair value
- Tangible assets and investment property
21 - - 370,305 370,305
Total assets measured at fair value in the statement of financial position
15,108,384 68,938 373,397 15,550,719
Financial liabilities held-for-trading 30 - 10,947 - 10,947
Banca Transilvania S.A.
The explanatory notes to the financial statements pages 10 to 57 are an integral part of these financial statements.
28
Notes to the Condensed Consolidated and Individual Interim Financial Statements
4. Financial assets and liabilities (continued)
b) Fair value of financial assets and liabilities instruments (continued)
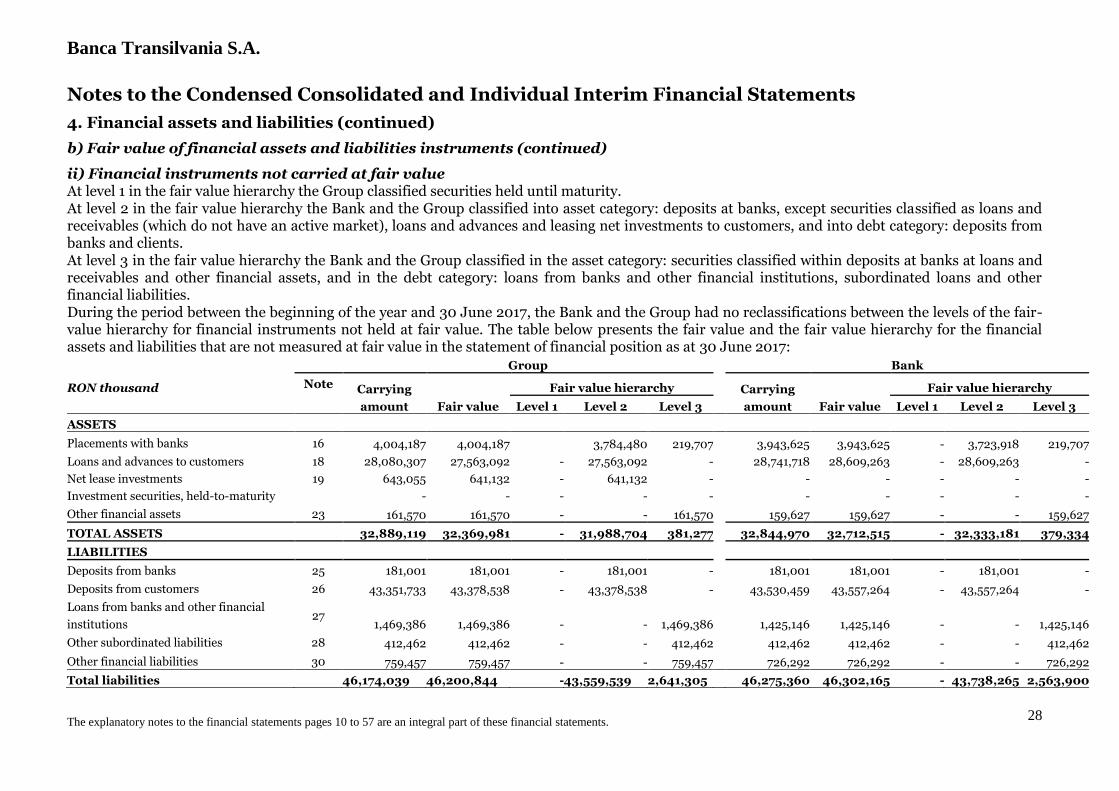
ii) Financial instruments not carried at fair value At level 1 in the fair value hierarchy the Group classified securities held until maturity. At level 2 in the fair value hierarchy the Bank and the Group classified into asset category: deposits at banks, except securities classified as loans and receivables (which do not have an active market), loans and advances and leasing net investments to customers, and into debt category: deposits from banks and clients. At level 3 in the fair value hierarchy the Bank and the Group classified in the asset category: securities classified within deposits at banks at loans and receivables and other financial assets, and in the debt category: loans from banks and other financial institutions, subordinated loans and other financial liabilities. During the period between the beginning of the year and 30 June 2017, the Bank and the Group had no reclassifications between the levels of the fair-value hierarchy for financial instruments not held at fair value. The table below presents the fair value and the fair value hierarchy for the financial assets and liabilities that are not measured at fair value in the statement of financial position as at 30 June 2017:
Group
Bank
RON thousand Note Carrying
amount Fair value
Fair value hierarchy
Carrying
amount Fair value
Fair value hierarchy
Level 1 Level 2 Level 3
Level 1 Level 2 Level 3
ASSETS
Placements with banks 16 4,004,187 4,004,187 3,784,480 219,707
3,943,625 3,943,625 - 3,723,918 219,707
Loans and advances to customers 18 28,080,307 27,563,092 - 27,563,092 - 28,741,718 28,609,263 - 28,609,263 -
Net lease investments 19 643,055 641,132 - 641,132 - - - - - -
Investment securities, held-to-maturity - - - - -
- - - - -
Other financial assets 23 161,570 161,570 - - 161,570 159,627 159,627 - - 159,627
TOTAL ASSETS 32,889,119 32,369,981 - 31,988,704 381,277 32,844,970 32,712,515 - 32,333,181 379,334
LIABILITIES
Deposits from banks 25 181,001 181,001 - 181,001 -
181,001 181,001 - 181,001 -
Deposits from customers 26 43,351,733 43,378,538 - 43,378,538 - 43,530,459 43,557,264 - 43,557,264 -
Loans from banks and other financial
institutions 27
1,469,386 1,469,386 - - 1,469,386
1,425,146 1,425,146 - - 1,425,146
Other subordinated liabilities 28 412,462 412,462 - - 412,462 412,462 412,462 - - 412,462
Other financial liabilities 30 759,457 759,457 - - 759,457 726,292 726,292 - - 726,292
Total liabilities 46,174,039 46,200,844 - 43,559,539 2,641,305 46,275,360 46,302,165 - 43,738,265 2,563,900
Banca Transilvania S.A.
The explanatory notes to the financial statements pages 10 to 57 are an integral part of these financial statements.
29
Notes to the Condensed Consolidated and Individual Interim Financial Statements
4. Financial assets and liabilities (continued)
b) Fair value of financial assets and liabilities instruments (continued)
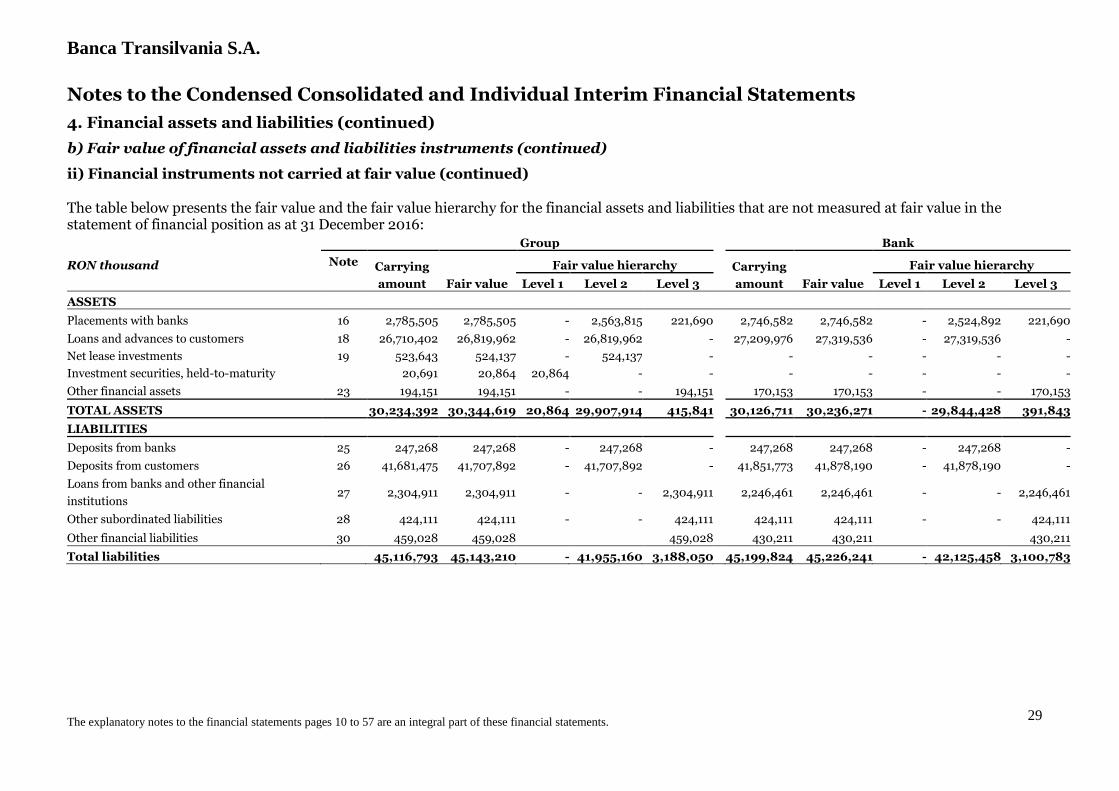
ii) Financial instruments not carried at fair value (continued) The table below presents the fair value and the fair value hierarchy for the financial assets and liabilities that are not measured at fair value in the statement of financial position as at 31 December 2016:
Group
Bank
RON thousand Note Carrying
amount Fair value
Fair value hierarchy
Carrying
amount Fair value
Fair value hierarchy
Level 1 Level 2 Level 3
Level 1 Level 2 Level 3
ASSETS
Placements with banks 16 2,785,505 2,785,505 - 2,563,815 221,690
2,746,582 2,746,582 - 2,524,892 221,690
Loans and advances to customers 18 26,710,402 26,819,962 - 26,819,962 - 27,209,976 27,319,536 - 27,319,536 -
Net lease investments 19 523,643 524,137 - 524,137 - - - - - -
Investment securities, held-to-maturity 20,691 20,864 20,864 - -
- - - - -
Other financial assets 23 194,151 194,151 - - 194,151 170,153 170,153 - - 170,153
TOTAL ASSETS 30,234,392 30,344,619 20,864 29,907,914 415,841 30,126,711 30,236,271 - 29,844,428 391,843
LIABILITIES
Deposits from banks 25 247,268 247,268 - 247,268 -
247,268 247,268 - 247,268 -
Deposits from customers 26 41,681,475 41,707,892 - 41,707,892 - 41,851,773 41,878,190 - 41,878,190 -
Loans from banks and other financial
institutions 27 2,304,911 2,304,911 - - 2,304,911 2,246,461 2,246,461 - - 2,246,461
Other subordinated liabilities 28 424,111 424,111 - - 424,111 424,111 424,111 - - 424,111
Other financial liabilities 30 459,028 459,028 459,028 430,211 430,211 430,211
Total liabilities 45,116,793 45,143,210 - 41,955,160 3,188,050 45,199,824 45,226,241 - 42,125,458 3,100,783
Banca Transilvania S.A.
The explanatory notes to the financial statements pages 10 to 57 are an integral part of these financial statements.
30
Notes to the Condensed Consolidated and Individual Interim Financial Statements
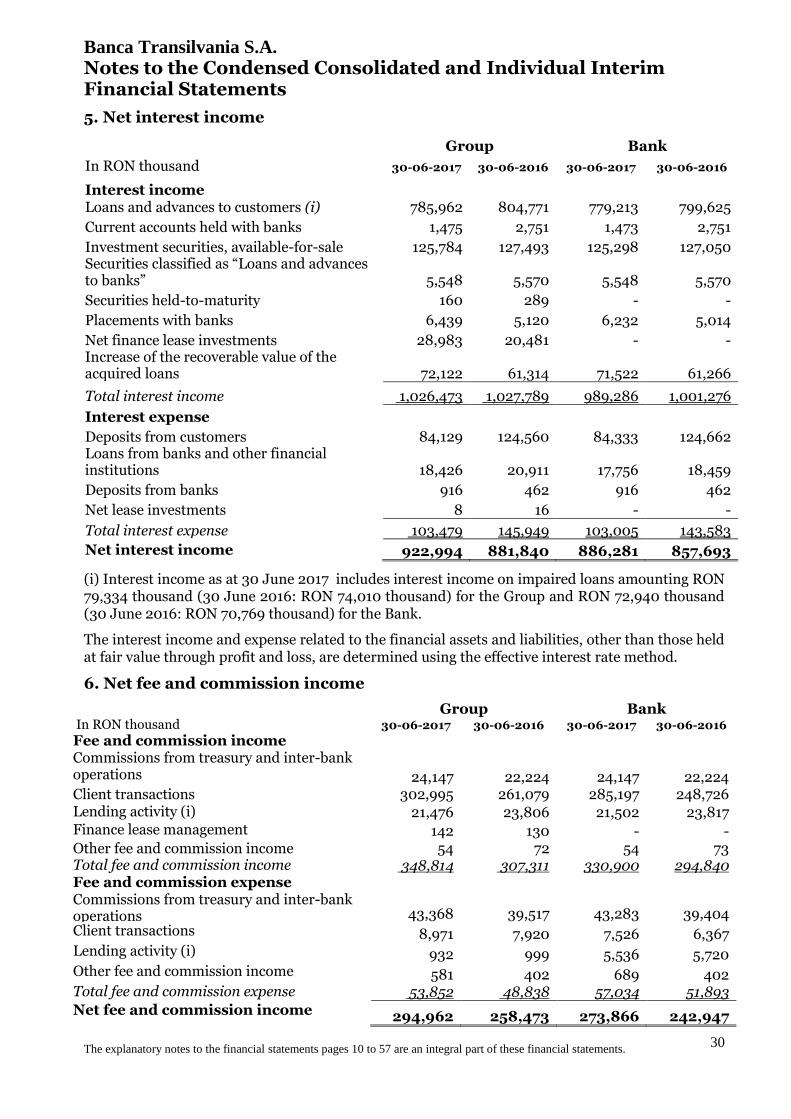
5. Net interest income
Group Bank
In RON thousand 30-06-2017 30-06-2016 30-06-2017 30-06-2016
Interest income Loans and advances to customers (i) 785,962 804,771 779,213 799,625
Current accounts held with banks 1,475 2,751 1,473 2,751
Investment securities, available-for-sale 125,784 127,493 125,298 127,050 Securities classified as “Loans and advances to banks” 5,548 5,570 5,548 5,570
Securities held-to-maturity 160 289 - -
Placements with banks 6,439 5,120 6,232 5,014
Net finance lease investments 28,983 20,481 - - Increase of the recoverable value of the acquired loans 72,122 61,314 71,522 61,266
Total interest income 1,026,473 1,027,789 989,286 1,001,276
Interest expense
Deposits from customers 84,129 124,560 84,333 124,662 Loans from banks and other financial institutions 18,426 20,911 17,756 18,459
Deposits from banks 916 462 916 462
Net lease investments 8 16 - -
Total interest expense 103,479 145,949 103,005 143,583
Net interest income 922,994 881,840 886,281 857,693
(i) Interest income as at 30 June 2017 includes interest income on impaired loans amounting RON 79,334 thousand (30 June 2016: RON 74,010 thousand) for the Group and RON 72,940 thousand (30 June 2016: RON 70,769 thousand) for the Bank.
The interest income and expense related to the financial assets and liabilities, other than those held at fair value through profit and loss, are determined using the effective interest rate method.
6. Net fee and commission income
Group Bank In RON thousand 30-06-2017 30-06-2016 30-06-2017 30-06-2016
Fee and commission income Commissions from treasury and inter-bank operations
24,147 22,224 24,147 22,224 Client transactions 302,995 261,079 285,197 248,726 Lending activity (i) 21,476 23,806 21,502 23,817 Finance lease management 142 130 - - Other fee and commission income 54 72 54 73 Total fee and commission income 348,814 307,311 330,900 294,840 Fee and commission expense Commissions from treasury and inter-bank operations
43,368 39,517 43,283 39,404 Client transactions 8,971 7,920 7,526 6,367 Lending activity (i) 932 999 5,536 5,720 Other fee and commission income 581 402 689 402 Total fee and commission expense 53,852 48,838 57,034 51,893
Net fee and commission income 294,962 258,473 273,866 242,947
Banca Transilvania S.A.
The explanatory notes to the financial statements pages 10 to 57 are an integral part of these financial statements.
31
Notes to the Condensed Consolidated and Individual Interim Financial Statements
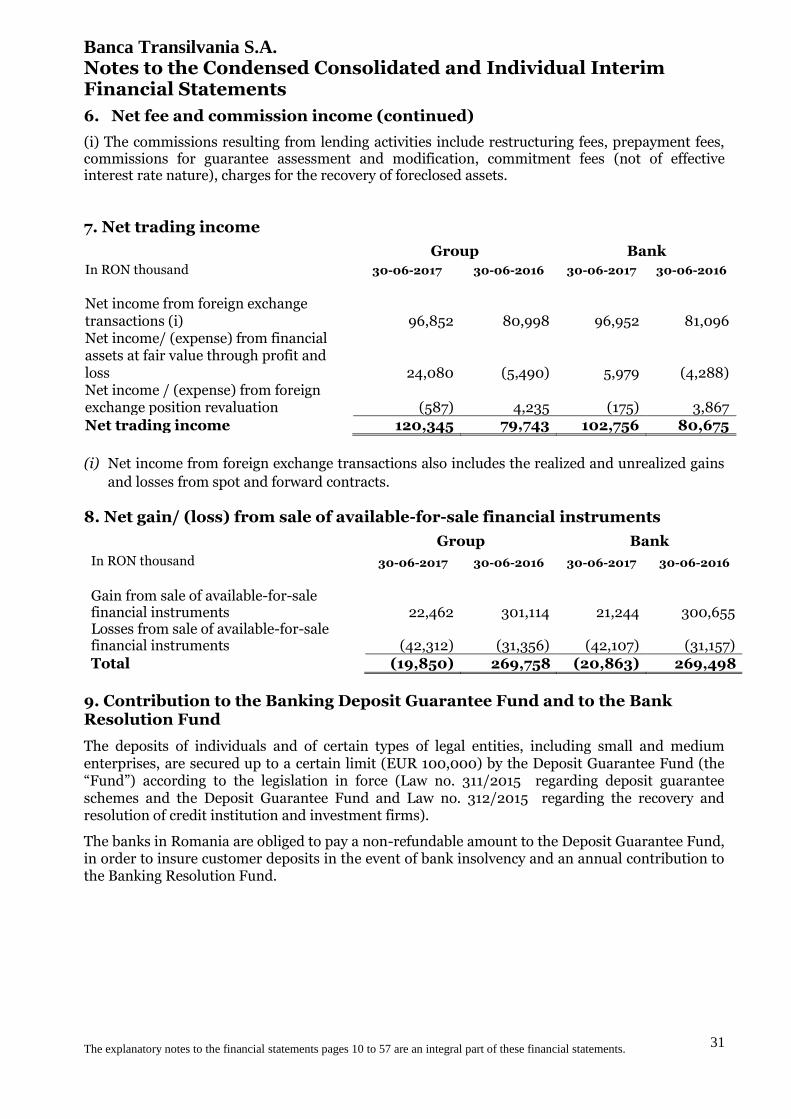
6. Net fee and commission income (continued)
(i) The commissions resulting from lending activities include restructuring fees, prepayment fees, commissions for guarantee assessment and modification, commitment fees (not of effective interest rate nature), charges for the recovery of foreclosed assets.
7. Net trading income
Group Bank
In RON thousand 30-06-2017 30-06-2016 30-06-2017 30-06-2016
Net income from foreign exchange transactions (i) 96,852 80,998 96,952 81,096 Net income/ (expense) from financial assets at fair value through profit and loss 24,080 (5,490) 5,979 (4,288) Net income / (expense) from foreign exchange position revaluation (587) 4,235 (175) 3,867
Net trading income 120,345 79,743 102,756 80,675
(i) Net income from foreign exchange transactions also includes the realized and unrealized gains
and losses from spot and forward contracts.
8. Net gain/ (loss) from sale of available-for-sale financial instruments
Group Bank
In RON thousand 30-06-2017 30-06-2016 30-06-2017 30-06-2016
Gain from sale of available-for-sale financial instruments 22,462 301,114 21,244 300,655 Losses from sale of available-for-sale financial instruments (42,312) (31,356) (42,107) (31,157)
Total (19,850) 269,758 (20,863) 269,498
9. Contribution to the Banking Deposit Guarantee Fund and to the Bank Resolution Fund
The deposits of individuals and of certain types of legal entities, including small and medium enterprises, are secured up to a certain limit (EUR 100,000) by the Deposit Guarantee Fund (the “Fund”) according to the legislation in force (Law no. 311/2015 regarding deposit guarantee schemes and the Deposit Guarantee Fund and Law no. 312/2015 regarding the recovery and resolution of credit institution and investment firms).
The banks in Romania are obliged to pay a non-refundable amount to the Deposit Guarantee Fund, in order to insure customer deposits in the event of bank insolvency and an annual contribution to the Banking Resolution Fund.
Banca Transilvania S.A.
The explanatory notes to the financial statements pages 10 to 57 are an integral part of these financial statements.
32
Notes to the Condensed Consolidated and Individual Interim Financial Statements
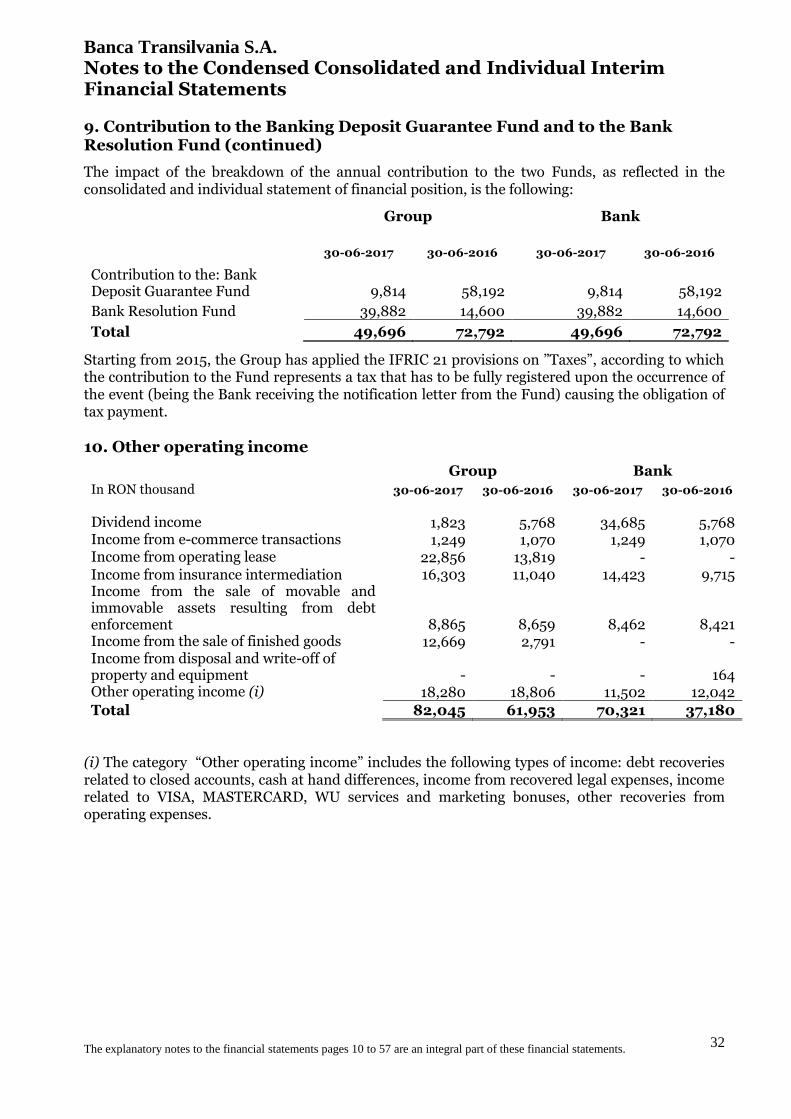
9. Contribution to the Banking Deposit Guarantee Fund and to the Bank Resolution Fund (continued)
The impact of the breakdown of the annual contribution to the two Funds, as reflected in the consolidated and individual statement of financial position, is the following:
Group Bank
30-06-2017 30-06-2016 30-06-2017 30-06-2016
Contribution to the: Bank Deposit Guarantee Fund 9,814 58,192 9,814 58,192
Bank Resolution Fund 39,882 14,600 39,882 14,600
Total 49,696 72,792 49,696 72,792
Starting from 2015, the Group has applied the IFRIC 21 provisions on ”Taxes”, according to which the contribution to the Fund represents a tax that has to be fully registered upon the occurrence of the event (being the Bank receiving the notification letter from the Fund) causing the obligation of tax payment.
10. Other operating income
Group Bank
In RON thousand 30-06-2017 30-06-2016 30-06-2017 30-06-2016
Dividend income 1,823 5,768 34,685 5,768 Income from e-commerce transactions 1,249 1,070 1,249 1,070 Income from operating lease 22,856 13,819 - - Income from insurance intermediation 16,303 11,040 14,423 9,715 Income from the sale of movable and immovable assets resulting from debt enforcement 8,865 8,659 8,462 8,421 Income from the sale of finished goods 12,669 2,791 - - Income from disposal and write-off of property and equipment - - - 164 Other operating income (i) 18,280 18,806 11,502 12,042
Total 82,045 61,953 70,321 37,180
(i) The category “Other operating income” includes the following types of income: debt recoveries related to closed accounts, cash at hand differences, income from recovered legal expenses, income related to VISA, MASTERCARD, WU services and marketing bonuses, other recoveries from operating expenses.
Banca Transilvania S.A.
The explanatory notes to the financial statements pages 10 to 57 are an integral part of these financial statements.
33
Notes to the Condensed Consolidated and Individual Interim Financial Statements
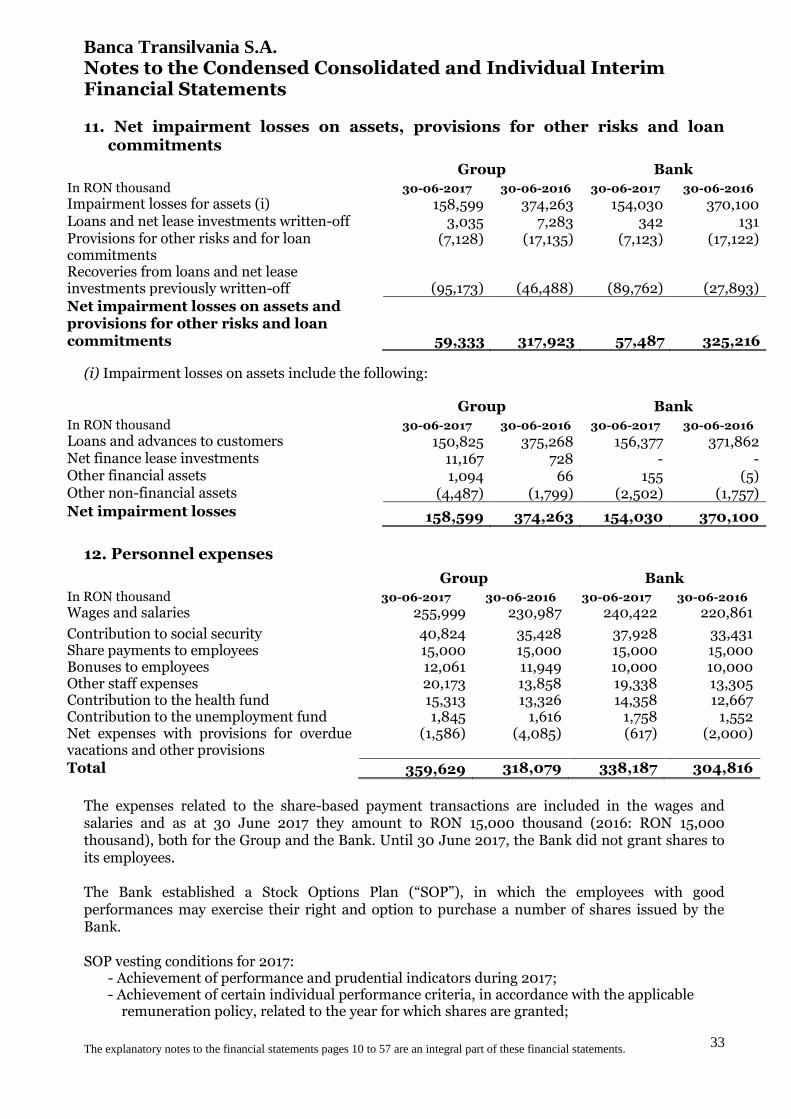
11. Net impairment losses on assets, provisions for other risks and loan commitments
Group Bank
In RON thousand 30-06-2017 30-06-2016 30-06-2017 30-06-2016
Impairment losses for assets (i) 158,599 374,263 154,030 370,100 Loans and net lease investments written-off 3,035 7,283 342 131 Provisions for other risks and for loan commitments
(7,128) (17,135) (7,123) (17,122)
Recoveries from loans and net lease investments previously written-off (95,173) (46,488) (89,762) (27,893)
Net impairment losses on assets and provisions for other risks and loan commitments 59,333 317,923 57,487 325,216
(i) Impairment losses on assets include the following:
Group Bank
In RON thousand 30-06-2017 30-06-2016 30-06-2017 30-06-2016
Loans and advances to customers 150,825 375,268 156,377 371,862 Net finance lease investments 11,167 728 - - Other financial assets 1,094 66 155 (5) Other non-financial assets (4,487) (1,799) (2,502) (1,757)
Net impairment losses 158,599 374,263 154,030 370,100
12. Personnel expenses
Group Bank
In RON thousand 30-06-2017 30-06-2016 30-06-2017 30-06-2016
Wages and salaries 255,999 230,987 240,422 220,861
Contribution to social security 40,824 35,428 37,928 33,431 Share payments to employees 15,000 15,000 15,000 15,000 Bonuses to employees 12,061 11,949 10,000 10,000 Other staff expenses 20,173 13,858 19,338 13,305 Contribution to the health fund 15,313 13,326 14,358 12,667 Contribution to the unemployment fund 1,845 1,616 1,758 1,552 Net expenses with provisions for overdue vacations and other provisions
(1,586) (4,085) (617) (2,000)
Total 359,629 318,079 338,187 304,816
The expenses related to the share-based payment transactions are included in the wages and salaries and as at 30 June 2017 they amount to RON 15,000 thousand (2016: RON 15,000 thousand), both for the Group and the Bank. Until 30 June 2017, the Bank did not grant shares to its employees. The Bank established a Stock Options Plan (“SOP”), in which the employees with good performances may exercise their right and option to purchase a number of shares issued by the Bank. SOP vesting conditions for 2017:
- Achievement of performance and prudential indicators during 2017; - Achievement of certain individual performance criteria, in accordance with the applicable
remuneration policy, related to the year for which shares are granted;
Banca Transilvania S.A.
The explanatory notes to the financial statements pages 10 to 57 are an integral part of these financial statements.
34
Banca Transilvania S.A.
The explanatory notes to the financial statements pages 10 to 57 are an integral part of these financial statements.
35
Notes to the Condensed Consolidated and Individual Interim Financial Statements
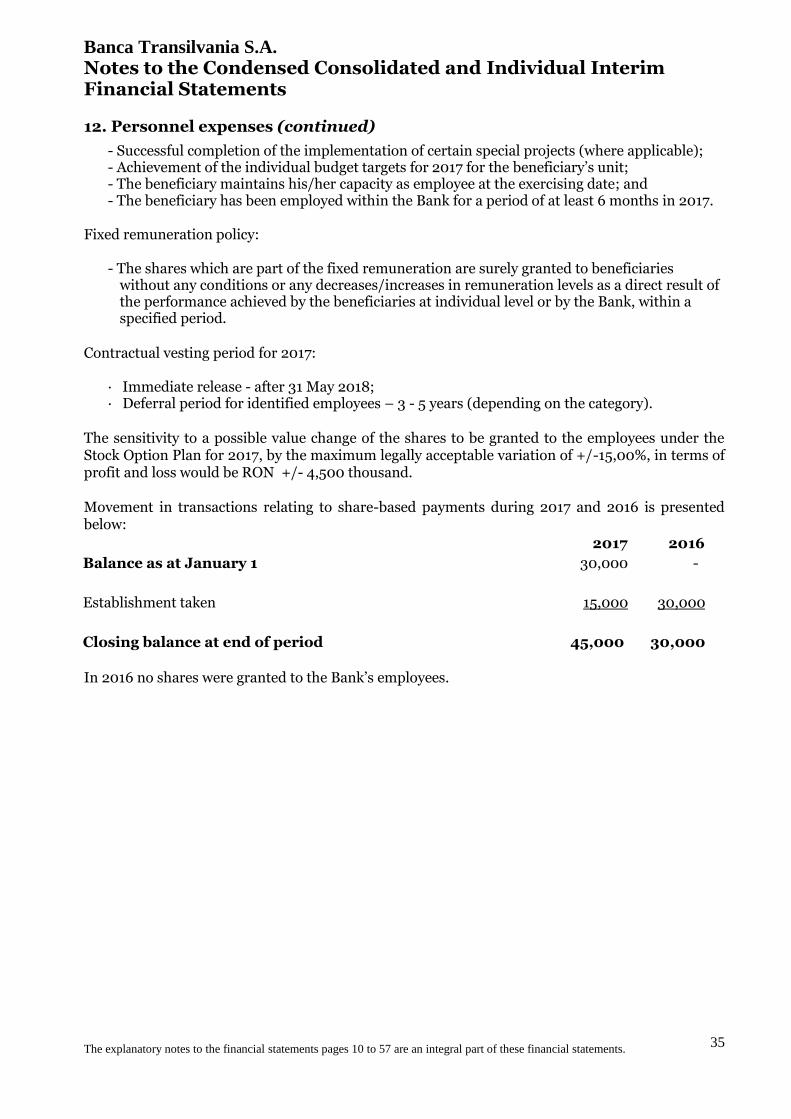
12. Personnel expenses (continued)
- Successful completion of the implementation of certain special projects (where applicable); - Achievement of the individual budget targets for 2017 for the beneficiary’s unit; - The beneficiary maintains his/her capacity as employee at the exercising date; and - The beneficiary has been employed within the Bank for a period of at least 6 months in 2017.
Fixed remuneration policy:
- The shares which are part of the fixed remuneration are surely granted to beneficiaries
without any conditions or any decreases/increases in remuneration levels as a direct result of the performance achieved by the beneficiaries at individual level or by the Bank, within a specified period.
Contractual vesting period for 2017:
· Immediate release - after 31 May 2018; · Deferral period for identified employees – 3 - 5 years (depending on the category).
The sensitivity to a possible value change of the shares to be granted to the employees under the Stock Option Plan for 2017, by the maximum legally acceptable variation of +/-15,00%, in terms of profit and loss would be RON +/- 4,500 thousand. Movement in transactions relating to share-based payments during 2017 and 2016 is presented below:
2017 2016
Balance as at January 1 30,000 -
Establishment taken 15,000 30,000
Closing balance at end of period 45,000 30,000
In 2016 no shares were granted to the Bank’s employees.
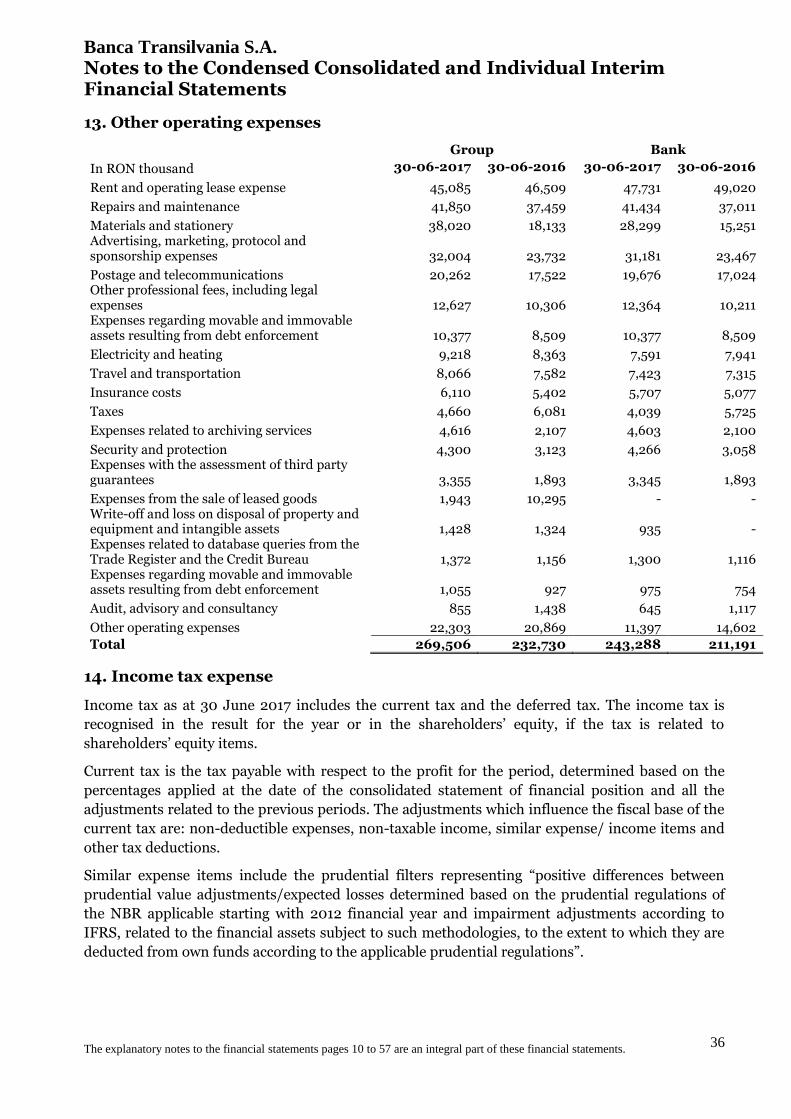
Banca Transilvania S.A.
The explanatory notes to the financial statements pages 10 to 57 are an integral part of these financial statements.
36
Notes to the Condensed Consolidated and Individual Interim Financial Statements
13. Other operating expenses
Group Bank
In RON thousand 30-06-2017 30-06-2016 30-06-2017 30-06-2016
Rent and operating lease expense 45,085 46,509 47,731 49,020
Repairs and maintenance 41,850 37,459 41,434 37,011
Materials and stationery 38,020 18,133 28,299 15,251 Advertising, marketing, protocol and sponsorship expenses 32,004 23,732 31,181 23,467
Postage and telecommunications 20,262 17,522 19,676 17,024 Other professional fees, including legal expenses 12,627 10,306 12,364 10,211 Expenses regarding movable and immovable assets resulting from debt enforcement 10,377 8,509 10,377 8,509
Electricity and heating 9,218 8,363 7,591 7,941
Travel and transportation 8,066 7,582 7,423 7,315
Insurance costs 6,110 5,402 5,707 5,077
Taxes 4,660 6,081 4,039 5,725
Expenses related to archiving services 4,616 2,107 4,603 2,100
Security and protection 4,300 3,123 4,266 3,058 Expenses with the assessment of third party guarantees 3,355 1,893 3,345 1,893
Expenses from the sale of leased goods 1,943 10,295 - - Write-off and loss on disposal of property and equipment and intangible assets 1,428 1,324 935 - Expenses related to database queries from the Trade Register and the Credit Bureau 1,372 1,156 1,300 1,116 Expenses regarding movable and immovable assets resulting from debt enforcement 1,055 927 975 754
Audit, advisory and consultancy 855 1,438 645 1,117
Other operating expenses 22,303 20,869 11,397 14,602
Total 269,506 232,730 243,288 211,191
14. Income tax expense
Income tax as at 30 June 2017 includes the current tax and the deferred tax. The income tax is
recognised in the result for the year or in the shareholders’ equity, if the tax is related to
shareholders’ equity items.
Current tax is the tax payable with respect to the profit for the period, determined based on the
percentages applied at the date of the consolidated statement of financial position and all the
adjustments related to the previous periods. The adjustments which influence the fiscal base of the
current tax are: non-deductible expenses, non-taxable income, similar expense/ income items and
other tax deductions.
Similar expense items include the prudential filters representing “positive differences between
prudential value adjustments/expected losses determined based on the prudential regulations of
the NBR applicable starting with 2012 financial year and impairment adjustments according to
IFRS, related to the financial assets subject to such methodologies, to the extent to which they are
deducted from own funds according to the applicable prudential regulations”.
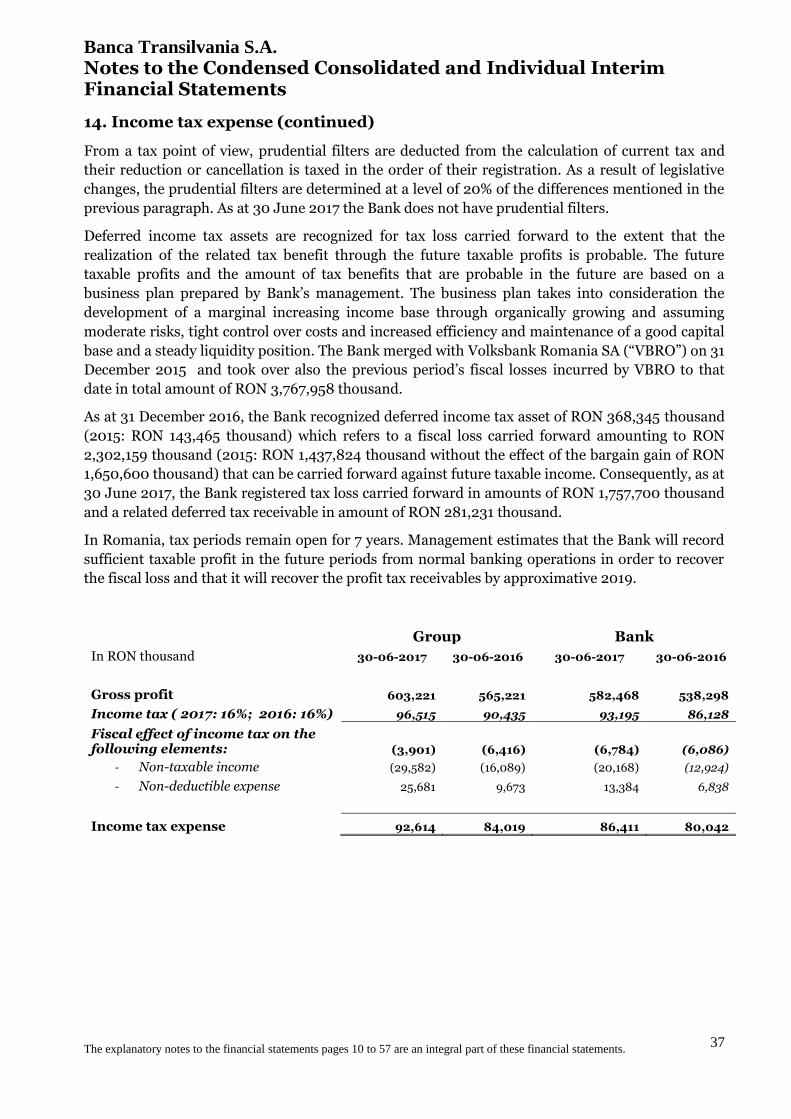
Banca Transilvania S.A.
The explanatory notes to the financial statements pages 10 to 57 are an integral part of these financial statements.
37
Notes to the Condensed Consolidated and Individual Interim Financial Statements
14. Income tax expense (continued)
From a tax point of view, prudential filters are deducted from the calculation of current tax and
their reduction or cancellation is taxed in the order of their registration. As a result of legislative
changes, the prudential filters are determined at a level of 20% of the differences mentioned in the
previous paragraph. As at 30 June 2017 the Bank does not have prudential filters.
Deferred income tax assets are recognized for tax loss carried forward to the extent that the
realization of the related tax benefit through the future taxable profits is probable. The future
taxable profits and the amount of tax benefits that are probable in the future are based on a
business plan prepared by Bank’s management. The business plan takes into consideration the
development of a marginal increasing income base through organically growing and assuming
moderate risks, tight control over costs and increased efficiency and maintenance of a good capital
base and a steady liquidity position. The Bank merged with Volksbank Romania SA (“VBRO”) on 31
December 2015 and took over also the previous period’s fiscal losses incurred by VBRO to that
date in total amount of RON 3,767,958 thousand.
As at 31 December 2016, the Bank recognized deferred income tax asset of RON 368,345 thousand
(2015: RON 143,465 thousand) which refers to a fiscal loss carried forward amounting to RON
2,302,159 thousand (2015: RON 1,437,824 thousand without the effect of the bargain gain of RON
1,650,600 thousand) that can be carried forward against future taxable income. Consequently, as at
30 June 2017, the Bank registered tax loss carried forward in amounts of RON 1,757,700 thousand
and a related deferred tax receivable in amount of RON 281,231 thousand.
In Romania, tax periods remain open for 7 years. Management estimates that the Bank will record
sufficient taxable profit in the future periods from normal banking operations in order to recover
the fiscal loss and that it will recover the profit tax receivables by approximative 2019.
Group Bank
In RON thousand 30-06-2017 30-06-2016 30-06-2017 30-06-2016
Gross profit 603,221 565,221 582,468 538,298
Income tax ( 2017: 16%; 2016: 16%) 96,515 90,435 93,195 86,128
Fiscal effect of income tax on the following elements: (3,901) (6,416) (6,784) (6,086)
- Non-taxable income (29,582) (16,089) (20,168) (12,924)
- Non-deductible expense 25,681 9,673 13,384 6,838
Income tax expense 92,614 84,019 86,411 80,042
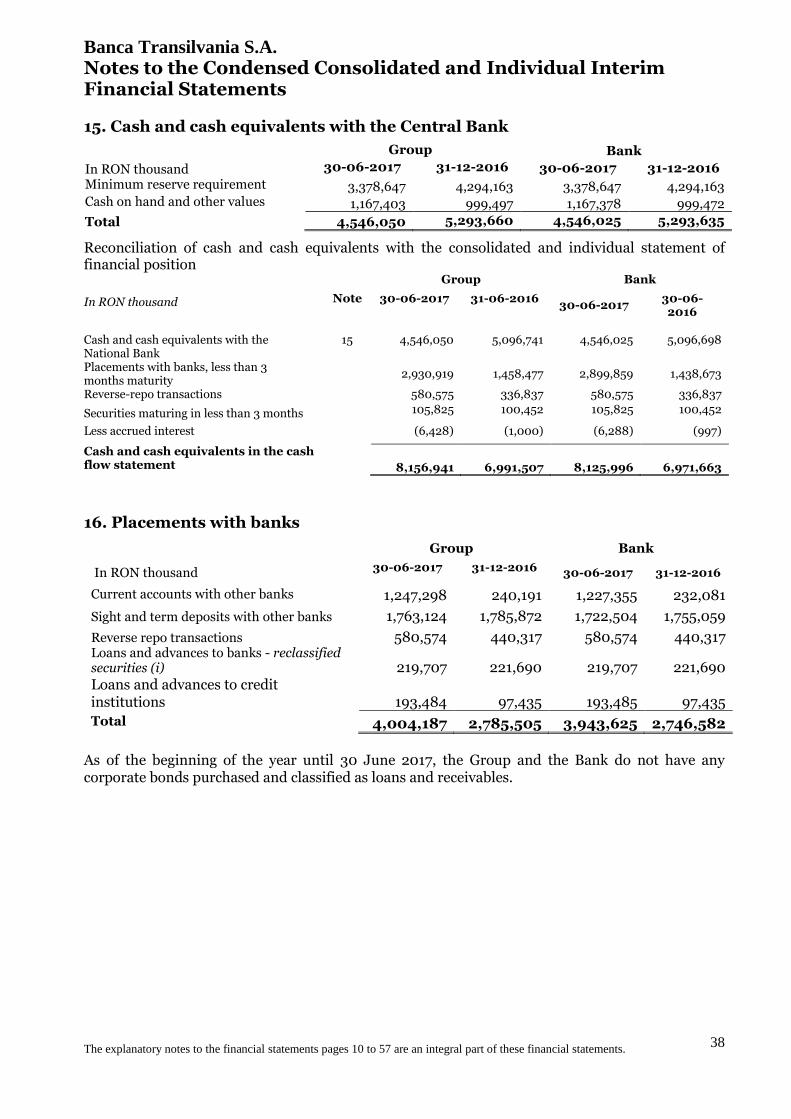
Banca Transilvania S.A.
The explanatory notes to the financial statements pages 10 to 57 are an integral part of these financial statements.
38
Notes to the Condensed Consolidated and Individual Interim Financial Statements
15. Cash and cash equivalents with the Central Bank
Group Bank
In RON thousand 30-06-2017 31-12-2016 30-06-2017 31-12-2016
Minimum reserve requirement 3,378,647 4,294,163 3,378,647 4,294,163 Cash on hand and other values 1,167,403 999,497 1,167,378 999,472
Total 4,546,050 5,293,660 4,546,025 5,293,635
Reconciliation of cash and cash equivalents with the consolidated and individual statement of financial position Group Bank
In RON thousand Note 30-06-2017 31-06-2016 30-06-2017
30-06-2016
Cash and cash equivalents with the National Bank
15 4,546,050 5,096,741 4,546,025 5,096,698
Placements with banks, less than 3 months maturity
2,930,919 1,458,477 2,899,859 1,438,673
Reverse-repo transactions 580,575 336,837 580,575 336,837
Securities maturing in less than 3 months 105,825 100,452 105,825 100,452
Less accrued interest (6,428) (1,000) (6,288) (997)
Cash and cash equivalents in the cash flow statement
8,156,941 6,991,507 8,125,996 6,971,663
16. Placements with banks
Group Bank
In RON thousand 30-06-2017 31-12-2016 30-06-2017 31-12-2016
Current accounts with other banks 1,247,298 240,191 1,227,355 232,081
Sight and term deposits with other banks 1,763,124 1,785,872 1,722,504 1,755,059
Reverse repo transactions 580,574 440,317 580,574 440,317 Loans and advances to banks - reclassified securities (i) 219,707 221,690 219,707 221,690 Loans and advances to credit institutions 193,484 97,435 193,485 97,435
Total 4,004,187 2,785,505 3,943,625 2,746,582
As of the beginning of the year until 30 June 2017, the Group and the Bank do not have any corporate bonds purchased and classified as loans and receivables.
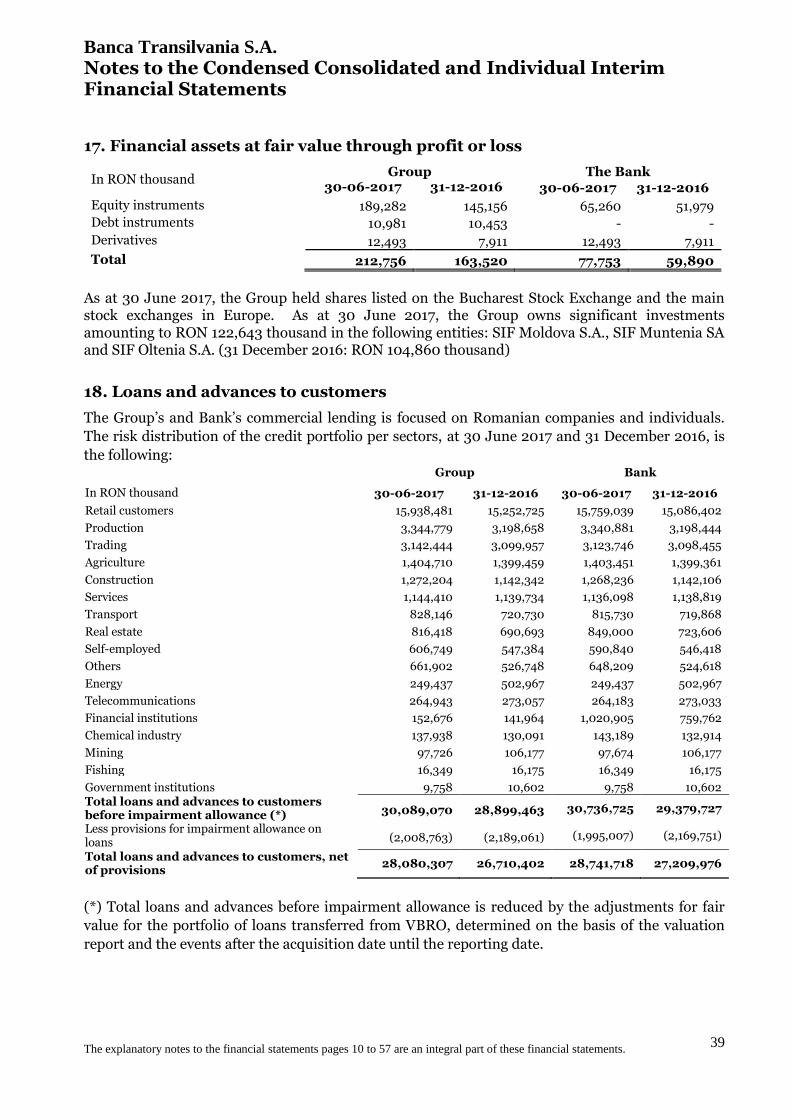
Banca Transilvania S.A.
The explanatory notes to the financial statements pages 10 to 57 are an integral part of these financial statements.
39
Notes to the Condensed Consolidated and Individual Interim Financial Statements
17. Financial assets at fair value through profit or loss
In RON thousand Group The Bank
30-06-2017 31-12-2016 30-06-2017 31-12-2016
Equity instruments 189,282 145,156 65,260 51,979
Debt instruments 10,981 10,453 - -
Derivatives 12,493 7,911 12,493 7,911
Total 212,756 163,520 77,753 59,890
As at 30 June 2017, the Group held shares listed on the Bucharest Stock Exchange and the main stock exchanges in Europe. As at 30 June 2017, the Group owns significant investments amounting to RON 122,643 thousand in the following entities: SIF Moldova S.A., SIF Muntenia SA and SIF Oltenia S.A. (31 December 2016: RON 104,860 thousand)
18. Loans and advances to customers
The Group’s and Bank’s commercial lending is focused on Romanian companies and individuals.
The risk distribution of the credit portfolio per sectors, at 30 June 2017 and 31 December 2016, is
the following: Group Bank
In RON thousand 30-06-2017 31-12-2016 30-06-2017 31-12-2016
Retail customers 15,938,481 15,252,725 15,759,039 15,086,402
Production 3,344,779 3,198,658 3,340,881 3,198,444
Trading 3,142,444 3,099,957 3,123,746 3,098,455
Agriculture 1,404,710 1,399,459 1,403,451 1,399,361
Construction 1,272,204 1,142,342 1,268,236 1,142,106
Services 1,144,410 1,139,734 1,136,098 1,138,819
Transport 828,146 720,730 815,730 719,868
Real estate 816,418 690,693 849,000 723,606
Self-employed 606,749 547,384 590,840 546,418
Others 661,902 526,748 648,209 524,618
Energy 249,437 502,967 249,437 502,967
Telecommunications 264,943 273,057 264,183 273,033
Financial institutions 152,676 141,964 1,020,905 759,762
Chemical industry 137,938 130,091 143,189 132,914
Mining 97,726 106,177 97,674 106,177
Fishing 16,349 16,175 16,349 16,175
Government institutions 9,758 10,602 9,758 10,602 Total loans and advances to customers before impairment allowance (*) 30,089,070 28,899,463 30,736,725 29,379,727
Less provisions for impairment allowance on loans (2,008,763) (2,189,061) (1,995,007) (2,169,751)
Total loans and advances to customers, net of provisions
28,080,307 26,710,402 28,741,718 27,209,976
(*) Total loans and advances before impairment allowance is reduced by the adjustments for fair
value for the portfolio of loans transferred from VBRO, determined on the basis of the valuation
report and the events after the acquisition date until the reporting date.
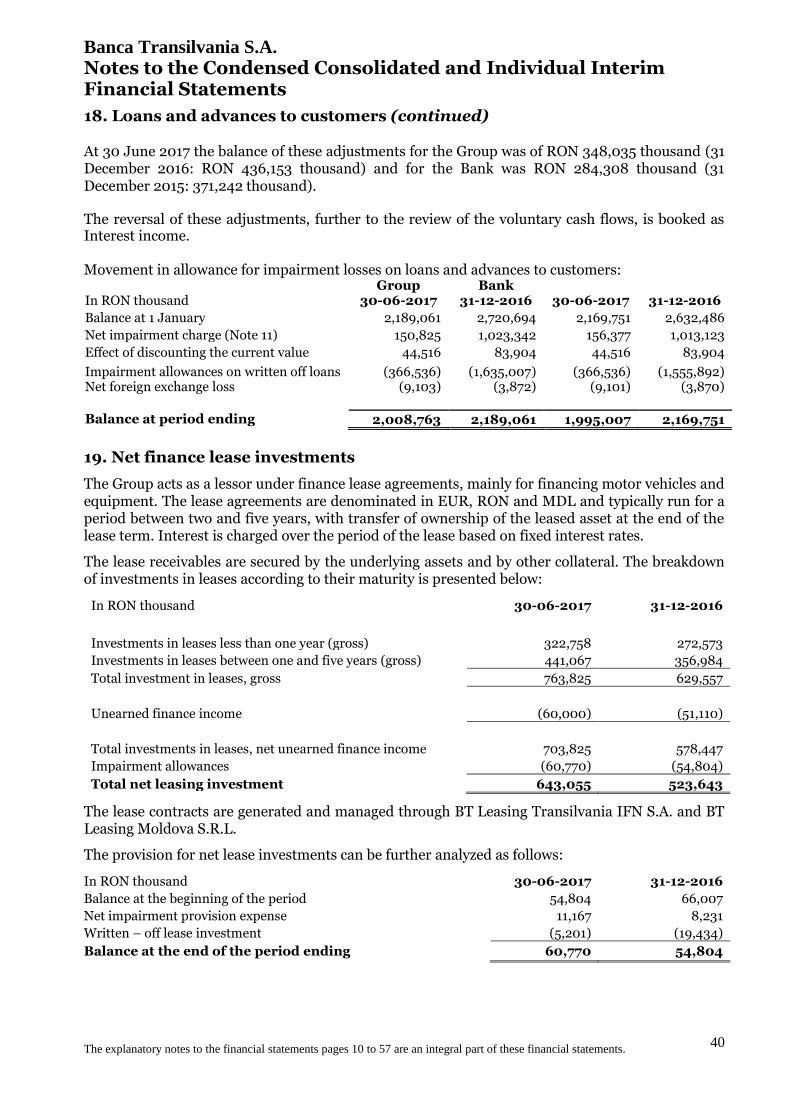
Banca Transilvania S.A.
The explanatory notes to the financial statements pages 10 to 57 are an integral part of these financial statements.
40
Notes to the Condensed Consolidated and Individual Interim Financial Statements
18. Loans and advances to customers (continued) At 30 June 2017 the balance of these adjustments for the Group was of RON 348,035 thousand (31 December 2016: RON 436,153 thousand) and for the Bank was RON 284,308 thousand (31 December 2015: 371,242 thousand). The reversal of these adjustments, further to the review of the voluntary cash flows, is booked as Interest income.
Movement in allowance for impairment losses on loans and advances to customers:
Group Bank
In RON thousand 30-06-2017 31-12-2016 30-06-2017 31-12-2016
Balance at 1 January 2,189,061 2,720,694 2,169,751 2,632,486
Net impairment charge (Note 11) 150,825 1,023,342 156,377 1,013,123
Effect of discounting the current value 44,516 83,904 44,516 83,904
Impairment allowances on written off loans (366,536) (1,635,007) (366,536) (1,555,892) Net foreign exchange loss (9,103) (3,872) (9,101) (3,870)
Balance at period ending 2,008,763 2,189,061 1,995,007 2,169,751
19. Net finance lease investments
The Group acts as a lessor under finance lease agreements, mainly for financing motor vehicles and equipment. The lease agreements are denominated in EUR, RON and MDL and typically run for a period between two and five years, with transfer of ownership of the leased asset at the end of the lease term. Interest is charged over the period of the lease based on fixed interest rates.
The lease receivables are secured by the underlying assets and by other collateral. The breakdown of investments in leases according to their maturity is presented below:
In RON thousand 30-06-2017 31-12-2016
Investments in leases less than one year (gross) 322,758 272,573
Investments in leases between one and five years (gross) 441,067 356,984
Total investment in leases, gross 763,825 629,557
Unearned finance income (60,000) (51,110)
Total investments in leases, net unearned finance income 703,825 578,447
Impairment allowances (60,770) (54,804)
Total net leasing investment 643,055 523,643
The lease contracts are generated and managed through BT Leasing Transilvania IFN S.A. and BT Leasing Moldova S.R.L.
The provision for net lease investments can be further analyzed as follows:
In RON thousand 30-06-2017 31-12-2016
Balance at the beginning of the period 54,804 66,007
Net impairment provision expense 11,167 8,231
Written – off lease investment (5,201) (19,434)
Balance at the end of the period ending 60,770 54,804
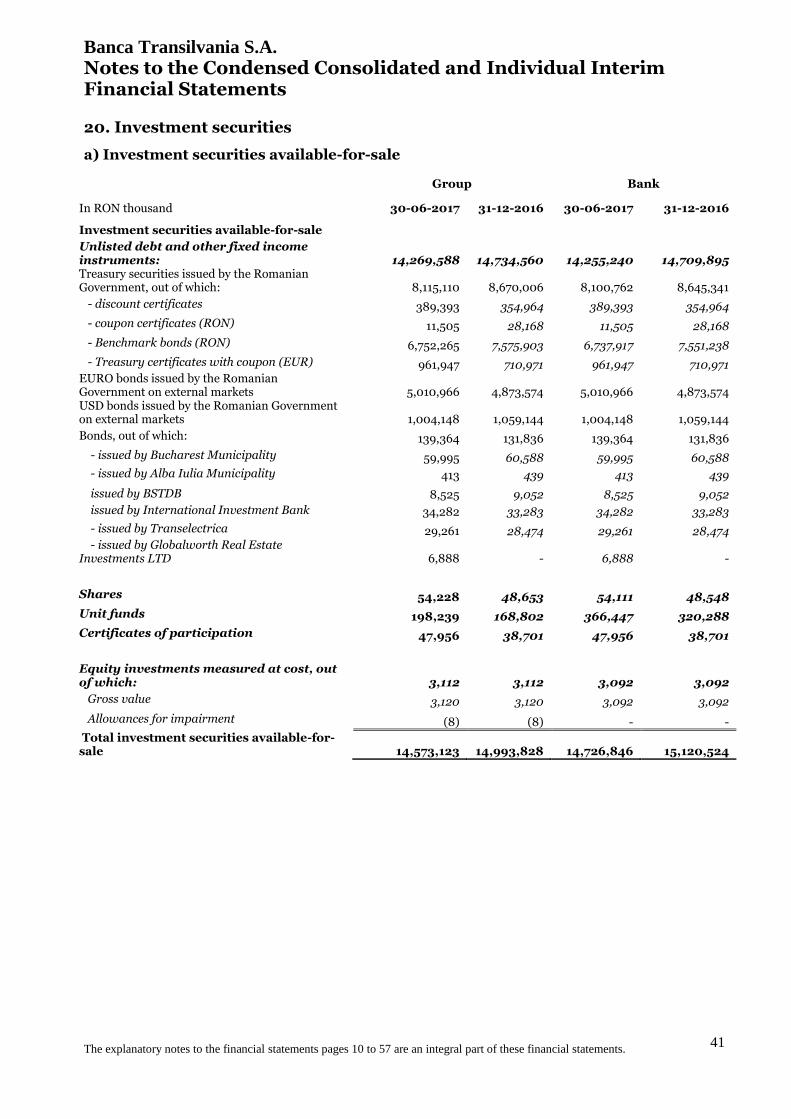
Banca Transilvania S.A.
The explanatory notes to the financial statements pages 10 to 57 are an integral part of these financial statements.
41
Notes to the Condensed Consolidated and Individual Interim Financial Statements
20. Investment securities
a) Investment securities available-for-sale
Group Bank
In RON thousand 30-06-2017 31-12-2016 30-06-2017 31-12-2016
Investment securities available-for-sale
Unlisted debt and other fixed income instruments: 14,269,588 14,734,560 14,255,240 14,709,895 Treasury securities issued by the Romanian Government, out of which: 8,115,110 8,670,006 8,100,762 8,645,341
- discount certificates 389,393 354,964 389,393 354,964
- coupon certificates (RON) 11,505 28,168 11,505 28,168
- Benchmark bonds (RON) 6,752,265 7,575,903 6,737,917 7,551,238
- Treasury certificates with coupon (EUR) 961,947 710,971 961,947 710,971 EURO bonds issued by the Romanian Government on external markets 5,010,966 4,873,574 5,010,966 4,873,574 USD bonds issued by the Romanian Government on external markets 1,004,148 1,059,144 1,004,148 1,059,144
Bonds, out of which: 139,364 131,836 139,364 131,836
- issued by Bucharest Municipality 59,995 60,588 59,995 60,588
- issued by Alba Iulia Municipality 413 439 413 439
issued by BSTDB 8,525 9,052 8,525 9,052
issued by International Investment Bank 34,282 33,283 34,282 33,283
- issued by Transelectrica 29,261 28,474 29,261 28,474 - issued by Globalworth Real Estate Investments LTD 6,888 - 6,888 -
Shares 54,228 48,653 54,111 48,548
Unit funds 198,239 168,802 366,447 320,288
Certificates of participation 47,956 38,701 47,956 38,701
Equity investments measured at cost, out of which: 3,112 3,112 3,092 3,092
Gross value 3,120 3,120 3,092 3,092
Allowances for impairment (8) (8) - -
Total investment securities available-for-sale 14,573,123 14,993,828 14,726,846 15,120,524
Banca Transilvania S.A.
The explanatory notes to the financial statements pages 10 to 57 are an integral part of these financial statements.
42
Notes to the Condensed Consolidated and Individual Interim Financial Statements 21. Tangible assets, real-estate investments and intangible assets (including goodwill)
During the 6-month period ended 30 June 2017, the Group acquired tangible assets amounting to RON 106,836 thousand out of which RON 63,522 thousand related to the Bank, and property investments in amount of RON 1,024 thousand, of which RON 0 related to the Bank.
The net book value of tangible assets at the end of this period at Group level amounts to RON 623,316 thousand (as at 31 December 2016: RON 558,734 thousand) and for the Bank is in amount of RON 404,473 thousand (as at 31 December 2016: RON 370,305 thousand).
During the 6-month period ended 30 June 2017, the Group acquired intangible assets amounting to RON 35,915 thousand out of which RON 35,626 thousand related to the Bank.
The net book value of intangible assets (goodwill included) at the end of this period at Group level amounts to RON 107,538 thousand (as at 31 December 2016: RON 89,374 thousand) and for the Bank is in amount of RON 96,853 thousand (as at 31 December 2016: RON 78,396 thousand).
Group amortization expense for tangible and intangible assets at the end of the 6 months ended 30 June 2017, amounts to RON 56,990 thousand (30 June 2016: RON 45,153 thousand) of which related tangible and intangible assets of the Bank in amount of RON 41,235 thousand (30 June 2016: RON 35,680 thousand).
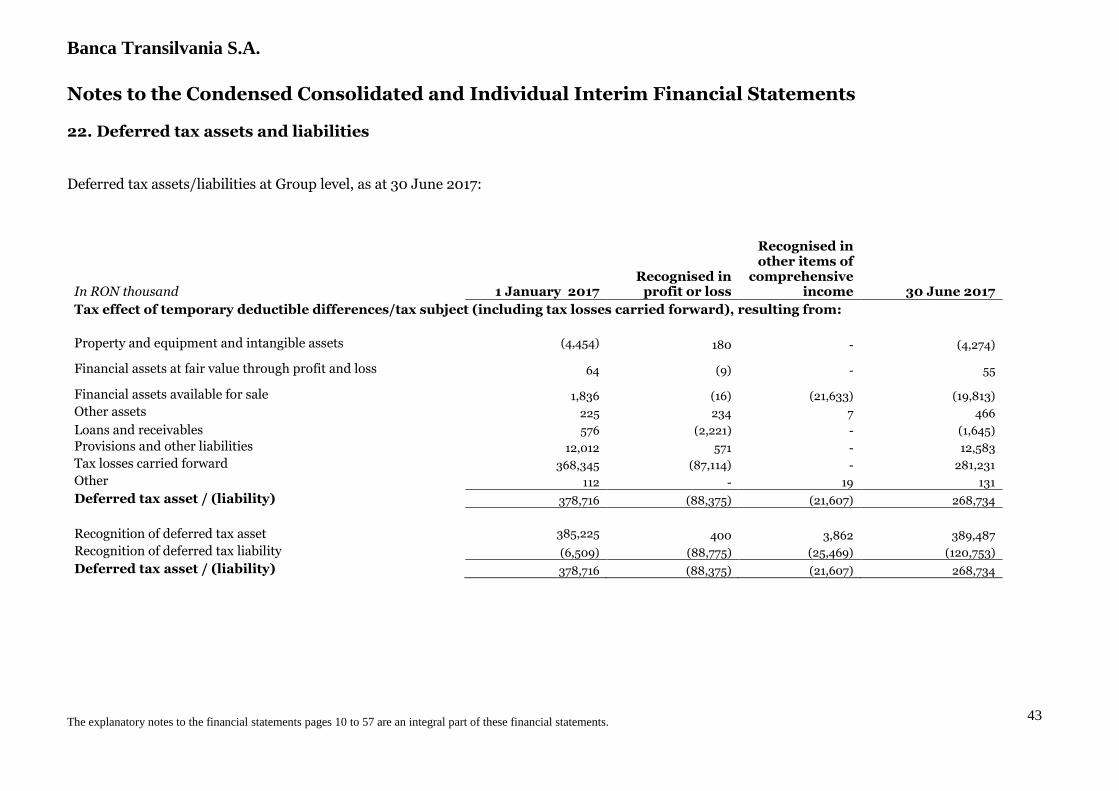
Banca Transilvania S.A.
The explanatory notes to the financial statements pages 10 to 57 are an integral part of these financial statements.
43
Notes to the Condensed Consolidated and Individual Interim Financial Statements
22. Deferred tax assets and liabilities
Deferred tax assets/liabilities at Group level, as at 30 June 2017:
In RON thousand 1 January 2017 Recognised in
profit or loss
Recognised in other items of
comprehensive income 30 June 2017
Tax effect of temporary deductible differences/tax subject (including tax losses carried forward), resulting from:
Property and equipment and intangible assets (4,454) 180 - (4,274)
Financial assets at fair value through profit and loss 64 (9) - 55
Financial assets available for sale 1,836 (16) (21,633) (19,813)
Other assets 225 234 7 466
Loans and receivables 576 (2,221) - (1,645)
Provisions and other liabilities 12,012 571 - 12,583
Tax losses carried forward 368,345 (87,114) - 281,231
Other 112 - 19 131
Deferred tax asset / (liability) 378,716 (88,375) (21,607) 268,734
Recognition of deferred tax asset 385,225 400 3,862 389,487
Recognition of deferred tax liability (6,509) (88,775) (25,469) (120,753)
Deferred tax asset / (liability) 378,716 (88,375) (21,607) 268,734
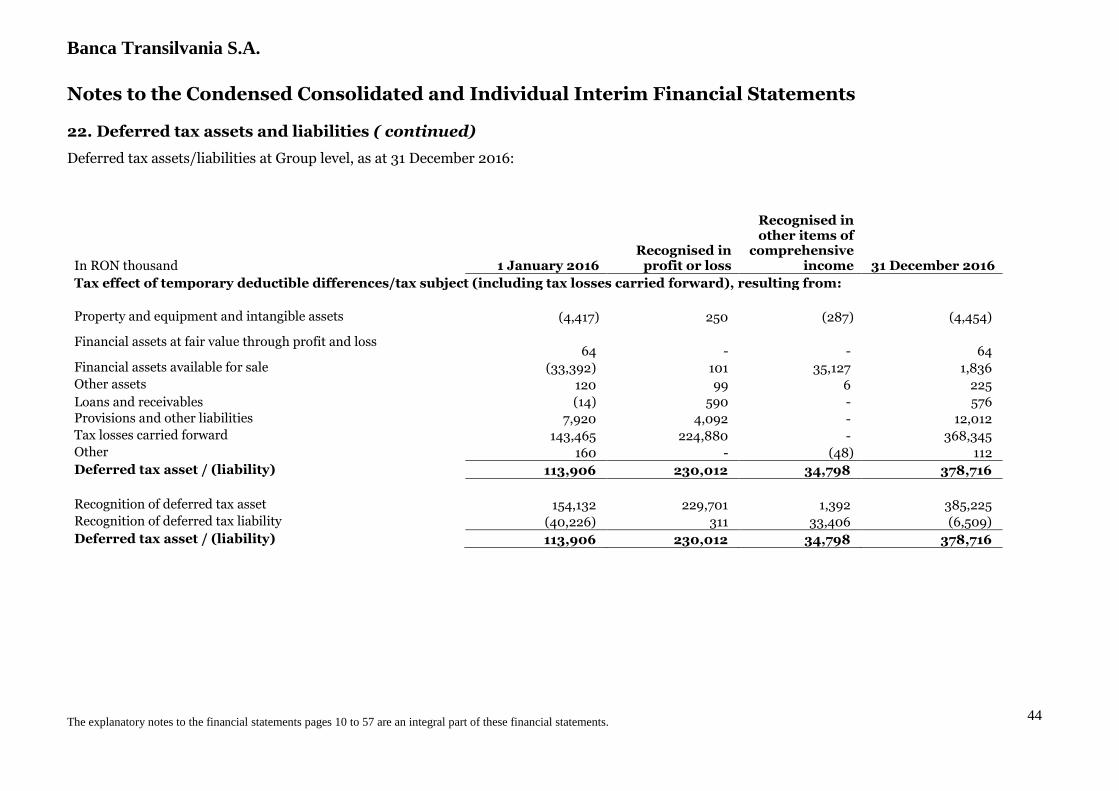
Banca Transilvania S.A.
The explanatory notes to the financial statements pages 10 to 57 are an integral part of these financial statements.
44
Notes to the Condensed Consolidated and Individual Interim Financial Statements
22. Deferred tax assets and liabilities ( continued)
Deferred tax assets/liabilities at Group level, as at 31 December 2016:
In RON thousand 1 January 2016 Recognised in
profit or loss
Recognised in other items of
comprehensive income 31 December 2016
Tax effect of temporary deductible differences/tax subject (including tax losses carried forward), resulting from:
Property and equipment and intangible assets (4,417) 250 (287) (4,454)
Financial assets at fair value through profit and loss 64 - - 64
Financial assets available for sale (33,392) 101 35,127 1,836 Other assets 120 99 6 225
Loans and receivables (14) 590 - 576
Provisions and other liabilities 7,920 4,092 - 12,012
Tax losses carried forward 143,465 224,880 - 368,345 Other 160 - (48) 112
Deferred tax asset / (liability) 113,906 230,012 34,798 378,716
Recognition of deferred tax asset 154,132 229,701 1,392 385,225 Recognition of deferred tax liability (40,226) 311 33,406 (6,509)
Deferred tax asset / (liability) 113,906 230,012 34,798 378,716
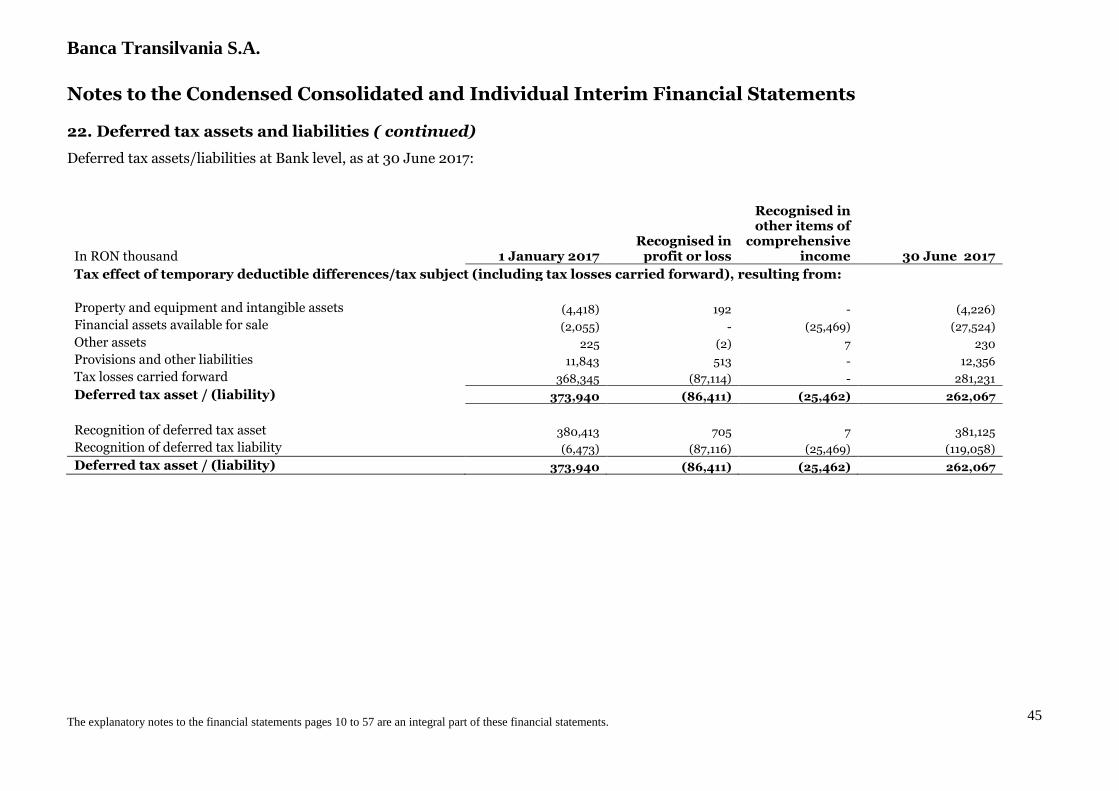
Banca Transilvania S.A.
The explanatory notes to the financial statements pages 10 to 57 are an integral part of these financial statements.
45
Notes to the Condensed Consolidated and Individual Interim Financial Statements
22. Deferred tax assets and liabilities ( continued)
Deferred tax assets/liabilities at Bank level, as at 30 June 2017:
In RON thousand 1 January 2017 Recognised in
profit or loss
Recognised in other items of
comprehensive income 30 June 2017
Tax effect of temporary deductible differences/tax subject (including tax losses carried forward), resulting from:
Property and equipment and intangible assets (4,418) 192 - (4,226)
Financial assets available for sale (2,055) - (25,469) (27,524)
Other assets 225 (2) 7 230
Provisions and other liabilities 11,843 513 - 12,356
Tax losses carried forward 368,345 (87,114) - 281,231
Deferred tax asset / (liability) 373,940 (86,411) (25,462) 262,067
Recognition of deferred tax asset 380,413 705 7 381,125
Recognition of deferred tax liability (6,473) (87,116) (25,469) (119,058)
Deferred tax asset / (liability) 373,940 (86,411) (25,462) 262,067
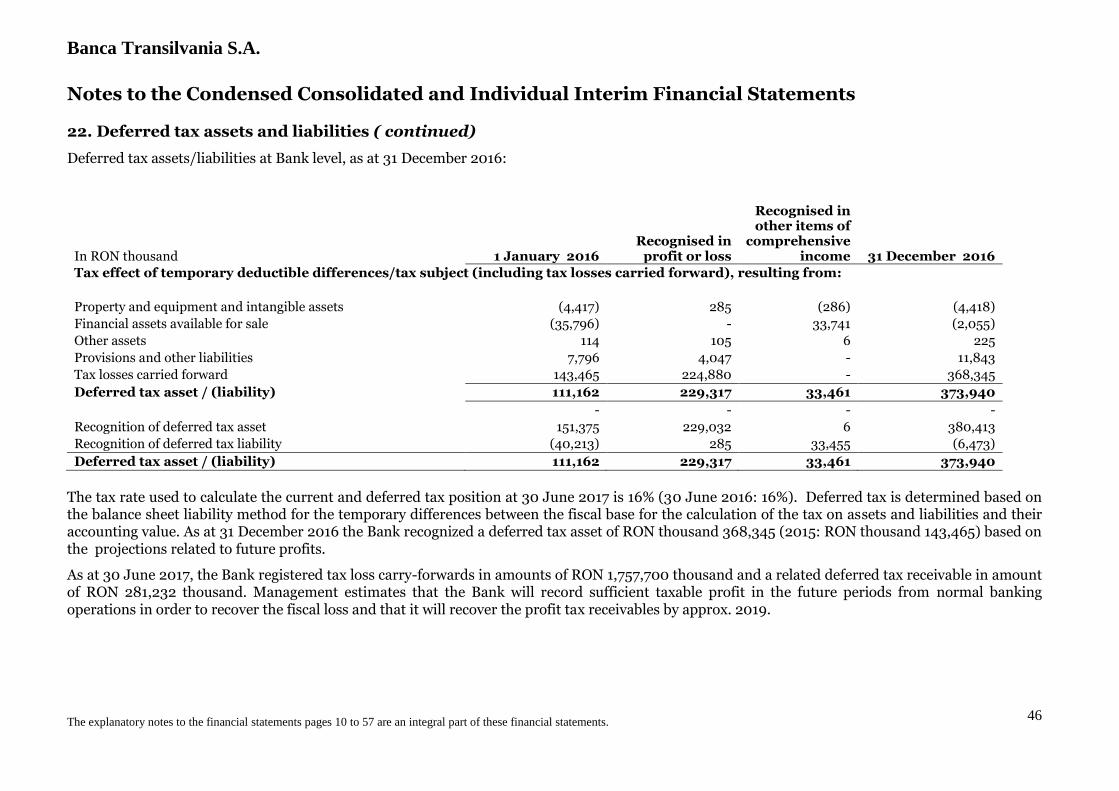
Banca Transilvania S.A.
The explanatory notes to the financial statements pages 10 to 57 are an integral part of these financial statements.
46
Notes to the Condensed Consolidated and Individual Interim Financial Statements
22. Deferred tax assets and liabilities ( continued)
Deferred tax assets/liabilities at Bank level, as at 31 December 2016:
In RON thousand 1 January 2016 Recognised in
profit or loss
Recognised in other items of
comprehensive income 31 December 2016
Tax effect of temporary deductible differences/tax subject (including tax losses carried forward), resulting from:
Property and equipment and intangible assets (4,417) 285 (286) (4,418)
Financial assets available for sale (35,796) - 33,741 (2,055)
Other assets 114 105 6 225
Provisions and other liabilities 7,796 4,047 - 11,843
Tax losses carried forward 143,465 224,880 - 368,345
Deferred tax asset / (liability) 111,162 229,317 33,461 373,940
- - - -
Recognition of deferred tax asset 151,375 229,032 6 380,413
Recognition of deferred tax liability (40,213) 285 33,455 (6,473)
Deferred tax asset / (liability) 111,162 229,317 33,461 373,940
The tax rate used to calculate the current and deferred tax position at 30 June 2017 is 16% (30 June 2016: 16%). Deferred tax is determined based on the balance sheet liability method for the temporary differences between the fiscal base for the calculation of the tax on assets and liabilities and their accounting value. As at 31 December 2016 the Bank recognized a deferred tax asset of RON thousand 368,345 (2015: RON thousand 143,465) based on the projections related to future profits.
As at 30 June 2017, the Bank registered tax loss carry-forwards in amounts of RON 1,757,700 thousand and a related deferred tax receivable in amount of RON 281,232 thousand. Management estimates that the Bank will record sufficient taxable profit in the future periods from normal banking operations in order to recover the fiscal loss and that it will recover the profit tax receivables by approx. 2019.
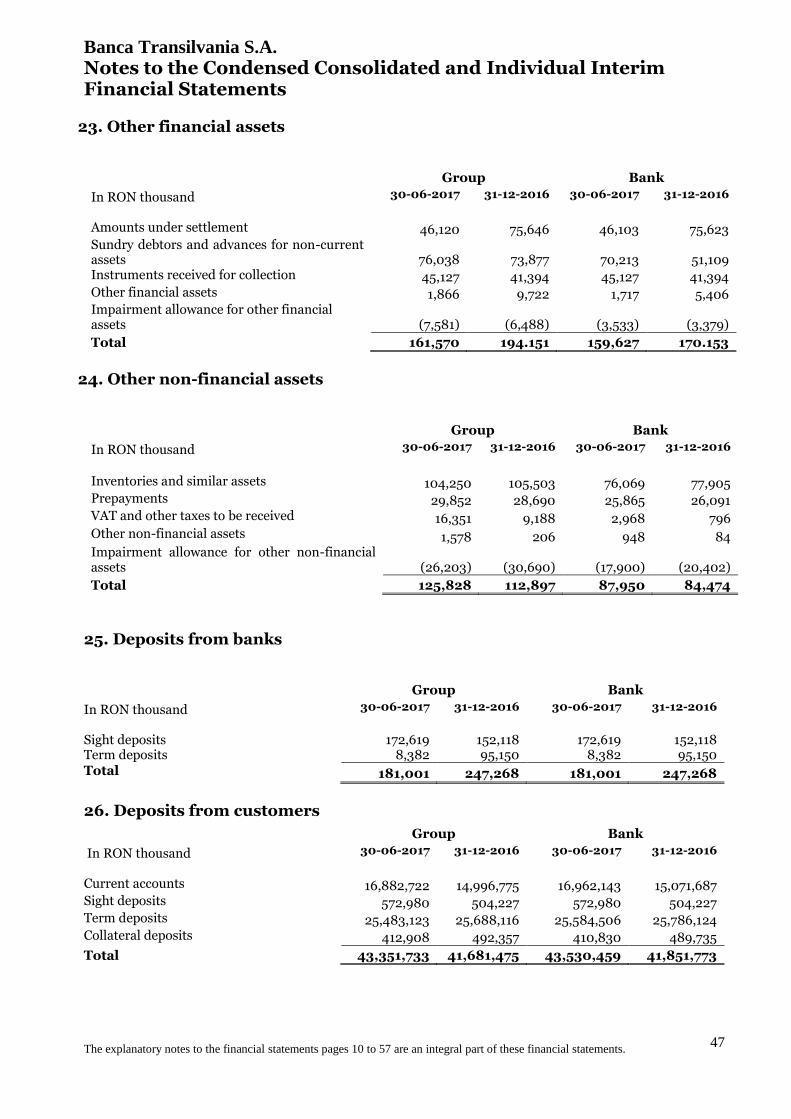
Banca Transilvania S.A.
The explanatory notes to the financial statements pages 10 to 57 are an integral part of these financial statements.
47
Notes to the Condensed Consolidated and Individual Interim Financial Statements
23. Other financial assets
Group Bank
In RON thousand 30-06-2017 31-12-2016 30-06-2017 31-12-2016
Amounts under settlement 46,120 75,646 46,103 75,623 Sundry debtors and advances for non-current assets 76,038 73,877 70,213 51,109 Instruments received for collection 45,127 41,394 45,127 41,394 Other financial assets 1,866 9,722 1,717 5,406 Impairment allowance for other financial assets (7,581) (6,488) (3,533) (3,379)
Total 161,570 194.151 159,627 170.153
24. Other non-financial assets
Group Bank
In RON thousand 30-06-2017 31-12-2016 30-06-2017 31-12-2016
Inventories and similar assets 104,250 105,503 76,069 77,905 Prepayments 29,852 28,690 25,865 26,091 VAT and other taxes to be received 16,351 9,188 2,968 796 Other non-financial assets 1,578 206 948 84 Impairment allowance for other non-financial assets (26,203) (30,690) (17,900) (20,402)
Total 125,828 112,897 87,950 84,474
25. Deposits from banks
Group Bank
In RON thousand 30-06-2017 31-12-2016 30-06-2017 31-12-2016
Sight deposits 172,619 152,118 172,619 152,118 Term deposits 8,382 95,150 8,382 95,150 Total 181,001 247,268 181,001 247,268
26. Deposits from customers
Group Bank
In RON thousand 30-06-2017 31-12-2016 30-06-2017 31-12-2016
Current accounts 16,882,722 14,996,775 16,962,143 15,071,687 Sight deposits 572,980 504,227 572,980 504,227 Term deposits 25,483,123 25,688,116 25,584,506 25,786,124 Collateral deposits 412,908 492,357 410,830 489,735
Total 43,351,733 41,681,475 43,530,459 41,851,773

Banca Transilvania S.A.
The explanatory notes to the financial statements pages 10 to 57 are an integral part of these financial statements.
48
Notes to the Condensed Consolidated and Individual Interim Financial Statements
26. Deposits from customers (continued)
Deposits from customers can be also analyzed as follows:
Group Bank
In RON thousand 30-06-2017 31-12-2016 30-06-2017 31-12-2016
Retail customers 28,020,079 26,358,368 28,019,995 26,355,402 Companies 15,331,654 15,323,107 15,510,464 15,496,371
Total 43,351,733 41,681,475 43,530,459 41,851,773
27. Loans from banks and other financial institutions
Group Bank
In RON thousand 30-06-2017 31-12-2016 30-06-2017 31-12-2016
Loans from commercial banks 26,598 39,535 - -
Romanian banks 26,598 39,535 - - Foreign banks - - - -
Loans from development banks 698,927 672,837 681,285 653,922 Repurchase agreements (repo transactions) 661,382 1,483,035 661,382 1,483,035 Other funds from financial institutions 82,479 109,504 82,479 109,504 Total 1,469,386 2,304,911 1,425,146 2,246,461
The interest rate range for loans from banks and financial institutions was as follows:
Bank 30-06-2017 31-12-2016
Minimum Maximum Minimum Maximum
EUR -0.85% Euribor 6m+3.25% -0.85% Euribor 6m+3.25% RON 0.00% 0.20% 0.00% 0.60% USD 0.85% Libor 6m+0.51% 0.40% Libor 6m+0.51%
Group 30-06-2017 31-12-2016
Minimum Maximum Minimum Maximum
EUR -0.85% Euribor 6m+3.75% -0.85% Euribor 3m+5.50% RON 0.00% Robor 3m + 1.45% 0.00% Robor 3m + 1.45% USD 0.85% Libor 6m+0.51% 0.40% Libor 6m+0.51%
As at 30 June 2017 and 31 December 2016 the Bank and the Group meet financial indicators
required by the loan agreements with donors.
28. Subordinated liabilities Group Bank
In RON thousand 30-06-2017 31-12-2016 30-06-2017 31-12-2016
Loans from development banks and financial institutions 366,105 377,852 366,105 377,852
Convertible Bonds 46,357 46,259 46,357 46,259 Total 412,462 424,111 412,462 424,111
Subordinated debt includes subordinated loans from development banks and financial institutions, as well as convertible bonds.
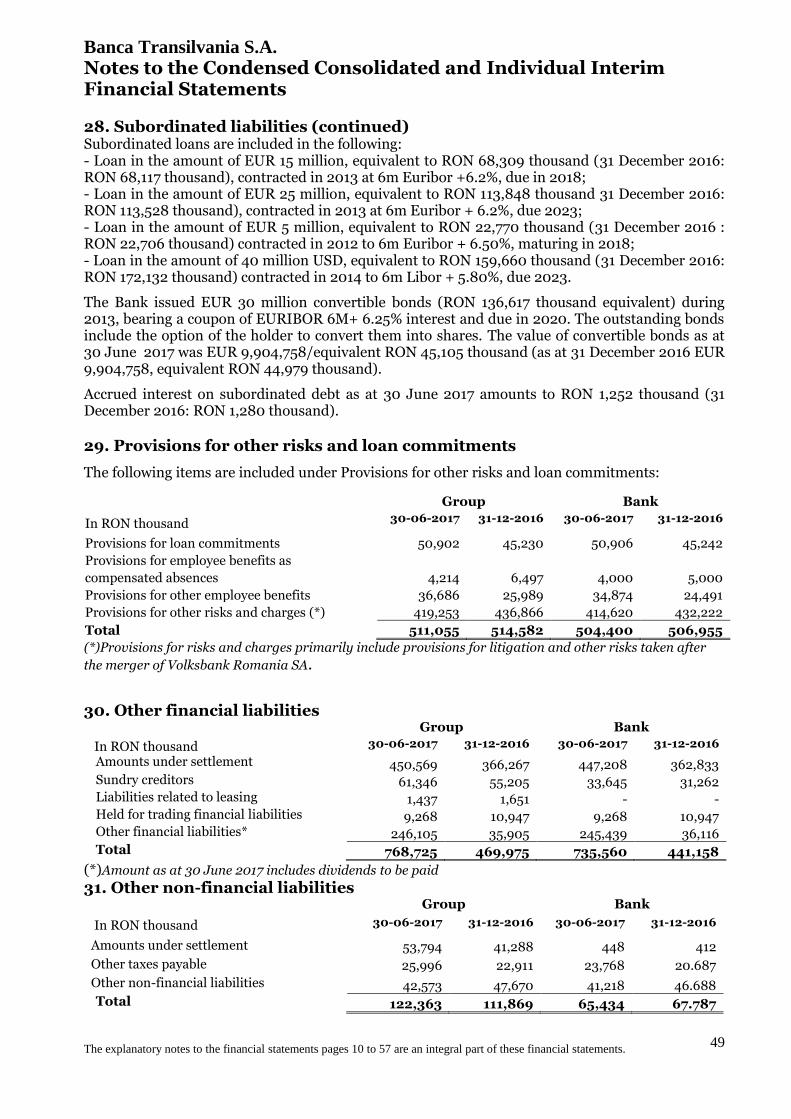
Banca Transilvania S.A.
The explanatory notes to the financial statements pages 10 to 57 are an integral part of these financial statements.
49
Notes to the Condensed Consolidated and Individual Interim Financial Statements
28. Subordinated liabilities (continued) Subordinated loans are included in the following: - Loan in the amount of EUR 15 million, equivalent to RON 68,309 thousand (31 December 2016: RON 68,117 thousand), contracted in 2013 at 6m Euribor +6.2%, due in 2018; - Loan in the amount of EUR 25 million, equivalent to RON 113,848 thousand 31 December 2016: RON 113,528 thousand), contracted in 2013 at 6m Euribor + 6.2%, due 2023; - Loan in the amount of EUR 5 million, equivalent to RON 22,770 thousand (31 December 2016 : RON 22,706 thousand) contracted in 2012 to 6m Euribor + 6.50%, maturing in 2018; - Loan in the amount of 40 million USD, equivalent to RON 159,660 thousand (31 December 2016: RON 172,132 thousand) contracted in 2014 to 6m Libor + 5.80%, due 2023.
The Bank issued EUR 30 million convertible bonds (RON 136,617 thousand equivalent) during 2013, bearing a coupon of EURIBOR 6M+ 6.25% interest and due in 2020. The outstanding bonds include the option of the holder to convert them into shares. The value of convertible bonds as at 30 June 2017 was EUR 9,904,758/equivalent RON 45,105 thousand (as at 31 December 2016 EUR 9,904,758, equivalent RON 44,979 thousand).
Accrued interest on subordinated debt as at 30 June 2017 amounts to RON 1,252 thousand (31 December 2016: RON 1,280 thousand).
29. Provisions for other risks and loan commitments
The following items are included under Provisions for other risks and loan commitments:
Group Bank
In RON thousand 30-06-2017 31-12-2016 30-06-2017 31-12-2016
Provisions for loan commitments 50,902 45,230 50,906 45,242
Provisions for employee benefits as
compensated absences 4,214 6,497 4,000 5,000
Provisions for other employee benefits 36,686 25,989 34,874 24,491
Provisions for other risks and charges (*) 419,253 436,866 414,620 432,222
Total 511,055 514,582 504,400 506,955
(*)Provisions for risks and charges primarily include provisions for litigation and other risks taken after
the merger of Volksbank Romania SA.
30. Other financial liabilities
Group Bank
In RON thousand 30-06-2017 31-12-2016 30-06-2017 31-12-2016
Amounts under settlement 450,569 366,267 447,208 362,833 Sundry creditors 61,346 55,205 33,645 31,262 Liabilities related to leasing 1,437 1,651 - - Held for trading financial liabilities 9,268 10,947 9,268 10,947 Other financial liabilities* 246,105 35,905 245,439 36,116 Total 768,725 469,975 735,560 441,158
(*)Amount as at 30 June 2017 includes dividends to be paid
31. Other non-financial liabilities Group Bank
In RON thousand 30-06-2017 31-12-2016 30-06-2017 31-12-2016
Amounts under settlement 53,794 41,288 448 412
Other taxes payable 25,996 22,911 23,768 20.687
Other non-financial liabilities 42,573 47,670 41,218 46.688 Total 122,363 111,869 65,434 67.787
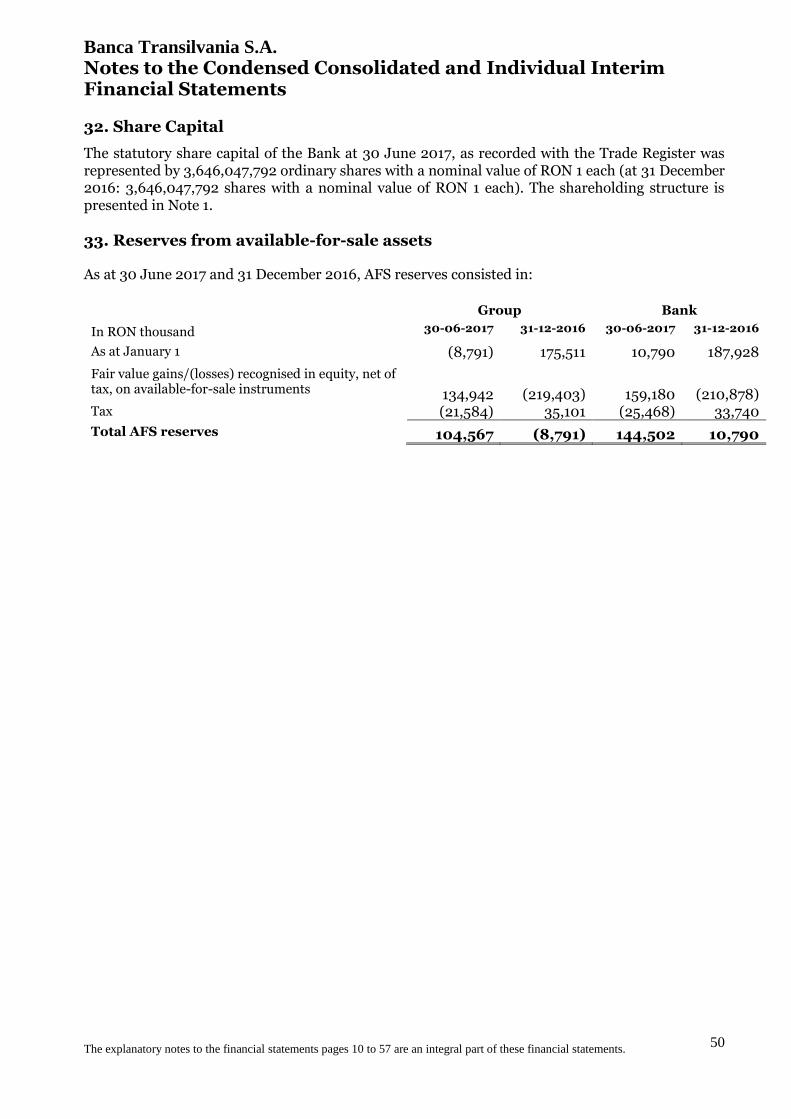
Banca Transilvania S.A.
The explanatory notes to the financial statements pages 10 to 57 are an integral part of these financial statements.
50
Notes to the Condensed Consolidated and Individual Interim Financial Statements
32. Share Capital
The statutory share capital of the Bank at 30 June 2017, as recorded with the Trade Register was represented by 3,646,047,792 ordinary shares with a nominal value of RON 1 each (at 31 December 2016: 3,646,047,792 shares with a nominal value of RON 1 each). The shareholding structure is presented in Note 1.
33. Reserves from available-for-sale assets As at 30 June 2017 and 31 December 2016, AFS reserves consisted in:
Group Bank
In RON thousand 30-06-2017 31-12-2016 30-06-2017 31-12-2016
As at January 1 (8,791) 175,511 10,790 187,928
Fair value gains/(losses) recognised in equity, net of tax, on available-for-sale instruments 134,942 (219,403) 159,180 (210,878) Tax (21,584) 35,101 (25,468) 33,740
Total AFS reserves 104,567 (8,791) 144,502 10,790
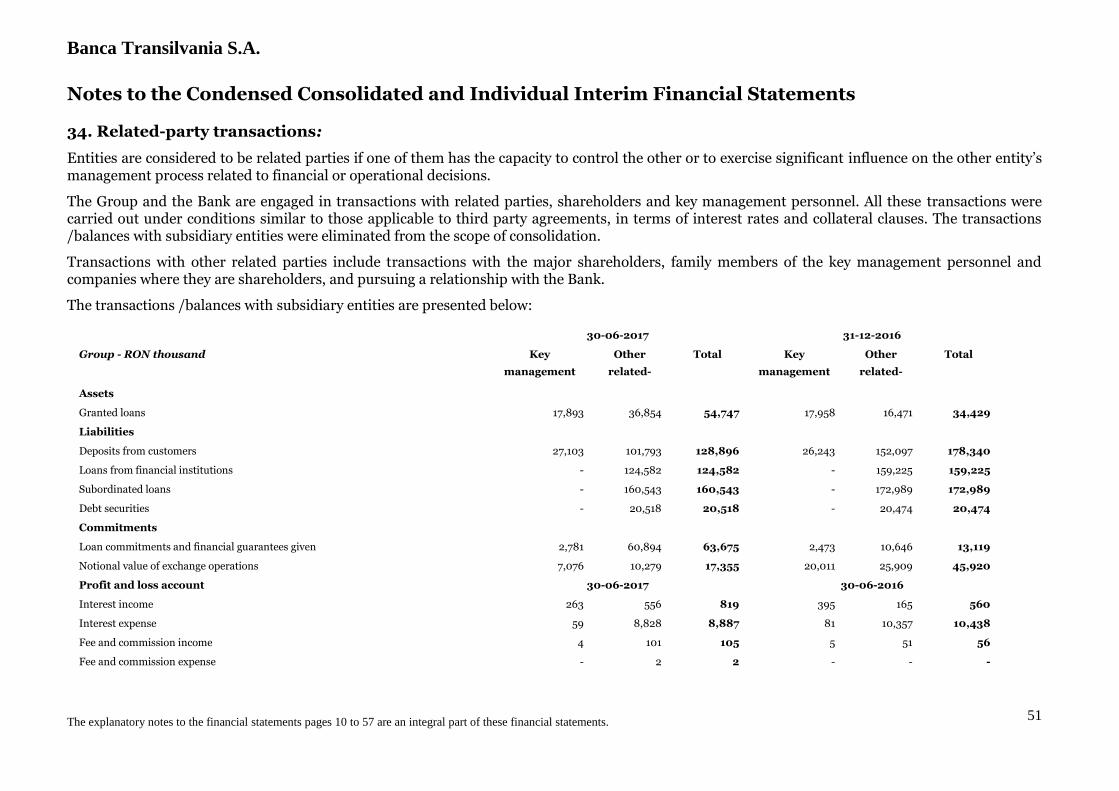
Banca Transilvania S.A.
The explanatory notes to the financial statements pages 10 to 57 are an integral part of these financial statements.
51
Notes to the Condensed Consolidated and Individual Interim Financial Statements
34. Related-party transactions:
Entities are considered to be related parties if one of them has the capacity to control the other or to exercise significant influence on the other entity’s management process related to financial or operational decisions.
The Group and the Bank are engaged in transactions with related parties, shareholders and key management personnel. All these transactions were carried out under conditions similar to those applicable to third party agreements, in terms of interest rates and collateral clauses. The transactions /balances with subsidiary entities were eliminated from the scope of consolidation.
Transactions with other related parties include transactions with the major shareholders, family members of the key management personnel and companies where they are shareholders, and pursuing a relationship with the Bank.
The transactions /balances with subsidiary entities are presented below:
30-06-2017 31-12-2016
Group - RON thousand Key
management
personnel
Other
related-
parties
Total Key
management
personnel
Other
related-
parties
Total
Assets
Granted loans 17,893 36,854 54,747 17,958 16,471 34,429
Liabilities
Deposits from customers 27,103 101,793 128,896 26,243 152,097 178,340
Loans from financial institutions - 124,582 124,582 - 159,225 159,225
Subordinated loans - 160,543 160,543 - 172,989 172,989
Debt securities - 20,518 20,518 - 20,474 20,474
Commitments
Loan commitments and financial guarantees given 2,781 60,894 63,675 2,473 10,646 13,119
Notional value of exchange operations 7,076 10,279 17,355 20,011 25,909 45,920
Profit and loss account 30-06-2017 30-06-2016
Interest income 263 556 819 395 165 560
Interest expense 59 8,828 8,887 81 10,357 10,438
Fee and commission income 4 101 105 5 51 56
Fee and commission expense - 2 2 - - -
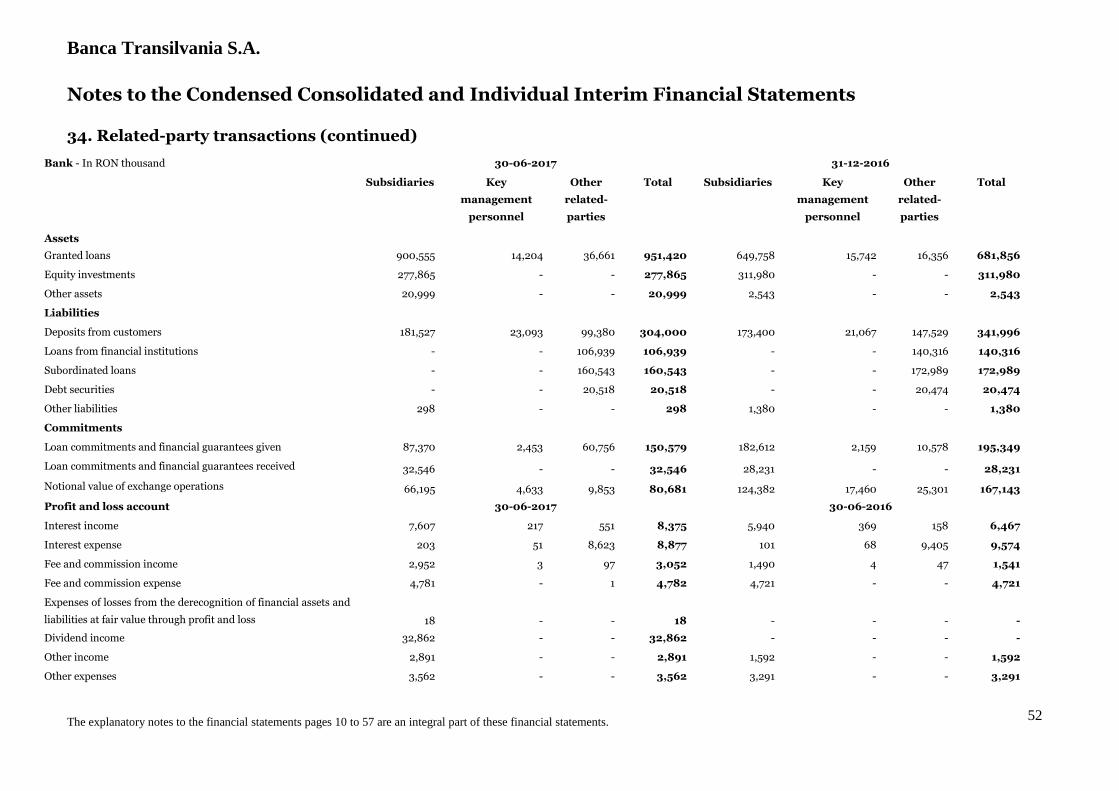
Banca Transilvania S.A.
The explanatory notes to the financial statements pages 10 to 57 are an integral part of these financial statements.
52
Notes to the Condensed Consolidated and Individual Interim Financial Statements 34. Related-party transactions (continued)
Bank - In RON thousand 30-06-2017 31-12-2016
Subsidiaries Key
management
personnel
Other
related-
parties
Total Subsidiaries Key
management
personnel
Other
related-
parties
Total
Assets
Granted loans 900,555 14,204 36,661 951,420 649,758 15,742 16,356 681,856
Equity investments 277,865 - - 277,865 311,980 - - 311,980
Other assets 20,999 - - 20,999 2,543 - - 2,543
Liabilities
Deposits from customers 181,527 23,093 99,380 304,000
173,400 21,067 147,529 341,996
Loans from financial institutions - - 106,939 106,939 - - 140,316 140,316
Subordinated loans - - 160,543 160,543 - - 172,989 172,989
Debt securities - - 20,518 20,518 - - 20,474 20,474
Other liabilities 298 - - 298 1,380 - - 1,380
Commitments
Loan commitments and financial guarantees given 87,370 2,453 60,756 150,579 182,612 2,159 10,578 195,349
Loan commitments and financial guarantees received 32,546 - - 32,546 28,231 - - 28,231
Notional value of exchange operations 66,195 4,633 9,853 80,681 124,382 17,460 25,301 167,143
Profit and loss account 30-06-2017 30-06-2016
Interest income 7,607 217 551 8,375 5,940 369 158 6,467
Interest expense 203 51 8,623 8,877 101 68 9,405 9,574
Fee and commission income 2,952 3 97 3,052 1,490 4 47 1,541
Fee and commission expense 4,781 - 1 4,782 4,721 - - 4,721
Expenses of losses from the derecognition of financial assets and
liabilities at fair value through profit and loss 18 - - 18 - - - -
Dividend income 32,862 - - 32,862 - - - -
Other income 2,891 - - 2,891 1,592 - - 1,592
Other expenses 3,562 - - 3,562 3,291 - - 3,291
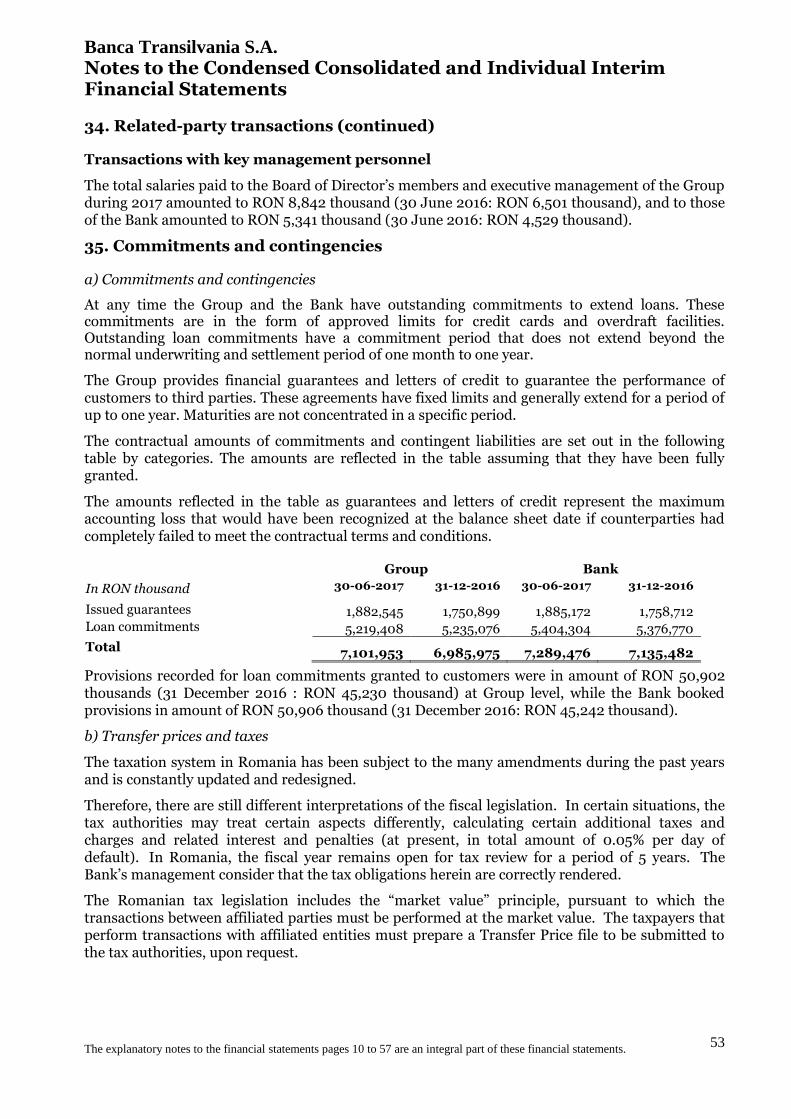
Banca Transilvania S.A.
The explanatory notes to the financial statements pages 10 to 57 are an integral part of these financial statements.
53
Notes to the Condensed Consolidated and Individual Interim Financial Statements
34. Related-party transactions (continued)
Transactions with key management personnel
The total salaries paid to the Board of Director’s members and executive management of the Group during 2017 amounted to RON 8,842 thousand (30 June 2016: RON 6,501 thousand), and to those of the Bank amounted to RON 5,341 thousand (30 June 2016: RON 4,529 thousand).
35. Commitments and contingencies
a) Commitments and contingencies
At any time the Group and the Bank have outstanding commitments to extend loans. These commitments are in the form of approved limits for credit cards and overdraft facilities. Outstanding loan commitments have a commitment period that does not extend beyond the normal underwriting and settlement period of one month to one year.
The Group provides financial guarantees and letters of credit to guarantee the performance of customers to third parties. These agreements have fixed limits and generally extend for a period of up to one year. Maturities are not concentrated in a specific period.
The contractual amounts of commitments and contingent liabilities are set out in the following table by categories. The amounts are reflected in the table assuming that they have been fully granted.
The amounts reflected in the table as guarantees and letters of credit represent the maximum accounting loss that would have been recognized at the balance sheet date if counterparties had completely failed to meet the contractual terms and conditions. Group Bank
In RON thousand 30-06-2017 31-12-2016 30-06-2017 31-12-2016
Issued guarantees 1,882,545 1,750,899 1,885,172 1,758,712 Loan commitments 5,219,408 5,235,076 5,404,304 5,376,770
Total 7,101,953 6,985,975 7,289,476 7,135,482
Provisions recorded for loan commitments granted to customers were in amount of RON 50,902 thousands (31 December 2016 : RON 45,230 thousand) at Group level, while the Bank booked provisions in amount of RON 50,906 thousand (31 December 2016: RON 45,242 thousand).
b) Transfer prices and taxes
The taxation system in Romania has been subject to the many amendments during the past years and is constantly updated and redesigned.
Therefore, there are still different interpretations of the fiscal legislation. In certain situations, the tax authorities may treat certain aspects differently, calculating certain additional taxes and charges and related interest and penalties (at present, in total amount of 0.05% per day of default). In Romania, the fiscal year remains open for tax review for a period of 5 years. The Bank’s management consider that the tax obligations herein are correctly rendered.
The Romanian tax legislation includes the “market value” principle, pursuant to which the transactions between affiliated parties must be performed at the market value. The taxpayers that perform transactions with affiliated entities must prepare a Transfer Price file to be submitted to the tax authorities, upon request.
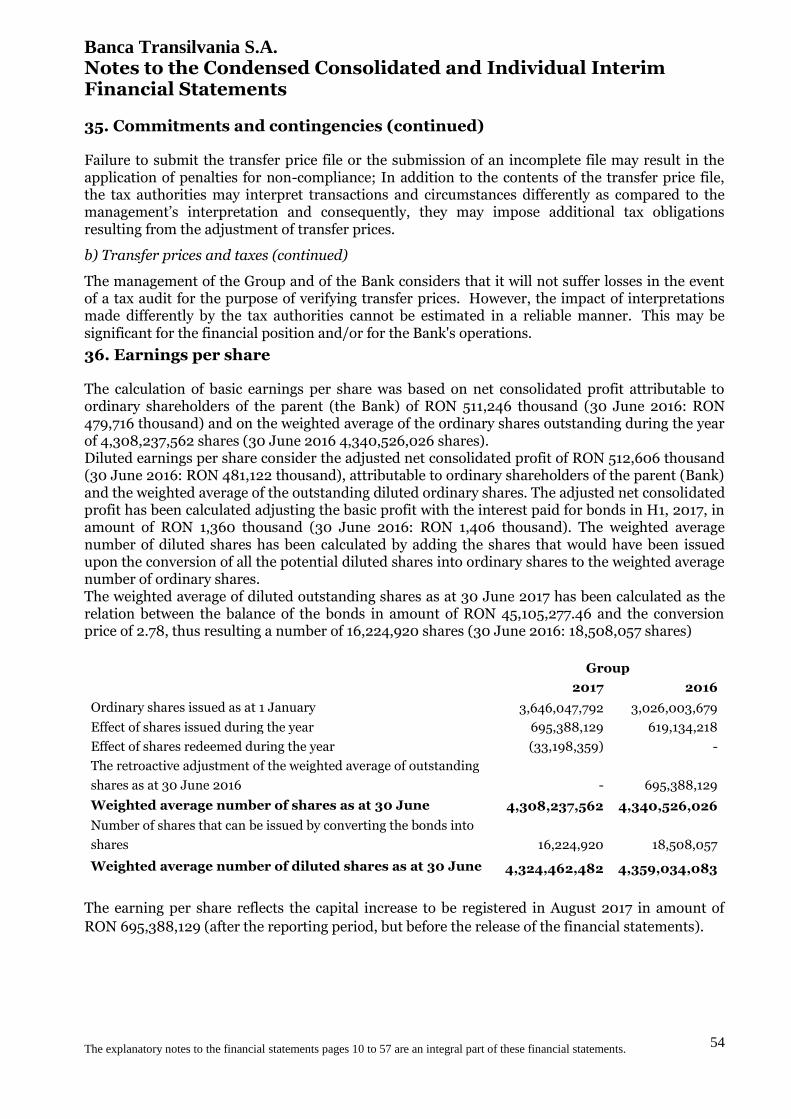
Banca Transilvania S.A.
The explanatory notes to the financial statements pages 10 to 57 are an integral part of these financial statements.
54
Notes to the Condensed Consolidated and Individual Interim Financial Statements
35. Commitments and contingencies (continued)
Failure to submit the transfer price file or the submission of an incomplete file may result in the application of penalties for non-compliance; In addition to the contents of the transfer price file, the tax authorities may interpret transactions and circumstances differently as compared to the management’s interpretation and consequently, they may impose additional tax obligations resulting from the adjustment of transfer prices.
b) Transfer prices and taxes (continued)
The management of the Group and of the Bank considers that it will not suffer losses in the event of a tax audit for the purpose of verifying transfer prices. However, the impact of interpretations made differently by the tax authorities cannot be estimated in a reliable manner. This may be significant for the financial position and/or for the Bank's operations.
36. Earnings per share
The calculation of basic earnings per share was based on net consolidated profit attributable to ordinary shareholders of the parent (the Bank) of RON 511,246 thousand (30 June 2016: RON 479,716 thousand) and on the weighted average of the ordinary shares outstanding during the year of 4,308,237,562 shares (30 June 2016 4,340,526,026 shares). Diluted earnings per share consider the adjusted net consolidated profit of RON 512,606 thousand (30 June 2016: RON 481,122 thousand), attributable to ordinary shareholders of the parent (Bank) and the weighted average of the outstanding diluted ordinary shares. The adjusted net consolidated profit has been calculated adjusting the basic profit with the interest paid for bonds in H1, 2017, in amount of RON 1,360 thousand (30 June 2016: RON 1,406 thousand). The weighted average number of diluted shares has been calculated by adding the shares that would have been issued upon the conversion of all the potential diluted shares into ordinary shares to the weighted average number of ordinary shares. The weighted average of diluted outstanding shares as at 30 June 2017 has been calculated as the relation between the balance of the bonds in amount of RON 45,105,277.46 and the conversion price of 2.78, thus resulting a number of 16,224,920 shares (30 June 2016: 18,508,057 shares)
Group
2017 2016
Ordinary shares issued as at 1 January 3,646,047,792 3,026,003,679
Effect of shares issued during the year 695,388,129 619,134,218
Effect of shares redeemed during the year (33,198,359) -
The retroactive adjustment of the weighted average of outstanding
shares as at 30 June 2016 - 695,388,129
Weighted average number of shares as at 30 June 4,308,237,562 4,340,526,026
Number of shares that can be issued by converting the bonds into
shares 16,224,920 18,508,057
Weighted average number of diluted shares as at 30 June 4,324,462,482 4,359,034,083
The earning per share reflects the capital increase to be registered in August 2017 in amount of
RON 695,388,129 (after the reporting period, but before the release of the financial statements).
Banca Transilvania S.A.
The explanatory notes to the financial statements pages 10 to 57 are an integral part of these financial statements.
55
Notes to the Condensed Consolidated and Individual Interim Financial Statements 37. Capital Management The internal capital adequacy assessment process within Banca Transilvania is part of the administration and management process of the credit institution, of its decision-making culture, which states that the management body ensures the proper identification, measurement, aggregation and monitoring of the institution's risks, and provides for an adequate internal capital in line with the risk profile and the use and development of sound risk management systems. The National Bank of Romania monitors capital requirements both at the Bank and at the Group level. Capital adequacy is determined according to the European Union Regulation (EU) No 575/2013 of the European Parliament and of the Council and impose a minimum mandatory level of own funds level of:
4.5 % for core tier 1 own funds;
6.0 % for tier 1 own funds;
8.0 % for total own funds, Likewise, pursuant to the regulated approaches for the determination of the minimum capital requirements and EU Regulation 575/2013 in correlation with the provisions of NBR’s Regulation no. 5/2013 and considering the capital buffers imposed by the National Bank of Romania, the Bank and the Group maintain:
- the capital preservation buffer in amount of 0.625% of the total value of the risk-weighted exposures between 1 January 2017- 30 June 2017;
- the O-SII buffer in amount of 1% of the total risk weighted exposures
Own funds adequacy
The Bank and the Group use the following calculation methods for required capital allocation:
Credit risk: standardised method;
Market risk: capital requirements with respect to the foreign exchange risk and the trading portfolio are calculated based on the standard method;
Operational risk: capital requirements for the coverage of operational risk are calculated according to the base indicator method.
The Bank and the Group comply with the above regulations, the level of the capital adequacy ratio exceeding the minimum mandatory requirements imposed by the law.
As at 30 June 2017, and 31 December 2016, as well as during the years 2017 and 2016, the Group and the Bank complied with all the capital adequacy requirements.
The Group’s and the Bank’s own funds are based on the applicable legal requirements on regulatory capital and include:
Tier I, which includes subscribed and paid in capital, share premiums, eligible reserves, retained earnings and deductions laid down in the applicable legal provisions;
Tier II, which includes subordinated loans and deductions laid down in the applicable legal provisions;
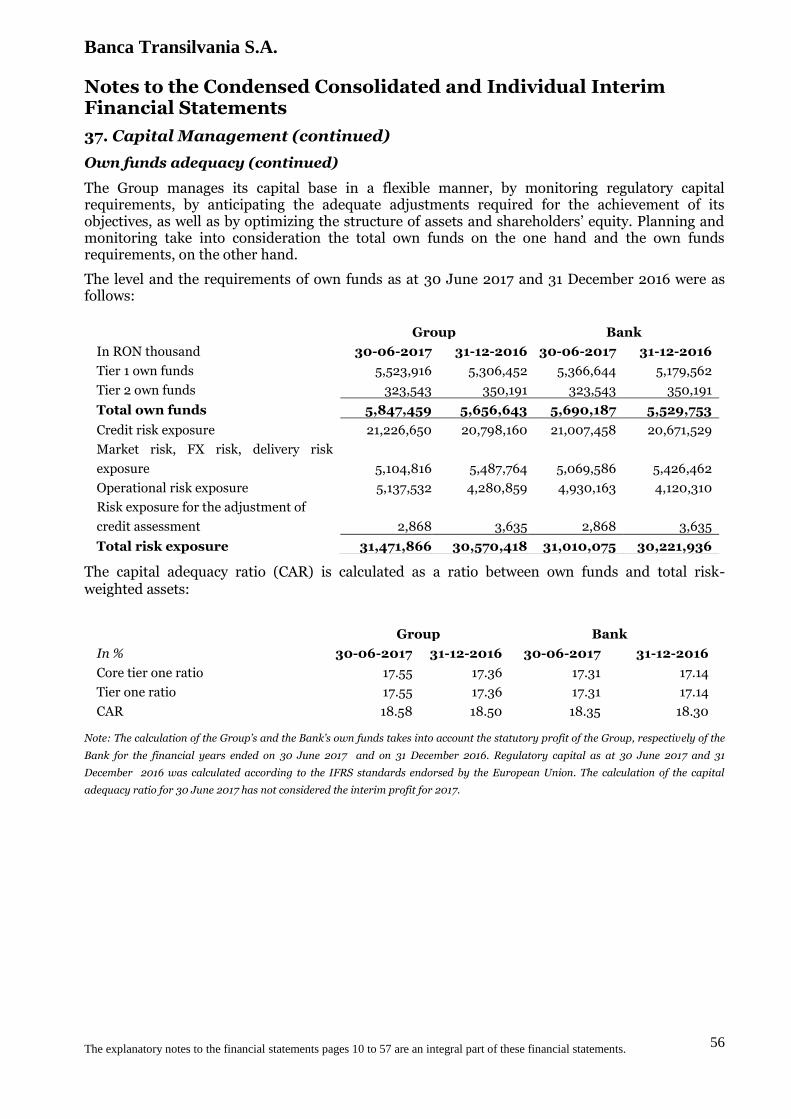
Banca Transilvania S.A.
The explanatory notes to the financial statements pages 10 to 57 are an integral part of these financial statements.
56
Notes to the Condensed Consolidated and Individual Interim Financial Statements
37. Capital Management (continued)
Own funds adequacy (continued)
The Group manages its capital base in a flexible manner, by monitoring regulatory capital requirements, by anticipating the adequate adjustments required for the achievement of its objectives, as well as by optimizing the structure of assets and shareholders’ equity. Planning and monitoring take into consideration the total own funds on the one hand and the own funds requirements, on the other hand.
The level and the requirements of own funds as at 30 June 2017 and 31 December 2016 were as follows:
The capital adequacy ratio (CAR) is calculated as a ratio between own funds and total risk-weighted assets:
Note: The calculation of the Group’s and the Bank’s own funds takes into account the statutory profit of the Group, respectively of the
Bank for the financial years ended on 30 June 2017 and on 31 December 2016. Regulatory capital as at 30 June 2017 and 31
December 2016 was calculated according to the IFRS standards endorsed by the European Union. The calculation of the capital
adequacy ratio for 30 June 2017 has not considered the interim profit for 2017.
Group Bank
In RON thousand 30-06-2017 31-12-2016 30-06-2017 31-12-2016
Tier 1 own funds 5,523,916 5,306,452 5,366,644 5,179,562
Tier 2 own funds 323,543 350,191 323,543 350,191
Total own funds 5,847,459 5,656,643 5,690,187 5,529,753
Credit risk exposure 21,226,650 20,798,160 21,007,458 20,671,529
Market risk, FX risk, delivery risk
exposure 5,104,816 5,487,764 5,069,586 5,426,462
Operational risk exposure 5,137,532 4,280,859 4,930,163 4,120,310
Risk exposure for the adjustment of
credit assessment 2,868 3,635 2,868 3,635
Total risk exposure 31,471,866 30,570,418 31,010,075 30,221,936
Group Bank
In % 30-06-2017 31-12-2016 30-06-2017 31-12-2016
Core tier one ratio 17.55 17.36 17.31 17.14
Tier one ratio 17.55 17.36 17.31 17.14
CAR 18.58 18.50 18.35 18.30
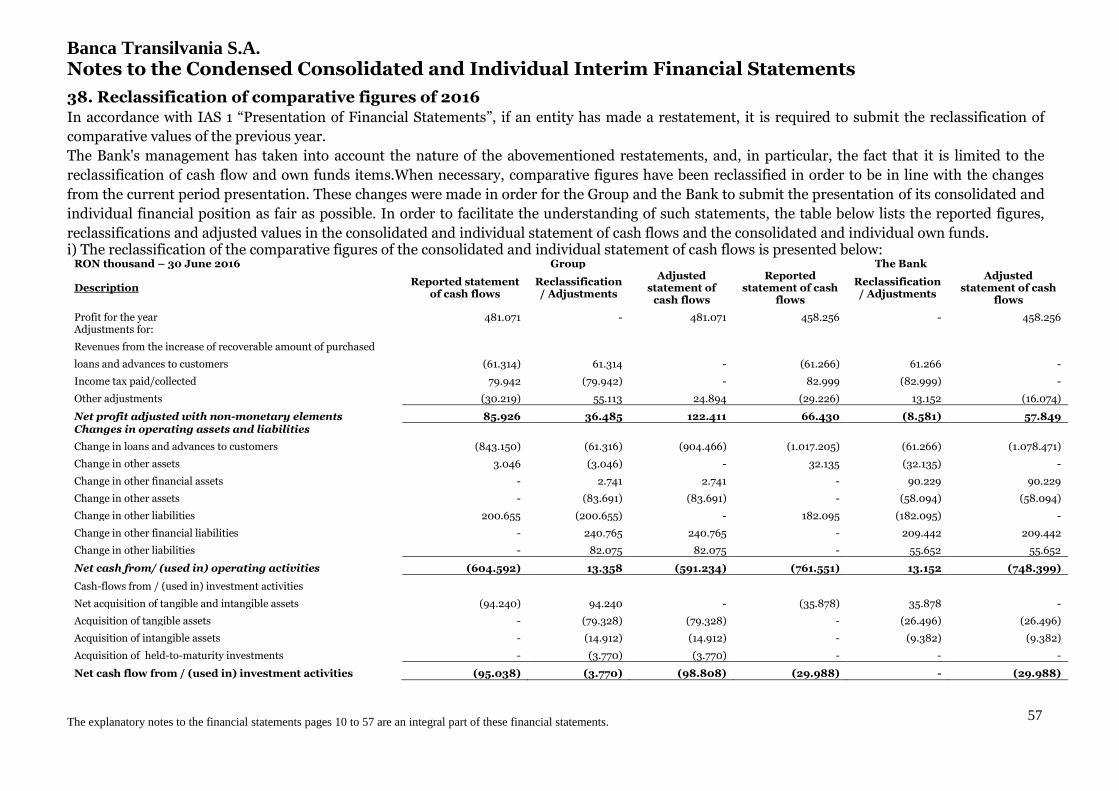
Banca Transilvania S.A.
The explanatory notes to the financial statements pages 10 to 57 are an integral part of these financial statements.
57
Notes to the Condensed Consolidated and Individual Interim Financial Statements
38. Reclassification of comparative figures of 2016
In accordance with IAS 1 “Presentation of Financial Statements”, if an entity has made a restatement, it is required to submit the reclassification of
comparative values of the previous year.
The Bank's management has taken into account the nature of the abovementioned restatements, and, in particular, the fact that it is limited to the
reclassification of cash flow and own funds items.When necessary, comparative figures have been reclassified in order to be in line with the changes
from the current period presentation. These changes were made in order for the Group and the Bank to submit the presentation of its consolidated and
individual financial position as fair as possible. In order to facilitate the understanding of such statements, the table below lists the reported figures,
reclassifications and adjusted values in the consolidated and individual statement of cash flows and the consolidated and individual own funds. i) The reclassification of the comparative figures of the consolidated and individual statement of cash flows is presented below:
RON thousand – 30 June 2016 Group The Bank
Description Reported statement
of cash flows Reclassification / Adjustments
Adjusted statement of
cash flows
Reported statement of cash
flows
Reclassification / Adjustments
Adjusted statement of cash
flows
Profit for the year 481.071 - 481.071 458.256 - 458.256 Adjustments for:
Revenues from the increase of recoverable amount of purchased
loans and advances to customers (61.314) 61.314 - (61.266) 61.266 -
Income tax paid/collected 79.942 (79.942) - 82.999 (82.999) -
Other adjustments (30.219) 55.113 24.894 (29.226) 13.152 (16.074)
Net profit adjusted with non-monetary elements 85.926 36.485 122.411 66.430 (8.581) 57.849 Changes in operating assets and liabilities
Change in loans and advances to customers (843.150) (61.316) (904.466) (1.017.205) (61.266) (1.078.471)
Change in other assets 3.046 (3.046) - 32.135 (32.135) -
Change in other financial assets - 2.741 2.741 - 90.229 90.229
Change in other assets - (83.691) (83.691) - (58.094) (58.094)
Change in other liabilities 200.655 (200.655) - 182.095 (182.095) -
Change in other financial liabilities - 240.765 240.765 - 209.442 209.442
Change in other liabilities - 82.075 82.075 - 55.652 55.652
Net cash from/ (used in) operating activities (604.592) 13.358 (591.234) (761.551) 13.152 (748.399)
Cash-flows from / (used in) investment activities
Net acquisition of tangible and intangible assets (94.240) 94.240 - (35.878) 35.878 -
Acquisition of tangible assets - (79.328) (79.328) - (26.496) (26.496)
Acquisition of intangible assets - (14.912) (14.912) - (9.382) (9.382)
Acquisition of held-to-maturity investments - (3.770) (3.770) - - -
Net cash flow from / (used in) investment activities (95.038) (3.770) (98.808) (29.988) - (29.988)

Banca Transilvania S.A.
The explanatory notes to the financial statements pages 10 to 57 are an integral part of these financial statements.
58
Notes to the Condensed Consolidated and Individual Interim Financial Statements
38. Reclassification of comparative figures of 2016 (continued) i) The reclassification of the comparative figures of the consolidated and individual statement of cash flows is presented below:
RON thousand – 30 June 2016 Group The Bank
Description Reported
statement of cash flows
Reclassifications /
Adjustments
Adjusted statement of
cash flows
Reported statement of
cash flows
Reclassification /
Adjustments
Adjusted statement of
cash flows
Cash flow from/ (used in) the financing activity Net proceeds (payments) from loans from banks and other
financial institutions, subordinated debt and issued bonds, net of payments 275.333 (275.333) - 353.845 (353.845) - * Gross proceeds from loans from banks and other financial institutions - 3.759.455 3.759.455 - 3.759.625 3.759.625 * Gross payments from loans from banks and other financial institutions - (3.484.328) (3.484.328) - (3.405.780) (3.405.780)
Gross payments from subordinated liabilities - (13.152) (13.152) - (13.152) (13.152)
Acquisition of securities held-to-maturity (3.770) 3.770 - - - -
Net cash flow from / (used in) financing activities (916.099) (9.588) (925.687) (833.817) (13.152) (846.969)
In 2016 the Bank and, respectively, the Group recorded reclassifications/adjustments with impact on the comparative figures presented in the Individual and Consolidated Statement for Cash-Flows for the six-months period ended 30 June 2016:
- Presentation of interest collected and paid and, respectively, interest income and expense in the cash-flows from operating activities; - Distinct presentation of cash-flows from financial assets and cash-flows from non-financial assets, in accordance with modifications made to the Statement of
Financial Position; - Distinct presentation of cash-flows from financial liabilities and cash-flows from non-financial liabilities, in accordance with modifications made to the
Statement of Financial Position; - Individual presentation of cash-flows used for the acquisition of tangible and intangible assets; - Individual presentation of gross receipts and payments from borrowings from banks and other financial institutions; - Individual presentation of gross receipts and payments from subordinated loans; - Reclassification of the acquisition of held-to-maturity investments from operating activities to investing activities.
ii) The comparative figures of Own Funds of the Group and Bank, as updated after the approval of the dividend distribution by the General Meeting of Shareholders of 26 April 2017 are presented below:
RON thousand – 31 December 2016 Group The Bank
Description Reported own funds Adjustments Adjusted own funds Reported own funds Adjustments Adjusted own
funds
Tier 1 capital 5,525,452 (219,000) 5,306,452 5,398,562 (219,000) 5,179,562
Tier 2 capital 350,191 0 350,191 350,191 0 350,191
Total capital base 5,875,643 (219,000) 5,656,643 5,748,753 (219,000) 5,529,753
Banca Transilvania S.A.
The explanatory notes to the financial statements pages 10 to 57 are an integral part of these financial statements.
59
Notes to the Condensed Consolidated and Individual Interim Financial Statements
38. Reclassification of comparative figures of 2016 (continued) Following the approval of the Financial Statements for 2016 in the General Meeting of Shareholders of 27 April 2017, the shareholders approved the distribution of dividends in cash in amount of RON 219,000 thousand. This amount has generated the adjustment of own funds for 2016, both at individual and consolidated level, in accordance with the legal provisions, after the publishing of the consolidated and individual financial statements for 2016.
39. Events subsequent to the date of the consolidated financial position On 6 July 2017 the Bank sold a portfolio of non-performing exposures that had been previously written-off, at a price of RON 95.9 million, collected on 24 July 2017. Ӧmer Tetik George Călinescu
CEO Deputy CEO