BAML Global HC Conference London 2019 - Merck Group · Strategic roadmap 2016-2022 Group On track...
104
Belén Garijo, CEO Healthcare September 18, 2019 MERCK – BANK OF AMERICA MERRILL LYNCH GLOBAL HEALTHCARE CONFERENCE 2019
Transcript of BAML Global HC Conference London 2019 - Merck Group · Strategic roadmap 2016-2022 Group On track...

Belén Garijo, CEO HealthcareSeptember 18, 2019
MERCK –BANK OF AMERICA MERRILL LYNCH GLOBAL HEALTHCARE CONFERENCE 2019

Disclaimer
Cautionary Note Regarding Forward-Looking Statements and financial indicatorsThis communication may include “forward-looking statements.” Statements that include words such as “anticipate,” “expect,” “should,” “would,” “intend,” “plan,” “project,” “seek,”“believe,” “will,” and other words of similar meaning in connection with future events or future operating or financial performance are often used to identify forward-looking statements. Allstatements in this communication, other than those relating to historical information or current conditions, are forward-looking statements. We intend these forward-looking statements tobe covered by the safe harbor provisions for forward-looking statements in the Private Securities Litigation Reform Act of 1995. These forward-looking statements are subject to a numberof risks and uncertainties, many of which are beyond control of Merck, which could cause actual results to differ materially from such statements.
Risks and uncertainties include, but are not limited to: the risks of more restrictive regulatory requirements regarding drug pricing, reimbursement and approval; the risk of stricterregulations for the manufacture, testing and marketing of products; the risk of destabilization of political systems and the establishment of trade barriers; the risk of a changing marketingenvironment for multiple sclerosis products in the European Union; the risk of greater competitive pressure due to biosimilars; the risks of research and development; the risks ofdiscontinuing development projects and regulatory approval of developed medicines; the risk of a temporary ban on products/production facilities or of non-registration of products due tonon-compliance with quality standards; the risk of an import ban on products to the United States due to an FDA warning letter; the risks of dependency on suppliers; risks due to product-related crime and espionage; risks in relation to the use of financial instruments; liquidity risks; counterparty risks; market risks; risks of impairment on balance sheet items; risks frompension obligations; risks from product-related and patent law disputes; risks from antitrust law proceedings; risks from drug pricing by the divested Generics Group; risks in humanresources; risks from e-crime and cyber attacks; risks due to failure of business-critical information technology applications or to failure of data center capacity; environmental and safetyrisks; unanticipated contract or regulatory issues; a potential downgrade in the rating of the indebtedness of Merck; downward pressure on the common stock price of Merck and its impacton goodwill impairment evaluations as well as the impact of future regulatory or legislative actions.
The foregoing review of important factors should not be construed as exhaustive and should be read in conjunction with the other cautionary statements that are included elsewhere,including the Report on Risks and Opportunities Section of the most recent annual report and quarterly report of Merck. Any forward-looking statements made in this communication arequalified in their entirety by these cautionary statements, and there can be no assurance that the actual results or developments anticipated by us will be realized or, even if substantiallyrealized, that they will have the expected consequences to, or effects on, us or our business or operations. Except to the extent required by applicable law, we undertake no obligation toupdate publicly or revise any forward-looking statement, whether as a result of new information, future developments or otherwise.
This presentation contains certain financial indicators such as EBITDA pre exceptionals, net financial debt and earnings per share pre exceptionals, which are not defined by InternationalFinancial Reporting Standards (IFRS). These financial indicators should not be taken into account in order to assess the performance of Merck in isolation or used as an alternative to thefinancial indicators presented in the consolidated financial statements and determined in accordance with IFRS. The figures presented in this statement have been rounded. This may leadto individual values not adding up to the totals presented.
2

Disclaimer
Additional Important Information and Where to Find ItThis communication does not constitute an offer to buy or solicitation of an offer to sell any securities. This communication relates to a proposal which Merck Group has made for a businesscombination transaction with Versum Materials, Inc. (“Versum”). In furtherance of this proposal and subject to future developments, Merck Group (and, if a negotiated transaction isagreed, Versum) intends to file relevant materials with the SEC, including a proxy statement on Schedule 14A (the “Proxy Statement”). This communication is not a substitute for the ProxyStatement or any other document Merck Group, Versum or Entegris, Inc. may file with the SEC in connection with the proposed transaction. STOCKHOLDERS OF VERSUM ARE URGEDTO READ ALL RELEVANT DOCUMENTS FILED WITH THE SEC, INCLUDING THE PROXY STATEMENT, BECAUSE THEY WILL CONTAIN IMPORTANT INFORMATION ABOUT THEPROPOSED TRANSACTION. Any definitive Proxy Statement will be delivered to the stockholders of Versum. Investors and security holders will be able to obtain free copies of thesedocuments (if and when available) and other documents filed with the SEC by Merck Group through the website maintained by the SEC at http://www.sec.gov.
Participants in SolicitationMerck Group and its directors and executive officers may be deemed to be participants in the solicitation of proxies from the holders of Versum common stock in respect of the proposedtransaction. Information regarding the participants in the proxy solicitation and a description of their direct and indirect interests, by security holdings or otherwise, will be contained in theProxy Statement and other relevant materials to be filed with the SEC in respect of the proposed transaction when they become available.
3

4
Agenda
Business overview
Transforming the company
Healthcare – Funding for success
Life Science – Focusing on profitable growth
Performance Materials – Maintaining leadership and innovation
Executive summary and guidance

BUSINESS OVERVIEW

Three high-tech businesses competing in attractive markets
Life SciencePerformance
MaterialsHealthcare
Leading life science company
• Tools and services for biotech research & production
• Tools and laboratory supply for academic research and industrial testing
Leading company inhigh-tech solutions
• High-tech solutions and materials for electronics
• Broad portfolio of decorative and functional solutions
Leading in specialty pharma markets
• Biologics and small-molecule prescription medicines against cancer, multiple sclerosis, infertility
• Research focus: Oncology, Immunology & Immuno-Oncology
• Successful portfolio management: e.g. divestment of Consumer Health business
Group
6

7
Strong businesses with attractive margins
Group
FY 2018EBITDA pre2:
€3,800 m
% of sales Margin1 % of EBITDA pre
FY 2018Sales:
€14,836 m
24.9%
29.8%
32.7%
Performance MaterialsLife ScienceHealthcare
37%
44%
19%
42%
16%
1EBITDA pre margin in % of net sales; 2Including Corporate/Others (-€382 m)
42%

TRANSFORMING THE COMPANY

9
Strategic roadmap 2016-2022
Group
On track to deliver on the growth phase of the 2016-2022 strategic agenda
2012-2015 2016-2018 2019-2022
Efficiency
program
Portfolio optimization in LS and PM
Turnaround
in Healthcare
Leadership
in Performance Materials
Sigma
integration
Digital
business modelsNew applications
beyond displays
First pipeline
launches
3 strong pillars
Above-
market growthin Life Science
Fully leverage
pipeline potential
Portfolio management Life Science:
Sustaining above-market growth
Healthcare: Fully leveraging pipeline potential
Performance Materials: On track towards a Bright Future
Group: Sustainable profitable growth and regular portfolio evaluation2019-2022

10
We have added scale and strengthened the attractiveness of our portfolio
Group
Divestments Acquisitions
~€10 bn3
~€30 bn
Transformation volume
Performance Materials
Life Science
+
Millipore & Sigma-Aldrich
+- divested acquired
+
AZ
Healthcare+
Serono
2018: ~€15 bn sales
1Closing of sale of Consumer Health at a cash purchase price of € 3.4 billion completed as of December 1 2018; 2Excluding “Crop Bioscience”, which was divested; 3Profroma divestment volume includes cash proceeds for Consumer Health 4Excluding “Theramex”, which was divested;
merged
Laboratory Business
Life Science Solutions2
Liquid Crystals
Pigments
merged
Generics -
2007: ~€7 bn sales
Ethicals4
Consumer Health1
merged
-
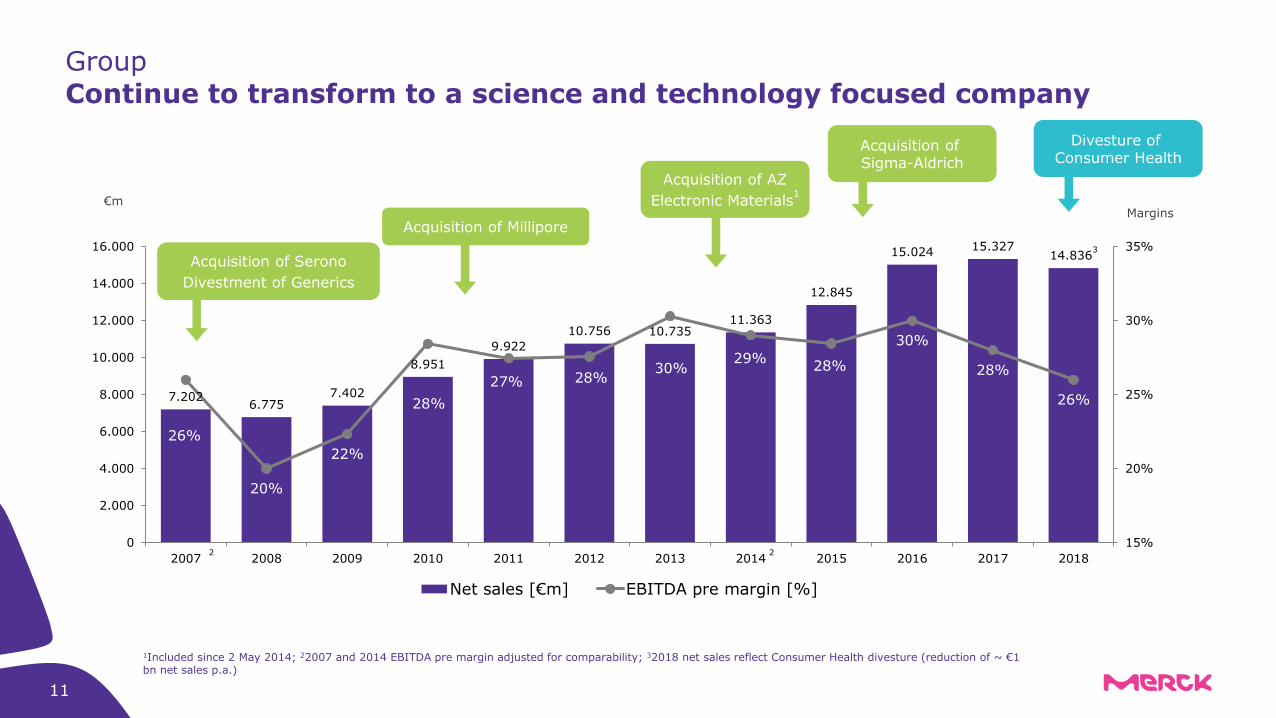
7.2026.775
7.402
8.951
9.922
10.756 10.73511.363
12.845
15.024 15.32714.836
3
26%
20%
22%
28%
27% 28%30%
29%28%
30%
28%
26%
15%
20%
25%
30%
35%
0
2.000
4.000
6.000
8.000
10.000
12.000
14.000
16.000
2007 2008 2009 2010 2011 2012 2013 2014 2015 2016 2017 2018
Net sales [€m] EBITDA pre margin [%]
11
Continue to transform to a science and technology focused company
Group
€mMargins
Acquisition of Millipore
Acquisition of AZ
Electronic Materials1
Acquisition of Serono
Divestment of Generics
1Included since 2 May 2014; 22007 and 2014 EBITDA pre margin adjusted for comparability; 32018 net sales reflect Consumer Health divesture (reduction of ~ €1 bn net sales p.a.)
Acquisition of Sigma-Aldrich
22
Divesture of Consumer Health

12
Clear set of priority goalsGroup
Healthcare
Deliver on ambition to keep core business at least stable until 2022
Transition from investment to earnings phase by 2019
Foster successful Bavencio®
and Mavenclad
®ramp up
Stringent pipeline execution
Life Science
Strengthen position as differentiated player in a highly attractive market
Maintain consistent above-market growth trajectory and superior profitability
Implement dynamic strategy for future profitable growth
PerformanceMaterials
Deliver on growth ambition of 2-3% CAGR
Implement 5-year transformation program
Ensure efficient resource allocation to reach financial ambition of 30% margin
Maintain strong cash generation and cash conversion
EBITDApre*
~37%EBITDA
pre*
~44%EBITDA
pre*
~19%
*based on FY 2018 reported EBITDA pre, excluding Corporate & Other

Three balanced pillars with no business marginalized
Leading market positions in attractive markets
Clear portfolio roles assigned
GroupStrategic capital allocation until 2022 newly defined
PM
HC
LS
Illustration Merck’s sales
and earnings drivers
Regular portfolio review and disciplined capital allocation will continue to ensure sufficiently diversified and value-creating structure of three strong pillars
Bolt-ons and in-licensing Larger acquisitions
2018 2022
Portfolio Guardrails
IRR > WACC
EPS pre accretive
Maintain investment-grade credit rating
Clear financial
M&A criteria
Defining portfolio criteria
Market attractiveness & capabilities
Best strategic owner
Risk profile
13

HEALTHCAREFully leveraging pipeline potential
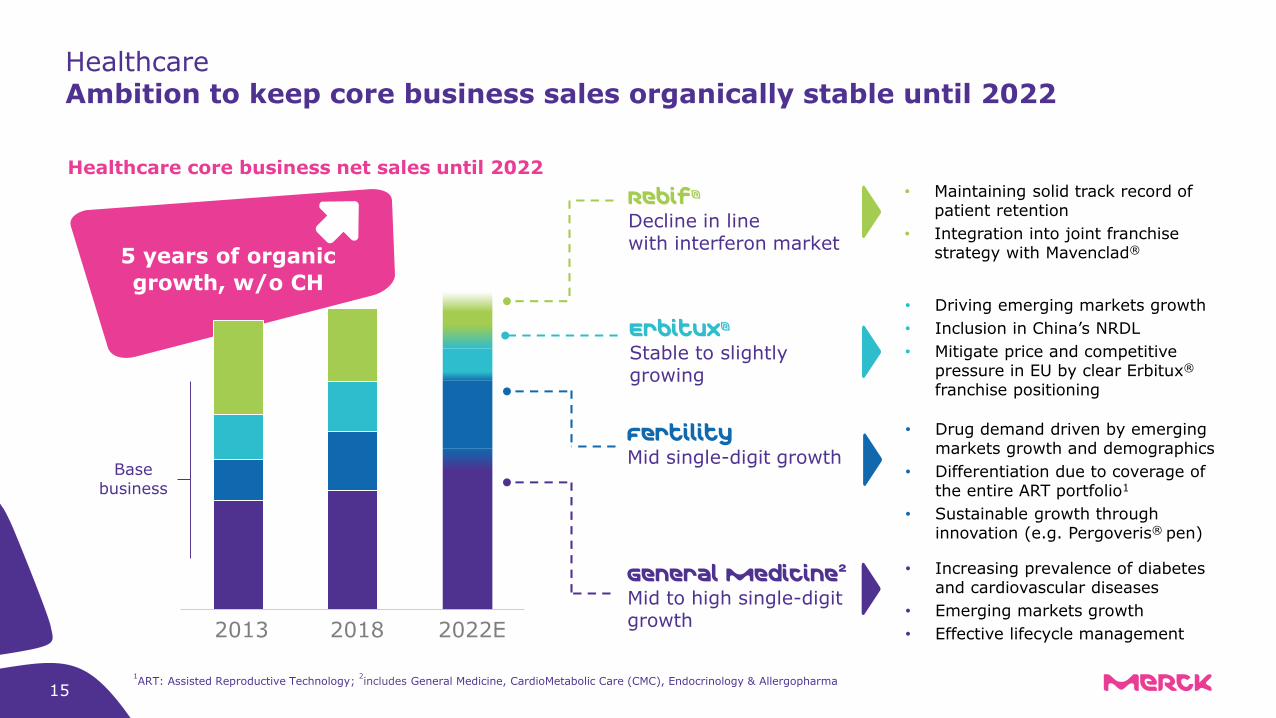
Healthcare core business net sales until 2022
• Maintaining solid track record of patient retention
• Integration into joint franchise strategy with Mavenclad®
• Driving emerging markets growth
• Inclusion in China’s NRDL
• Mitigate price and competitive pressure in EU by clear Erbitux®
franchise positioning
• Drug demand driven by emerging markets growth and demographics
• Differentiation due to coverage of the entire ART portfolio1
• Sustainable growth through innovation (e.g. Pergoveris® pen)
• Increasing prevalence of diabetes and cardiovascular diseases
• Emerging markets growth
• Effective lifecycle management2018 2022E2013
Rebif®
Decline in line with interferon market
Erbitux®
Stable to slightlygrowing
Fertility Mid single-digit growth
General medicine2
Mid to high single-digit growth
Base business
151ART: Assisted Reproductive Technology;
2includes General Medicine, CardioMetabolic Care (CMC), Endocrinology & Allergopharma
5 years of organic
growth, w/o CH
HealthcareAmbition to keep core business sales organically stable until 2022

HealthcareMavenclad® and Bavencio® launches on track for €2 bn pipeline sales ambition
ILLUSTRATIVE - Not to scale; Acronyms: BTD = Breakthrough Designation16
Mavenclad®
Bavencio®
Tepotinib
Approved in 69 countries, including USA, EU, Canada and Australia
FY2019E: up to mid-triple digit €m(H1 2019: €105 m)
Global peak sales: €1–1.4 bn
• FY2019E: high double digit €m (H1 2019: €45 m)
• Approved for aRCC (USA), mMCC (50 countries incl. USA and EU), and UC 2L (USA, Canada, Israel)
• Several Phase III trial read outs remaining
Filing in Japan and USA as of 2020(Sakigake designation in JP, BTD in USA)

17
Mavenclad® continuing to make launch progress in 69 countries
Healthcare
• Positive, early payer acceptance:
• Leading share of voice4
• ~ 86% of neurologists willing to prescribe5
• Broad spectrum of early adopters6
• Mavenclad® with ~ 7% of high efficacy dynamic share7 (new + switch, RRMS and active SPMS, May to July)
USAApproved on March 29, 2019
• Approved in 69 countries (reimbursed in ~50%)
• Continuous improvement of clinical perception1
• Increasing share of high-efficacy dynamic patients (new + switch) in major launch markets vs LY
• Germany: from 9% to 14% (Q1/18 vs Q1/19) 2
• UK: from 8% to 20% (Q1/18 vs Q1/19) 3
• Increasing use in earlier lines of therapy
On track for up to mid-triple digit €m sales in 2019
100% = total USA population
~190M lives with no NDC block
Ex-USA
1: Global MAVENCLAD ATU; 2: IQVIA LRx data, consolidated retail + hospital data; 3: IQVIA HMSL data; 4: IQVIA/BrandImpactRx Report, rolling 3 months end July 2019; 5: Spherix Global Insights RealTime Dynamix – MS Q2/19; 6: MSLifelines Service Request Forms, IQVIA Claims data, Global ATU Q2, 2019; 7: Source: IQVIA/BrandImpactRx Report, rolling 3 months end July 2019, 17 weeks post approval; Acronyms: HE = High Efficacy, NDC = National Drug Code, RRMS = Relapsing-Remitting Multiple Sclerosis, SPMS = Secondary Progressive MS
Healthcare
18
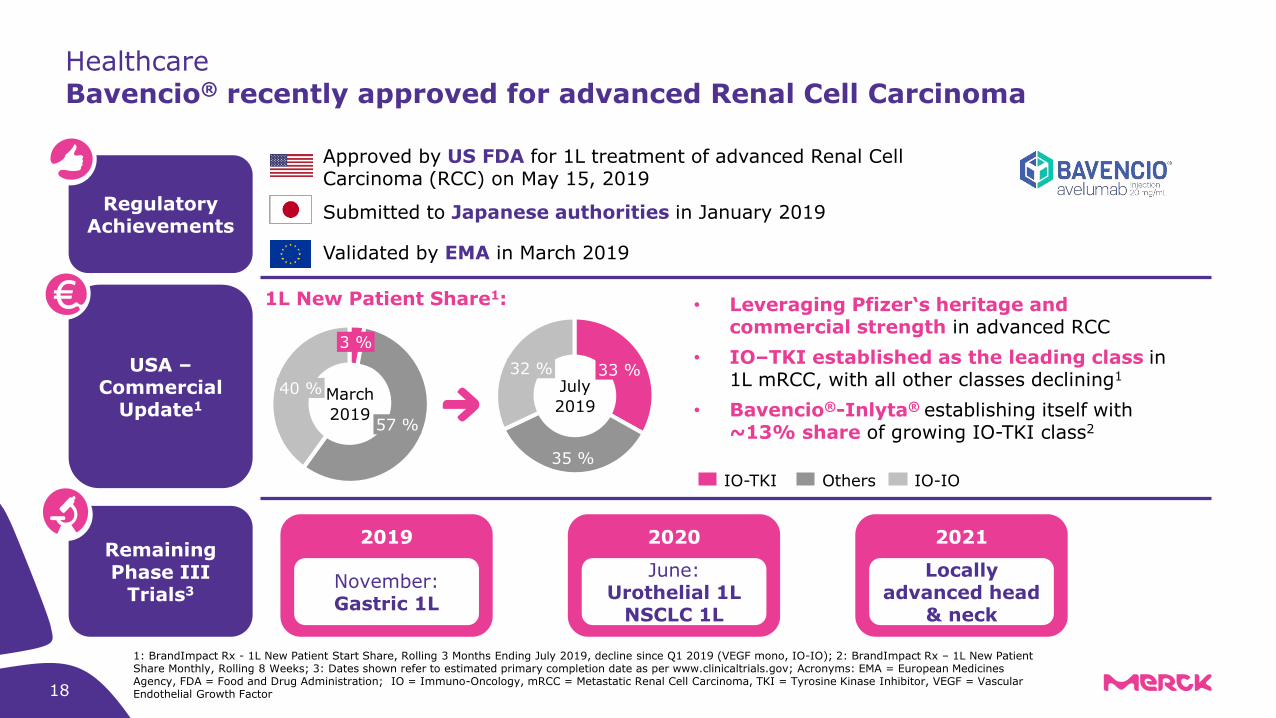
Bavencio® recently approved for advanced Renal Cell Carcinoma
Regulatory Achievements
Approved by US FDA for 1L treatment of advanced Renal Cell Carcinoma (RCC) on May 15, 2019
Submitted to Japanese authorities in January 2019
Validated by EMA in March 2019
USA –Commercial
Update1
• Leveraging Pfizer‘s heritage and commercial strength in advanced RCC
• IO–TKI established as the leading class in 1L mRCC, with all other classes declining1
• Bavencio®-Inlyta® establishing itself with ~13% share of growing IO-TKI class2
Remaining Phase III
Trials3
2019
November: Gastric 1L
2020
June: Urothelial 1L
NSCLC 1L
2021
Locally advanced head
& neck
35 %
33 %32 %
3 %
57 %
40 %
IO-TKI IO-IOOthers
July
2019March
2019
1L New Patient Share1:
1: BrandImpact Rx - 1L New Patient Start Share, Rolling 3 Months Ending July 2019, decline since Q1 2019 (VEGF mono, IO-IO); 2: BrandImpact Rx – 1L New Patient Share Monthly, Rolling 8 Weeks; 3: Dates shown refer to estimated primary completion date as per www.clinicaltrials.gov; Acronyms: EMA = European Medicines Agency, FDA = Food and Drug Administration; IO = Immuno-Oncology, mRCC = Metastatic Renal Cell Carcinoma, TKI = Tyrosine Kinase Inhibitor, VEGF = Vascular Endothelial Growth Factor

Q3 2019 Q4 2019 H1 2020
HealthcareA year of continued pipeline development ahead1
1 Note: All timelines are event-driven and may be subject to change; 2 proposed International Nonproprietary Name (INN); Acronyms: BTC = Biliary Tract Cancer, BTKi = Bruton‘s Tyrosine Kinase Ínhibitor, FDA = US Food & Drug Administration, IA = Interim Analysis, MS = Multiple Sclerosis, NSCLC = Non-small Cell Lung Cancer, RA = Rheumatoid Arthritis, SLE = Systemic Lupus Erythematosus, TNBC = Triple-Negative Breast Cancer19
Neurology
Oncology
Immuno-Oncology
Initiation of PhIII trial (MS)
Evobrutinib(BTK-inhibitor)
Initiation of additional studies including 1L BTC (posted on ct.gov), TNBC and HPV related cancers
Bintrafusp alfa2
(Anti-PD-L1/TGF-ß-Trap)
Expected presentation of Phase II data (SLE and RA)
Evobrutinib (BTK-inhibitor)
Immunology
Expected presentation of PhIII data (Gastric 1L)
Bavencio®
(Avelumab/Anti-PD-L1)
Presentation of 18-months data from INSIGHT 1 trial at WCLC(NSCLC, EGFR-mutant)
Tepotinib(c-Met–inhibitor)
Initiation of INSIGHT 2 trial (NSCLC, EGFR-mutant)

LIFE SCIENCEFocus on profitable growth

The Life Science market is driven by distinct sustainable trends
Life Science market
~€170 bn, ~4-6% CAGR10
Research Process Applied
v v~€45-50 bn~2-3% CAGR9
~€55-60 bn~8% CAGR9
~€60-65 bn~4-5% CAGR9
• Increase in NIH Funding and Pharma R&D1,2
• Increase in novel technologies3
• Increase in research outsourcing4
• Increase in biologics pipeline5
• More novel modalities(>30% CAGR)
• Greater productionoutsourcing6
• Higher Drug standards (e.g. in China)7
• Tighter F&B regulations(e.g. US FSMA8)
• More novel assays/diagnostics
21
1: CAGR 2015-2019; 2: PhRMA members, CAGR 2013-2017; 3: CAGR 2014-2018 VC investment into platform technologies; 4: CAGR 2015-2022. Discovery outsourcing market; 5: CAGR through 2020, 6. CAGR 2016-2020; 7: International Council for Harmonisation of Technical Requirements for Pharmaceuticals for Human Use, 8: Food Safety Modernization Act implementation through 2024; 9: Total market CAGR; 10: Company estimate based on industry forecast over 5 year horizon; Acronyms: NIH = National Institutes of Health, US FSMA = FDA Food Safety Modernization Act
Life Science

Life Science
Business is on track to deliver above-market organic growth
27%
33%
40%FY 2018€6.2 bn
Process SolutionsHigh single digit growth
Applied SolutionsMid single digit growth
Research SolutionsLow single digit growth
Regulation: testing volumes overall are rising globally rise in quality standards and increased demand for testing across customer segments
Population and economic growth: demand for access to more sophisticated products and services rises, e.g. in emerging markets
Speed: need for fast testing results raises requirements for Applied customers, esp. in clinical testing and food & beverage testing
Research activity: >3,000 projects in research pipelines2, rising
number of experiments and newly emerging therapies/technologies backs healthy growth in biotech and CROs
3
Public and private funding: availability, access and predictability drive demand from academia and emerging biotech customers
Regulation: rising requirements foster long-term customer partnerships
Food&beverage
Environmental
Diagnostics
Market1
Academia & Government
Pharma & Biopharma
Emerging Biotech
Market1
BioProcessing
Pharma
Services
Merck4
Merck Life ScienceLong-term growth drivers
1Source: Merck Factbook;
2Source: PhRMA;
3CRO = Contract Research Organization;
4Indicative only;
5mAbs = monoclonal antibodies;
6Source: EvaluatePharma September 2018
Biologics: mAbs production5
growing by ~11-15% p.a. for 2018-2024 driven by new molecules and biosimilars
Diversification: contribution by top 10 molecules will decline to ~20% until 2024 from 60% today
6
Noval modalities: innovation in complex-to-deliver therapies, e.g. gene and cell therapy, will drive demand for single-use, end-to-end and new technology solutions
22

Above-market growth continues to be driven by portfolio focus
~€170 bn
~4-6% CAGR1
+50-100 bps
+50-100 bps
~5-8% CAGR
23 1: Company estimate based on industry forecast over 5 year horizon
Life Science

Grow above market
Maintain industry-leading profitability with 20-30 bps underlying margin progression
Sustain leading market position
Merck continues to set the benchmark for industry performance
MeRck Life science Leading competitor 2
24.125.5
24.2
29.2
25.3
30.4
31.2
29.8
22.2
24.2 23.1 24.6 24.9 25.125.1
EBITDA pre margin,
% of sales(actual)
Organic sales growth,
YoY %
20182016
9.2
2015
4.2
2017 20152019
H1
2016 2017 2018 2019
H1
2015
6.3
2016
5.2
2017
6.51
2018 2019
H1
5.3
8.8
3.0 3.0 3.3
6.05.5
4.8
8.0
6.1
Objective
Leading competitor 1
2
24 1: 6.5% for Merck Millipore; 6.0% for SIAL calculated from first 9 months of 2015; 2: excl. CO
Life Science

External recognition
Investing into innovation for future profitable growth
2013 2015 2017 2019 planned
Sales from recent launches1
% of net sales
New product sales doubled in the past 5 years
2019: Exhibitor Award for Best New Product (Pellicon® Capsule
with Ultracel® Membrane)
2018: Exhibitor Award for Best Technological Innovation
(Millistak+® HC Pro portfolio)
2018: BioReliance® Viral & Gene Therapy Assay Portfolio & Proxy-CRISPR Technology
2018: Corporate Social Responsibility
2017: Sanger Arrayed Lentiviral CRISPR Libraries
2018: Excellence in innovation Parteck® MXP
Excipient & modified amino acid
x~2
25 1: Launches from last 4+1 years excluding sales of year of launch
Life Science

Inorganic – Transformative M&As and bolt-ons for strategic growthOrganic –
Global capacity expansion
Strategic alliances –Exploring novel growth opportunities
Asia: e.g. manufacturing and distribution centers in South Korea, China and India (2018)
North America: e.g. BioReliance®
End-to-End Biodevelopment Center in Burlington, USA (2018)
Europe: e.g. M LabTM Collaboration Center in Molsheim, France (2019)
• Broad Institute (MIT and Harvard) (2019) –accelerating access to CRISPR intellectual property for research
• TRANSVAC2 (part of EU‘s Horizon 2020) (2019) –advancing vaccine development and manufacturing
• GenScript (2019) –accelerating Cell and Gene Therapy industrialization in China
2010: Millipore (US$7 bn)
2015: Sigma-Aldrich (US$17 bn)
2017: BioControl – Food Safety Testing
…
Leveraging both organic and inorganic levers for growth
26
Life Science

Best-in-class eCommerce
Continued enhancements driven by focus on …
Content – Informative content with easy access
Geographic fit – Tailored to local preferences
Scalability – Best-in-class site
Connectivity – Enabling dialogue within the scientific community
Leading Life Science
website
• >€1.5 bn sales
• >420 million annual page views
• Rated #1 website for traffic1
Strengthening the #1 eCommerce site in Life Science through increased agility and greater customer-centricity
271: Rated by external service SimilarWeb
Life Science

PERFORMANCE MATERIALSMaintaining leadership and innovation

Electronics market
~€1,250 bn
CAGR 18-25: ~4%
Electronic materials competitor landscape1
Semiconductor market
~€380 bn
CAGR 18-25: ~5%
Display market
~€125 bn
CAGR 18-25: ~-1%
Materials market
~€48 bn
CAGR 18-25: ~-1%
Materials market
~€38 bn
CAGR 18-25: ~3%
A leading player in the electronic materials market
Illustration of the electronics market and thereof its selected sub markets1Bubble size in competitive landscape illustrates share of semiconductor
and display material sales of indicated competitors (C1 – C14)
1Source: Linx 2018, Research & Markets 2017, Semi 2015, McClean/IC Insights 2018, IC insights, Gartner 2017, Prismark 2018, FujiChimera, IHS, Market size as of 2017
C4
C1
C7C10
C5
C3
C2C6
C8C9
C11
C12
C13
C14
Performance Materials
29

Integrated Circuit Materials
Display Materials
Pigments and Functional Materials
Performance Materials Three high-tech pillars serving a diverse customer base
~25%
~55%
~20%
% sales FY2018 Products
Dielectrics, colloidal silica, lithography materials, yield enhancers, edge-bead removers
Polyimide raw materials and printing materials
Liquid crystals (LC) and photoresists for TVs, smartphones and tablet computers
Other display and non-display applications (e.g. LC Windows)
Organic and inorganic light emitting diodes
Effect pigments and functional materials for coatings, plastics, printing and cosmetics
Functional materials for cosmetics & special applications
Functional materials for electronics and energy solutions
Business allocation within Performance Materials
DisplaySolutions
Semiconductor Solutions
SurfaceSolutions
30

Cultural change
2018 2019 2020 2021 2022+
Back to organic Growth
Portfolio management
2-3% CAGR
Resource allocation & process excellence~30% Margin
Cultural change addressed in three dedicated initiatives focused on customer centricity, market-driven innovation and corporate culture
Site closures in Atsugi, Japan (2021) and Chilworth, UK (2019) announced
Outsourcing progressing; reduction of LC production capacity in Darmstadt until 2022 announced
Cost saving measures ahead of plan; target of approx. 500 FTE worldwide until 2022
Acquisition of Versum Materials and Intermolecular expected to close in H2 2019
Implement 5-year transformation program
Performance Materials 5-year transformation program Bright Future is well on track
Significant changes in composition of leadership team
31

32
Growth potential
Profitability
Build/Partner
e.g. Display Solutions:
LC-Windows
Manage for cash
Display Solutions: LC
Surface Solutions
Divest
Invest for growth
Semiconductor Solutions;
OLED
Invest for growth
Strong and sustainable market growth
Leading positions and attractive growth opportunities
Manage for cash
Mature and lucrative market segments
Invest in extension, while managing for profit
Build or Partner
Early industry cycles with strong potential
Strictly prioritize and diversify risk
Divest
Regular review for better strategic owner
Business portfolio management drives capital allocation and enables future value creation
Performance Materials

Strategic roadmap starting to materialize…
Performance Materials
33
Both transactions are expected to close in H2
2019
Leading supplier of high-purity process chemicals, gases and equipment serving semiconductor manufacturers
Track record of accelerated growth and industry leading profitability
➢ Creating a leading electronic materials player with attractivelong-term prospect
Leading in advanced materials innovation
Acquisition to strengthen semiconductor technology offering
➢ Application specific materials expertise with that perfectly complement Group’s business and technology portfolio
Measures for a bright future
Atsugi
Shut down of Performance Materials activities at Atsugi site started (to be completed during 2021)
R&D and production activities in Atsugi transferred and consolidated in other PM locations in Asia
Consolidation of site structure in Japan
Bottom-line management to support margin ambition of
30% in the long-term
Darmstadt
The focus in Darmstadt will be on R&D and production
Immediate bottom line contributionfrom 2019 onwards
Reduce the number of FTEs by ~15%= ~400 FTEs
Chilworth
Closing of Chilworth site expected during September 2019
34
EB
ITD
Ap
re
marg
in
(%
)
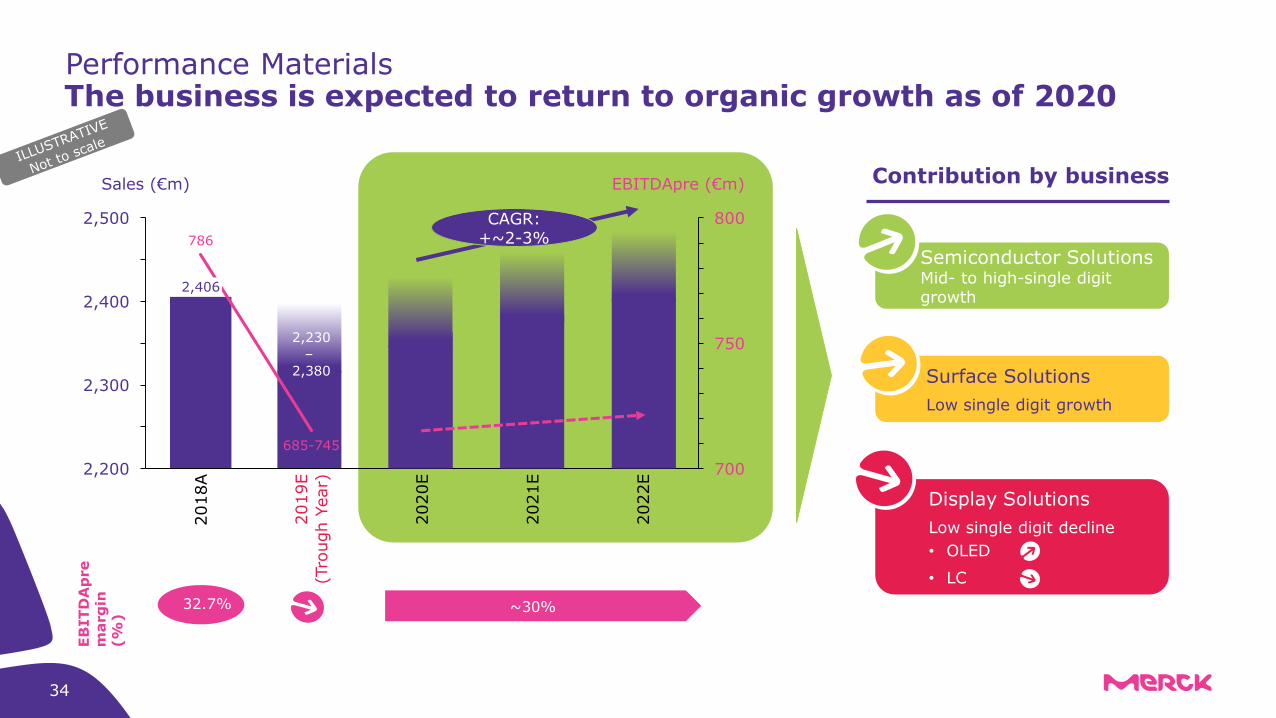
32.7% ~30%
786
2,400
2,200 700
2,300
750
2,500 800
Sales (€m) EBITDApre (€m)2018A
685-745
2019E
(Tro
ugh Y
ear)
2020E
2021E
2022E
2,406
2,230
–
2,380
Contribution by business
Semiconductor SolutionsMid- to high-single digit growth
~30%
Display Solutions
Low single digit decline
• OLED
• LC
CAGR:+~2-3%
Performance Materials The business is expected to return to organic growth as of 2020
Surface Solutions
Low single digit growth

EXECUTIVE SUMMARY ANDGUIDANCE

Key earnings drivers to remember for 2019
36
Group
EBITDA1-reducing factorsEBITDA1-supporting factors
• Strong sales contribution from Mavenclad® ramp-up and Bavencio®
• Ongoing strength in Life Science with 7% to 8% organic above-market net sales growth and 20-30 bps underlying margin progression
• Successful partnering of bintrafusp alfa with ~€100 m of deferred income from upfront payment recognized as other operating income in Q2 to Q4 2019
• Income from milestones and management of pipeline (part of operating business in Healthcare) materializing in Q2 and Q4 2019
• Lower expected license payments for Erbitux®
• High level of cost consciousness and prioritization
• Adoption of IFRS 16 contributes ~€130 m2
to organic growth YoY
• Positive FX impact: Emerging market currencies remain weak but offset by favorable EUR/USD development (range 2019: 1.12-1.16)
• About stable R&D costs budgeted for Healthcare and decrease as % of sales (actual development will be subject to clinical data outcome of priority projects and prioritization decisions)
• Healthcare underlying margins negatively impacted by product mix
• Performance Materials sales and earnings reaching trough due to expected decline in Liquid Crystals in H2; economic environment may lead to moderate decline in Semiconductors, returning to growth in 2020
1EBITDA pre;
2~€130m contribution from IFRS 16 (Healthcare ~40%, Life Science ~40%, PM ~10%, CO ~10%)

Full-year 2019 guidance1
Group
1Merck stand-alone, i.e. without acquisition of Versum Materials and Intermolecular Inc.;
2Incl. ~€130 m YoY contribution from adoption of IFRS 16 (Healthcare ~40%,
Life Science ~40%, PM ~10%, CO ~10%); 3CO guidance 2019: -€420 m to -€480 m (assuming FX adjusted CO costs -€390 m to -€400 m)
Net sales: Organic +3% to +5% YoY
FX ~ 0% to +2% YoY
~ € 15.3 – 15.9 bn
EBITDA pre: Organic +10% to +13% YoY
2
FX 0% to +2% YoY
~ € 4,150 – 4,350 m3
EPS pre: ~ € 5.30 – 5.65
37


2019 business sector guidance1
Group
39
▪ Organic -9% to -13% YoY▪ FX +1% to +4% YoY▪ ~ €685 – 745 m
▪ Organic +11% to +13% YoY▪ FX +0% to +2% YoY▪ ~ €2,020 – 2,120 m with 20-30 bps
3
underlying margin progression
▪ Organic growth +7% to +8%, above expected market growth
▪ Main growth driver Process Solutions but all businesses contributing
▪ Organic +19% to +23% YoY▪ FX -1% to +2% YoY▪ ~ €1,830 – 1,940 m
EBITDA pre2
▪ Solid organic growth +4% to +6%▪ Base business at least stable organically▪ Strong contributions from launches
including Mavenclad®
Life SciencePerformance
MaterialsHealthcare
Net sales
EBITDA pre2
Net sales
EBITDA pre2, 4
Net sales
1Divisional guidances are only support to the group guidance and do not have to add up;
2Incl. ~€130 m YoY contribution from adoption of IFRS 16 (Healthcare ~40%, Life
Science ~40%, PM ~10%, CO ~10%); 3bps = basis points;
4Merck stand-alone, i.e. without acquisition of Versum Materials and Intermolecular Inc.
▪ Organic decline -4% to -7%▪ LC resuming decline, following temporary
capacity ramp-up in China▪ Economic environment may lead to
moderate decline in Semiconductor,return to growth in 2020

Additional financial guidance 2019
Further financial details
Corporate & Other EBITDA pre1
Effective tax rate
Capex on PPE
Hedging/USD assumption
2019 Ø EUR/USD assumption
FY 2019 hedge ratio ~60% at EUR/USD ~1.20
~ 1.12 – 1.16
~ -€420 – -480 m
~ 24% to 26%
~ €1.1 bn – 1.2 bn
Interest result2
~ -€260 – -280 m
40
1CO guidance 2019: -€420 m to -€480 m (assuming FX adjusted CO costs -€390 m to -€400 m);2Interest result includes Versum Materials financing expenses

Maturity profile reflects Sigma-Aldrich and Versum financing transactions
Balanced maturity profile in upcoming years avoids refinancing risks and provides sufficient flexibility for deleveraging
1No decision on call rights taken yet;
2EUR bonds had been placed at July 1st, 2019
41
Maturity profile as of June 30, 2019
800
1.350
550 600 600800
750
1.000
1.60070
1.000
500
1000
2019 2020 2021 2022 2023 2024 2025 2026 2027 2028 2029 2030 2031
EUR bonds USD bonds Private placements Hybrids (first call dates)
2.400%4.500%
2.625%1.625%3.375%4.250%
0.750%
2.950%1.375% 3.250%
Coupon
[€ m/US $]
0.005% 0.375%
2.875%
0.875%
500
1
2 2 2

0.750.85
0.951.00
1.05
1.201.25 1.25
2011 2012 2013 2014 2015 2016 2017 2018
1Adjusted for share split, which has been effective since June 30, 2014; 2Calculated with 2017 EPS pre of € 6.16, while ex CH EPS pre € 5.92 posts 21.1% payout ratio; 3Calculated with 2018 year-end share price of € 89.98 per share
Stable dividend amid lower EPS pre
•Dividend of €1.25 per share for 2018
• Increase in payout ratio to 24.5% of EPS pre in 2018 vs. 20.3% in 2017
2
•Dividend yield3
of 1.4%
Dividend1 development 2011-2018 2018 dividend
2111
42
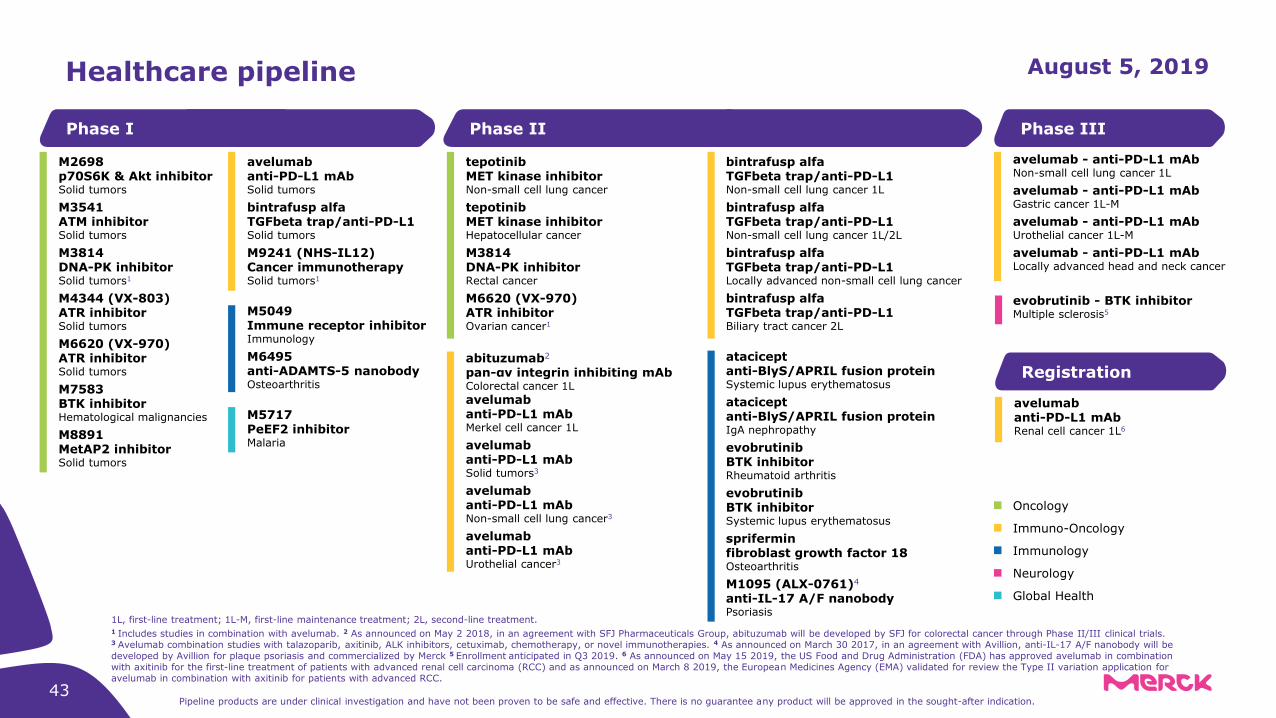
Healthcare pipeline August 5, 2019
43
1L, first-line treatment; 1L-M, first-line maintenance treatment; 2L, second-line treatment. 1 Includes studies in combination with avelumab. 2 As announced on May 2 2018, in an agreement with SFJ Pharmaceuticals Group, abituzumab will be developed by SFJ for colorectal cancer through Phase II/III clinical trials.3 Avelumab combination studies with talazoparib, axitinib, ALK inhibitors, cetuximab, chemotherapy, or novel immunotherapies. 4 As announced on March 30 2017, in an agreement with Avillion, anti-IL-17 A/F nanobody will be developed by Avillion for plaque psoriasis and commercialized by Merck 5 Enrollment anticipated in Q3 2019. 6 As announced on May 15 2019, the US Food and Drug Administration (FDA) has approved avelumab in combination with axitinib for the first-line treatment of patients with advanced renal cell carcinoma (RCC) and as announced on March 8 2019, the European Medicines Agency (EMA) validated for review the Type II variation application for avelumab in combination with axitinib for patients with advanced RCC.
Pipeline products are under clinical investigation and have not been proven to be safe and effective. There is no guarantee any product will be approved in the sought-after indication.
tepotinibMET kinase inhibitor Non-small cell lung cancer
tepotinibMET kinase inhibitorHepatocellular cancer
M3814DNA-PK inhibitorRectal cancer
M6620 (VX-970)ATR inhibitorOvarian cancer1
abituzumab2
pan-αν integrin inhibiting mAbColorectal cancer 1L
avelumabanti-PD-L1 mAbMerkel cell cancer 1L
avelumabanti-PD-L1 mAbSolid tumors3
avelumabanti-PD-L1 mAbNon-small cell lung cancer3
avelumabanti-PD-L1 mAbUrothelial cancer3
Phase II
avelumabanti-PD-L1 mAbSolid tumors
bintrafusp alfaTGFbeta trap/anti-PD-L1Solid tumors
M9241 (NHS-IL12)Cancer immunotherapySolid tumors1
M5049Immune receptor inhibitorImmunology
M6495anti-ADAMTS-5 nanobodyOsteoarthritis
M5717PeEF2 inhibitorMalaria
Phase I
M2698p70S6K & Akt inhibitorSolid tumors
M3541ATM inhibitorSolid tumors
M3814DNA-PK inhibitorSolid tumors1
M4344 (VX-803)ATR inhibitorSolid tumors
M6620 (VX-970)ATR inhibitorSolid tumors
M7583BTK inhibitorHematological malignancies
M8891MetAP2 inhibitorSolid tumors
Neurology
Oncology
Immunology
Immuno-Oncology
Global Health
Phase III
avelumab - anti-PD-L1 mAb Non-small cell lung cancer 1L
avelumab - anti-PD-L1 mAbGastric cancer 1L-M
avelumab - anti-PD-L1 mAbUrothelial cancer 1L-M
avelumab - anti-PD-L1 mAbLocally advanced head and neck cancer
evobrutinib - BTK inhibitorMultiple sclerosis5
Registration
avelumabanti-PD-L1 mAbRenal cell cancer 1L6
bintrafusp alfaTGFbeta trap/anti-PD-L1Non-small cell lung cancer 1L
bintrafusp alfaTGFbeta trap/anti-PD-L1Non-small cell lung cancer 1L/2L
bintrafusp alfaTGFbeta trap/anti-PD-L1Locally advanced non-small cell lung cancer
bintrafusp alfaTGFbeta trap/anti-PD-L1Biliary tract cancer 2L
ataciceptanti-BlyS/APRIL fusion proteinSystemic lupus erythematosus
ataciceptanti-BlyS/APRIL fusion proteinIgA nephropathy
evobrutinibBTK inhibitorRheumatoid arthritis
evobrutinibBTK inhibitorSystemic lupus erythematosus
spriferminfibroblast growth factor 18Osteoarthritis
M1095 (ALX-0761)4
anti-IL-17 A/F nanobodyPsoriasis

Tepotinib is a highly selective oral, once daily, MET TKI that blocks MET-mediated signaling pathways
Tepotinib: Significant unmet need
AvelumabIO bi-
functionals DDR2 3 4
Targeted Oncology
1
44
• Preclinical and clinical evidence support MET activation as a primary oncogenic driver in lung cancer subsets and as a secondary driver of acquired resistance to targeted therapy in other lung cancer subsets1
• Higher prevalence of MET alterations amongst elderly patients in Lung (median age of patients with METex14: 72.5 years)
• Evidence exists to support the role of MET in cancers and resistance settings other than lung cancer
1: Drilon A et al., J Thoracic Oncol. 2016; 2: Bray F, et al. CA Cancer J Clin. Global cancer statistics 2018: GLOBOCAN estimates of incidence and mortality worldwide for 36 cancers in 185 countries. 2018;68(6):394–424. https://doi.org/10.3322/caac.21492 PMID:30207593
Adressable Patient
Population
Total global NSCLC
patients
(2 million new cases/year)2
METamp: ~2%
METex14: ~3%
EGFRm+:US/EU: ~12% Asia: ~35%
Other genetic alterations
2-5% of total NSCLC
population
~3-5% of total NSCLC
population
15 – 20% with
METampINSIGHT 2 Trial
VISION Trial
Key Achievements
• SAKIGAKE designation awarded in Japan, Breakthrough designation awarded by US FDA
• METex14: On track for filing in 2020 in US and Japan
• EGFRm+/METamp: INSIGHT 2 program recently started
• Validated liquid biopsy and/or tissue biopsy test used to prospectively recruit in both trials

Tepotinib: Program overviewDevelopment focused on biomarker enriched patient populations
AvelumabIO bi-
functionals DDR2 3 4
Targeted Oncology
1
45
2018 2019 20202017
Dec 2017 (18-month data presented at WCLC 19)
NSCLC 2LEGFRm (withGefitinib, INSIGHT 1 study)
FebHCC 2L
NSCLC
HCC
…
Est. primarycompletion1
…
NSCLC MET Exon 14 Skipping Alterations (VISION study)
OctHCC 1L
• Primary endpoint met• Enrollment: 90 (act.)• Pr. endpoint: TTP (Independent)
• Primary endpoint met• Enrollment: 49 (act.; failed sorafenib)• Pr. endpoint: PFS status 12 weeks (Investigator)
NSCLC 2L EGFRm (with Gefitinib):• Enrollment: 70 (act.)• Comparator: Pemetrexed + Cisplatin/ Carboplatin• Pr. endpoint: PFS (Investigator)• 18 month follow-up to be presented in Q3 2019
• Clinical activity demonstrated (interim)
• Planned enrollment: 120 (est.) – liquid and tissue; enrollment completed
• Pr. endpoint: Confirmed ORR (Independent)LBx MET Amp.(VISION – Cohort B)
June + follow-up2
NSCLC EGFRm (with Osimertinib3, INSIGHT 2 study)
NSCLC EGFRm (with Osimertinib3):• Enrollment: 90 (est.), single-arm• Pr. endpoint: Objective response rate by
independent review, Dose limiting toxicity (safety run-in only)
2021 2022
H1
1 Timelines are event-driven and may be subject to change; 2 Confirmed ORR expected approx. in June 2019, subsequent durability of response/follow-up period pending outcome of discussions with health authorities; 3 brand name: Tagrisso®

Promising data from VISION (NSCLC, MET Exon 14 cohort) study
AvelumabIO bi-
functionals DDR2 3 4
Targeted Oncology
1
461 J. Wolf et al., Capmatinib (INC280) in METΔex14-mutated advanced non-small cell lung cancer (NSCLC): Efficacy data from the phase II GEOMETRY mono-1 study, presented at ASCO 2019; 2 P. Paik et al., Phase II study of tepotinib in NSCLC patients with METex14 mutations, presented at ASCO 2019; * Data not reported in the oral presentation. Manually calculated from 1 CR, 18 PRs in Cohort 5b (1st line) and 28 PRs in Cohort 4 (+2nd line).
Other leading MET inhibitor1 VISION (tepotinib)2
Liquid biopsy analysis set (L+)
Tissue biopsy analysis set (T+)
Oral Oral Oral
Cut off date (15 Apr 2019) (18 Feb 2019) (18 Feb 2019)
IRC IRC IRC
Overall N=97 n=48 n=51
ORR, % [95% CI]
48.5%* Not reported
50.0%[35.2, 64.8]
45.1%[31.1, 59.7]
mDOR, months[95% CI]
Not reported12.4
[5.8, ne]15.7
[9.0, ne]
1L N=28 n=17 n=18
ORR, % [95% CI]
67.9% [47.6, 84.1]
58.8%[32.9, 81.6]
44.4%[21.5, 69.2]
≥2L N=69 n=31 n=33
ORR, % [95% CI]
40.6% [28.9, 53.1]
45.2%[27.3, 64.0]
45.5%[28.1, 63.6]
mDOR, months[95% CI]
9.7 [5.6, 13.0]
12.4[5.6, ne]
12.4[3.7, ne]
PFS1L
n=282L/3L n=69
n=57 n=58
mPFS, months[95% CI]
9.7 [5.5, 13.9]
5.4 [4.2, 7.0]
9.5
[6.7, ne]
10.8
[6.9, ne]
Durable clinical activity across treatment lines2 Favorable safety profile2
Grade 3 TRAEs reported in 19% of patients
No grade 4 or grade 5 TRAEs
Discontinuations due to treatment-related adverse events in only 4.6% of patients
Consistent tumor shrinkage across lines2
Data presented at ASCO 2019

47
Data from INSIGHT 1 study (18-months follow-up presented at WCLC 2019)1 Recently posted INSIGHT 2 study
MET-amp population:
• METamplification can be considered a suitable biomarker for treatment with tepotinib
• Safety: generally well-tolerated, most AEs mild to moderate
• Enrollment halted due to low recruitment
Study Design:• Locally advanced/metastatic EGFR + NSCLC• MET amplification• Acquired resistance to prior EGFR TKI therapy• N = 90
Dose:• Tepotinib 500mg QD + Osimertinib 80mg QD
(21-day cycles until PD)
Primary endpoints:• Objective response rate by independent
review• Dose limiting toxicity (safety run-in only)
1 Yi Long Wu et al., Long term outcomes to tepotinib plus gefitinib in patients with EGFR mutant NSCLC and MET dysregulation: 18 month follow up, presented at WCLC 2019
INSIGHT 2 study follows from encouraging INSIGHT 1 data
AvelumabIO bi-
functionals DDR2 3 4
Targeted Oncology
1
Clinical Efficacy in Met-amp EGFR-mutant Population
Endpoint Tepotinib + gefitinib Chemotherapy
Primary - PFS (HR 0.13 [90% CI 0.04, 0.43])
16.6 m 4.2 m
Secondary - ORR (OR 2.67 [90% CI 0.37, 19.56])
66.7% 42.9%
Secondary - OS(HR 0.09 [CI 0.01, 0.54])
37.3 m 13.1 m
MET exon-14; Met-amp; and EGFR-mutant populations
AvelumabIO bi-
functionals DDR2 3 4
Targeted Oncology
1
48
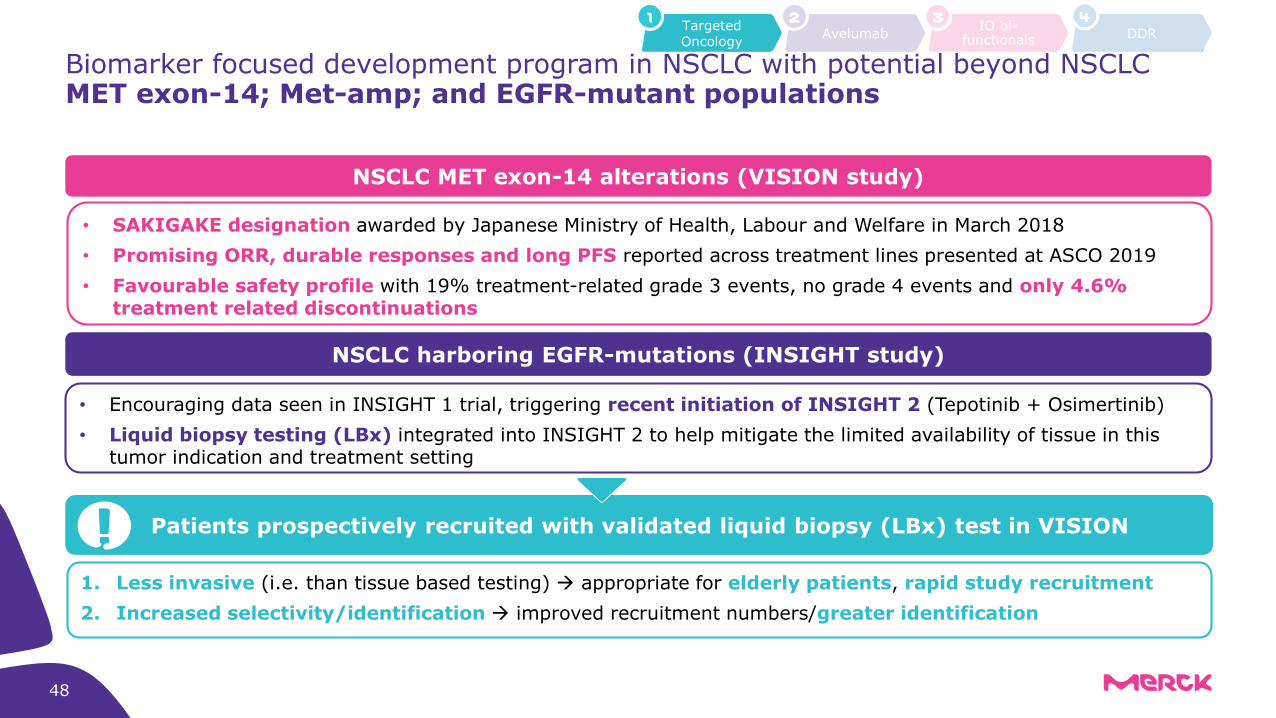
NSCLC MET exon-14 alterations (VISION study)
NSCLC harboring EGFR-mutations (INSIGHT study)
Patients prospectively recruited with validated liquid biopsy (LBx) test in VISION
• SAKIGAKE designation awarded by Japanese Ministry of Health, Labour and Welfare in March 2018
• Promising ORR, durable responses and long PFS reported across treatment lines presented at ASCO 2019
• Favourable safety profile with 19% treatment-related grade 3 events, no grade 4 events and only 4.6% treatment related discontinuations
• Encouraging data seen in INSIGHT 1 trial, triggering recent initiation of INSIGHT 2 (Tepotinib + Osimertinib)
• Liquid biopsy testing (LBx) integrated into INSIGHT 2 to help mitigate the limited availability of tissue in this tumor indication and treatment setting
1. Less invasive (i.e. than tissue based testing) → appropriate for elderly patients, rapid study recruitment
2. Increased selectivity/identification → improved recruitment numbers/greater identification
Biomarker focused development program in NSCLC with potential beyond NSCLC

2019
JunNSCLC 1L (mono/high-intensity)
NovGastric 1L (SW-MN)
1
AprLocally Advanced Head & Neck Cancer (CRT)
Renal Cell Cancer 1L (+Axitinib/TKI) → Continuing until final OS analysis
2
3
Avelumab: Program overviewOngoing studies – Five Phase III trials
Investigate potential of immunogenic priming(incl. combination and
sequencing with CT/CRT)
Leverage potential of unique molecular characteristics
(ADCC)
Proprietarycombinations
1 Estimated primary completion date according to clinicaltrials.gov as of July 24, 2019, timelines are event-driven and may be subject to change; Acronyms: NSCLC = Non-small Cell Lung Cancer, CT = Chemotherapy, CRT = Chemoradiotherapy, MN = Maintenance, SW = Switch, TKi = Tyrosine Kinase inhibitor
Urothelial 1L (SW-MN)
IO bi-functionals DDR
3 4Targeted Oncology
1Avelumab
2
2018 2020 2021 Est. primary completion1
49
Jun
Actual PCD: Jan 2019

50
Assessing potential efficacy upside in mono-therapy1
Avelumab: NSCLC 1L
IO bi-functionals DDR
3 4Targeted Oncology
1Avelumab
2
NSCLC 2L+: exposure response
• Hypothesis: higher drug intensity may result in greater efficacy (potentially driven by ADCC)
• Potential association between higher ORR and higher avelumabexposure
• ORR highest in patients with both higher avelumab exposure and tumors with higher levels of PD-L1 expression
• NSCLC 1L phase III trial amended to leverage high-intensity hypothesis (est. primary completion Jul 2019)
PD-L1+
1 Abstract No. 9086. Presented at the 53rd ASCO Annual Meeting; June 2-6, 2017; Chicago, IL, USA: Exposure–response and PD-L1 expression analysis of second-line avelumab in patients with advanced NSCLC: data from the JAVELIN Solid Tumor trial; Acronyms: ORR = Overall Response Rate
NSCLC 1L: testing hypothesis of higher efficacy/intensity correlation

51
IO bi-functionals DDR
3 4Targeted Oncology
1Avelumab
2
Avelumab: Renal Cell Carcinoma (RCC) 1LExtensive biomarker data set released at ASCO 2019 from Javelin Renal 101
1 Choueiri et al., „Subgroup analysis from JAVELIN Renal 101: outcomes for avelumab + axitinib vs sunitinib in advanced renal cell carcinoma“, presented at ASCO GU 2019; 2 Table adapted from slides of discussant Dr. Lori Wood, presented at ASCO GU2019; 3 Motzer et al., „Avelumab plus Axitinib versus Sunitinib for Advanced Renal-Cell Carcinoma“, New England Journal of Medicine, February 16, 2019; Brian et al., „Pembrolizumab plus Axitinib versus Sunitinib for Advanced Renal-Cell Carcinoma“, New England Journal of Medicine, February 16, 2019; 4 Note that this is not a head-to-head trial comparisons; 5 Choueiri et al., „Biomarker analyses from JAVELIN Renal 101: Avelumab + axitinib (A+Ax) versus sunitinib (S) in advanced renal cell carcinoma (aRCC)“, presented at ASCO 2019
Significant contribution to understanding of biomarkers presented at ASCO 20195
HR < 1 = favors Avelumab-Axitinib or competitor comboHR > 1 = favours sunitinib
mPFS(Hazard Ratio, Risk groups per IMDC)2,4
Favorable Intermediate Poor
Competitor A2.18
(1.29-3.68)0.82
(0.64-1.05)
Competitor B0.81
(0.53-1.24)0.70
(0.54-0.91)0.58
(0.35-0.94)
Avelumab –Axitinib(JAVELIN)
0.54 (0.32-0.91)
0.74 (0.57-0.95)
0.57 (0.38-0.88)
Core data presented at ESMO 2018 and ASCO GU 20191
Safety (% patients, Gr 3-5 TRAEs)3,4
• Avelumab-Axitinib: 57% / 55% (Sunitinib)• Competitor B: 63% / 58% (Sunitinib)
Discontinuation (% patients)3,4:• Avelumab-Axitinib: 4%• Competitor B: 8.2%
• Approved for 1L treatment of advanced RCC by US FDA on May 15, 2019
• Filing validated by EMA and submitted to Japanese health authorities
• Sunitinib patients with PD-L1+ tumors showed reduced PFS
• Patients whose tumors contained greater number of CD8+ cells had extended PFS in the avelumab + axitinib arm and reduced PFS in the sunitinib arm
• Novel signature comprised of immune-related genes associated with PFS in the avelumab + axitinib arm
• Elevated expression of the published angiogenesis gene signature and other related genes was associated with improved PFS in the sunitinib arm, but did not differentiate PFS in the avelumab + axitinib arm
• Significant treatment-arm specific differences in PFS were observed relative to wild type when mutations in genes such as CD163L1, DNTM1 or PTEN were present
“Findings may inform personalized strategies for patients with advanced RCC”

52
IO bi-functionals DDR
3 4Targeted Oncology
1Avelumab
2
Bintrafusp alfa1 (M7824)An innovative first-in-class bifunctional fusion protein leading the TGF-β immuno-oncology field
1 proposed International Nonproprietary Name (INN) | Acronyms: NSCLC = Non-small Cell Lung Cancer, IO = Immuno-Oncology
Clinical Development
Plans
• Innovative first-in-class bifunctional fusion protein designed to simultaneously target two immune suppressive pathways (blocking PD-L1 and reducing TGF-β signaling)
• Demonstrated superior anti-tumor activity in pre-clinical study compared to anti-PD-L1 alone, and anti-PD-L1 and TGF-β given in combination as separate agents
• Great excitement in IO community about M7824 uniquely addressing TGF-ß biology widely accepted as key resistance factor for anti-PDx therapies
• Eight high priority immuno-oncology clinical development studies ongoing or expected to commence in 2019, including studies in non-small cell lung and biliary tract cancers with registrational intent
• Further plans to be communicated at a later stage
• Tested in 14 Phase Ib expansion cohorts across >700 patients in more than 10 tumor types
• Shown clinical anti-tumor activity across multiple hard-to-treat cancers includingadvanced NSCLC, biliary tract cancer, HPV-associated cancers, and gastric cancer
• PhII study M7824 monotherapy versus pembrolizumab 1L, advanced NSCLC high PD-L1-tumor expressers started in October 2018
• Two additional studies started in April 2019
Clinical Development Achievements
Mode of action

53
Attractive payment terms rewarding developmental success
Upfront & Milestone Payment
Structure
Profit & Costsharing
• Profits & Costs: Shared equally on a global basis• Sales: Merck to recognize sales in the United States, GSK to recognize sales ex-US
Total deal volume: €3.7 bn
Upfrontpayment:
€300 m
Milestone payments: €3.4 bn
Development(up to €500 m)
Approval Commercial
Development milestones: Up to €500 m triggered by data from the M7824 lung cancer program
IO bi-functionals DDR
3 4Targeted Oncology
1Avelumab
2
Strategic Alliance with GlaxoSmithKline (GSK)

Development Strategy
Explorative Registrational
1L NSCLC in PD-L1high vs pembrolizumab
(mono)
Started
2L Biliary Tract Cancer (mono)
Stage III unresectable NSCLC
(CRT combo)
1L NSCLC all-comers (CT combo)
NSCLC
BTC
Not yet started Registrational intent
Additional studies and settings(incl. TNBC, HPV related cancers and others)
Others
Several studies ongoing with additional studies expected to commence in the upcoming months
Acronyms: FPI = First Patient In, TNBC = Triple Negative Breast Cancer
IO bi-functionals DDR
3 4Targeted Oncology
1Avelumab
2
54
1L Biliary Tract Cancer (CT combo)
055
DDR
4

NSCLC 1L mono vs Pembrolizumab (in PD-L1 high)
55
IO bi-functionals DDR
3 4Targeted Oncology
1Avelumab
2
2020
Investigate potential of immunogenic priming in NSCLC
(incl. combination with CT/CRT)
Leverage strong signal observed in 2L NSCLC
PD-L1 high patients cohort
1 Estimated primary completion date according to clinicaltrials.gov as of July 24, 2019 and internal estimates for upcoming studies; timelines are event-driven and may be subject to change; Acronyms: NSCLC = Non-small Cell Lung Cancer, BTC = Biliary Tract Cancer, CT = Chemotherapy, cCRT = Chemoradiation therapy, FPI = First Patient In
2019 2021 2022 Est. primary completion12023
Q4
Q4
Unresectable Stage III NSCLC (+ cCRT) vs Durvalumab
2024
Q1
NSCLC 1L (+ chemotherapy)
BTC 2L mono Q1
Confirm signal from 2L BTC cohort where no SOC is approved
Development StrategyProgram overview: Two additional studies recently startedProgram overview: Two additional studies recently started
BTC 1L (+chemotherapy) Q4
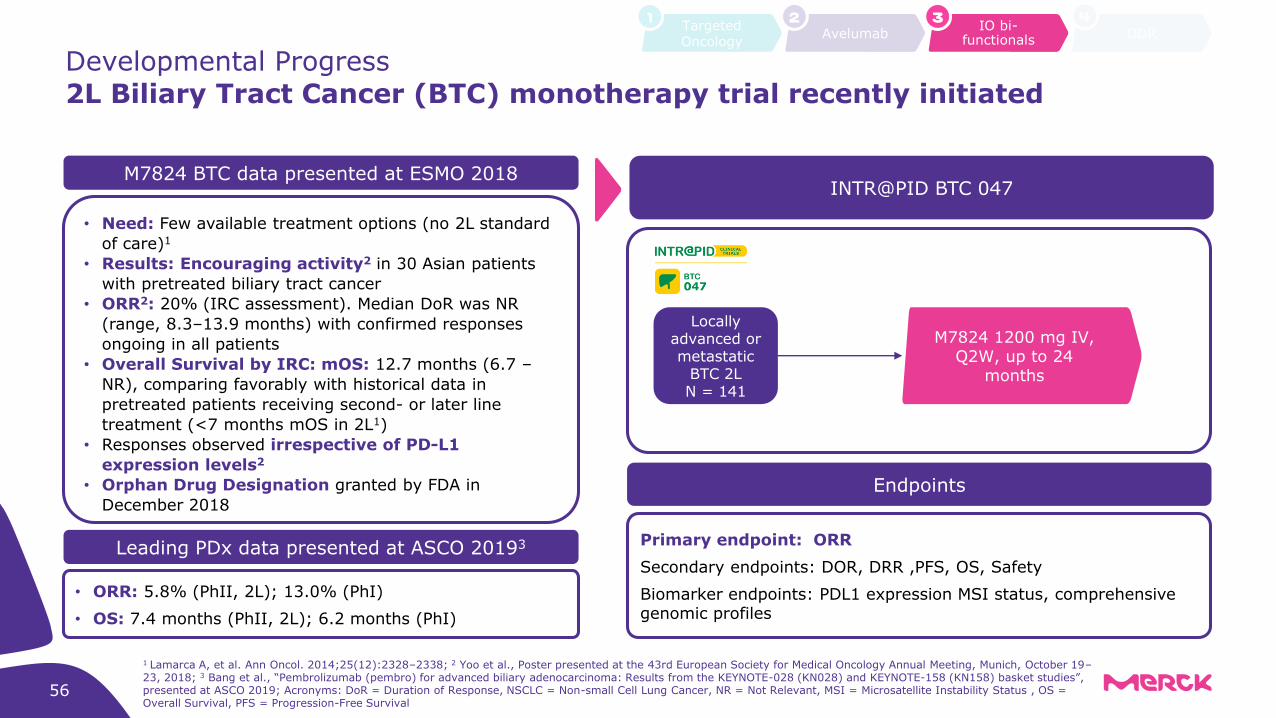
2L Biliary Tract Cancer (BTC) monotherapy trial recently initiated
Developmental Progress
Locally advanced or metastatic
BTC 2L N = 141
INTR@PID BTC 047
Endpoints
Primary endpoint: ORR
Secondary endpoints: DOR, DRR ,PFS, OS, Safety
Biomarker endpoints: PDL1 expression MSI status, comprehensive genomic profiles
M7824 BTC data presented at ESMO 2018
• Need: Few available treatment options (no 2L standard
of care)1
• Results: Encouraging activity2 in 30 Asian patients
with pretreated biliary tract cancer
• ORR2: 20% (IRC assessment). Median DoR was NR
(range, 8.3–13.9 months) with confirmed responses
ongoing in all patients
• Overall Survival by IRC: mOS: 12.7 months (6.7 –
NR), comparing favorably with historical data in
pretreated patients receiving second- or later line
treatment (<7 months mOS in 2L1)
• Responses observed irrespective of PD-L1
expression levels2
• Orphan Drug Designation granted by FDA in
December 2018
M7824 1200 mg IV, Q2W, up to 24
months
1 Lamarca A, et al. Ann Oncol. 2014;25(12):2328–2338; 2 Yoo et al., Poster presented at the 43rd European Society for Medical Oncology Annual Meeting, Munich, October 19–23, 2018; 3 Bang et al., “Pembrolizumab (pembro) for advanced biliary adenocarcinoma: Results from the KEYNOTE-028 (KN028) and KEYNOTE-158 (KN158) basket studies”, presented at ASCO 2019; Acronyms: DoR = Duration of Response, NSCLC = Non-small Cell Lung Cancer, NR = Not Relevant, MSI = Microsatellite Instability Status , OS = Overall Survival, PFS = Progression-Free Survival
Leading PDx data presented at ASCO 20193
• ORR: 5.8% (PhII, 2L); 13.0% (PhI)
• OS: 7.4 months (PhII, 2L); 6.2 months (PhI)
IO bi-functionals DDR
3 4Targeted Oncology
1Avelumab
2
56
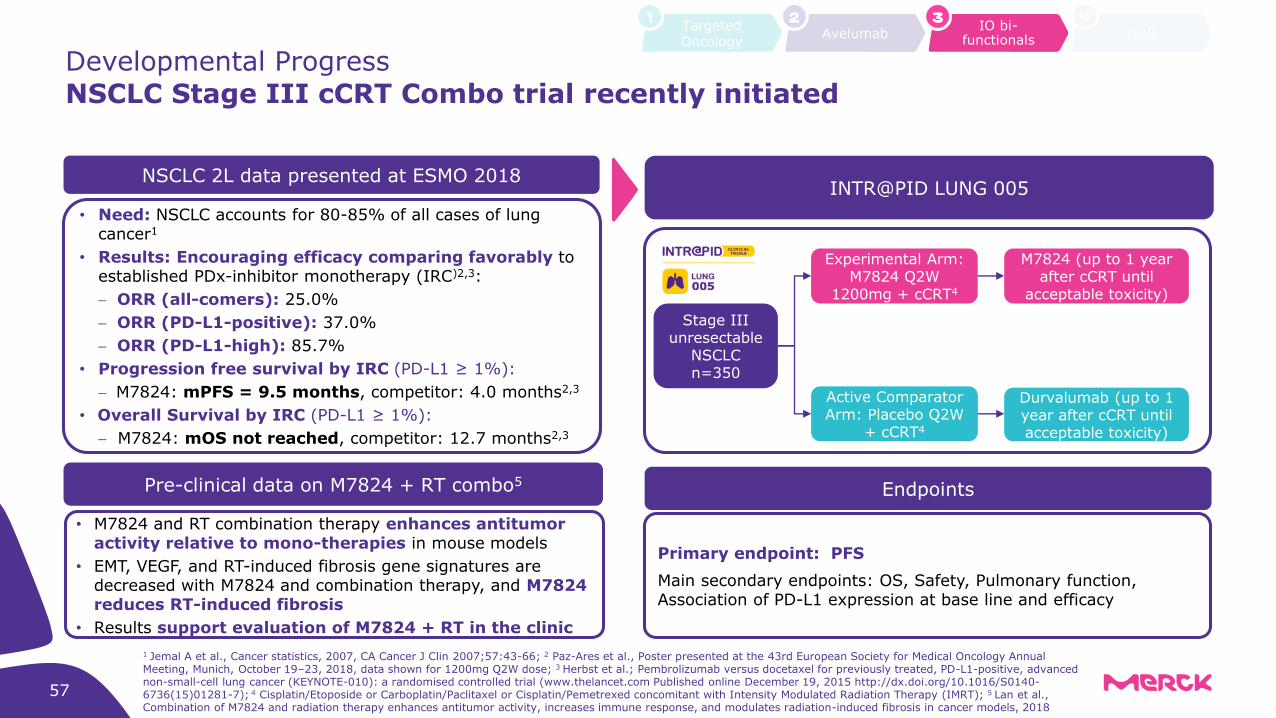
Developmental Progress
Stage III unresectable
NSCLCn=350
Experimental Arm:M7824 Q2W
1200mg + cCRT4
Active Comparator Arm: Placebo Q2W
+ cCRT4
NSCLC Stage III cCRT Combo trial recently initiated
M7824 (up to 1 year after cCRT until
acceptable toxicity)
Durvalumab (up to 1 year after cCRT until acceptable toxicity)
INTR@PID LUNG 005
Endpoints
Primary endpoint: PFS
Main secondary endpoints: OS, Safety, Pulmonary function, Association of PD-L1 expression at base line and efficacy
NSCLC 2L data presented at ESMO 2018
• Need: NSCLC accounts for 80-85% of all cases of lung cancer1
• Results: Encouraging efficacy comparing favorably to established PDx-inhibitor monotherapy (IRC)2,3:
− ORR (all-comers): 25.0%
− ORR (PD-L1-positive): 37.0%
− ORR (PD-L1-high): 85.7%
• Progression free survival by IRC (PD-L1 ≥ 1%):
− M7824: mPFS = 9.5 months, competitor: 4.0 months2,3
• Overall Survival by IRC (PD-L1 ≥ 1%):
− M7824: mOS not reached, competitor: 12.7 months2,3
1 Jemal A et al., Cancer statistics, 2007, CA Cancer J Clin 2007;57:43-66; 2 Paz-Ares et al., Poster presented at the 43rd European Society for Medical Oncology Annual Meeting, Munich, October 19–23, 2018, data shown for 1200mg Q2W dose; 3 Herbst et al.; Pembrolizumab versus docetaxel for previously treated, PD-L1-positive, advanced non-small-cell lung cancer (KEYNOTE-010): a randomised controlled trial (www.thelancet.com Published online December 19, 2015 http://dx.doi.org/10.1016/S0140-6736(15)01281-7); 4 Cisplatin/Etoposide or Carboplatin/Paclitaxel or Cisplatin/Pemetrexed concomitant with Intensity Modulated Radiation Therapy (IMRT); 5 Lan et al., Combination of M7824 and radiation therapy enhances antitumor activity, increases immune response, and modulates radiation-induced fibrosis in cancer models, 2018
Pre-clinical data on M7824 + RT combo5
• M7824 and RT combination therapy enhances antitumor activity relative to mono-therapies in mouse models
• EMT, VEGF, and RT-induced fibrosis gene signatures are decreased with M7824 and combination therapy, and M7824 reduces RT-induced fibrosis
• Results support evaluation of M7824 + RT in the clinic
IO bi-functionals DDR
3 4Targeted Oncology
1Avelumab
2
57

Prevalence: >630,000 new cases of HPV-related cancer are reported worldwide annually1
Response Rates:
• Bintrasfusp alfa response rates compared favorably to those with anti–PD-1 inhibitors (ORRs of 13%–24%)1-7
• ORR was 27.9% and 30.6% in HPV-associated and HPV+ cancers, respectively
• Including three additional patients with delayed PRs after initial PD: Total response rate was 34.9% and 38.9% in HPV-associated and HPV+ cancers, respectively
Long-term Benefit:
• Most responses durable with 4 responses having DoR >18 months and 11/15 responses ongoing at the data cutoff
• Responses to bintrafusp alfa occurred irrespective of tumor type or PD-L1 expression
• Safety profile was similar to anti–PD-(L)1 therapy1,5 except for SCC/KAs and low grade mucosal bleeding which are anticipated AEs with TGF-β inhibition8,9
Developmental Progress
Additional study in HPV-related cancers to commence shortly
Efficacy variableHPV-associated cancer (n=43)
HPV+*(n=36)
Confirmed BOR, n (%)
CR 2 (4.7%) 2 (5.6%)
PR 10 (23.3%) 9 (25%)
SD 6 (14.0%) 5 (13.9%)
PD 20 (46.5%) 17 (47.2%)
Not evaluable 5 (11.6%) 3 (8.3%)
Delayed PR† 3 (7.0%) 3 (8.3%)
ORR per RECIST v1.1, n (%) [95% CI]
12 (27.9%) [15.3–43.7]
11 (30.6%) [16.3–48.1]
Total clinical response rate†, n (%)
15 (34.9%) 14 (38.9%)
DCR, n (%) 18 (41.9%) 44.4%
Data shown at AACR 2019 highlights opportunity in HPV-related cancers
† Due to confirmed PD before onset of response, these patients did not meet response criteria by RECIST v1.1; * HPV status was determined from prior documentation, or by using cobas® 4800 HPV Test (Roche) in the dose escalation phase or RNA sequencing (RNASeq) in the expansion phase. 1 Bauml J, et al. J Clin Oncol. 2017;35:1542–49; 2 Ott PA, et al. Ann Oncol. 2017;28:1036–41; 3 Hollebecque A, et al. J Clin Oncol. 2017;35(Suppl):Abstract 5504; 4 Chung HC, et al. J Clin Oncol. 2018;36(Suppl):Abstract 5522; 5
Ferris RL, et al. N Engl J Med. 2016;375:1856–67; 6 Mehra R, et al. Br J Cancer. 2018;119:153–59; 7 Morris VK, et al. Lancet Oncol. 2017;18:446–53; 8 Lacouture ME, et al. Cancer Immunol Immunother. 2015;64:437–46; 9 Trachtman H, et al. Kidney Int. 2011;79:1236–43
IO bi-functionals DDR
3 4Targeted Oncology
1Avelumab
2
58

Leadership in next generation assets beyond PARP
DNA Damage Response (DDR)
59
IO bi-functionals
3Targeted Oncology
1Avelumab
2DDR
4
DNA Damage
Response
A Core Research
Innovation Cluster
• DDR defects are an “achilles heel” of cancer cells
• ATR, ATM and DNA-PK are the trinity of targets that orchestrate cellular response DNA damage and replication stress
• Leading clinical portfolio with 6 assets (in Phases 1 and 2) targeting ATR, ATM and DNA-PK
• Rich pre-clinical and translational science driving biological innovation and patient selection
• Ideally placed to drive novel combinations within DDR portfolio and broader immuno-oncology portfolio
• Multiple early signal finding studies allow for evidence-based decision making & focus in future development
Acronyms: ATM = Ataxia-Telangiectasia Mutated, ATR = Ataxia Telangiectasia and Rad3, DNA-PK = DNA-dependent Protein Kinase, PARP = Poly ADP Ribose Polymerase

60
DNA Damage Response (DDR)Development is focused on three foundations
4
IO bi-functionals
3Targeted Oncology
1Avelumab
2DDR
4
60
In
creased
Im
mu
no
gen
icit
y
DDRi + IO
Differentiate future IO treatments
Monotherapy
DDRi + DDRi
(incl. PARP)
Grow the DDR class, building on PARPs
DDRi + CTx/ RTx/ (C)RTx
Improve efficacy in post-IO landscape
1
2
3
Loss of one or more DDR pathways
Increased levels of replication stress
Increased levels of endogenous DNA
damage
Differentiating aspects of cancer DDR that can be targeted therapeutically1:
1 adapted from M. O‘Connor, Targeting the DNA Damage Response in Cancer, Molecular Cell Review, November 2015; Acronyms: IO = Immuno-Oncology, CT = Chemotherapy, DDRi = DNA Damage Response inhibitor, RT = Radiotherapy, (C)RT = Chemo-radiotherapy

Clinical program targets three major DDR pathways, in mono- and combination (incl. Avelumab)
DNA Damage Response (DDR)
IO bi-functionals
3Targeted Oncology
1Avelumab
2DDR
461
61
M6620
M3814
M3541Phase I dose escalation ongoing in combination with RT
One study completed (mono), one study ongoing (Phase I + Ib expansion, combination with RT/ CRT)
Phase I dose escalation ongoing for mono- and combination therapy (with CT)
M6620 CT combinations in various settings
2025
Estimated primary completion1… 2017 2018 2019 2020
M6620 + Avelumab
Sep
ATM
-i
Phase II study discontinuedNo effect on other Avelumab or ATRi studies
Nov
M3814+Avelumab Jan
Phase I dose escalation initiated (+Avelumab with/without palliative RT), advanced solid tumors
M3814 Dec
…
M4344
DN
A-P
K-i
ATR
-i
Phase I/II study initiated for locally advanced rectal cancer (with CRT)
1 Estimated primary completion date acccording to clinicaltrials.gov as of September 13, 2019, timelines are event-driven and may change; Acronyms: ATM = Ataxia-Telangiectasia Mutated, ATR = Ataxia Telangiectasia and Rad3, DNA-PK = DNA-dependent Protein Kinase, CT = Chemotherapy, RT = Radiotherapy, CRT = chemoradiotherapy, NSCLC = Non-small Cell Lung Cancer, SCLC = Small-cell Lung Cancer, TNBC = Triple Negative Breast Cancer
PhI: Apr

62
Selective immune
reconstitution therapy(SIRT)1
4 years disease
control with treatment over
2 years2
Unique posology: max. 20 days of oral treatment3
Lowmonitoring requirements4
Selective reductionin B & T lymphocytes…
…followed byreconstitution
0
20
40
60
80
100
CLARITYCladribine Tablets
3.5mg/kg | Years 1 & 2
CLARITY EXTCladribine Tablets
3.5mg/kg | Years 1 & 2Placebo | Years 3 & 4
77.8 75.6
Proportion of Patients Qualifying Relapse Free (%)2
n=98n=98
Mavenclad could change the MS treatment paradigm
Mavenclad
Immunology
1 Giovannoni G. Neurotherapeutics 2017; Nov 22 [Epub ahead of print] | Wiendl H et al. Neurology 2017;89:1098‒100 | Weindl H. Nat Rev Neurol 2017; Sept 8 [Epub ahead of print]2 Giovannoni G et al. N Engl J Med 2010;362:416–26 | Giovannoni G et al. Mult Scler Aug 1 [Epub ahead of print] 3 Maximum of 20 days of oral dosing over 2 years with no further treatment required in the next 2 years. For important safety information, refer to the abbreviated Prescribing Information | Oral, weight-based dosing. For an average patient weighing 67 kg. Recommended treatment over 2 years. One treatment course per year, followed by observation for another 2 years. Each treatment course consists of two treatment weeks, one at the beginning of the first month and one at the beginning of the second month of the respective year | MAVENCLAD® EU SmPC, September 2017 | Giovannoni G et al. N Engl J Med 2010;362:416–26 4 MAVENCLAD® EU SmPC September 2017 | Screening must be performed prior to initiation of therapy in Year 1 and Year 2. Vaccination of antibody-negative patients is recommended prior to initiation of Cladribine Tablets. AE, adverse event; HBV, hepatitis B virus; HCV, hepatitis C virus; MRI, magnetic resonance imaging; NEDA, no evidence of disease activity; TB, tuberculosis

• At patient level: Rebifand Mavenclad are highly complementary
• At physician level: High overlap
• Franchise infrastructure investment benefits both brands
Merck’s overall NDD franchisewill cover a broad MS patient pool
Mavenclad label covers 60-70% of patients with RRMS
1
within the MS1
patient population in Europe
Mavencladꞌs attractive label in Europe supports integrated franchise strategy
Mavenclad
Prioritized for Mavenclad
low
Disease activity
high
TherapyInitiation Escalation Reserve
Prioritized for Rebif
RRMS patients, EU-53MS patient population
2
63
low
Disease activity
high
TherapyInitiation Escalation Reserve
Not covered by label
Mavenclad label
Immunology
Integrated franchise strategy
1 Approved by EMA for treatment of highly active relapsing multiple sclerosis; Abbreviations: RRMS = Relapsing-Remitting Multiple Sclerosis; 2 Source: Merck
3 Source:
Merck, Ipsos; As of May 2019, Mavenclad was approved in 55 countries globally and reimbursed in half

64
On March 29, the FDA approved Mavenclad for the treatment of adults with relapsing-remitting (RRMS) and active secondary progressive disease (SPMS)
Mavenclad
40%
60%
67%
33%
CIS
257k
Treated RMS
Patients
SPMS
195k
RRMS
54k
8k
Treated RMS patients in US Dynamic RMS treated patientsMavenclad addressesclear medical needs
• Previously treated patients represent the vast majority of the dynamic patient pool
• Lack of efficacy is the predominant driver of switching, hence observed “high-efficacy” share of switches
• Intolerance also drives switching, though to a lesser degree, and results in switches between classes
→ Novel mechanism and unique oral short-course regimen of Mavenclad addresses these needs
75k
Switch
New
Highefficacy1
Platform1
50k
Source: Decision Resource Group, MS Epidemiology Overview, October 2017; 1 High efficacy includes Ocrevus, Tysabri, Lemtrada, Gilenya – platform includes all other approved agents
Immunology

First BTK-inhibitor to show clinical proof-of-concept in RMS1
65
Evobrutinib - Unmet needs remain in the treatment of RMS patients
Immunology
Unmet needs in RMS Evobrutinib in RMS
• Novel Dual mechanism – thought to address the
innate and adaptive immune compartments with the prospect of both peripheral and CNS effects
• Robust effect on MRI and relapses in Phase II
randomized control trial (RCT) over 48 weeks
• No systemic side effects (e.g. GI disturbance)
• No elevation in infections seen over 48 weeks in RCT
Phase II
• Rapid reversibility of inhibition on treatment discontinuation allows for treatment sequencing and risk
management
• Phase III program designed to maximize registrational success and to fully elucidate potential of evobrutinib mechanism through sub-
and ancillary studies
Need for new mechanisms to control disease
• Approx. 50% of patients with RMS continue to have ongoing disease activity over 2 years even when treated with the most effective agents
• Agents in phase 3 development and registration for MS are “me-too” mechanisms
Need for higher efficacy oral therapies
• 5 approved therapies considered “higher efficacy”, only 2 of which are oral
• No approved oral therapy with efficacy on progression vs an active control
Opportunity to advance on benefit-to-risk
• Systemic side effects of therapies limit patient acceptance and compliance
• All approved higher efficacy therapies associated with elevated risk of infection
1 Motalban et al., “Efficacy and Safety of the Bruton’s Tyrosine Kinase Inhibitor Evobrutinib (M2951) in Patients with Relapsing Multiple Sclerosis over 48 Weeks”, presented at AAN 2019

48 week data from Ph II randomized placebo-controlled trial robustly inform Ph III trial design1,2
66
Evobrutinib
Immunology
1 Motalban et al., “Efficacy and Safety of the Bruton’s Tyrosine Kinase Inhibitor Evobrutinib (M2951) in Patients with Relapsing Multiple Sclerosis over 48 Weeks”, presented at AAN 2019; 2 Montalban et al., „Placebo-Controlled Trial of an Oral BTK Inhibitor in Multiple Sclerosis“ published in NEJM, May 2019
• Robust effect on Relapse Rate - ARR reduction maintained over 48 weeks with
Evobrutinib 75mg BID (0.11 at 48 weeks)
• Rapid Reduction in mean number of T1 Gd+ lesions - Early onset at Week 12 and
persistence to Week 48 in the evobrutinib 75 mg BID arm
• No new safety signals
• Results support further clinical development of evobrutinib in RMS
Robust foundation
for Ph III
48 week data: Primary endpoint (T1 Gd+ lesion reduction) maintained1,2
Safety1,2
Generally well tolerated over 52 weeks:
• Transaminase elevations predominantly mild: Some grade 3–4 events observed; all had their onset within the first 24 weeks of the study
• All transaminase elevations asymptomatic and reversible upon withdrawal of evobrutinib
• No serious opportunistic infections or lymphopenia

67
Immunology
Phase III trial recently started, with goal to rapidly advance BTKi into clinical practice
Evobrutinib
RMS Phase III trial design
n=950
Evobrutinib
Interferon beta-1a Q1W
Evobrutinib
Day 1 Week 96EOS or
OLE Day 1OLE
Week 144OLE EOSWeek 148
Screening 4 Weeks
Treatment period 96 Weeks
Safety follow-up 4 Weeks
OLE period144 Weeks
OLE safety follow-up 4 weeks
• Eligible participants will be randomized 1:1 in Phase 3
• Two parallel phase 3 studies to be conducted to support registration
• Core + ancillary study program will robustly characterize impact of Evobrutinib on measures of RMSdisease including both novel and unique measures relevant to its presumed MOA
Acronyms: EOS = End Of Study, OLE = Open-Label Extension, Q1W = administered once weekly

Est. primarycompletion
68
Comprehensive development plan across immune-mediated diseases
Evobrutinib
• 48 wks datapresented at AAN 2019
• Phase III started
12/20191
RM
S
SLE
Safety • 24 patients• Double-blind, Randomized, Placebo-
controlled Study
• 65 patients• Randomized, double-blind, placebo-
controlled trial in subjects with RA on stable Methotrexate therapy
• Randomized, double-blind, placebo-controlled study in patients with RMS
• 267 patients• 5 arms study: placebo vs. 3 drugs-arms (low,
mid, high dose) incl. active control reference arm (Dimethyl fumarate)
• Randomized, double-blind, placebo-controlled dose-ranging study in subjects with SLE
• 451 patients• 4 arms study: placebo vs. 3 drugs-arms (low,
mid, high dose)
• Randomized, double-blind, placebo-controlled dose-ranging study in subjects with RA
• 360 patients• 4 arms study: placebo vs. 3 drugs-arms (low,
mid, high dose)
Immunology
Robust phase II program to enable differentiated phase III
Phase I/Iia safety data-set
SLE
RA
SLE (
Ib)
RA
(II
a) Signal Finding
All timelines are event-driven and may be subject to change; 1: Data read-out expected in H1 2020
Q4 20191
69
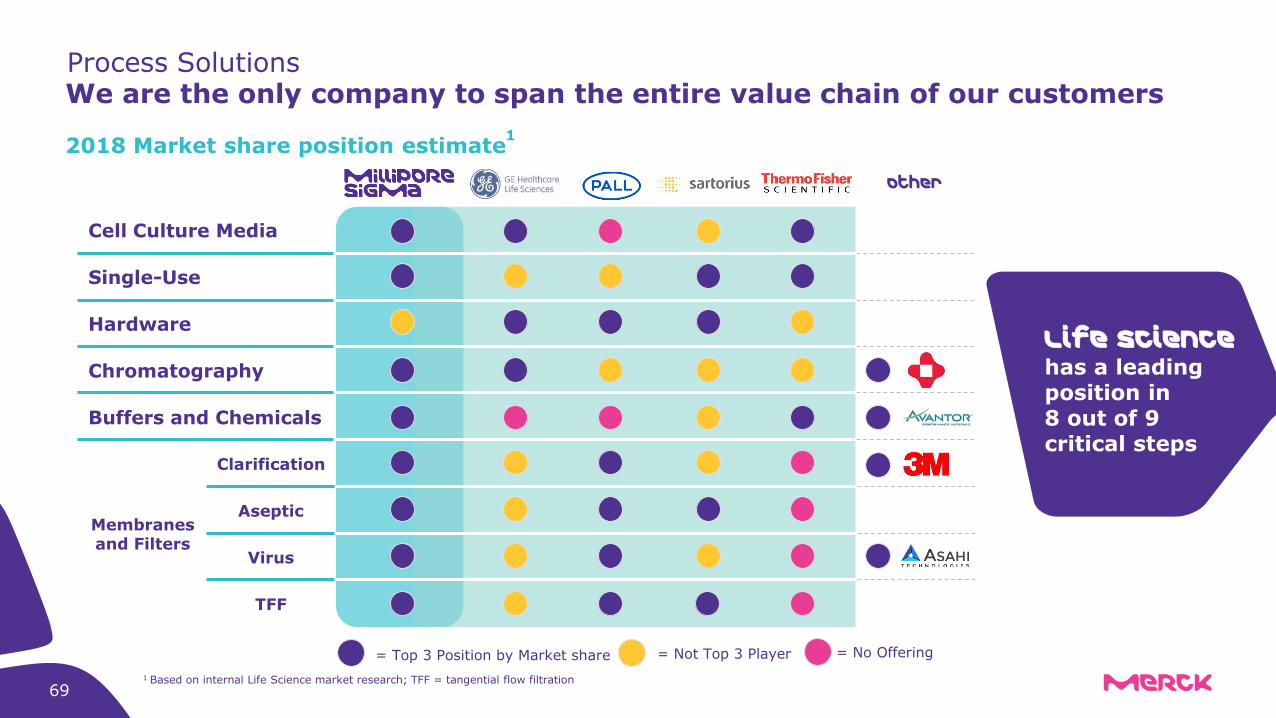
We are the only company to span the entire value chain of our customersProcess Solutions
Other
Cell Culture Media
Single-Use
Hardware
Chromatography
Buffers and Chemicals
Membranesand Filters
Clarification
Aseptic
Virus
TFF
= Top 3 Position by Market share = Not Top 3 Player = No Offering
2018 Market share position estimate1
Life Sciencehas a leading position in 8 out of 9 critical steps
1 Based on internal Life Science market research; TFF = tangential flow filtration

make purify
BioReliance ® EMPROVE®
Ex-Cell®
Advanced™ media
CHOZNCell Line
Clarisolve®
Depth FiltersViresolve®
Pro SolutionPellicon®
UltrafiltrationCassettes
Opticap®
FiltersDurapore®
FiltrationEshmuno®
Chrom. resinProSep®
Ultra Plus Resin
To
day’s
process
& p
ortf
olio
Mobius®
bioreactor
Next-generation bioprocessing on the cards
To
mo
rrow
’sp
rocess
Millipak®
Final Fill Filter
Launched 2018
70
cGMP SOLUTIONS & SERVICES
Launched 2018
Process Solutions
Continuous bioprocessing will …• be an evolution in mAb bioprocessing• take time to establish• leverage the present • lead to hybrid solutions
70

*CAPEX = Capital Expenditure
CAPEX* required
Footprint
Change over time
Time to construct
CAPEX required
Footprint
Change over time
Time to construct
~$500 m to $1 bn
~>70,000 m2
5 to 10 years
4 weeks
$20 m to $100 m
~11,000 m2
1.5 years
0.5 days
Innovative Single-use facilityTraditional multi-use facility
30,000 l stain-lesssteel tank
500 l single-use
tank
Process SolutionsOur single-use technologies drive flexibility in modern bioprocessing
Strong demand for single-use technologies and Process Solutions’ broad offering was and will remain a key source of growth for Life Science
71

72
Democratization of mAbs market will drive diversification, change, variability
Life Science
0
5
10
15
20
25
30
35
2018 2024
Volu
me [
metr
ic t
ons]
Top 10 mAbs2
New mAbs Biosimilars1
Market development• Overall mAbs market will grow
~11-15% CAGR
• Top 10 originator mAbs represent ~ 60% of market volume today and will decline to ~20% in 2024
• Biosimilars will gain share
mAb volume projections 2018 to 2024
CAGR ~11-15%
1Biosimilars scaling factor = 2.8 based off internal estimates and McKinsey analysis;
2Top 10 mAbs by 2017 volume, includes Enbrel.
Source: EvaluatePharma | Sept 2018; mAbs = Monoclonal antibodies

• Leading technologies: Single Use and BioContinuum™ for intensified and continuous bioprocessing
• Services: Contract manufacturing for biotechs at 3 global sites
Proccess Solutions: Growth opportunities beyond mAbs
2019
All other biologics
(+7%)
2023
Novel modalities
(+31%)
Small molecules
(+6%)
Vaccine (+9%)
Plasma (+6%)
mAbs (+12%)
25,520
36,8172019-2023 CAGR: +10%
Growth potential by segment Accessible market [€m], 2019-2023 CAGR1
Growth market - China
• Half of world-wide early stage mAb market by 2022
• A leading country in clinical trials
• Diversifying products and services in line with the new modalities coming to the market: fusion biologics, viral and gene therapies, cellular therapies
• Leading technologies: investments over 15 years, 20 granted CRISPR patents
• Services: investments in CDMO capacity for Viral VectorManufacturing, and HP-API
• Increased investments into Nantong and Wuxi manufacturing sites
• China’s first BioReliance®
End-to-End Biodevelopment Center opened in Shanghai in 2017
731: Evaluate Pharma market research; Novel modalities include VGT, Cell Therapy and Stem Therapy; Acronyms: CDMO = Contract Development and Manufacturing Organization, CRISPR = Clustered Regularly Interspaced Short Palindromic Repeats, HP-API = Highly Potent Active Pharmaceutical Ingredients ased on internal Life Science market research; TFF = tangential flow filtration
Life Science

Applied Solutions
Abbreviations: CRISPR = Clustered Regularly Interspaced Short Palindromic Repeats; VGT = Virology and Gene Therapy, ZFN = zinc finger nuclease; ADME = absorption, distribution, metabolism, and excretion; GMP = good manufacturing practice
Broad offering across the dynamic cell and gene therapy value chain
Develop cutting-edge toolsfor scientists to
• Uncover foundational understanding, e.g. CRISPR patent grants in 7 geographies
• Modify genetic functions, e.g. CRISPR/Cas 9 tools, libraryand reagents, ZFN
Create cell lines and cell models for testing safety and efficacy
• Pharmacokinetics (ADME)
• Toxicology testing
• Potency model• Examples: primary human
hepatocytes, Intestine, liver and kidney assays
• Offer cGMP clinical and commercial manufacturing, e.g. manufacture viral vectors
• Improve the supply chain of cell therapy, e.g. cell and gene therapy products and services
Deliver
Merck is a supplier of novel products and services with a strong IP portfolio to meet the rapidly growing demand for novel therapies
ProveUnderstand
Merck offering
74
74

Leading e-Commerce and operational excellence to serve customers
Impeccable Supply chain
Highly reputable e-commerce platform
Research Solutions
#1 in Life Science for web traffic
>100 m unique visits
>€ 1.5 Bn sales
>30% of Merck eCommerce orders
contain products from former Sigma AND Millipore
>300K products
~13 m lines shipped
per year
~90% fill rate globally
>80% of lines shipped
within 24-48 hours in Western Europe and North America
Ranking of websites:*
sigmaaldrich.com No. 1
thermofisher.com No. 2
fishersci.com No. 3
vwr.com No. 4
emdmillipore.com No. 5
SEARCH
ORDER
SCIENTIFIC
CONTENT
Hundreds ofthousands of products
Articles, protocolsand peer reviewed
papers
Real-time pricingand availability
Unique Customer Experience
75
*Alexa report, global, all sectors – Web traffic ranking June 2018: sigmaaldrich.com = Rank 3,361, thermofisher.com = Rank 3,935,fishersci.com = Rank 17,473, vwr.com = Rank 27,061, emdmillipore.com = Rank 29,637

PM’S Semiconductor Materials enable...
Electronics market
~€1,250 bn
CAGR 18-25: ~4%
Semiconductor market
~€380 bn
CAGR 18-25: ~5%
Equipment
~€40 bn
Services~€20 bn
Materials market
~€38 bn
CAGR 18-25: ~3%
~€15 bn
Wafer processing
~€15 bn
Wafer packaging
Core business
CAGR 18-25: ~5%
CAGR 18-25: ~2%
~€8 bn
Wafer production
CAGR 18-25: ~3%
Performance enhancing materials will benefit over-proportionately from attractive semiconductor growth rate of 5% CAGR
Illustration of the electronics market and thereof its selected sub markets
- Smaller structures beyond limitations of existing technologies
- Higher memory capacity, faster processing speed, less power consumption
- Improved yield and lower processing costs
...customer needs
Key enabler for digital trendsSemiconductor Solutions
76

Silicon wafer area shipments–Sustainable long-term growth2
End-market –Data driving growth of electronics industry1
• Data volumes growing at >30% annually• Driving the digital revolution as semiconductors
are required for data processing and storage
• Silicon wafer area shipments (MSI) strongly correlated with semiconductor market growth
• MSI expected to return to growth as of 2020
80
130
180
230
280
330
380
430
480
2001 2005 2009 2013 2017 2021
GDPAvg.: ~+3%
GDP growth [indexed in 2001 = 100]
MSIAvg.: ~+6-7%
forecast
To complete the acquisition of Versum Materials
Semiconductor Solutions – Data explosion driving secular growth
Performance Materials
Size of global data sphere in zettabytes1
TODAY
1 Zettabyte = 1 trillion gigabytes
Data
com
munic
ation
is g
row
ing w
ith >
30%
annually
Silicon wafer area shipments (MSI) growth [indexed in 2001 = 100]
77

Enabler of key technology trends
Lithography materials
Innovation focus: Enabling structures in nodes smaller than 14 nm
Processmaterials
Supporting the manufacturing process for all kinds of IC devices, e.g. IoT
Silica materials
Innovation focus: High removal rate in CMP without defects
Servers enablingBig Data
Wearables and otherdevices for Internet
of Things
• Smaller structures by materials enabling Moore’s law
• Higher memory capacity, faster processing speed, less power consumption
• Improved yield and lower processing costs
Deposition Materials
Next Generation Deposition materials for ALD and CVD
Dielectric materials
Enabling cost-efficient production of the newest memory generations
Newest generation of smartphonesConductive Pastes
Electrically conductive materials for use in the manufacture of advanced electronic devices
Semiconductor Solutions
78

Expanding the limits of how small you can go
Lithography limitation Directed self-assembly (DSA)
Wide features AZ Relacs® shrink materials
As lines get narrower and closer together in advanced chip generation, lines tend to “stick” due to surface tension.
Block copolymer can generate small lines or contact holes by self-assembly. This allows miniaturization without expensive new equipment.
Shrink materials “shrink” the gap between lines and, hence, allow the manufacture of narrower features otherwise not possible.
Pattern collapse AZ FIRM® rinse materials
Merck delivers highly innovative solutions for complex customer problems
79

80
Overcoming technology barriers – supporting continued progression of technological mega trends
Market drivers and technological trends
Selected competitors
Miniaturization: Devices are becoming smaller with better performance
Need for enabling materials to reduce size (Moore’s law)
Mobility: Everyone is continuously connected without direct power supply
More chips needed for local energy production
Energy storage → smaller batteries with higher density
Internet of Things: Everything is continuously connected
More gadgets and devices that include chips
Increasing amount of communication and sensor chips
Big Data: Increasing need for intelligent data storage
Switch from hard disk drives (HDD) to solid state drives (SSD)
• Tokyo Ohka Kogyo
• Nissan Chemicals
• Dow Electronic Materials
• JSR
Feature sizes in memory market develop as predicted by Moore‘s law
1
Semiconductor Solutions
~10nm: size of smallest viruses or hemoglobin
2013 2014 2015 2016 2017 2018 2019
10nm
20nm
2020
0nm
20nm
14nm
10nm
7nm
20nm
1Xnm
25nm
1Ynm
19nm
30nm
Feature size
DRAM
Logic
NAND
1Source: ASML, Merck Customer Timelines, Abbreviations: DRAM = Dynamic Random-Access Memory, NAND Flash Memory
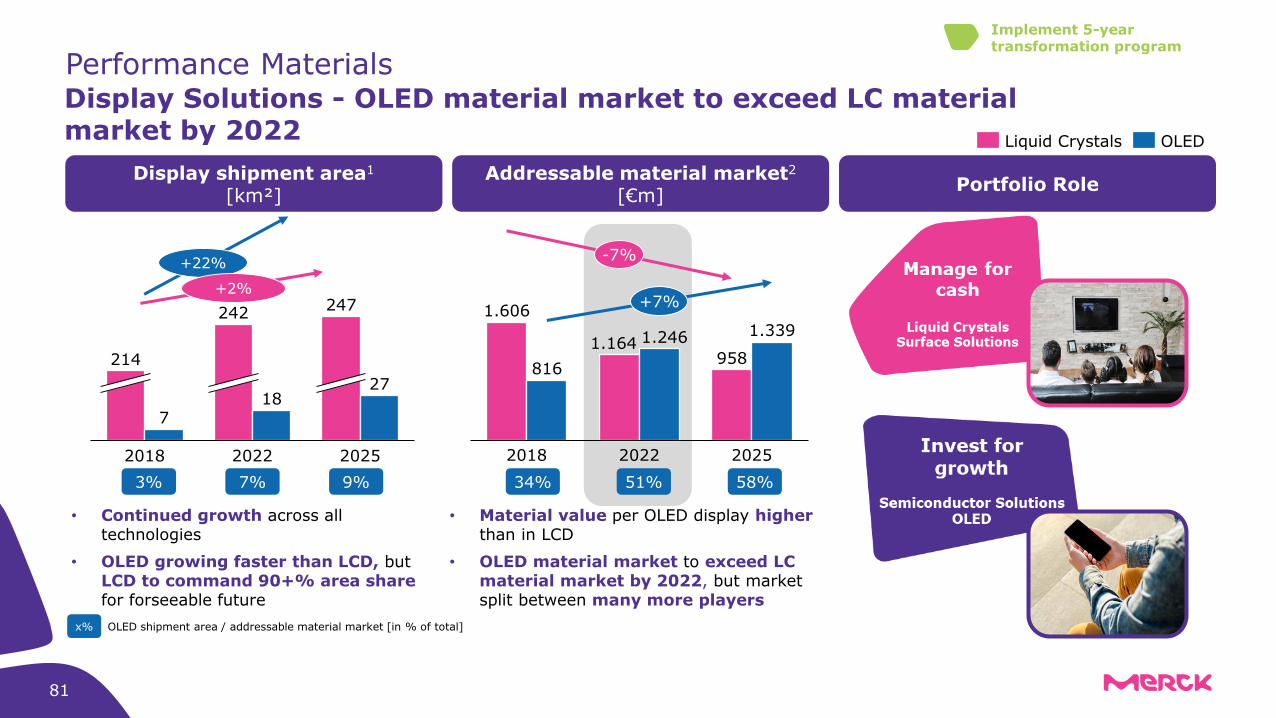
1827
2018 2022 2025
214
7
242247
3% 7% 9% 34% 51% 58%
OLED shipment area / addressable material market [in % of total]x%
Portfolio Role
1.606
1.164958
816
1.246 1.339
20252018 2022
-7%
+7%
Display shipment area1
[km²]Addressable material market2
[€m]
Liquid Crystals OLED
• Continued growth across all technologies
• OLED growing faster than LCD, but LCD to command 90+% area share for forseeable future
+22%
+2%
• Material value per OLED display higherthan in LCD
• OLED material market to exceed LC material market by 2022, but market split between many more players
Implement 5-year transformation program
Performance MaterialsDisplay Solutions - OLED material market to exceed LC material market by 2022
81

Market share (value) nearly quadrupled in 5 years1 Maintaining global top 3 position through …
•Continuous portfolio development:
•Strategic partnerships:
Proximity to the customer:
• 2015: Opening of OLED development center Korea
• 2018: Opening of OLED technology center China
• 2018: Strategic cooperation with important Chinese customer
20182013 …
Others
Leading competitor 1
Merck
Leading competitor 2
100%
# of Merck OLED materials in mass
production with annual revenues >€1 m
Implement 5-year transformation program
20
020192012
Performance Materials OLED – A major driver of topline growth with significant potential
82

Organic growth driven by all regions
Regional breakdown of net sales [€m]
•Strong APAC due to double-digit growth of
Glucophage®, Erbitux
®and OLED; Life
Science with ongoing strong demand
•Europe driven by strong demand in Life
Science; strong Mavenclad®
ramp-up
overcompensates Rebif®
decline
•North America reflects double-digit growth
of Process Solutions, Fertility and
Mavenclad®
ram-up, outweighing double-
digit decline of Rebif®
•Solid performance in LATAM due to strong
Life Science, Erbitux and N&I franchise
•Middle East and Africa driven by strong
Rebif®
and Glucophage®
Regional organic development
26%
30%
34%
4%6%
Q2 2019
Net sales:
€3,971 m
Middle East & Africa
Asia-Pacific
Europe
Latin America
North America
+3.6%org.
+10.0%org.
+6.7%org.
+4.9%org.
+2.5%org.
Acronyms: APAC – Asia-Pacific; MEA – Middle East & Africa; LATAM – Latin America83

Q2 2018 Organic Currency Portfolio Q2 2019
1ARS – Argentine peso;
2Thereof IFRS 16 effect with +3.5% (+€32 m);
Totals may not add up due to rounding
Life Science and Healthcare drive organic growth supported by FX tailwinds
•Solid growth in Healthcare reflects stable core
business and increasing contributions from
Mavenclad®
and Bavencio®
•Above-market organic growth in Life Science due to
strong demand across all businesses and regions
•Performance Materials reflects lower LC due to
reduced China ramp-up support and softer market
demand in Semiconductor and Surface Solutions;
OLED again strong
Healthcare 5.2%
Organic Currency
0.7%
Life Science
Performance Materials
Group
Portfolio Total
0.0% 5.9%
9.0% 2.1% -0.6% 10.5%
-2.0% 2.4% 0.0% 0.4%
5.6% 1.5% -0.2% 6.9%
Q2 2019 YoY net sales
Q2 YoY EBITDA pre
€920 m€1,139 m
• Increased organic EBITDA pre driven by
milestone payments and deferred income in HC
as well as ongoing strong performance of LS
•Positive FX impact on EBITDA pre due to
EUR/USD development and last years’ ARS1
devaluation burdened by hedging losses
20.3%2
3.3% 0.3%
84

Q2 2019: Overview
Net sales
Q2 2018
3,714
EBITDA pre
EPS pre
Operating cash flow
Q2 2019 Δ
3,971 6.9%
920 1,139 23.8%
1.23 1.54 25.2%
367 743 102.2%
•Net sales growth driven by
Life Science and Healthcare
•EBITDA pre & margin reflect Peg-Pal (~€75
m) and Bavencio®
(~€35 m) milestones,
GSK deferred income (~€30 m) and strong
performance of LS
•Strong operating cash flow due to higher
profit after tax and GSK upfront payment
•Working capital reflects increased business
activity and FX
•Higher net financial debt mainly due to
IFRS 16 adoption, dividends and temporary
investment of cash proceeds from
CH divestment
Comments
[€m]
Margin (in % of net sales) 24.8% 28.7%
Net financial debt 6,701
Working capital
Employees
Δ
7,829 16.8%
3,486 3,866 10.9%
51,749 53,051 2.5%
Dec. 31, 2018
Key figures
[€m] June 30, 2019
Totals may not add up due to rounding.85

Healthcare: Underlying profitability increases vs. Q1 driven by organic performance and cost discipline, further boosted by non-recurring business-related income
•Solid growth in Healthcare driven by General Medicine, Mavenclad®,
Erbitux®, Fertility and Bavencio
®, more than offset strong Rebif
®decline
•Mavenclad®
with continued strong uptake supported by initial U.S. sales
following approval (+41% vs. Q1)
•Bavencio®
on track; Erbitux®
benefiting from China reimbursement,
still facing ongoing competition and price pressure in major markets
•R&D below prior year due to stringent project prioritization
•Higher EBITDA pre driven by Peg-Pal (~€75 m) and Bavencio®
(~€35m) milestone as well as GSK deferred income (~€30 m), sequential underlying
3margin increase
Healthcare P&L
Net sales bridge
Comments
1LY numbers have been modified, due to disclosure changes of adjustments;
2Thereof IFRS 16 effect with +3.2% (+€12 m);
3EBITDA pre adjusted for €140 m
non-recurring income; Totals may not add up due to rounding
EBITDA pre bridge
Q2 2018 Organic Currency Portfolio Q2 2019
37.3%2
2.2% 0.0%€379 m
€528 m
86
Net sales
Q2 20181 Q2 2019
1,677
Marketing and selling
Administration
Research and development
-84
345
528
EBIT
EBITDA
EBITDA pre
-599
-395
523
1,584
-82
155
379
-592
-407
338
Margin (in % of net sales) 31.5%23.9%
[€m]
Q2 2018 Organic Currency Portfolio Q2 2019
5.2% 0.7% 0.0%€1,584 m €1,677 m

Healthcare organic growth by franchise/product
Q2 2019 Q2 2018
17
20
93
120
184
203
180
383
23
61
97
124
191
212
237
331 -16%
>100%
+32%
+6%
+5%
+35%
+3%
+3%
87
Q2 2019 organic sales growth [%] by key product [€m]
H1 2019 organic sales growth [%] by key product [€m]
H1 2019 H1 2018
-16%
>100%
+27%
+4%
+9%
+49%
+2%
+10%
29
33
174
219
350
403
329
732
45
105
189
241
359
411
418
630

org.0.5%
org.0.4%
org.-1.9%
org.-7.2%
Neurodegenerative Diseases: Strong growth of Mavenclad®
still overcompensated by Rebif
®decline
383 363 344299
331
0
50
100
150
200
250
300
350
400
450
Q2 2018 Q3 2018 Q4 2018 Q1 2019 Q2 2019
2025
33
43
61
0
10
20
30
40
50
60
70
Q2 2018 Q3 2018 Q4 2018 Q1 2019 Q2 2019
Mavenclad®
net sales, [€m]
Sales development NDI, [€m]
Rebif®
net sales, [€m]
0
50
100
150
200
250
300
350
400
450
Q2 2018 Q3 2018 Q4 2018 Q1 2019 Q2 2019
Rebif Mavenclad
Rebif®
sales of €331 m in Q2
2019 reflects organic decline of
-16.1% mitigated by
FX effect of +2.5%
U.S. and European volume
decline mainly due to competition
U.S. decline in line with IFN
market dynamics
Mavenclad®
launch on track with increasing
contribution
FY 2019 guidance of up to mid triple-digit €m
NDI = Neurodegenerative Diseases & Immunology; IFN = Interferon
org.-5.1%
88

Global Launch Update
1High efficacy treatments include MAV, Gil, Ocr, Tys, Lem; 2IQVIA LRx data; consolidated retail + hospital data; 3IQVIA – fully consolidated Q1/19 data; 4Global MAVENCLAD ATU, DE neurologists (n=62), bar charts indicate difference between Mavenclad® and leading HE oral: positive numbers imply Mavenclad® strength vs. competitor; 5excludes US prescriptions
• Approval in 61 countries with reimbursement in ~50% to date, consistent with expectations
• >3,000 neurologists have now prescribed Mavenclad®
• Advancing clinical perception: relative perception vs approved high-efficacy agents continues to improve across major launch markets
• Increasing share of high-efficacy dynamic patients (new + switch)1 in major launch markets vs LY
• Germany: from 9% to 14% (Q1/18 vs Q1/19)2
• UK: from 8% to 20% (Q1/18 vs Q1/19)3
• Increasing use in earlier lines of therapy in major launch markets: ~30% of starts are treatment naïve5; Switches predominantly from platform orals & platform injectables
• MS Franchise in early launch markets returning to growth: Mavenclad® complementing Rebif® to drive franchise growth
Improved clinical perception versus leading HE oral (Germany)4
• MS Franchise sales evolution (Germany)
• Rebif maintaining share in IFN class
• Mavenclad competing in HE class
2017A 2018A 2019 LE
Mavenclad® Rebif®On track for up to mid-triple digit m€ sales in 2019
Multiple Sclerosis: Mavenclad® launch continues to make progress with sales +41% Q2 vs Q1 2019
89
+26
+33
+32
+9
-4
-9Reduces relapses
+1
Reduces new lesions
Reduces progression
0
Low malignancy risk
Q2 2019Q4 2017
Scale= 0-100
Deviation vs leading HE Oral

Payer & Physician Feedback
1Appropriate USA patients as per MAVENCLAD FDA label; 2The NDC (National Drug Code) is a unique product identifier code for all drugs in the USA; 3IQVIA/BrandImpactRx rolling 3 months end June: MAVENCLAD ranked 2nd across full panel on SOV, and shares reflecting NWRx, HE incl. Tys, Gil, Ocr, May, Mav, Lem; 4Spherix Global Insights RealTime Dynamix – MS Q2/19; 5Company data based on MAVENCLAD patient support program “MS Life Lines”
• Positive, early payer acceptance:
• Strong physician access resulting in leading share of voice3
• 86% of neurologists willing to prescribe Mavenclad®4
• ~ 3% high efficacy dynamic share in RRMS, and ~11% high efficacy dynamic share in SPMS/other (new + switch, April to June)3
• Broad spectrum of early adopters: both neurologists from academic centers and from community practices initiatingpatients on Mavenclad® (equal proportions to date)
• Mavenclad®’s novel mechanism, posology, and efficacy profile have made it a candidate for switches from all approved agents
mAbs35%
Injectables25%Orals
40%
Source of Prescription5
Multiple Sclerosis: Mavenclad® gaining momentum in the first 13 weeks of launch in the USA
60M lives1 with preferred access
~170M lives with no NDC block2
100% = total USA population
90
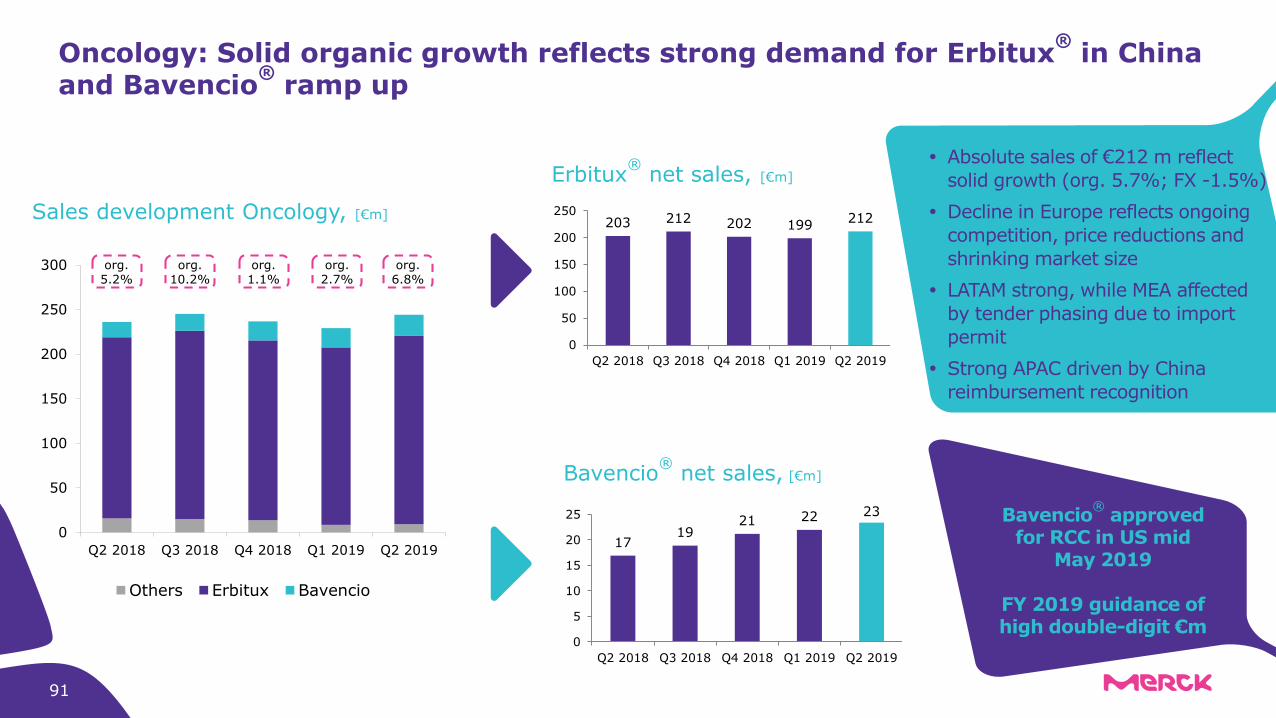
org.5.2%
org.10.2%
org.1.1%
org.2.7%
Oncology: Solid organic growth reflects strong demand for Erbitux®
in China and Bavencio
®ramp up
203 212 202 199212
0
50
100
150
200
250
Q2 2018 Q3 2018 Q4 2018 Q1 2019 Q2 2019
1719
21 22 23
0
5
10
15
20
25
Q2 2018 Q3 2018 Q4 2018 Q1 2019 Q2 2019
Bavencio®
net sales, [€m]
Sales development Oncology, [€m]
Erbitux®
net sales, [€m]
0
50
100
150
200
250
300
Q2 2018 Q3 2018 Q4 2018 Q1 2019 Q2 2019
Others Erbitux Bavencio
Absolute sales of €212 m reflect
solid growth (org. 5.7%; FX -1.5%)
Decline in Europe reflects ongoing
competition, price reductions and
shrinking market size
LATAM strong, while MEA affected
by tender phasing due to import
permit
Strong APAC driven by China
reimbursement recognition
Bavencio®
approved for RCC in US mid
May 2019
FY 2019 guidance of high double-digit €m
org.6.8%
91

org.8.0%
org.17.9%
org.10.7%
org.7.9%
Fertility: Moderate organic growth driven by ongoing demand for Gonal-f in the U.S.
184 182 175 168191
0
50
100
150
200
250
Q2 2018 Q3 2018 Q4 2018 Q1 2019 Q2 2019
117 116 122 119 123
0
50
100
150
Q2 2018 Q3 2018 Q4 2018 Q1 2019 Q2 2019
Other Fertility products net sales, [€m]
Sales development Fertility, [€m]
Gonal-f®
net sales, [€m]
0
50
100
150
200
250
300
350
Q2 2018 Q3 2018 Q4 2018 Q1 2019 Q2 2019
Other Fertility products Gonal-f
Fertility franchise posts moderate
organic growth driven by North
America and APAC
Gonal-f®
absolute sales reflect
moderate growth posting
€191 m (org. 2.8%; FX 0.9%)
Gonal-f®
driven by ongoing
strong demand in the U.S.
despite tough comps last year
Other Fertility products with
solid growth driven by APAC
and Europe
org.3.5%
92

Double digit organic growth of General Medicine fueled by China and LATAM
Endocrinology
•Endocrinology declines organically due to
lower demand and higher sales
deductions in the U.S. mitigated by
higher demand in LATAM and APAC
•General Medicine reflects double digit
growth of Glucophage®, ongoing strong
demand for Concor®
and Euthyrox®
driven by China and LATAM
Q2 2019 organic driversSales evolution
[€m]
General Medicine*
[€m]
Organic
*includes CardioMetabolic Care & General Medicine and Others
+12.0% org.
93
Organic
-3.4% org.93 87
9683 90
0
50
100
150
Q2 2018 Q3 2018 Q4 2018 Q1 2019 Q2 2019
507533 571
489583
0,0
200,0
400,0
600,0
Q2 2018 Q3 2018 Q4 2018 Q1 2019 Q2 2019

Life Science: Strong organic growth fueled by all businesses
• Process Solutions with continued strong demand: double-digit growth in all
major business fields, especially single-use
•Advanced Analytical and Lab Water main contributor to Applied Solutions
solid organic growth, all business segments and regions contributing
•Moderate organic growth of Research Solutions due to ongoing strong
demand for lab chemicals and workflow tools, especially in APAC and NA
•M&S increase reflects volume growth and investments in eCommerce
• EBITDA pre and margin increase driven by strong top-line
Life Science P&L
Net sales bridge
Comments
EBITDA pre bridge
Q2 2018 Organic Currency Portfolio Q2 2019
16.7%2
0.7% 0.7%€452 m€533 m
94
1,543
-65
254
-452
-61
442
29.3%
Net sales 1,705
Marketing and selling
Administration
Research and development
-68
322
533
EBIT
EBITDA
EBITDA pre
-490
-69
518
452
Margin (in % of net sales) 31.3%
Q2 2019[€m]
Q2 2018 Organic Currency Portfolio Q2 2019
9.0% 2.1% -0.6%€1,543 m €1,705 m
Q2 20181
1LY numbers have been modified, due to disclosure changes of adjustments;
2Thereof IFRS 16 effect with +2.8% (+€12 m);
Totals may not add up due to rounding
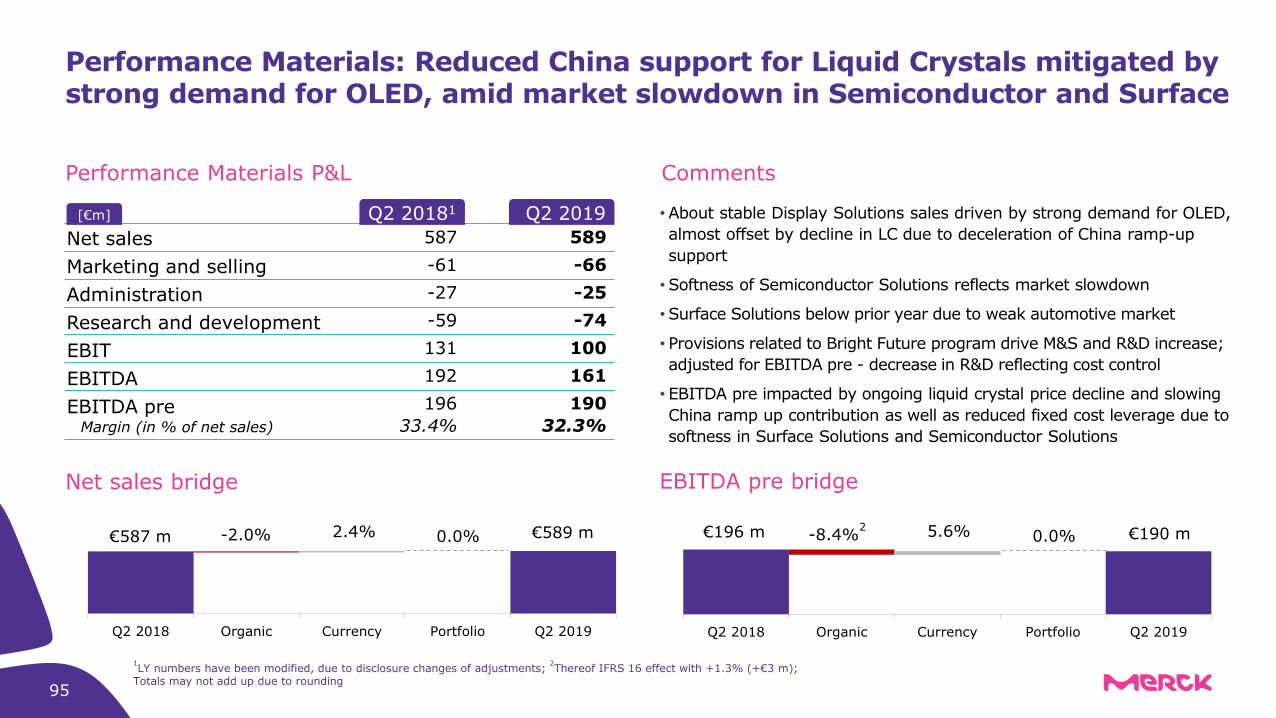
Performance Materials: Reduced China support for Liquid Crystals mitigated by strong demand for OLED, amid market slowdown in Semiconductor and Surface
•About stable Display Solutions sales driven by strong demand for OLED,
almost offset by decline in LC due to deceleration of China ramp-up
support
•Softness of Semiconductor Solutions reflects market slowdown
•Surface Solutions below prior year due to weak automotive market
• Provisions related to Bright Future program drive M&S and R&D increase;
adjusted for EBITDA pre - decrease in R&D reflecting cost control
• EBITDA pre impacted by ongoing liquid crystal price decline and slowing
China ramp up contribution as well as reduced fixed cost leverage due to
softness in Surface Solutions and Semiconductor Solutions
Performance Materials P&L
Net sales bridge
Comments
EBITDA pre bridge
Q2 2018 Organic Currency Portfolio Q2 2019
-8.4%2 5.6% 0.0%€196 m €190 m
95
587
-27
131
196
-61
-59
192
33.4%
Net sales 589
Marketing and selling
Administration
Research and development
-25
100
190
EBIT
EBITDA
EBITDA pre
-66
-74
161
Margin (in % of net sales) 32.3%
Q2 2019[€m]
Q2 2018 Organic Currency Portfolio Q2 2019
-2.0% 2.4% 0.0%€587 m €589 m
Q2 20181
1LY numbers have been modified, due to disclosure changes of adjustments;
2Thereof IFRS 16 effect with +1.3% (+€3 m);
Totals may not add up due to rounding

6,25,5
2,32,8
2,22,3
8,911,4
17,2
17,6
Dec. 31, 2018June 30, 2019
Totals may not add up due to rounding
Balance sheet – Reflecting bond placements and IFRS 16 adoption
• Higher cash & cash equivalents driven by bond placements (€1.5 bn)
• Property, plant and equipment increase mainly due to IFRS 16 adoption
• Other assets reflect temporary investment of cash proceeds from Consumer
Health divestment
• Increase in equity reflects profit after tax (equity ratio of 44.4%)
• Higher financial debt due to bond placements (€1.5 bn) and IFRS 16
reclassification of lease liabilities
• Increase of provisions for pensions reflects decline in interest rate
2,9 3,7
4,85,3
21,020,6
2,83,0
3,23,5
2,2
3,5
Dec. 31, 2018 June 30, 2019
Net equity
36.9 36.9
Assets [€ bn] Liabilities [€ bn]
Financial debt
Provisions for pensions
Other liabilities
Payables
39.6 39.6
Intangible assets
Inventories
Other assets
Property, plant & equipment
Receivables
Cash & cash equivalents
96

Reported figures
EBIT 392
Q2 2019 Δ
618 57.6%
• Increased EBIT due to Peg-Pal and
Bavencio®
milestones, GSK deferred
income as well as strong top-line
contribution from Life Science
•Effective tax rate within guidance
range of ~24-26%
•Higher net income and EPS reflect
higher EBIT
Comments
[€m]
Financial result
Profit before tax
Income tax
Effective tax rate (%)
EPS (€)
25.5% 24.4%
247 471 90.8%
0.57 1.08 89.5%
-65 -61 -5.4%
328 557 70.0%
-84 -136 62.8%
Reported results
Q2 2018
Net income*
*From continuing and discontinued operations;Totals may not add up due to rounding
97

251
25
-148
367
448
34
-243
-200
-168
-295
*LTIP – long-term incentive plan;Totals may not add up due to rounding
Cash flow statement
Profit after tax
Q2 2019 Δ
471 220
•Profit after tax in line with higher EBIT
•Changes in provisions driven by LTIP*
adjustment
•Changes in other assets/liabilities reflects GSK upfront and Peg-Pal milestone payment
•Changes in working capital driven by increased trade accounts payable
• Increased investing cash flow due to temporary investment of cash proceeds from Consumer Health divestment
•Higher financing cash flow reflects the issuance of new hybrid bonds (€1.5 bn)
Cash flow drivers
D&A
Changes in provisions
Changes in other assets/liabilities
Other operating activities
Changes in working capital
Operating cash flow
-51
-58 90
743 375
453 5
-47 -80
-26 217
Investing cash flow
thereof Capex on PPE
Financing cash flow
-870
-165 3
1,244 1,539
[€m]
Q2 2019 – cash flow statement
-76
-671
Q2 2018
98

Totals may not add up due to rounding
Q2 2018
Adjustments
[€m]
Healthcare
Life Science
Performance Materials
Corporate & Other
Total
26
97
40
26
5
Adjustments in EBIT
thereof D&A
0
17
0
16
1
Q2 2019
Adjustments
16
65
5
15
29
thereof D&A
0
0
0
0
0
Adjustments in Q2 2019
99
We are working on ambitious goals
Environment Social GovernanceClimate
We endeavor to reduce direct and indirect emissions to mitigate our impact on the climate.
Waste
We consider it fundamental to both prevent and recycle as much of our waste as possible.
Water
For us, sustainable water management means not negatively impacting the aquatic ecosystems
Product safety
Product safety is one of our top priorities: From safe handling of hazardous substances to ensuring patient safety.
Employees
We aim to be an attractive employer, encouraging creativity and development under ideal working conditions.
Access to Medicine
We support a variety of initiatives that improve access to health particularly for people in low- and middle-income countries.
Growth & Profit sharing
Our growth results from innovations and acquisitions strengthening our position in important markets, supported by strong cash-flow, long-term margins of >30% and a conservative but reliable dividend.
Risk management
We are focusing on a diversified business model: Our 3 sectors have pioneering knowledge to develop products to improve life for patients, further the success of our customers and meet global challenges.
Steering
Our core values along with the external regulations lead to business-guiding charters and principles for our responsible governance, documented in our Corporate Responsibility strategy and report.
Our Corporate Responsibility 2019, connected to the Sustainable Development Goals of the United Nations100
ESG

6.3
Emissions, Water, Waste reduced despite growing business
Emission-Target:
➢ Growth-independent reduction of Group‘s greenhouse gas emissions of 20% until 2020 vs. 2006
➢ Despite sales growth of 137% 2006 vs. 2018 we achieved a 11% reduction of CO2 equiv.
➢ We still confirm our goal for 2020 expecting positive impact from latest initiatives, e.g. process optimizations and change to renewable energy
Water-Target:
➢ At 24 sites with relevant water use in areas of high water stress we aim to cut water consumption by 10% until 2020 vs. 2014
➢ 2018, we lowered our water consumption by 11% resulting from sustainable water management and re-usage
➢ All pharmaceutical manufacturing facilities have wastewater treatment plants
Waste-Target:
➢ We reduce waste and recycle as much as possible - we aim to reduce the environmental impact of our waste by 5% until 2025 compared to 2016
➢ The Company Waste Score allows us to compare the amount of waste our sites are producing
➢ We ensure that raw materials are recycled and that unrecyclable waste is discarded
100% 90%2018: -11%
in 2014 in 2020100% 98% 95%
2016 2018 2025
100% 89% 80%
2006 2018 2020
CO2-Equivalents (absolute)
Sales in bn €
Water consumptionin water stress areas
Merck Waste Score
14.8
+137%
Our Corporate Responsibility 2019101
ESG

Our Corporate Responsibility 2019
ESG
External stakeholders valuate our engagement
In 2018, Our share was again included in STOXX Global ESG Leaders Index, a sustainability index that assesses companies based on key environmental, social and governance criteria.
We were ranked on 4th
place at Vigeo Eiris
among its peer companies
and is a Euronext Vigeo
Europe 120 member since
2015, including companies
with high performance in
38 sustainability drivers.
Since 2008, Our shares
have been included in the
FTSE4Good Index,
measuring the performance
of companies demonstrating
strong ESG practices
In 2018, Oekom
research AG gave us a
“B-” rating which means
we have once more
achieved prime
status.
2018, Sustainalytics
awarded us 79 out of
100 points, putting us
among the leading
pharmaceutical
companies: high
marks in CG,
community outreach,
and environmental
performance.
Merck was confirmed as
a constituent of the Ethibel
Sustainability Index (ESI)
Excellence Europe in 2018,
calculated and managed by
Standard & Poor’s.
We received Gold status in
2019, among the top 1%
of companies.
EcoVadis examines 45,000
suppliers from 150
countries. The rating
focuses is highly valued by
customers and suppliers.
In the 2018 Access to
Medicine Index we
maintained 4th place
(9th in 2012, 6th in 2014
and 4th place in 2016).
The ranking appreciates
us supporting low and
middle income countries.
Participation in CDP (formerly
Carbon Disclosure Project)
since 2008.
CDP Climate: In 2018, we
scored “C” (2017: B).
CDP Water: In 2018 we
received a “B-” (2017: B).
102

Financial calendar
EventDate
November 14, 2019 Q3 2019 Earnings release
March 5, 2020 FY 2019 Earnings release
April 24, 2020 Annual General Meeting
103
May 14, 2020 Q1 2020 Earnings release

CONSTANTIN FEST
Head of Investor Relations+49 6151 72-5271 [email protected]
EVA STERZEL
ESG / Institutional & Retail Investors / AGM+49 6151 72-5355 [email protected]
AMELIE SCHRADER
Institutional Investors / Analysts +49 6151 [email protected]
Assistant Investor Relations+49 6151 72-3744 [email protected]
SVENJA BUNDSCHUH ALESSANDRA HEINZ
Assistant Investor Relations+49 6151 72-3321 [email protected]
EMAIL: [email protected]
WEB: www.merckgroup.com/investors
FAX: +49 6151 72-913321Institutional Investors / Analysts +49 6151 [email protected]
PATRICK BAYER