Ballot Order Effects and Party Responses: Evidence from ... · Colombia is currently divided into...
26
Saad Gulzar Nelson A. Ruiz January, 2018 Working Paper No. 1019 Ballot Order Effects and Party Responses: Evidence from Lotteries in Colombia
Transcript of Ballot Order Effects and Party Responses: Evidence from ... · Colombia is currently divided into...

Saad Gulzar
Nelson A. Ruiz
January, 2018
Working Paper No. 1019
Ballot Order Effects and Party Responses:
Evidence from Lotteries in Colombia

Ballot Order Effects and Party Responses:Evidence from Lotteries in Colombia
Saad Gulzar ∗ Nelson A. Ruiz†
January 23, 2018
Abstract
Ballot positions often affect the electoral performance of parties. Existing theoriesfor this effect focus on voter-specific behavioral explanations. We present evidence onan additional unexplored mechanism: parties adjust their behavior to account for theirposition on the ballot. This adjustment matters for how we interpret existing results.First, we use a constituency level lottery of ballot positions across two elections and1971 races in Colombia. We find evidence for a ballot position effect of 6.7 percenton vote share, and 8.8 percent on seat share. Second, we show that parties raise andspend more money on their campaigns if they are allocated a top spot on the ballot.Finally, we show that campaign spending is correlated with higher vote shares. Ourresults suggest that the existing literature may be overstating the contribution of thevoter behavioral channel on ballot order effects.
∗Political Science Department. Stanford University. [email protected]†International Development Department. London School of Economics. [email protected]

1 Introduction
Aberrant behavior at the polling booth has had the attention of political scientists for a long
time. One such behavior is the tendency of voters to vote disproportionately more for parties
listed at the top of the ballot, regardless of the identity of the party (Krosnick, Miller and
Tichy, 2004; Ho and Imai, 2008; Blom-Hansen et al., 2016). Existing, mostly behavioral,
explanations for the reasons for this effect focus on voters on election day. This paper argues
that ballot order effects maybe augmented, or countervailed, if parties adjust their campaigns
in response to where they are placed on the ballot. A part of the documented effect in the
decades old literature may therefore emerge through a party channel rather than the voter
channel. In theory, this channel may also be the reason why several scholars find null effects
of ballot order randomization.
We study the case of Colombia where party positions in each ballot for local Mayors and
Councilors for every municipality in the country are assigned through lotteries. We combine
three data sources: election data for two elections in Colombia – Mayors and Councils; scans
of 2196 races machine and hand coded for party positions on the ballots; and new campaign
revenue and spending data at the transaction level for each party on every ballot for all of
Colombia.
First, we establish the existence of the ballot order effect in Colombia. We show that being
on the top row on the ballot causes an increase in party vote-share by 0.8 percent points, a
treatment effect of 6.6 percent. Since ballot positions are randomized at the race level, we
also observe an effect of 8.78 percent on a party’s seat share. Second, we present evidence
on how parties adjust campaigns in response to the ballot order. Parties in the top row raise
11.68 percent more money and spend an equivalent amount on campaigning. Additional
tests show that the increased spending is mostly on publicity and electioneering. Finally,
2

we show that there exists a correlation between higher expenditure and vote share in our
sample.
This paper makes several contributions. First, we introduce and test for a new mechanism
for a large body of literature on ballot order effects that spans several decades, and more
broadly on election day factors’ effect on voting (Brians and Grofman, 2001; Addonizio,
Green and Glaser, 2007; Ansolabehere, 2009). The ballot order effects we observe can arise
through a party strategic response channel in addition, or instead of, a behavioral channel
(Lau and Redlawsk, 2001; Augenblick and Nicholson, 2015). This is in line with recent work
that argues that voters may be more strategic (and less behavioral) in their actions than
is commonly assumed (Ashworth, De Mesquita and Friedenberg, 2018). Second, we add
evidence on ballot order effects from elections at two levels of government from a developing
country to a literature that is dominated by research on the US, with a few examples from
other developed democracies (Blom-Hansen et al., 2016). Instead of being larger as predicted
by a theory that argues that less educated voters may rely more on heuristics, the point
estimates we observe are similar in magnitude to other studies from the US.
2 A Party-Based Mechanism
The order in which candidates and parties appear on the ballot can affect their electoral
performance.1 A large body of work either explicitly tests for (Bagley, 1965; Ho and Imai,
2008; Koppell and Steen, 2004; Meredith and Salant, 2013; Kim, Krosnick and Casasanto,
2015; Taebel, 1975; Geys and Heyndels, 2003; Blom-Hansen et al., 2016) or suggests that a
1We reproduce Table 1 from Blom-Hansen et al. (2016) in Appendix Table A1. The
table provides a review of work on ballot order effects from the US and abroad that address
empirical issues in the earlier literature.
3

voter-based mechanism explains why ballot-order effect exists (Alvarez, Sinclair and Hasen,
2006; Chen et al., 2014; Darcy, 1986; Miller and Krosnick, 1998; Gold, 1952; Faas and Schoen,
2006; King and Leigh, 2009). As illustrated in Figure 2, voters are often decision-fatigued
and operate in low information environments, and as a consequence, may resort to heuristics
to make a decision. For example, under the ‘primacy’ hypothesis, voters are more likely to
choose names listed on the top of the ballot because they begin searching the ballot with an
aim to confirm a choice rather than reject it. ‘Recency’ effects exist when people chose the
last listed name because they search the ballot in a low information environment looking for
specific reasons to vote for a party but reached the end undecided (Krosnick, 1991). Most
recent work finds evidence for ‘primacy’ effects, which is the focus of our empirical analysis
below. Finally, another explanation models ‘satisficing’ voters, who accept the first solution
presented to them for the voting problem (Simon, 1957).
We present an additional account that focuses on party and candidate behavior for why
ballot order effects might exist. It is evident from previous work that candidates care a lot
about the order in which they appear on the ballot.2 The order in which names appear
on the ballot is often announced a few weeks before the elections, which allows candidates
the opportunity to do adjust their behavior. For example, the 2016 California Primary, an
election type studied extensively in the literature, was held on June 7th. The ballot order
alphabet randomization for this election was carried out on March 17, and a certified list of
candidates was published on March 31st, while the actual election took plane on June 7th,
giving candidates over 2 months to respond to the ballot order.3
2See Krosnick, Miller and Tichy (2004) for a review of court cases around ballot order
initiated by parties and candidates.
3See: “Key Dates for June 7 California Primary” at http://www.sos.ca.
gov/administration/news-releases-and-advisories/2016-news-releases-and-
4
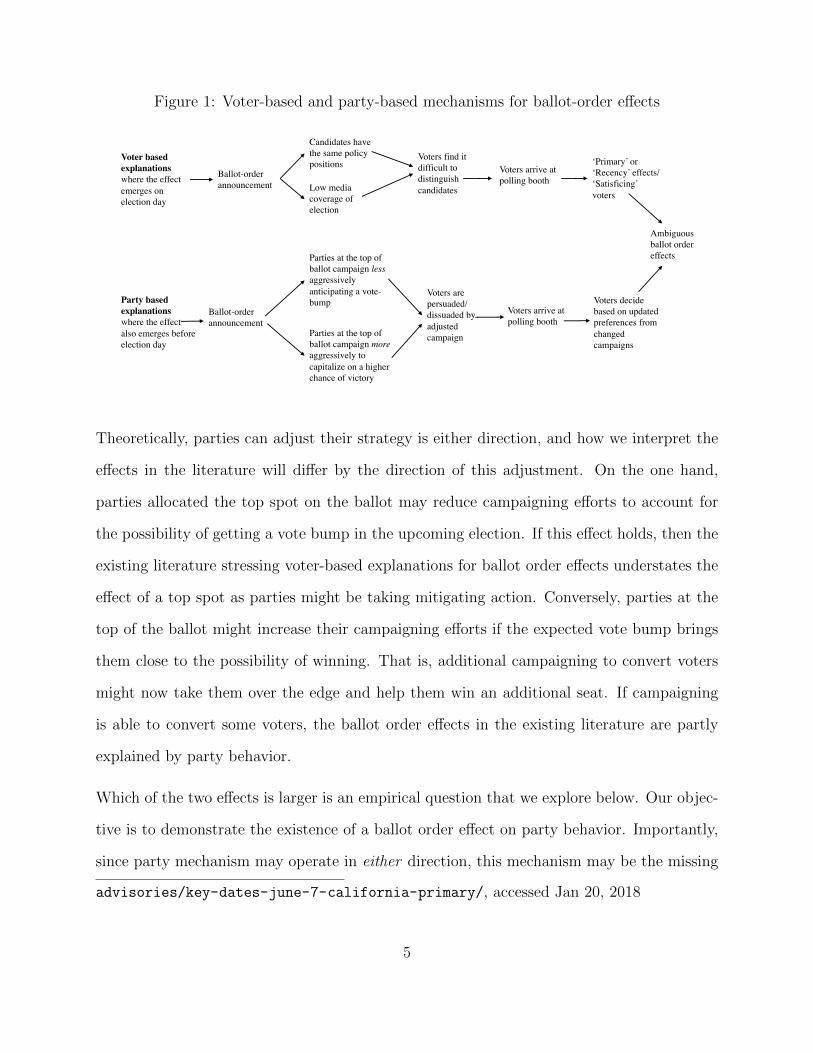
Figure 1: Voter-based and party-based mechanisms for ballot-order effects
Ballot-order announcement
Candidates have the same policy positions
Low media coverage of election
Voters find it difficult to distinguish candidates
‘Primary’ or ‘Recency’ effects/ ‘Satisficing’ voters
Voter based explanations where the effect emerges on election day
Party based explanations where the effect also emerges before election day
Ballot-order announcement
Parties at the top of ballot campaign lessaggressively anticipating a vote-bump
Parties at the top of ballot campaign moreaggressively to capitalize on a higher chance of victory
Ambiguous ballot order effects
Voters arrive atpolling booth
Voters arepersuaded/ dissuaded by adjusted campaign
Voters arrive atpolling booth
Voters decide based on updated preferences from changed campaigns
Theoretically, parties can adjust their strategy is either direction, and how we interpret the
effects in the literature will differ by the direction of this adjustment. On the one hand,
parties allocated the top spot on the ballot may reduce campaigning efforts to account for
the possibility of getting a vote bump in the upcoming election. If this effect holds, then the
existing literature stressing voter-based explanations for ballot order effects understates the
effect of a top spot as parties might be taking mitigating action. Conversely, parties at the
top of the ballot might increase their campaigning efforts if the expected vote bump brings
them close to the possibility of winning. That is, additional campaigning to convert voters
might now take them over the edge and help them win an additional seat. If campaigning
is able to convert some voters, the ballot order effects in the existing literature are partly
explained by party behavior.
Which of the two effects is larger is an empirical question that we explore below. Our objec-
tive is to demonstrate the existence of a ballot order effect on party behavior. Importantly,
since party mechanism may operate in either direction, this mechanism may be the missing
advisories/key-dates-june-7-california-primary/, accessed Jan 20, 2018
5
explanation for why some studies in the literature find no effect of the ballot order (see
Appendix Table A1).
3 Background
3.1 Local Elections in Colombia
Colombia is currently divided into 1098 municipalities located within 32 departments, where
local elections are held every 4 years. In each local election, politicians are elected for: local
administrative juntas, councils, mayors, department assemblies, and departmental gover-
nors. Local administrative juntas are representative at the sub-municipality level, and are
only present in a handful of municipalities, while councils and mayors are elected for every
municipality 4. The council’s main role is to approve the annual budget on projects proposed
by the municipal mayors and play an overall supervisory role for these projects. Mayors are
the main executive figure in the municipality, designing the budget and implementing pub-
lic policy. Compared to the historic bipartisanship currently Colombia has many parties
running for local councils. For the 2015 election on average 8 parties participate in council.
3.2 Random assignment of position in ballots
Currently there is a simple plurality rule for electing Mayors, and each party is allowed to
present a single candidate. Voters are allowed to cast one vote per party/candidate. An
example of the ballot is present in 2. In the case of councils a proportional representation
4Here we focus on Mayor and Council elections since they are present in all municipalities
in Colombia
6
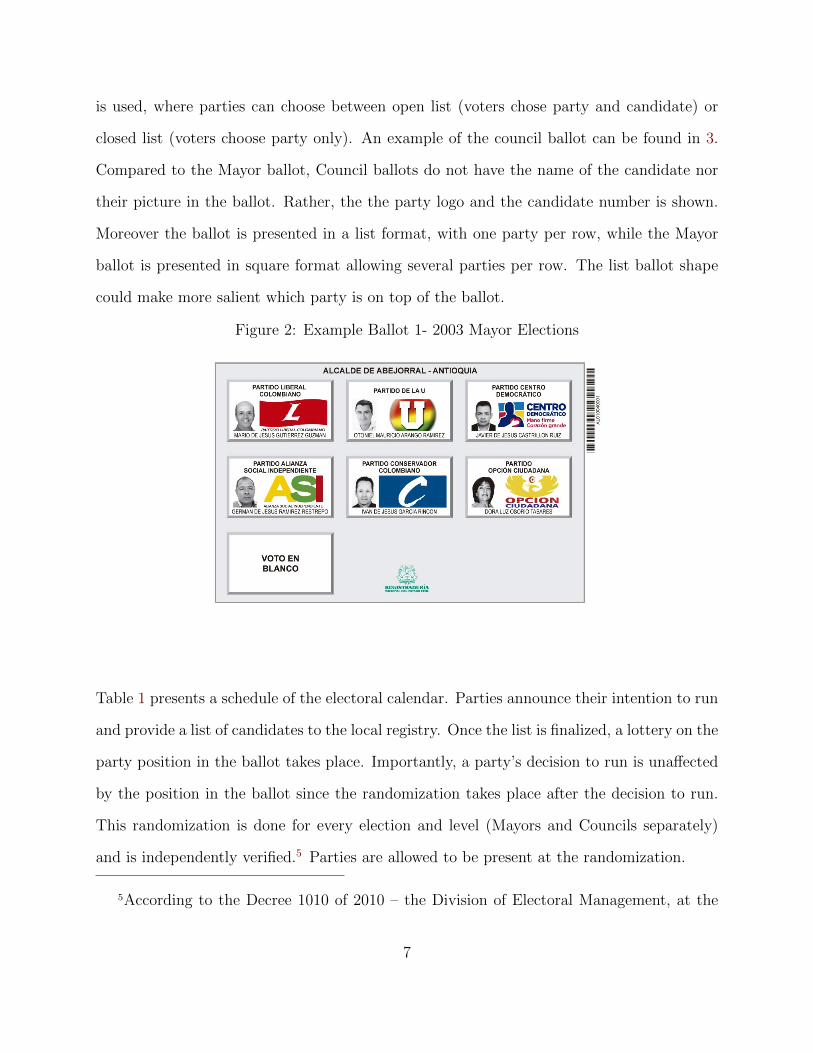
is used, where parties can choose between open list (voters chose party and candidate) or
closed list (voters choose party only). An example of the council ballot can be found in 3.
Compared to the Mayor ballot, Council ballots do not have the name of the candidate nor
their picture in the ballot. Rather, the the party logo and the candidate number is shown.
Moreover the ballot is presented in a list format, with one party per row, while the Mayor
ballot is presented in square format allowing several parties per row. The list ballot shape
could make more salient which party is on top of the ballot.
Figure 2: Example Ballot 1- 2003 Mayor Elections
Table 1 presents a schedule of the electoral calendar. Parties announce their intention to run
and provide a list of candidates to the local registry. Once the list is finalized, a lottery on the
party position in the ballot takes place. Importantly, a party’s decision to run is unaffected
by the position in the ballot since the randomization takes place after the decision to run.
This randomization is done for every election and level (Mayors and Councils separately)
and is independently verified.5 Parties are allowed to be present at the randomization.
5According to the Decree 1010 of 2010 – the Division of Electoral Management, at the
7

Figure 3: Example Ballot 2 - 2015 Council Elections
8

Table 1: Deadlines for list type decisions
Deadline List type decision25th of July 2015 Inscription of Candidates in the Local Registry28th of July 2015 Parties can initiate political propaganda31st of July 2105 Last day to announce changes in the party lists only if a candidate quits2nd of August 2015 Publication on the web-page of final list of candidates4th of August Lottery of party places in the ballot25th of October 2015 Election date1st of January 2016 Elected officials take office
4 Empirics and Data
4.1 Data
We use the electoral data compiled by Pachon and Sanchez (2014). We combine these
with election results obtained directly from the Registradurıa Nacional del Estado Civil. We
calculate the vote share for parties, the seat share, and the number of seats obtained. In order
to code the position in the ballot we obtained scans of all ballots for Mayors and Councils in
2015 (N=2196). Using hand coding and an optical character recognition package in Python,
we coded if the party was on top of the ballot. However not all ballots have more than one
row, therefore we drop them from the analysis since there is no variation on who is in top.
This happens only for Mayor ballots which are squared.
We also obtain data on campaign income and spending from the National Electoral Com-
mission6. For each candidate, these data reports the total income of the campaign, broken
National Electoral Council – a non partisan entity would be in charge of ensuring the ran-
domization of party position within each ballot.
6Cuentas Claras En Eleccionnes. Accessed January 20, 2018. http://www.
9

down by source of income, if the income of the campaign came from the candidate’s own
sources, donations, or the party. Similarly, the data report total expenditure, broken down
by the expenditure items. A detailed breakdown is given in Appendix Tables A2 and A3.
4.2 Estimation
We assemble a party-ballot level dataset and run regressions of the following form:
Ypc = βTop Rowpc + αc + γp + εpc (1)
where outcomes, Ypc, are measured for each party p in each constituency c. Top Rowpc is an
indicator variable for whether the party enters the ballot in the top row. We include ballot
fixed effects (αc) in the regression to account for common shocks at the race level. Since
the lottery assigns unique numbers to the party, we also include party fixed effects (γp) so
that we only compare within party variation. To account for spillovers in voter and party
decisions, we cluster standard errors at the ballot level.
4.3 Balance
To test the validity of random assignment of ballot position, we construct data on party
characteristics. For instance, one concern is that bigger parties are able to manipulate the
system to be systematically be on top of the ballot. We code party size (measured as the
number of municipalities the party contests in), if the party has participated in more than
one election, as well as their previous vote share where they ran in the previous election for
the same constituency. We also code if parties are right leaning (Fergusson et al., 2017) or
cnecuentasclaras.com/
10

minorities, as well as if they are one of the two main traditional parties. Appendix Table A4
shows that we have good balance on these variables using our main specification above.
5 Results
Table 2: The Effect of Party in Top Row of the Ballot
Councils MayorsVote Share Seat Share # Seats Vote Share Winner
(1) (2) (3) (4) (5)
Effect of Row = 1 0.008*** 0.011*** 0.127*** 0.005 0.011(0.003) (0.004) (0.038) (0.006) (0.016)
Mean if Row > 1 0.122 0.121 1.338 0.195 0.189Effect Size (%) 6.60 8.78 9.52 2.51 5.88
# Ballots 1098 1098 1098 873 873# Observations 8684 8684 8684 3771 3771
Ballot FE Yes Yes Yes Yes YesParty FE Yes Yes Yes Yes Yes
Notes: *p < 0.1, **p < 0.05, ***p < 0.01. Standard errors, clustered at the ballot level, are in
parentheses. Each observation denotes a party within a ballot. All races with more than one row
on the ballot are included in the regression.
We begin by analyzing if a top position on the ballot translates into better electoral perfor-
mance for parties. Table 2 shows strong positive results for councils. We observe that being
in the top row increases a party’s vote share by 0.8 percent points, which translates to a
treatment effect of about 6.6 percent. The randomization occurs at the race level, the treat-
ment also affects actual electoral outcomes: the top row of council ballots increases the seat
share of parties by 1.1 percent points, and there is an 8.78 percent increase in the probability
of an additional seat for the party. This is verified by the increase in the number of seats
won by the party in column 3. Finally, we do not observe any effect of being allocated the
top row in the electoral performance of mayors, which might be due to the higher salience of
11

election or differences in the shape of the ballot as mentioned above. Moreover the ballot has
additional information such as a picture of the candidate and the name. Most importantly,
since we observe no effects on mayors, we can use these elections as a placebo case to study
the campaign effects we explore below.
Table 3: Campaign Revenue and Expenditure, Pesos per registered voter
Councils MayorsRevenue Expenditure Revenue Expenditure
(1) (2) (3) (4)
Effect of Row = 1 79.401** 76.148* 73.590 67.709(39.749) (39.461) (105.676) (103.988)
Mean if Row > 1 680.078 668.139 2665.489 2635.389Effect Size (%) 11.68 11.40 2.76 2.57
# Ballots 1092 1092 867 867# Observations 7767 7767 3452 3452Ballot FE Yes Yes Yes YesParty FE Yes Yes Yes Yes
Notes: *p < 0.1, **p < 0.05, ***p < 0.01. Standard errors, clustered at the ballot level,
are in parentheses. Each observation denotes a party within a ballot. All races with
more than one row on the ballot are included in the regression.
Next, we analyze campaign income and spending data to test if getting the top position
affects the way parties behave before the election day. We present the overall results below
in Table 3. Consistent with a party/candidate mechanism, we find that parties who are
allocated the top row in council election have raise campaign incomes and by about 11.5
percent. In Appendix Tables A6 to A9, we break the results into official reporting categories.
We find that the increase in income comes primarily from candidates’ own income and not
additional donations or loans. This suggests that the change in behavior from an anticipated
voter bump which emerges specifically from the candidates on the ballot. In addition, we
find that the top row party candidates also spend statistically significantly more money on
Administrative expenses and Transport and Mailing expenses. A story consistent with these
effects is that the candidates are sending out more campaign material via post, an activity
12
that would be recorded under these two budget heads. In addition, the point estimate on
general electioneering expenses is also positive and large, albeit not statistically significantly
different from zero. If we add this point estimate to the treatment effects on administration
and mailing costs, the total comes out to 70.74 additional pesos per registered voter which
gets very close to the treatment effect in Column 2 in Table 3, which would suggest the
additional spendings is done to obtain more votes. Finally, as expected, we observe no
consistent effects on Mayors’ campaign income or expenditure.
To further probe the robustness of the previous result, we code if the transaction-level notes
on campaign spending contain words that signal that the expense is related to publicity.
This new outcome variable takes on the value of the transaction, normalized by registered
voters, if the transaction description contained words like ‘posters’ and ‘flyers’.7 We again
find that the point estimate on this variable is in the vicinity of the effect in Table 3 and it
only comes out significant for Councils.
Finally, we also find that every 1,000 pesos spent per registered voter is correlated with 0.028
in vote share and 0.036 in seat share.8 While this final result is purely correlational, it does
signal that, controlling for party and ballot characteristics, more campaigning yields higher
vote shares in our sample.9
7See Table A10 for key words used and Table A11 for the results.
8See Appendix Table A12 for these correlations.
9We do not partition the data by the top spot on the ballot as campaign spending is
post-treatment.
13
6 Conclusion
Consistent with existing results, results indicate that party location in the ballot affects their
electoral results – voters vote for the parties located on top independent of constituency
and party characteristics. We present evidence that parties also react to ballot positions by
raising and spending more money, particularly on publicity. Finally, there exists a correlation
between higher spending and vote share. Our results show that previously estimated ballot
order effects my be overstating the contribution of a behavioral channel. Further research
should examine the conditions under which parties will reduce or increase their campaigning.
References
Addonizio, Elizabeth M., Donald P. Green and James M. Glaser. 2007. “Putting the Party
Back into Politics: An Experiment Testing Whether Election Day Festivals Increase Voter
Turnout.” PS: Political Science & Politics 40(4):721–727.
Alvarez, R Michael, Betsy Sinclair and Richard L Hasen. 2006. “How much is enough? The”
ballot order effect” and the use of social science research in election law disputes.” Election
Law Journal 5(1):40–56.
Ansolabehere, Stephen. 2009. “Effects of Identification Requirements on Voting: Evi-
dence from the Experiences of Voters on Election Day.” PS: Political Science & Politics
42(1):127–130.
Ashworth, Scott, Ethan Bueno De Mesquita and Amanda Friedenberg. 2018. “Learning
about voter rationality.” American Journal of Political Science .
Augenblick, Ned and Scott Nicholson. 2015. “Ballot position, choice fatigue, and voter
behaviour.” The Review of Economic Studies 83(2):460–480.
14

Bagley, Christopher R. 1965. “Does candidates’ position on the ballot paper influence voter’s
choice? A study of the 1959 and 1964 British General Elections.” Parliamentary Affairs
19(2):162–174.
Blom-Hansen, Jens, Jørgen Elklit, Søren Serritzlew and Louise Riis Villadsen. 2016. “Ballot
position and election results: Evidence from a natural experiment.” Electoral Studies
44:172–183.
Brians, Craig Leonard and Bernard Grofman. 2001. “Election day registration’s effect on
US voter turnout.” Social Science Quarterly 82(1):170–183.
Chen, Eric, Gabor Simonovits, Jon A Krosnick and Josh Pasek. 2014. “The impact of
candidate name order on election outcomes in North Dakota.” Electoral Studies 35:115–
122.
Darcy, Robert. 1986. “Position effects with party column ballots.” Western Political Quar-
terly 39(4):648–662.
Faas, Thorsten and Harald Schoen. 2006. “The importance of being first: Effects of candi-
dates’ list positions in the 2003 Bavarian state election.” Electoral Studies 25(1):91–102.
Fergusson, Leopoldo, Pablo Querubin, Nelson A Ruiz-Guarin and Juan F Vargas. 2017. “The
Real Winner’s Curse.” Working Paper .
URL: https://papers.ssrn.com/sol3/papers.cfm?abstract id=2912915
Geys, Benny and Bruno Heyndels. 2003. “Ballot layout effects in the 1995 elections of the
Brussels’ government.” Public Choice 116(1):147–164.
Gold, David. 1952. “A Note on the “Rationality” of Anthropologists in Voting for Officers.”
American Sociological Review 17(1):99–101.
Ho, Daniel E and Kosuke Imai. 2008. “Estimating causal effects of ballot order from a ran-
15

domized natural experiment: The California alphabet lottery, 1978–2002.” Public Opinion
Quarterly 72(2):216–240.
Kim, Nuri, Jon Krosnick and Daniel Casasanto. 2015. “Moderators of Candidate Name-
Order Effects in Elections: An Experiment.” Political Psychology 36(5):525–542.
King, Amy and Andrew Leigh. 2009. “Are ballot order effects heterogeneous?” Social Science
Quarterly 90(1):71–87.
Koppell, Jonathan GS and Jennifer A Steen. 2004. “The effects of ballot position on election
outcomes.” Journal of Politics 66(1):267–281.
Krosnick, Jon A. 1991. “Response strategies for coping with the cognitive demands of
attitude measures in surveys.” Applied cognitive psychology 5(3):213–236.
Krosnick, Jon A, Joanne M Miller and Michael P Tichy. 2004. “An unrecognized need for
ballot reform: The effects of candidate name order on election outcomes.” Rethinking the
vote: The politics and prospects of American election reform pp. 51–73.
Lau, Richard R and David P Redlawsk. 2001. “Advantages and disadvantages of cognitive
heuristics in political decision making.” American Journal of Political Science pp. 951–971.
Meredith, Marc and Yuval Salant. 2013. “On the causes and consequences of ballot order
effects.” Political Behavior 35(1):175–197.
Miller, Joanne M and Jon A Krosnick. 1998. “The impact of candidate name order on
election outcomes.” Public Opinion Quarterly pp. 291–330.
Pachon, Monica and Fabio Sanchez. 2014. Base de datos sobre resultados electorales CEDE,
1958–2011. Technical report Universidad de Los Andes-CEDE.
URL: https://ideas.repec.org/p/col/000089/012058.html
Simon, Herbert A. 1957. “Models of man; social and rational.”.
16

Taebel, Delbert A. 1975. “The effect of ballot position on electoral success.” American
Journal of Political Science pp. 519–526.
17

FOR ONLINE PUBLICATION: APPENDIX
Table A1: Experimental studies of ballot position effects from Blom-Hansen et al. (2016)
Experimental studies referred to Identified ballot position effect
Natural experiments from the USA (random rotation of order of candidates)Alvarez, Sinclair and Hasen (2006) Positive effect of being listed firstChen et al. (2014) Positive effect of being listed firstDarcy (1986) No position effectHo and Imai (2008) Positive effect of being listed firstKoppell and Steen (2004) Positive effect of being listed firstKrosnick, Miller and Tichy (2004) Positive effect of being listed firstMeredith and Salant (2013) Positive effect of being listed firstMiller and Krosnick (1998) Positive effect of being listed first
Other experimental studies from the USABagley (1965): Lab experiment No position effectGold (1952): Field experiment No position effectKim, Krosnick and Casasanto (2015): Survey experiment Positive effect of being listed firstTaebel (1975): Lab experiment Positive effect of being listed first
Natural experiments from outside the USAFaas and Schoen (2006): Bavarian state elections in Germany Positive effect of being listed firstGeys and Heyndels (2003): Regional elections in Brussels in Belgium Positive effect of being listed firstKing and Leigh (2009): Australian federal elections Positive effect of being listed firstBlom-Hansen et al. (2016): Danish local and regional elections Positive effect of being listed first
Notes: Besides the entry of the paper itself, this table is taken from Blom-Hansen et al. (2016).
i

Table A2: Descriptive Statistics for Council Elections
Variable N Mean Sd Min Max
Panle A. Election ResultsVote Share 7767 0.131 0.090 0.000 0.646Seats Share 7767 0.132 0.115 0.000 0.778Number of Seats 7767 1.452 1.239 0.000 10.000Registered Voters (Thousands) 7767 43.107 234.904 0.759 5188.174Row = 1 on Ballot 7767 0.126 0.331 0.000 1.000
Panle B. Party CharacteristicsNum. Munis Contesting 7767 808.900 221.411 117.000 1027.0002011 Vote Share(**) 4328 0.181 0.116 0.000 1.0002011 Seat Share(**) 4338 0.177 0.130 0.000 0.778Right Party 7767 0.063 0.244 0.000 1.000Traditional Party 7767 0.095 0.293 0.000 1.000Party participated in the last election 7767 0.557 0.497 0.000 1.000Campaign Data Missing 7767 0.000 0.000 0.000 0.000
Panle C. Campaign FinancingRevenues(*)Total 7767 703.828 1015.777 0.000 21953.410CandInc 7767 650.576 987.589 0.000 21953.410PvtContr 7767 34.259 157.224 0.000 4565.790Credits 7767 1.361 42.161 0.000 3048.012Events 7767 0.779 15.704 0.000 634.016State 7767 0.082 3.800 0.000 217.752Party 7767 16.771 125.137 0.000 3768.794Expenditures(*)Total 7767 691.340 1002.178 0.000 21953.410Total Advertising 7767 434.483 774.543 0.000 21953.410Admin 7767 76.876 224.327 0.000 5874.105Office 7767 22.887 100.508 0.000 3144.519Material 7767 53.548 186.525 0.000 6126.482PubActs 7767 164.283 443.237 0.000 15999.612TransMail 7767 123.487 321.906 0.000 9252.906Research 7767 2.178 31.606 0.000 1912.261Judicial 7767 32.812 116.147 0.000 3705.980Election 7767 161.763 363.971 0.000 13157.075Fin 7767 0.349 5.580 0.000 376.611Exceed 7767 0.066 2.152 0.000 119.119Other 7767 53.092 186.871 0.000 6399.881
Note *Total Colombian Pesos /Registered voters. ** Only available for parties whichparticipated in the previous election ii

Table A3: Descriptive Statistics for Mayors Elections
Variable N Mean Sd Min Max
Panel A. Election ResultsVote Share 3452 0.227 0.184 0.000 0.813Seats Share 3452 0.227 0.419 0.000 1.000Number of Seats 3452 0.227 0.419 0.000 1.000Registered Voters (Thousands) 3452 33.247 155.412 0.957 5188.174Row = 1 on Ballot 3452 0.586 0.493 0.000 1.000
Panel B. Party CharacteristicsNum. Munis Contesting 3452 401.474 131.731 2.000 549.0002011 Vote Share(**) 741 0.274 0.164 0.000 1.0002011 Seat Share(**) 742 0.290 0.454 0.000 1.000Right Party 3452 0.081 0.272 0.000 1.000Traditional Party 3452 0.071 0.257 0.000 1.000Party participated in the last election 3452 0.215 0.411 0.000 1.000Campaign Data Missing 3452 0.000 0.000 0.000 0.000
Panel C. Campaign FinancingRevenues(*)Total 3452 2907.861 3595.614 0.000 38047.973CandInc 3452 2390.536 3275.308 0.000 38047.973PvtContr 3452 424.834 1240.877 0.000 22065.811Credits 3452 41.023 488.766 0.000 12709.172Events 3452 24.513 221.889 0.000 6131.387State 3452 0.236 9.833 0.000 503.854Party 3452 26.718 280.512 0.000 10425.354Expenditures(*)Total 3452 2872.935 3562.663 0.000 38044.582Total Advertising 3452 1143.253 2047.488 0.000 31269.170Admin 3452 292.019 617.317 0.000 7670.851Office 3452 83.360 264.180 0.000 5158.661Material 3452 171.750 548.862 0.000 9571.578PubActs 3452 779.881 1578.065 0.000 23193.916TransMail 3452 652.123 1220.716 0.000 14247.581Research 3452 20.126 219.775 0.000 7310.023Judicial 3452 27.637 96.479 0.000 1476.620Election 3452 598.202 930.473 0.000 9900.744Fin 3452 0.000 0.000 0.000 0.000Exceed 3452 0.005 0.183 0.000 7.969Other 3452 245.991 1141.873 0.000 27126.154
Note *Total Colombian Pesos /Registered voters. ** Only available for parties whichparticipated in the previous election in the same constituency.
iii

Table A4: Balance Table
# Munis 2011 2011 Old Right Minority Traditional Campaign DataContesting Vote Share Seat Share Party Party Party Party Missing
(1) (2) (3) (4) (5) (6) (7) (8)
Panel A: CouncilsEffect of Row = 1 -0.000 -0.001 0.002 -0.004 0.006 0.000 -0.000 -0.001
(0.000) (0.005) (0.006) (0.009) (0.006) (0.000) (0.000) (0.009)
Mean if Row > 1 794.044 0.176 0.171 0.537 0.055 0.103 0.221 0.104Effect Size (%) -0.00 -0.84 1.08 -0.78 11.71 0.00 -0.00 -0.49
# Ballots 1098 1022 1022 1098 1098 1098 1098 1098# Observations 8684 4648 4648 8684 8684 8684 8684 8684
Panel B: MayorsEffect of Row = 1 0.000 0.020 -0.045 0.005 0.006 -0.000 -0.000 0.006
(0.000) (0.018) (0.055) (0.010) (0.007) (0.000) (0.000) (0.009)
Mean if Row > 1 386.121 0.245 0.265 0.204 0.065 0.088 0.250 0.085Effect Size (%) 0.00 8.14 -16.87 2.51 9.90 -0.00 -0.00 6.53
# Ballots 873 263 263 873 873 873 873 873# Observations 3771 571 571 3771 3771 3771 3771 3771
Ballot FE Yes Yes Yes Yes Yes Yes Yes YesParty FE Yes Yes Yes Yes Yes Yes Yes Yes
Notes: *p < 0.1, **p < 0.05, ***p < 0.01. Standard errors, clustered at the ballot level, are in parentheses. Each observation denotes a party
within a ballot. All races with more than one row on the ballot are included in the regression.
iv

Table A5: Donations Codebook
RevenuesCandInc Credits or contributions from the income of the candidates, or direct relativesPvtContr Contributions, grants and loans, in cash or kind, by private donorsCredits Credits obtained in financial institutions to finance the campaignEvents Income originating from public events, or publications by the party or movementState State FundingParty Political parties financing the candidate campaignsExpenditureAdmin Administrative expensesOffice Office expenses and acquisitionsMaterials Investment in materials and publicationsPubActs Public acts by the candidatesTransMail Transport and mail service costsResearch Political research and training of party membersJudicial Judicial accountability and expenses related to campaign accountsElection Electioneering expensesFin Financial costsExceed Expenses that exceed the amount set by the National Electoral CouncilOther Other expenses
Table A6: Campaign Revenue for Councils in 2015
CandInc PvtContr Credits Events State Party(1) (2) (3) (4) (5) (6)
Effect of Row = 1 74.230* 4.935 -0.928 -0.215 -0.076 1.455(39.328) (5.959) (0.834) (0.421) (0.048) (4.269)
Mean if Row > 1 627.308 33.580 1.466 0.831 0.094 16.799Effect Size (%) 11.83 14.70 -63.34 -25.84 -81.33 8.66
# Ballots 1092 1092 1092 1092 1092 1092# Observations 7767 7767 7767 7767 7767 7767Ballot FE Yes Yes Yes Yes Yes YesParty FE Yes Yes Yes Yes Yes Yes
Notes: *p < 0.1, **p < 0.05, ***p < 0.01. Standard errors, clustered at the ballot level, are in
parentheses. Each observation denotes a party within a ballot. All races with more than one
row on the ballot are included in the regression. See Table A5 for a description of the variables.
The outcomes are measured in persos per registered voters.
v

Table A7: Campaign Expenditure for Councils in 2015
Admin Office Material PubActs TransMail Research Judicial Election Fin Exceed Other(1) (2) (3) (4) (5) (6) (7) (8) (9) (10) (11)
Effect of Row = 1 19.355** -1.608 -8.952 15.349 30.627** -0.913 -5.673 20.753 0.054 -0.000 7.155(9.329) (3.548) (6.037) (15.349) (12.849) (0.709) (3.468) (16.993) (0.092) (0.086) (5.977)
Mean if Row > 1 73.400 22.708 53.909 156.762 117.306 2.280 32.560 157.648 0.345 0.063 51.160Effect Size (%) 26.37 -7.08 -16.61 9.79 26.11 -40.05 -17.42 13.16 15.70 -0.18 13.99
# Ballots 1092 1092 1092 1092 1092 1092 1092 1092 1092 1092 1092# Observations 7767 7767 7767 7767 7767 7767 7767 7767 7767 7767 7767Ballot FE Yes Yes Yes Yes Yes Yes Yes Yes Yes Yes YesParty FE Yes Yes Yes Yes Yes Yes Yes Yes Yes Yes Yes
Notes: *p < 0.1, **p < 0.05, ***p < 0.01. Standard errors, clustered at the ballot level, are in parentheses. Each observation denotes a party within a ballot.
All races with more than one row on the ballot are included in the regression. See Table A5 for a description of the variables. The outcomes are measured in
persos per registered voters.
Table A8: Campaign Revenue for Mayors in 2015
CandInc PvtContr Credits Events State Party(1) (2) (3) (4) (5) (6)
Effect of Row = 1 33.975 32.507 9.944 1.589 -0.236 -4.190(96.590) (43.635) (13.711) (7.512) (0.371) (8.879)
Mean if Row > 1 2198.267 388.984 30.120 21.580 0.373 26.165Effect Size (%) 1.55 8.36 33.01 7.36 -63.14 -16.01
# Ballots 867 867 867 867 867 867# Observations 3452 3452 3452 3452 3452 3452Ballot FE Yes Yes Yes Yes Yes YesParty FE Yes Yes Yes Yes Yes Yes
Notes: *p < 0.1, **p < 0.05, ***p < 0.01. Standard errors, clustered at the ballot level, are
in parentheses. Each observation denotes a party within a ballot. All races with more than one
row on the ballot are included in the regression. See Table A5 for a description of the variables.
The outcomes are measured in persos per registered voters.
Table A9: Campaign Expenditure for Mayors in 2015
Admin Office Material PubActs TransMail Research Judicial Election Fin Exceed Other(1) (2) (3) (4) (5) (6) (7) (8) (9) (10) (11)
Effect of Row = 1 -3.859 -14.359 8.391 -14.570 2.793 2.228 5.594* -1.107 0.000 -0.009 80.375*(20.859) (9.842) (19.082) (51.857) (37.616) (7.812) (3.309) (31.675) (.) (0.006) (42.813)
Mean if Row > 1 290.027 86.523 154.462 722.893 589.940 17.944 22.767 570.504 0.000 0.012 179.437Effect Size (%) -1.33 -16.60 5.43 -2.02 0.47 12.42 24.57 -0.19 . -76.01 44.79
# Ballots 867 867 867 867 867 867 867 867 867 867 867# Observations 3452 3452 3452 3452 3452 3452 3452 3452 3452 3452 3452Ballot FE Yes Yes Yes Yes Yes Yes Yes Yes Yes Yes YesParty FE Yes Yes Yes Yes Yes Yes Yes Yes Yes Yes Yes
Notes: *p < 0.1, **p < 0.05, ***p < 0.01. Standard errors, clustered at the ballot level, are in parentheses. Each observation denotes a party within a ballot.
All races with more than one row on the ballot are included in the regression. See Table A5 for a description of the variables. The outcomes are measured in
persos per registered voters.
vi

Table A10: Key words for coding Publicity spending
Words Words in spanishPublic event Evento publicoAdvertising PublicidadSpeech LocucionBanner PendonCommercial Cuna/PropagandaPoster Carteles/AfichesFlyer VolantesAdvertising schedule Pauta publicitariaAdvertising buttons Botones publicitariosPublicist PublicistaMarketing MarketingPrints EstampadosBillboard Valla publicitaria/PasacallesSound SonidoTelevision TelevisionRadio RadioPress PrensaLogistics LogısticaMural MuralStand StandVests ChalecosT-shirts CamisetasHats Gorras/Cachuchas
vii

Table A11: Total Spent on Publicity, pesos per registered voter
Councils Mayors(1) (2)
Effect of Row = 1 56.516* -27.770(33.214) (70.303)
Mean if Row > 1 419.526 1074.067Effect Size (%) 13.47 -2.59
# Ballots 1092 867# Observations 7767 3452Ballot FE Yes YesParty FE Yes Yes
Notes: *p < 0.1, **p < 0.05, ***p < 0.01. Stan-
dard errors, clustered at the ballot level, are in
parentheses. Each observation denotes a party
within a ballot. All races with more than one row
on the ballot are included in the regression. See
Table A10 for key words. When a key word is
found in the transaction description, that transac-
tion’s value is added to the new variable.
Table A12: Correlation of Campaigning and Electoral Performance
Councils MayorsTotal Revenue Total Expenditure Total Revenue Total ExpenditureVote Seat Vote Seat Vote Seat Vote SeatShare Share Share Share Share Share Share Share
(1) (2) (3) (4) (5) (6) (7) (8)
Effect of 1k peso/regist voter 0.028*** 0.036*** 0.028*** 0.036*** 0.029*** 0.059*** 0.030*** 0.061***(0.003) (0.004) (0.003) (0.004) (0.002) (0.004) (0.002) (0.004)
# Ballots 1092 1092 1092 1092 867 867 867 867# Observations 7767 7767 7767 7767 3452 3452 3452 3452Ballot FE Yes Yes Yes Yes Yes Yes Yes YesParty FE Yes Yes Yes Yes Yes Yes Yes Yes
Notes: *p < 0.1, **p < 0.05, ***p < 0.01. Standard errors, clustered at the ballot level, are in parentheses. Each observation denotes a party
within a ballot. All races with more than one row on the ballot are included in the regression.
viii