Ballistic Shock Attenuation for Armored Ground Vehicle ... · Ballistic Shock Attenuation for...
15
U-024.doc Page 1 of 15 Ballistic Shock Attenuation for Armored Ground Vehicle Electronics, Analysis and Validation Robert Sharp Principal Engineer – Defense Group Georges Laurent Engineering Laboratory Manager Barry Controls 82 South Street Hopkinton, MA Abstract: Combat vehicles carry increasing quantities of rack mounted electronics as part of the C4 structure. These systems must be isolated against damage from ballistic impact shock within a small sway space. Qualification testing of multiple rack configurations and interchangeable line replaceable units (LRUs) would require significant time and expense. Barry Controls has developed an analytical method validated through bench testing to reduce qualification time and expense. System input and response data were recorded during air cannon testing of a GDC4 rack system. The data were compared to MIL-STD-810 Method 522 tables and SRS curves. Barry Controls performed system analysis and designed isolators to withstand 30G, 50G and Ballistic shock within the allowable sway space. An isolated system was then subjected to 30G, 50G and repeated Ballistic shock testing and comparisons were made to the analytical results. The Barry Controls isolators successfully isolated the equipment from ballistic shock within the allocated sway space. The analytical method proposed by Barry Controls proved to be an accurate method to predict ballistic performance. Present and future systems can be rapidly and economically analyzed to these inputs with a high degree of confidence. Introduction - Program Development: General Dynamics C4 Systems approached Barry Controls to recommend an isolation system for a family of communications equipment being developed for the Future Combat System. Nine distinct rack mounting systems containing multiple interchangeable LRUs were being proposed for ten vehicles. This evolved into a large matrix of installation configurations all requiring shock and vibration qualification. A maximum of one inch sway space was allowed for all systems at all inputs, including ballistic shock per MIL-STD-810 Method 522 [1]. The customer desired a method to qualify all of these systems in all applications with a minimum of physical testing. General Dynamics supplied data recorded during testing of a prototype system with a gas gun type Mechanical Shock Simulator. The Walton papers [5, 6] from MIL-STD-810 were referenced for test arrangement and instrumentation, and several ballistic impact time histories were recorded. The validity of that data had not been evaluated other than a graphic comparison to the SRS in Figure 522.1-1. Ballistic Impact Time History Review: The early prototype testing with the General Dynamics gas gun yielded several time histories from accelerometers placed on the system and at opposite ends of a fixture beam. This beam had previously been used to shape the pulse to mimic a Pyroshock separation simulation. SRS analysis of these histories indicated that the data from the ends of the beam could be an over test at frequencies below 100 Hz, but an SRS of the average of those time histories was a good approximation of the MIL-STD 810 Figure 522.1-1 limits. The accelerations of all of these inputs were greater than those of a time history synthesized from the MIL-STD-810 Average Shock. Analysis for this comparison was limited to just over 10 KHz by data recording rates and the capabilities of readily available codes for SRS generation and time history synthesis. Figure 1 is a plot of this SRS comparison.
Transcript of Ballistic Shock Attenuation for Armored Ground Vehicle ... · Ballistic Shock Attenuation for...
U-024.doc Page 1 of 15
Ballistic Shock Attenuation for Armored Ground Vehicle Electronics, Analysis and Validation
Robert Sharp
Principal Engineer – Defense Group
Georges Laurent Engineering Laboratory Manager
Barry Controls 82 South Street Hopkinton, MA
Abstract:
Combat vehicles carry increasing quantities of rack mounted electronics as part of the C4 structure. These systems must be isolated against damage from ballistic impact shock within a small sway space. Qualification testing of multiple rack configurations and interchangeable line replaceable units (LRUs) would require significant time and expense. Barry Controls has developed an analytical method validated through bench testing to reduce qualification time and expense. System input and response data were recorded during air cannon testing of a GDC4 rack system. The data were compared to MIL-STD-810 Method 522 tables and SRS curves. Barry Controls performed system analysis and designed isolators to withstand 30G, 50G and Ballistic shock within the allowable sway space. An isolated system was then subjected to 30G, 50G and repeated Ballistic shock testing and comparisons were made to the analytical results. The Barry Controls isolators successfully isolated the equipment from ballistic shock within the allocated sway space. The analytical method proposed by Barry Controls proved to be an accurate method to predict ballistic performance. Present and future systems can be rapidly and economically analyzed to these inputs with a high degree of confidence.
Introduction - Program Development:
General Dynamics C4 Systems approached Barry Controls to recommend an isolation system for a family of communications equipment being developed for the Future Combat System. Nine distinct rack mounting systems containing multiple interchangeable LRUs were being proposed for ten vehicles. This evolved into a large matrix of installation configurations all requiring shock and vibration qualification. A maximum of one inch sway space was allowed for all systems at all inputs, including ballistic shock per MIL-STD-810 Method 522 [1]. The customer desired a method to qualify all of these systems in all applications with a minimum of physical testing. General Dynamics supplied data recorded during testing of a prototype system with a gas gun type Mechanical Shock Simulator. The Walton papers [5, 6] from MIL-STD-810 were referenced for test arrangement and instrumentation, and several ballistic impact time histories were recorded. The validity of that data had not been evaluated other than a graphic comparison to the SRS in Figure 522.1-1.
Ballistic Impact Time History Review:
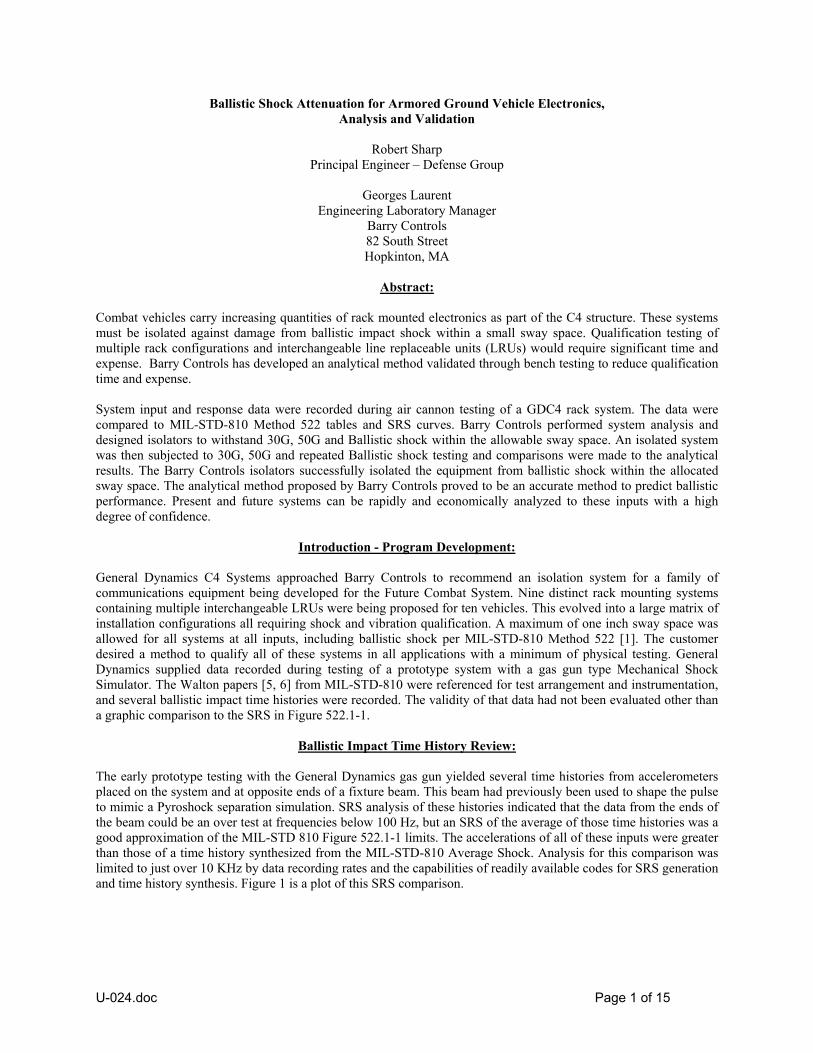
The early prototype testing with the General Dynamics gas gun yielded several time histories from accelerometers placed on the system and at opposite ends of a fixture beam. This beam had previously been used to shape the pulse to mimic a Pyroshock separation simulation. SRS analysis of these histories indicated that the data from the ends of the beam could be an over test at frequencies below 100 Hz, but an SRS of the average of those time histories was a good approximation of the MIL-STD 810 Figure 522.1-1 limits. The accelerations of all of these inputs were greater than those of a time history synthesized from the MIL-STD-810 Average Shock. Analysis for this comparison was limited to just over 10 KHz by data recording rates and the capabilities of readily available codes for SRS generation and time history synthesis. Figure 1 is a plot of this SRS comparison.
U-024.doc Page 2 of 15
MIL-STD-810G, Figure 522.1-1 Ballistic Shock, SRS Comparison to Recorded Data
1
10
100
1,000
10,000
100,000
10 100 1,000 10,000
Frequency (Hz)
Acc
eler
atio
n (G
)
Upper
Average
Lower
Beam L SRS +
Beam L SRS -
Beam R SRS +
Beam R SRS -
Beam Ave SRS +
Beam Ave SRS -
810 Syn SRS +
810 Syn SRS -
Figure 1 – Ballistic Input SRS Comparison
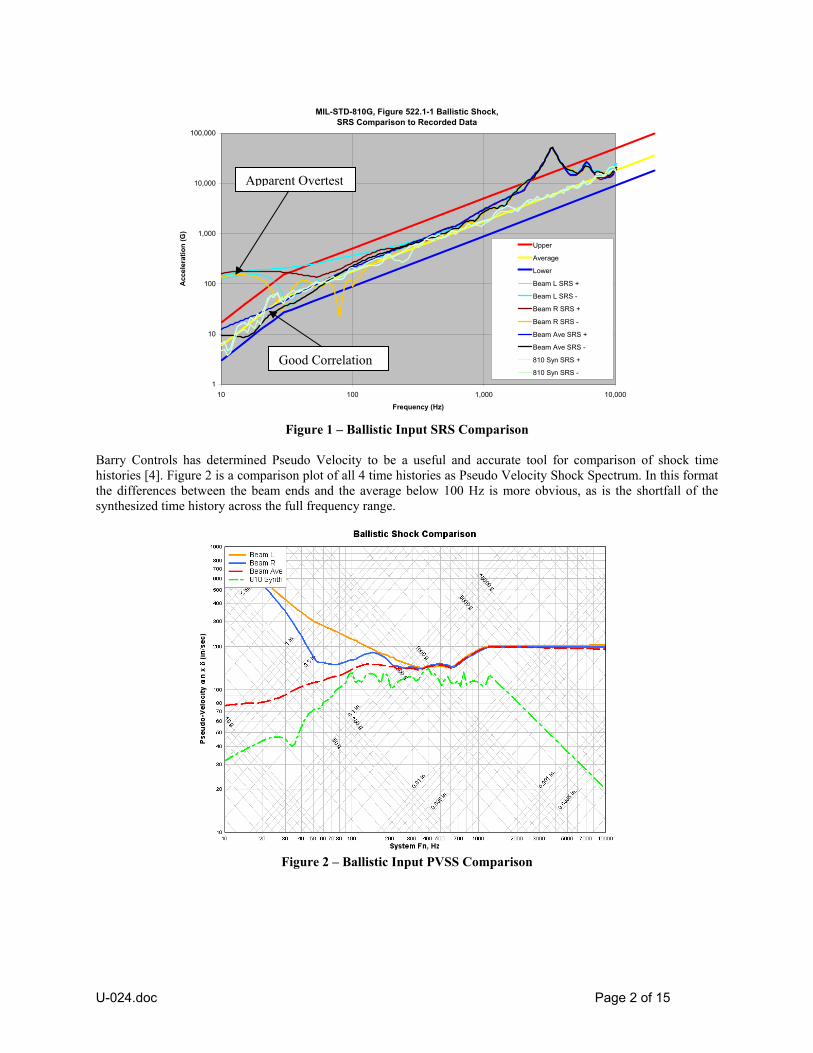
Barry Controls has determined Pseudo Velocity to be a useful and accurate tool for comparison of shock time histories [4]. Figure 2 is a comparison plot of all 4 time histories as Pseudo Velocity Shock Spectrum. In this format the differences between the beam ends and the average below 100 Hz is more obvious, as is the shortfall of the synthesized time history across the full frequency range.
Figure 2 – Ballistic Input PVSS Comparison
Apparent Overtest
Good Correlation

U-024.doc Page 3 of 15
BarrySoft Advanced Analysis Program:
All analyses were performed using the internally developed proprietary program BarrySoft Advanced. This is a mass, spring and damper system calculation program that performs static deflections, natural frequencies and modal extraction, sine and random vibration simulations, and shock simulations. Barrysoft Advanced evolved from the earlier Barry Controls SHVIB with improved input and output graphical interface, but the proven original analysis methods and algorithms remain unchanged. The current configuration allows multiple static, shock and vibration inputs to be stored within a single model, and easy modification of the mass and spring characteristics. Most important to this effort was BarrySoft’s ability to combine large, complicated shock inputs and non-linear isolator response.
Isolator Background and Characterization:
Barry Controls developed the TTA style isolators in the mid 1970’s as a small avionics shock mount. The TTB style isolator was developed in 1979 by scaling this geometry up to create a low-profile shock isolator for electronic equipment in ground vehicles. This design is a buckling shock attenuator rotated 360 degrees to yield equivalent response in all radial directions. It has been a catalog item since its release and contributed the basic elastomer geometry to many custom designs. Recently the desire for increased damping and Nuclear, Biological & Chemical (NBC) compatibility has resulted in the Barry Controls 28719 isolator family. This isolator uses specifically formulated Butyl elastomer with a combination of stainless steel and anodized aluminum for corrosion resistant structural components. 28719 series isolators have been specified into several ground vehicle applications, so a significant static and dynamic test history was available. Figure 3 illustrates the basic TTB design. Isolator response curves for the 28719 family were generated by static load versus deflection testing and drop testing of all three stiffnesses with various loads and drop heights. Static curves were recorded in the axial compression, axial tension and radial directions. Drop testing was conducted in the axial compression and radial directions. Testing was averaged over four parts of each stiffness, and those test parts were maintained for later use in the system testing. The static and dynamic curves were compared within type and to each other, and a common set of simplified static and dynamic curves was created by scaling the stiffest curve across the elastomer range. Axial dynamic curves are illustrated in Figure 4.
Figure 3 – TTB Style Isolator

U-024.doc Page 4 of 15
28719 Butyl TTB SeriesAxial Drop Test Load vs. Deflection
-1500
-1000
-500
0
500
1000
1500
-0.800 -0.600 -0.400 -0.200 0.000 0.200 0.400 0.600 0.800 1.000
Deflection (inch)
Load
(lbs
.)
28719-3 Axial Dynamic 100%
28719-2 Axial Dynamic 80%
28719-1 Axial Dynamic 60%
Axial Tension
Axial Compression
Figure 4 – TTB Style Isolator Family of Curves
System Description and Initial Analysis:
The matrix of possible systems and LRU combinations consisted of four primary configurations and an additional five auxiliary systems. Analysis was performed on the four primary configurations using a 50G–11ms terminal peak saw-tooth shock as a benchmark followed by the maximum and average ballistic inputs. Points of interest were modeled to extract deflection and acceleration at the four upper corners. Favorable results were achieved with the 50G-11ms and average ballistic inputs, but analysis using ballistic data from the beam ends resulted in displacements significantly exceeding design goals. Based on these results Barry Controls recommended the 28719-2 isolator for all systems, and recommended: Testing be performed to validate the 50G-11ms TPS response, Closely evaluate the ballistic input method, and Investigate differences between the two ballistic analysis results.
Figure 5 – Typical System Illustrations
Test Program:
General Dynamics fabricated a test sample system designated “Type 4 LRU mount” and equipped it with dummy masses of the supported equipment. Testing was conducted with the same 28719-1 and 28719-2 isolators tested for characterization, but this report will focus on the results of the Barry recommended 28719-2. Testing was performed at the General Dynamics Advanced Information Systems Environmental Test Lab in Phoenix, AZ. Data from 47

U-024.doc Page 5 of 15
shaker tests and 9 ballistic shots was recorded over a two day period. Figure 6 illustrates the test system and its analysis and testing coordinate system
Figure 6 – Test System Layout and Coordinate System
Sine sweep, 30G-11ms half sine and 50G-11ms terminal peak shocks were performed on an Unholtz-Dickie model T-1000 with a UD VWIN 2 controller system. Accelerometers were placed on the fixture, and at locations close to the analysis points of interest for each direction. A Keyence LK-G157 Laser system was used to record deflection at the fixture and as close as possible to the points of interest. Data was captured on a Data Physics #70054 (also called an Abacus Mobilyzer) using their SignalCalc SRS software. The single Type 4 mount was subjected to a sine sweep followed by positive and negative direction shocks in each axis. Horizontal X and Y testing was conducted on a slide table, vertical Z testing was conducted on the shaker head. The test arrangement for all three axes is illustrated in Figures 7 through 9.
Figure 7 – X Direction Shaker Test Arrangement
U-024.doc Page 6 of 15
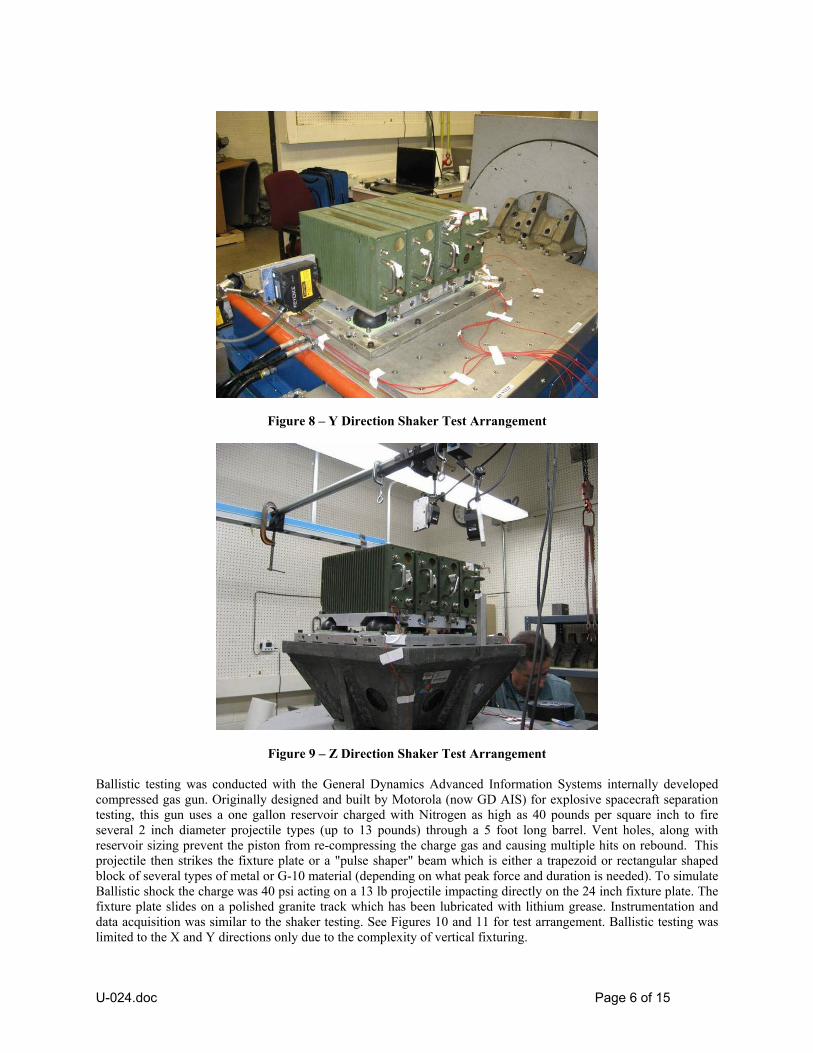
Figure 8 – Y Direction Shaker Test Arrangement
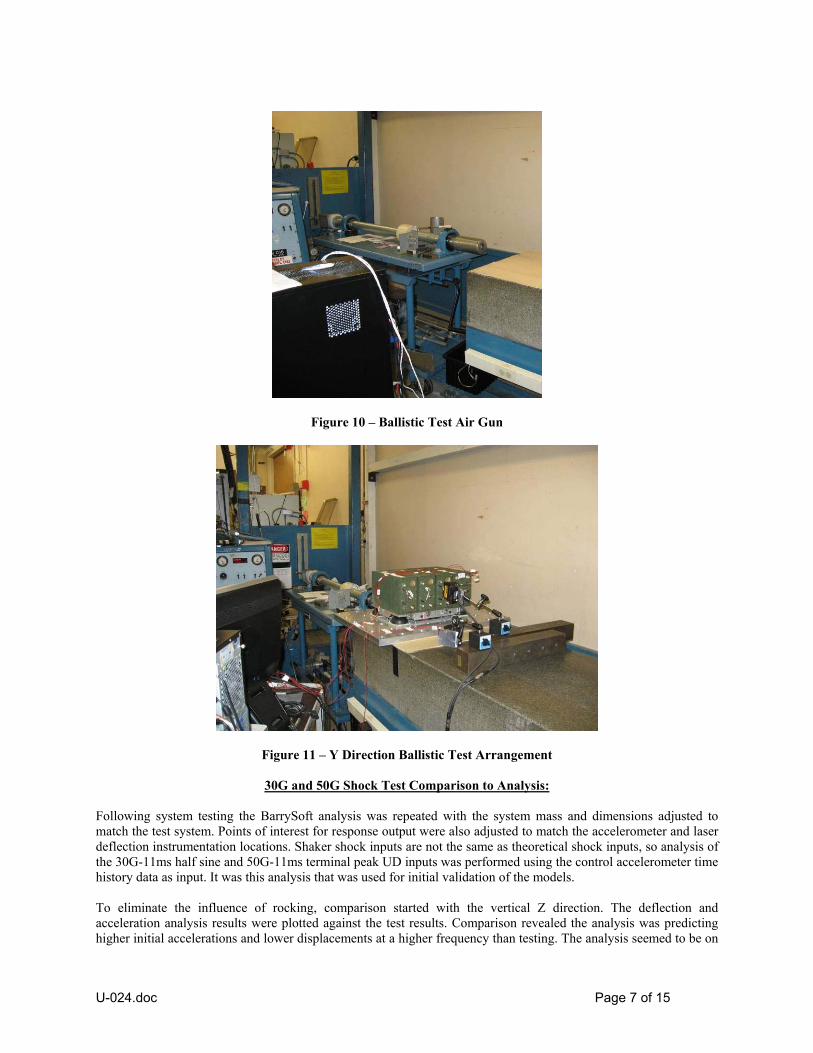
Figure 9 – Z Direction Shaker Test Arrangement Ballistic testing was conducted with the General Dynamics Advanced Information Systems internally developed compressed gas gun. Originally designed and built by Motorola (now GD AIS) for explosive spacecraft separation testing, this gun uses a one gallon reservoir charged with Nitrogen as high as 40 pounds per square inch to fire several 2 inch diameter projectile types (up to 13 pounds) through a 5 foot long barrel. Vent holes, along with reservoir sizing prevent the piston from re-compressing the charge gas and causing multiple hits on rebound. This projectile then strikes the fixture plate or a "pulse shaper" beam which is either a trapezoid or rectangular shaped block of several types of metal or G-10 material (depending on what peak force and duration is needed). To simulate Ballistic shock the charge was 40 psi acting on a 13 lb projectile impacting directly on the 24 inch fixture plate. The fixture plate slides on a polished granite track which has been lubricated with lithium grease. Instrumentation and data acquisition was similar to the shaker testing. See Figures 10 and 11 for test arrangement. Ballistic testing was limited to the X and Y directions only due to the complexity of vertical fixturing.
U-024.doc Page 7 of 15
Figure 10 – Ballistic Test Air Gun
Figure 11 – Y Direction Ballistic Test Arrangement
30G and 50G Shock Test Comparison to Analysis:
Following system testing the BarrySoft analysis was repeated with the system mass and dimensions adjusted to match the test system. Points of interest for response output were also adjusted to match the accelerometer and laser deflection instrumentation locations. Shaker shock inputs are not the same as theoretical shock inputs, so analysis of the 30G-11ms half sine and 50G-11ms terminal peak UD inputs was performed using the control accelerometer time history data as input. It was this analysis that was used for initial validation of the models. To eliminate the influence of rocking, comparison started with the vertical Z direction. The deflection and acceleration analysis results were plotted against the test results. Comparison revealed the analysis was predicting higher initial accelerations and lower displacements at a higher frequency than testing. The analysis seemed to be on

U-024.doc Page 8 of 15
a stiffer isolation system then the one tested. Further investigation and repeated analysis experimentation indicated the non-linear isolator curves developed from drop testing were too stiff at lower deflections. Hybrid curves were generated by factoring the static curves up until the snubbing coincided with drop testing (see Figure 12). This resulted in very close correlation between analysis and test response. Event timing was correct and peak deflection and acceleration curves were shaped similar to the test curve while remaining conservative (i.e.: predicted displacement and acceleration were higher than measured). Comparison plots for the Z direction 30G and 50G shocks follow in Figures 13 and 14.
28719-2 TTB SeriesAxial Compression Load vs. Deflection
0
100
200
300
400
500
600
700
800
900
0.00 0.10 0.20 0.30 0.40 0.50 0.60 0.70 0.80 0.90 1.00
Deflection (inch)
Load
(lbs
.)
28719-2 Axial Static
28719-2 Axial Dynamic
28719-2 Modified
Figure 12 – Isolator Curve Shape Hybridization
Type 4 System w 28719-230G 11 ms HS Input
-35
-25
-15
-5
5
15
25
35
0 0.01 0.02 0.03 0.04 0.05 0.06 0.07 0.08 0.09 0.1
Time (sec)
Acc
eler
atio
n (G
)
-0.35
-0.25
-0.15
-0.05
0.05
0.15
0.25
0.35D
efle
ctio
n (in
ch)
UD-Input
Test Z Accel
Barrysoft Z Accel
Deflection
Barrysoft Z Disp
Figure 13 – Z Direction 30G – 11ms Shock
U-024.doc Page 9 of 15
Type 4 System w 28719-250G 11 ms TPS Input
-60
-40
-20
0
20
40
60
0 0.01 0.02 0.03 0.04 0.05 0.06 0.07 0.08 0.09 0.1
Time (sec)
Acc
eler
atio
n (G
)
-0.6
-0.4
-0.2
0
0.2
0.4
0.6
Def
lect
ion
(inch
)
UD-Input
Test Z Accel
Barrysoft Z Accel
Test Z Disp
Barrysoft Z Disp
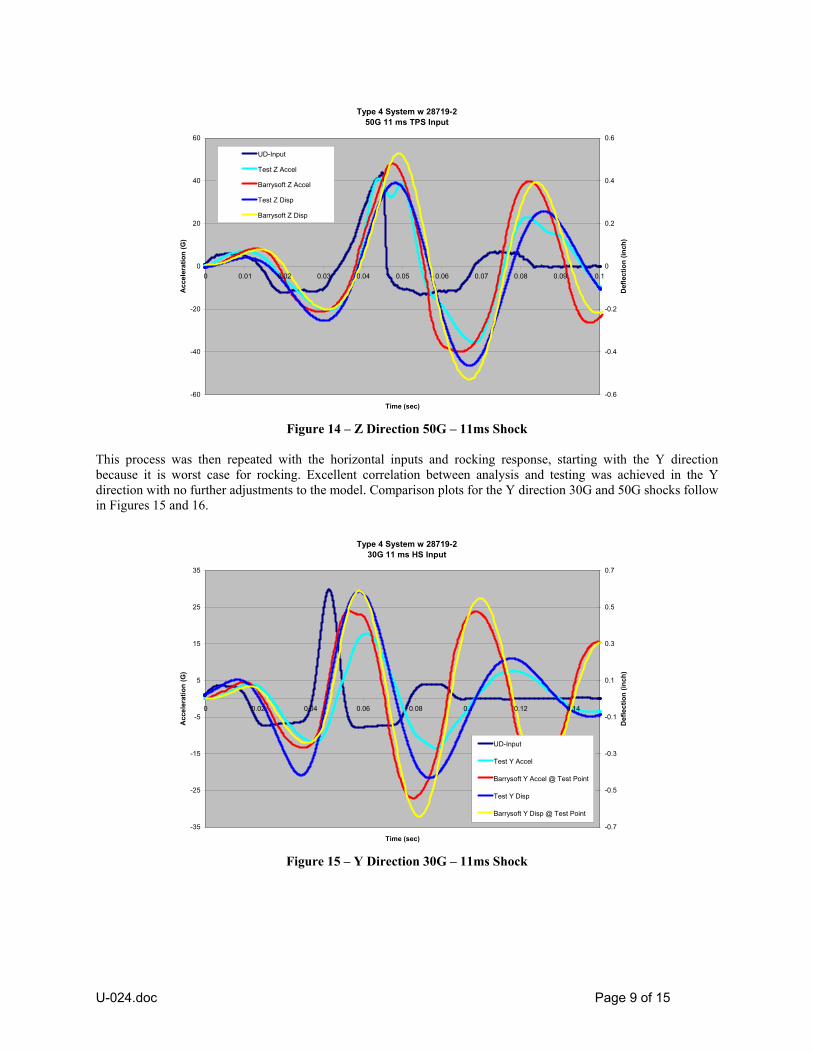
Figure 14 – Z Direction 50G – 11ms Shock
This process was then repeated with the horizontal inputs and rocking response, starting with the Y direction because it is worst case for rocking. Excellent correlation between analysis and testing was achieved in the Y direction with no further adjustments to the model. Comparison plots for the Y direction 30G and 50G shocks follow in Figures 15 and 16.
Type 4 System w 28719-230G 11 ms HS Input
-35
-25
-15
-5
5
15
25
35
0 0.02 0.04 0.06 0.08 0.1 0.12 0.14
Time (sec)
Acc
eler
atio
n (G
)
-0.7
-0.5
-0.3
-0.1
0.1
0.3
0.5
0.7
Def
lect
ion
(inch
)
UD-Input
Test Y Accel
Barrysoft Y Accel @ Test Point
Test Y Disp
Barrysoft Y Disp @ Test Point
Figure 15 – Y Direction 30G – 11ms Shock

U-024.doc Page 10 of 15
Type 4 System w 28719-250G 11 ms TPS Input
-50
-40
-30
-20
-10
0
10
20
30
40
50
0 0.02 0.04 0.06 0.08 0.1 0.12 0.14
Time (sec)
Acc
eler
atio
n (G
)
-0.7
-0.5
-0.3
-0.1
0.1
0.3
0.5
0.7
Def
lect
ion
(inch
)
UD-Input
Test Y Accel
Barrysoft Y Accel @ Test Point
Test Y Disp
Barrysoft Y Disp @ Test Point
Figure 16 – Y Direction 50G – 11ms Shock
Evaluation of the X direction results did not yield as good a correlation as the vertical Z and horizontal Y directions. Synchronization of X analysis and test response curves did yield conservative peak values, but the plots differed in shape and timing. Further testing and analysis will be required to explain these differences. The excellent correlation of the acceleration and displacement worst cases in the vertical Z and horizontal Y directions, with conservative results in the X direction was deemed satisfactory justification to proceed with the project. System requirements are based on standard 30G-11ms half sine and 50G-11 terminal peak shock shapes, not shaker input pulses, so the modified models were rerun with all inputs including the standard shocks. A comparison of the vertical system response to a 50G-11ms UD input versus a standard 50G-11ms terminal peak input is illustrated in Figure 17. The standard input and response were time adjusted to coincide with the UD input crossing zero G. While the responses are similar, the differences would have resulted in difficulty during correlation of the two responses. This comparison is included to illustrate the need for correlation of system analysis to testing based on actual test conditions before moving on to more complicated inputs.
Type 4 System w 28719-250G 11 ms UD vs TPS Input
-40
-30
-20
-10
0
10
20
30
40
50
60
0.03 0.035 0.04 0.045 0.05 0.055 0.06 0.065 0.07 0.075 0.08
Time (sec)
Acc
eler
atio
n (G
)
UD-Input
Test Z Accel
Barrysoft Z Accel (UD Input)
50G-11ms TPS Input
Barrysoft Z Accel (TPS Input)
Figure 17 – Y Direction 50G – 11ms Shock

U-024.doc Page 11 of 15
Sine Sweep / Modal Test Comparison to Analysis:
Tangent dynamic springrates were taken from the hybrid dynamic curves and used for modal analysis. The translational modes were compared to the sine sweep test results with good correlation. Table 1 is the 6-degree of freedom modal analysis results, and Figure 18 is a plot of the translational test results. This excellent correlation of the translational modes is further validation of the Barrysoft Advanced model to the test system.
Natural FrequenciesSys Mode X Y Z Rot X Rot Y Rot ZVehicle Fore-Aft Lateral Vertical Roll Pitch YawFreq. (Hz) 21.8 18.2 34.8 43.1 53.3 34.1Tested 22.1 18.7 32.9
Table 1 – Modal Analysis Results
Type 4 Mount w 28719-2 Sine Sweep Test Data
0.1
1
10
10 100
Frequency (Hz)
T (G
/G)
T (X/X)
T (Y/Y)
T (Z/Z)
18.7 Hz
22.1 Hz
32.9 Hz
18.7 Hz 22.1 Hz 32.9 Hz
Figure 18 – Sine Sweep Test Results
Ballistic Test Comparison to Analysis:
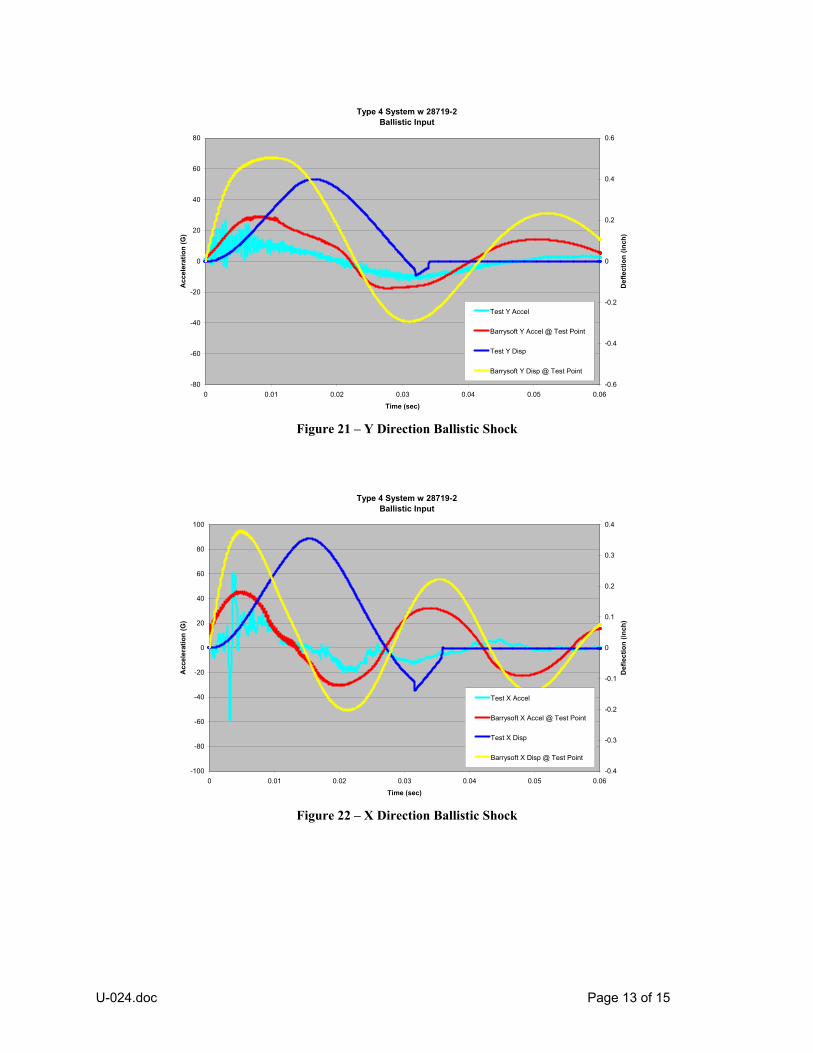
The ballistic input time histories recorded during this round of testing were compared to the limits through SRS analysis. To a varying degree all represented an over test condition at low frequency, similar to the original beam end data. These time histories were also compared to the original work using Pseudo Velocity methods and again the difference below 100 Hz was very obvious. Figure 19 is an SRS plot of these inputs versus the MIL-STD-810 limits, and Figure 20 is a PVSS plot of the same time histories. The deviation of positive and negative SRS plots and convergence of some filtered time histories to a non-zero value are evidence of problems with accelerometer saturation [5, 6], or sampling rate, both having been commonly reported during Pyroshock instrumentation. The ballistic shock analysis was run using the new recorded time history which was closest to the MIL-STD-810 limits. As with previous analysis using the beam end data, the displacement response significantly exceeded the allowable sway space. These results were contradictory to test observations so the revised model was run using the original average ballistic input, which was compliant with MIL-STD-810. The horizontal Y direction analysis acceleration and displacement were found to be very similar in timing and shape to the test data, and conservative in peak values. Correlation of the horizontal X direction which had been problematic in the 30G and 50G testing was good, although not as close as the Y direction. These comparisons detailed in Figures 21 and 22. Similarity was consistent over repeated tests.

U-024.doc Page 12 of 15
MIL-STD-810G, Figure 522.1-1 Ballistic Shock, SRS Comparison to Recorded Data
1
10
100
1,000
10,000
100,000
10 100 1,000 10,000 100,000
Frequency (Hz)
Acc
eler
atio
n (G
)
UpperAverageLowerBeam Ave SRS +Beam Ave SRS -6-X SRS +6-X SRS -7-X SRS +7-X SRS -8-Y SRS +8-Y SRS -9-Y SRS +9-Y SRS -
Figure 19 – Ballistic Input SRS Comparison
Figure 20 – Ballistic Input PVSS Comparison
U-024.doc Page 13 of 15
Type 4 System w 28719-2Ballistic Input
-80
-60
-40
-20
0
20
40
60
80
0 0.01 0.02 0.03 0.04 0.05 0.06
Time (sec)
Acc
eler
atio
n (G
)
-0.6
-0.4
-0.2
0
0.2
0.4
0.6
Def
lect
ion
(inch
)
Test Y Accel
Barrysoft Y Accel @ Test Point
Test Y Disp
Barrysoft Y Disp @ Test Point
Figure 21 – Y Direction Ballistic Shock
Type 4 System w 28719-2Ballistic Input
-100
-80
-60
-40
-20
0
20
40
60
80
100
0 0.01 0.02 0.03 0.04 0.05 0.06
Time (sec)
Acc
eler
atio
n (G
)
-0.4
-0.3
-0.2
-0.1
0
0.1
0.2
0.3
0.4
Def
lect
ion
(inch
)
Test X Accel
Barrysoft X Accel @ Test Point
Test X Disp
Barrysoft X Disp @ Test Point
Figure 22 – X Direction Ballistic Shock
U-024.doc Page 14 of 15
Conclusion: The excellent correlation of analysis to the simple shaker vibration and shock testing indicates that the Barrysoft Advanced model closely reflects the test system. The correlation of ballistic shock analysis of a MIL-STD-810 compliant input to testing with an apparent overtest input indicates that the gas gun test did simulate a ballistic shock within MIL-STD-810 limits, even if the instrumentation did not accurately record that event. This testing has validated that the 28719-2 isolator will provide 50G and Ballistic shock attenuation within the prescribed sway space for the Type 4 mount. By extension through Barrysoft Advanced analysis there is a high degree of confidence that all of the system configurations will meet the same requirements, and that the TTB family of isolators can be used where ever a similar environment and performance is specified. The analysis method and data developed for this project can immediately be applied to multiple ground vehicle systems currently under design. It provides a systematic method for performing initial analysis, performing lower level shock testing with readily available shaker equipment, adjusting the analysis to correlate to those tests, and extrapolating those results to more complex shock environments. The comparison of the simplified testing to analysis using UD inputs validates the analysis of those other inputs without the need for specialized and expensive alternative test equipment. This method can be used to apply the average ballistic time history already developed to other systems. The same method will be used to analyze improved ballistic time histories or other inputs even greater in magnitude or more specifically focused for a given vehicle, structure or system performance.
Future work:
The ballistic acceleration input time histories that were gathered during these tests are in question. The possibility of accelerometer saturation means that improved instrumentation would be ideal. Likewise, the limitations of the data acquisition systems and the signal analysis programs should be reviewed and improved in an effort to raise the upper frequency limits of this analysis. It is recommended that time history data be gathered from partner companies or by further testing of the ballistic shock, as well as other various hammer and barge tests. This testing should be performed on the simplest, most robust, generic mass possible to avoid the influence of system peculiarities such and hardware chatter and system flex. Testing must be performed in all three axes and correlation achieved for simple shaker shocks as well as the higher level impacts. These systems should then be re-analyzed and comparisons made between isolator drop test curve response and system test response. Continued static, drop and system level shock testing of highly damped elastomers should be performed to develop a better understanding of the effects of damping on buckling isolators and the differences between the apparent isolator load versus deflection curves during system and drop testing.
Acknowledgements:
Jim Rycroft - Senior Mechanical Engineer General Dynamics C4 Systems, Taunton, MA Tom Schmidt - Principal Engineer, Environmental Test Services Tom Lullo- Test Lab Manager Jim Boatner and Bob Rittenhouse- Test Technicians General Dynamics Advanced Information Systems, Phoenix, AZ.
References:
1. MIL-STD-810 G, “Department of Defense, Test Method Standard, Environmental Engineering Considerations and Laboratory Tests”, Method 522.1, pages 522.1-1 through 522.1-15.
2. Walton, W. Scott, “Ballistic Shock Simulation Techniques for Testing Armored Vehicle Components”,
Proceedings of the 64th, Shock and Vibration Symposium, Volume I, October 1993, pp. 237-246.

U-024.doc Page 15 of 15
3. Walton, W. Scott, “Pyroshock Evaluation of Ballistic Shock Measurement Techniques”, Proceedings of the 62nd Shock and Vibration Symposium, Volume 2, pp. 422-431, October 1991.
4. David, Thomas A, “Pseudo-Velocity for Ranking MIL-S-901D Tests”, Proceedings of the 79th Shock and
Vibration Symposium, October 2008.
5. Irvine, Tom, “An Introduction to the Shock Response Spectrum”, May 19, 2009
6. Chu, Anthony, “Zero Shift of Piezoelectric Accelerometers in Pyroshock Measurements,” Proceedings of the 56th Shock and Vibration Symposium, 1986.