BALFOUR BEATTY PLC RESULTS FOR THE FULL Following dividend reinstatement recommended final dividend...
64
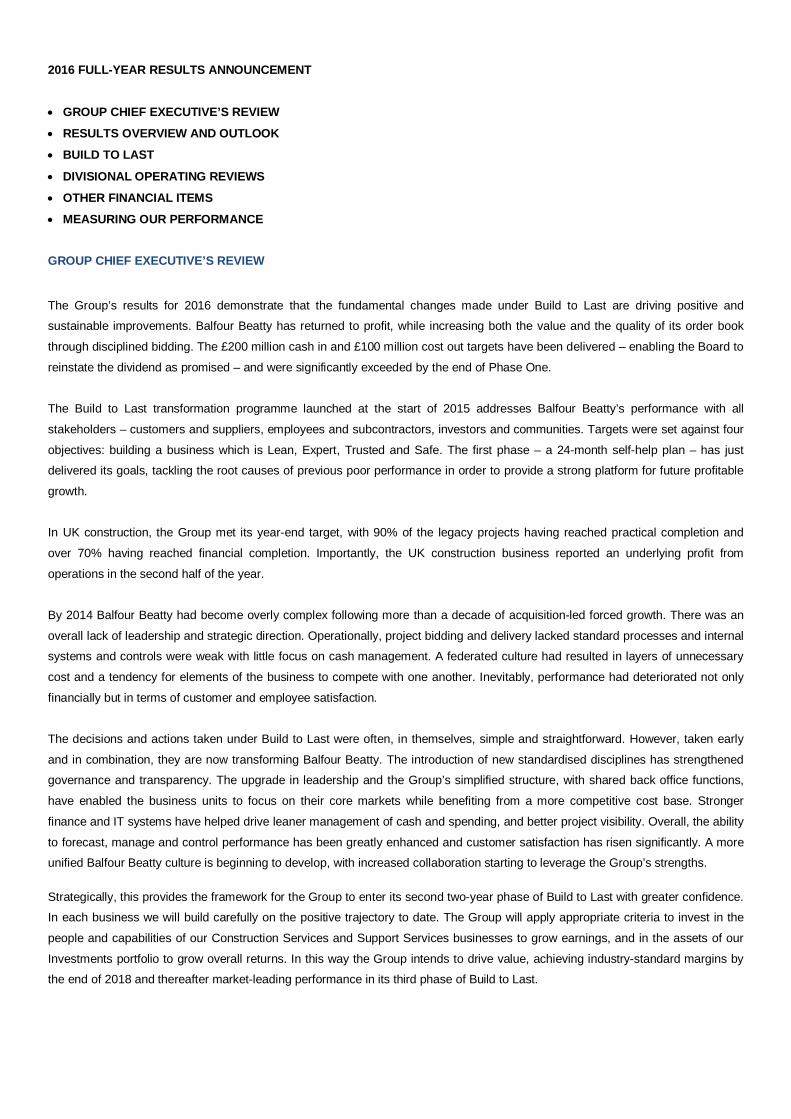
BALFOUR BEATTY PLC RESULTS FOR THE FULL-YEAR ENDED 31 DECEMBER 2016 16 March 2017 Financial Highlights · Order book £12.7bn, up 15% (up 4% at constant exchange rates (CER)) · Underlying revenue £8.5bn, up 4% (down 3% at CER) · Group returned to profit following two years of losses; underlying profit from operations (PFO) £67m · In the second half of 2016 UK construction returned to underlying profitability · Strong balance sheet: net cash at £173m, underpinned by £1.2bn Investments portfolio · Following dividend reinstatement recommended final dividend of 1.8 pence per share (full year 2.7 pence) Build to Last Highlights · Significantly exceeded 24-month Phase One targets – £439m cash in: £123m cost out · Continued to simplify the Group; exiting non-core assets · Upgraded leadership and de-layering of management in UK and US · Improving risk management and order book from strengthened governance · Increased customer satisfaction · Favourable medium and long term market outlook · Reiterated Phase Two targets: industry-standard margins by end of 2018 (£ million unless otherwise specified) 2016 2015 Underlying 3 Statutory Underlying 3 Statutory Revenue 1,2 8,530 6,923 8,235 6,955 Profit (loss) from operations 2 (PFO) 67 15 (106) (182) Pre-tax profit (loss) 2 60 8 (123) (199) Total profit (loss) 48 24 (135) (206) Profit (loss) per share 7.0p 3.5p (19.8p) (30.1p) Dividends per share 2.7p - 2016 2015 Order book 1,2,3 £12.7bn £11.0bn Directors' valuation of Investments portfolio 1,220 1,244 Net cash – recourse 173 163 Net borrowings – non-recourse (233) (365) Leo Quinn, Group Chief Executive, commented “The transformation of Balfour Beatty is well underway. We have returned the Group to profit and significantly exceeded our Build to Last Phase One targets. We have upgraded leadership, processes and controls while continuing to invest in the Group’s unique strengths. As a result, we have improved not just the quality of our order book but our customer satisfaction scores. “Having simplified the Group, we are focused on our core markets in the UK and US, where governments are committed to large scale expenditure on infrastructure. “All this positions us for future profitable growth. During the next two-year phase of Build to Last, we expect to achieve industry- standard margins and over the medium term, industry-leading performance.”
Transcript of BALFOUR BEATTY PLC RESULTS FOR THE FULL Following dividend reinstatement recommended final dividend...
BALFOUR BEATTY PLC RESULTS FOR THE FULL-YEAR ENDED 31 DECEMBER 201616 March 2017
Financial Highlights
· Order book £12.7bn, up 15% (up 4% at constant exchange rates (CER))
· Underlying revenue £8.5bn, up 4% (down 3% at CER)
· Group returned to profit following two years of losses; underlying profit from operations (PFO) £67m
· In the second half of 2016 UK construction returned to underlying profitability
· Strong balance sheet: net cash at £173m, underpinned by £1.2bn Investments portfolio
· Following dividend reinstatement recommended final dividend of 1.8 pence per share (full year 2.7 pence)
Build to Last Highlights
· Significantly exceeded 24-month Phase One targets – £439m cash in: £123m cost out
· Continued to simplify the Group; exiting non-core assets
· Upgraded leadership and de-layering of management in UK and US
· Improving risk management and order book from strengthened governance
· Increased customer satisfaction
· Favourable medium and long term market outlook
· Reiterated Phase Two targets: industry-standard margins by end of 2018
(£ million unless otherwise specified)2016 2015
Underlying3 Statutory Underlying3 Statutory
Revenue1,2 8,530 6,923 8,235 6,955Profit (loss) from operations2 (PFO) 67 15 (106) (182)Pre-tax profit (loss)2 60 8 (123) (199)Total profit (loss) 48 24 (135) (206)Profit (loss) per share 7.0p 3.5p (19.8p) (30.1p)
Dividends per share 2.7p -
2016 2015
Order book1,2,3 £12.7bn £11.0bn
Directors' valuation of Investments portfolio 1,220 1,244
Net cash – recourse 173 163
Net borrowings – non-recourse (233) (365)
Leo Quinn, Group Chief Executive, commented “The transformation of Balfour Beatty is well underway. We have returned the
Group to profit and significantly exceeded our Build to Last Phase One targets. We have upgraded leadership, processes and
controls while continuing to invest in the Group’s unique strengths. As a result, we have improved not just the quality of our order
book but our customer satisfaction scores.
“Having simplified the Group, we are focused on our core markets in the UK and US, where governments are committed to large
scale expenditure on infrastructure.
“All this positions us for future profitable growth. During the next two-year phase of Build to Last, we expect to achieve industry-
standard margins and over the medium term, industry-leading performance.”

Notes:1 including share of joint ventures and associates2 from continuing operations3 before non-underlying items (Note 8)
Alternative performance measures (APM), including constant exchange rates (CER), are defined in the section Measuring Our
Performance.
Investor and Analyst enquiries:Angus Barry
Tel. +44 (0)20 7216 6824
Media enquiries:Louise McCulloch
Tel. +44 (0)20 7216 6846
Investor and Analyst presentation:A presentation to investors and analysts will be made at Numis Securities, The London Stock Exchange Building, London EC4M
7LT at 09:00 (UK time) on 16 March 2017. There will be a live webcast of this presentation on: www.balfourbeatty.com/webcast
2016 FULL-YEAR RESULTS ANNOUNCEMENT
· GROUP CHIEF EXECUTIVE’S REVIEW
· RESULTS OVERVIEW AND OUTLOOK
· BUILD TO LAST
· DIVISIONAL OPERATING REVIEWS
· OTHER FINANCIAL ITEMS
· MEASURING OUR PERFORMANCE
GROUP CHIEF EXECUTIVE’S REVIEW
The Group’s results for 2016 demonstrate that the fundamental changes made under Build to Last are driving positive and
sustainable improvements. Balfour Beatty has returned to profit, while increasing both the value and the quality of its order book
through disciplined bidding. The £200 million cash in and £100 million cost out targets have been delivered – enabling the Board to
reinstate the dividend as promised – and were significantly exceeded by the end of Phase One.
The Build to Last transformation programme launched at the start of 2015 addresses Balfour Beatty’s performance with all
stakeholders – customers and suppliers, employees and subcontractors, investors and communities. Targets were set against four
objectives: building a business which is Lean, Expert, Trusted and Safe. The first phase – a 24-month self-help plan – has just
delivered its goals, tackling the root causes of previous poor performance in order to provide a strong platform for future profitable
growth.
In UK construction, the Group met its year-end target, with 90% of the legacy projects having reached practical completion and
over 70% having reached financial completion. Importantly, the UK construction business reported an underlying profit from
operations in the second half of the year.
By 2014 Balfour Beatty had become overly complex following more than a decade of acquisition-led forced growth. There was an
overall lack of leadership and strategic direction. Operationally, project bidding and delivery lacked standard processes and internal
systems and controls were weak with little focus on cash management. A federated culture had resulted in layers of unnecessary
cost and a tendency for elements of the business to compete with one another. Inevitably, performance had deteriorated not only
financially but in terms of customer and employee satisfaction.
The decisions and actions taken under Build to Last were often, in themselves, simple and straightforward. However, taken early
and in combination, they are now transforming Balfour Beatty. The introduction of new standardised disciplines has strengthened
governance and transparency. The upgrade in leadership and the Group’s simplified structure, with shared back office functions,
have enabled the business units to focus on their core markets while benefiting from a more competitive cost base. Stronger
finance and IT systems have helped drive leaner management of cash and spending, and better project visibility. Overall, the ability
to forecast, manage and control performance has been greatly enhanced and customer satisfaction has risen significantly. A more
unified Balfour Beatty culture is beginning to develop, with increased collaboration starting to leverage the Group’s strengths.
Strategically, this provides the framework for the Group to enter its second two-year phase of Build to Last with greater confidence.
In each business we will build carefully on the positive trajectory to date. The Group will apply appropriate criteria to invest in the
people and capabilities of our Construction Services and Support Services businesses to grow earnings, and in the assets of our
Investments portfolio to grow overall returns. In this way the Group intends to drive value, achieving industry-standard margins by
the end of 2018 and thereafter market-leading performance in its third phase of Build to Last.
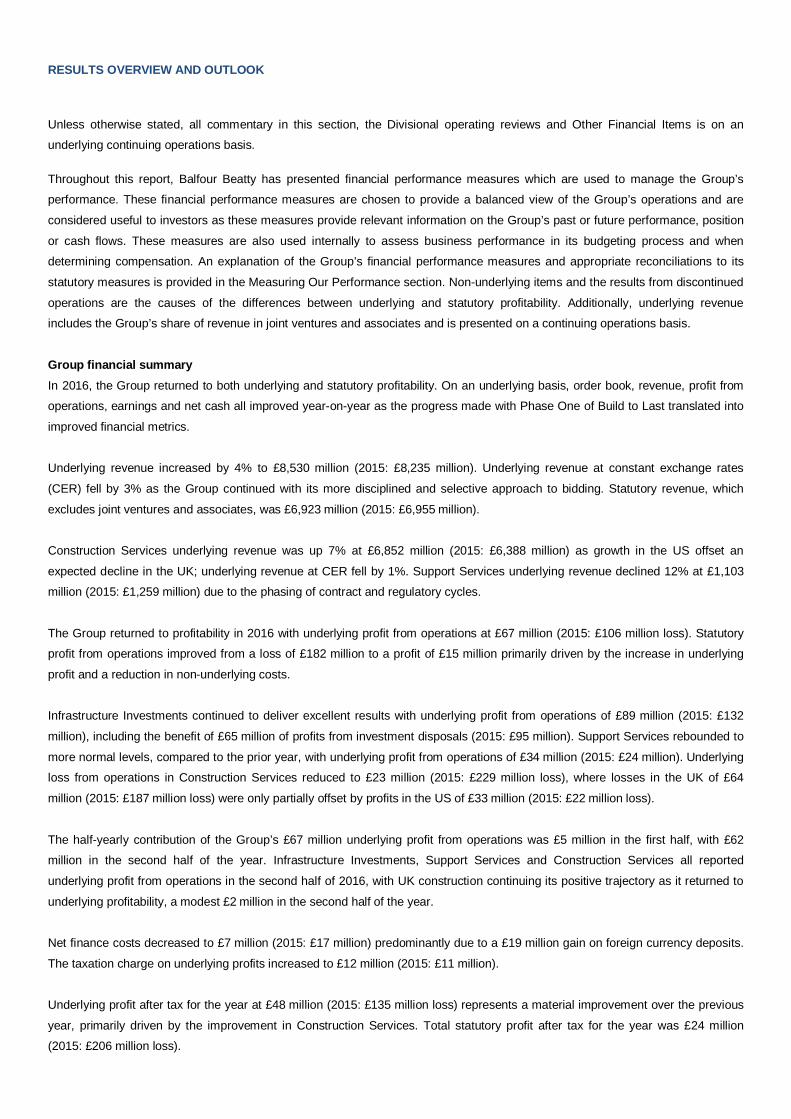
RESULTS OVERVIEW AND OUTLOOK
Unless otherwise stated, all commentary in this section, the Divisional operating reviews and Other Financial Items is on an
underlying continuing operations basis.
Throughout this report, Balfour Beatty has presented financial performance measures which are used to manage the Group’s
performance. These financial performance measures are chosen to provide a balanced view of the Group’s operations and are
considered useful to investors as these measures provide relevant information on the Group’s past or future performance, position
or cash flows. These measures are also used internally to assess business performance in its budgeting process and when
determining compensation. An explanation of the Group’s financial performance measures and appropriate reconciliations to its
statutory measures is provided in the Measuring Our Performance section. Non-underlying items and the results from discontinued
operations are the causes of the differences between underlying and statutory profitability. Additionally, underlying revenue
includes the Group’s share of revenue in joint ventures and associates and is presented on a continuing operations basis.
Group financial summaryIn 2016, the Group returned to both underlying and statutory profitability. On an underlying basis, order book, revenue, profit from
operations, earnings and net cash all improved year-on-year as the progress made with Phase One of Build to Last translated into
improved financial metrics.
Underlying revenue increased by 4% to £8,530 million (2015: £8,235 million). Underlying revenue at constant exchange rates
(CER) fell by 3% as the Group continued with its more disciplined and selective approach to bidding. Statutory revenue, which
excludes joint ventures and associates, was £6,923 million (2015: £6,955 million).
Construction Services underlying revenue was up 7% at £6,852 million (2015: £6,388 million) as growth in the US offset an
expected decline in the UK; underlying revenue at CER fell by 1%. Support Services underlying revenue declined 12% at £1,103
million (2015: £1,259 million) due to the phasing of contract and regulatory cycles.
The Group returned to profitability in 2016 with underlying profit from operations at £67 million (2015: £106 million loss). Statutory
profit from operations improved from a loss of £182 million to a profit of £15 million primarily driven by the increase in underlying
profit and a reduction in non-underlying costs.
Infrastructure Investments continued to deliver excellent results with underlying profit from operations of £89 million (2015: £132
million), including the benefit of £65 million of profits from investment disposals (2015: £95 million). Support Services rebounded to
more normal levels, compared to the prior year, with underlying profit from operations of £34 million (2015: £24 million). Underlying
loss from operations in Construction Services reduced to £23 million (2015: £229 million loss), where losses in the UK of £64
million (2015: £187 million loss) were only partially offset by profits in the US of £33 million (2015: £22 million loss).
The half-yearly contribution of the Group’s £67 million underlying profit from operations was £5 million in the first half, with £62
million in the second half of the year. Infrastructure Investments, Support Services and Construction Services all reported
underlying profit from operations in the second half of 2016, with UK construction continuing its positive trajectory as it returned to
underlying profitability, a modest £2 million in the second half of the year.
Net finance costs decreased to £7 million (2015: £17 million) predominantly due to a £19 million gain on foreign currency deposits.
The taxation charge on underlying profits increased to £12 million (2015: £11 million).
Underlying profit after tax for the year at £48 million (2015: £135 million loss) represents a material improvement over the previous
year, primarily driven by the improvement in Construction Services. Total statutory profit after tax for the year was £24 million
(2015: £206 million loss).
The order book increased by 15% to £12.7 billion (2015: £11.0 billion), up 4% at CER, despite the more disciplined and selective
approach to bidding. Additionally, the quality of the order book improved as the business increased bid margin thresholds and
focused on jobs where the Group can deliver value.
The improved order book was predominantly due to Construction Services at £9.6 billion (2015: £7.9 billion), with increases in all
material geographical regions: UK construction up 11%; US construction up 10% at CER; and Far East construction up 14% at
CER. The Support Services order book was stable at £3.1 billion (2015: £3.1 billion).
Earnings per shareUnderlying earnings per share from continuing operations was 7.0 pence (2015: 19.7 pence loss), which along with a non-
underlying loss per share from continuing operations of 7.0 pence (2015: 10.5 pence loss) resulted in earnings per share from
continuing operations of nil pence (2015: 30.2 pence loss). Statutory earnings per share was 3.5 pence (2015: 30.1 pence loss).
Cash flow performanceThe total cash movement in the period resulted in a £10 million increase to the Group’s net cash position, excluding non-recourse
net borrowings, to £173 million. This compares to a decrease in the Group’s net cash position of £56 million in 2015. The increase
in net cash was driven by proceeds from investment disposals and favourable US dollar foreign exchange movements, partly offset
by new investments in infrastructure assets, negative operating cash flows, working capital movements and pension deficit
payments.
Operating cash flows, before movements in working capital and pension deficit payments, improved to an outflow of £58 million
(2015: £247 million outflow). This reduced outflow is predominantly as a result of the improved financial performance from
Construction Services. Working capital had an outflow of £48 million (2015: £178 million inflow) and pension deficit payments were
an outflow of £41 million (2015: £66 million). Total cash used in operations before tax was £147 million (2015: £135 million), a
decline of £12 million compared to the prior year. Currency translation differences on net cash generated a positive movement of
£30 million (2015: £12 million negative).
The total cash movement in the period excluding Parsons Brinkerhoff (PB) proceeds resulted in a £1 million increase in the Group’s
net cash position. This represented an £82 million improvement on 2015, and a £439 million improvement on 2014 - an excellent
performance against the Build to Last Phase One target of £200 million cash flow improvement versus 2014.
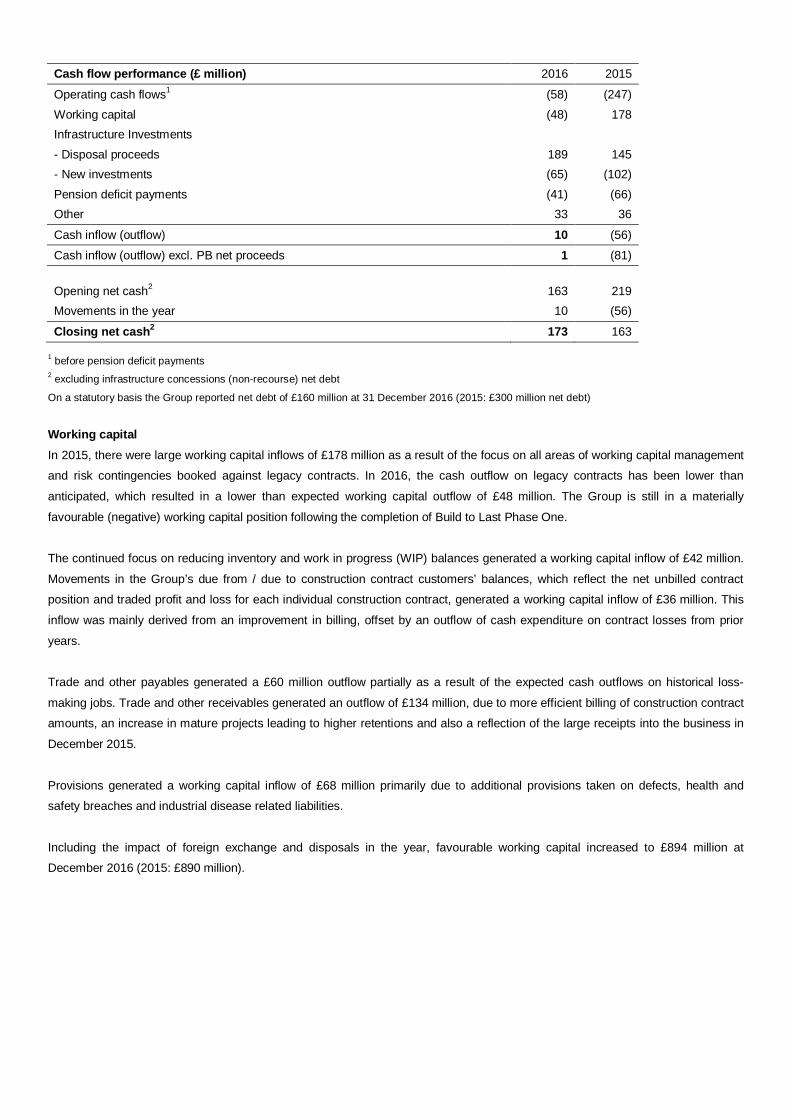
Cash flow performance (£ million) 2016 2015
Operating cash flows1 (58) (247)Working capital (48) 178Infrastructure Investments- Disposal proceeds 189 145- New investments (65) (102)Pension deficit payments (41) (66)Other 33 36
Cash inflow (outflow) 10 (56)
Cash inflow (outflow) excl. PB net proceeds 1 (81)
Opening net cash2 163 219Movements in the year 10 (56)
Closing net cash2 173 163
1 before pension deficit payments2 excluding infrastructure concessions (non-recourse) net debt
On a statutory basis the Group reported net debt of £160 million at 31 December 2016 (2015: £300 million net debt)
Working capitalIn 2015, there were large working capital inflows of £178 million as a result of the focus on all areas of working capital management
and risk contingencies booked against legacy contracts. In 2016, the cash outflow on legacy contracts has been lower than
anticipated, which resulted in a lower than expected working capital outflow of £48 million. The Group is still in a materially
favourable (negative) working capital position following the completion of Build to Last Phase One.
The continued focus on reducing inventory and work in progress (WIP) balances generated a working capital inflow of £42 million.
Movements in the Group’s due from / due to construction contract customers’ balances, which reflect the net unbilled contract
position and traded profit and loss for each individual construction contract, generated a working capital inflow of £36 million. This
inflow was mainly derived from an improvement in billing, offset by an outflow of cash expenditure on contract losses from prior
years.
Trade and other payables generated a £60 million outflow partially as a result of the expected cash outflows on historical loss-
making jobs. Trade and other receivables generated an outflow of £134 million, due to more efficient billing of construction contract
amounts, an increase in mature projects leading to higher retentions and also a reflection of the large receipts into the business in
December 2015.
Provisions generated a working capital inflow of £68 million primarily due to additional provisions taken on defects, health and
safety breaches and industrial disease related liabilities.
Including the impact of foreign exchange and disposals in the year, favourable working capital increased to £894 million at
December 2016 (2015: £890 million).
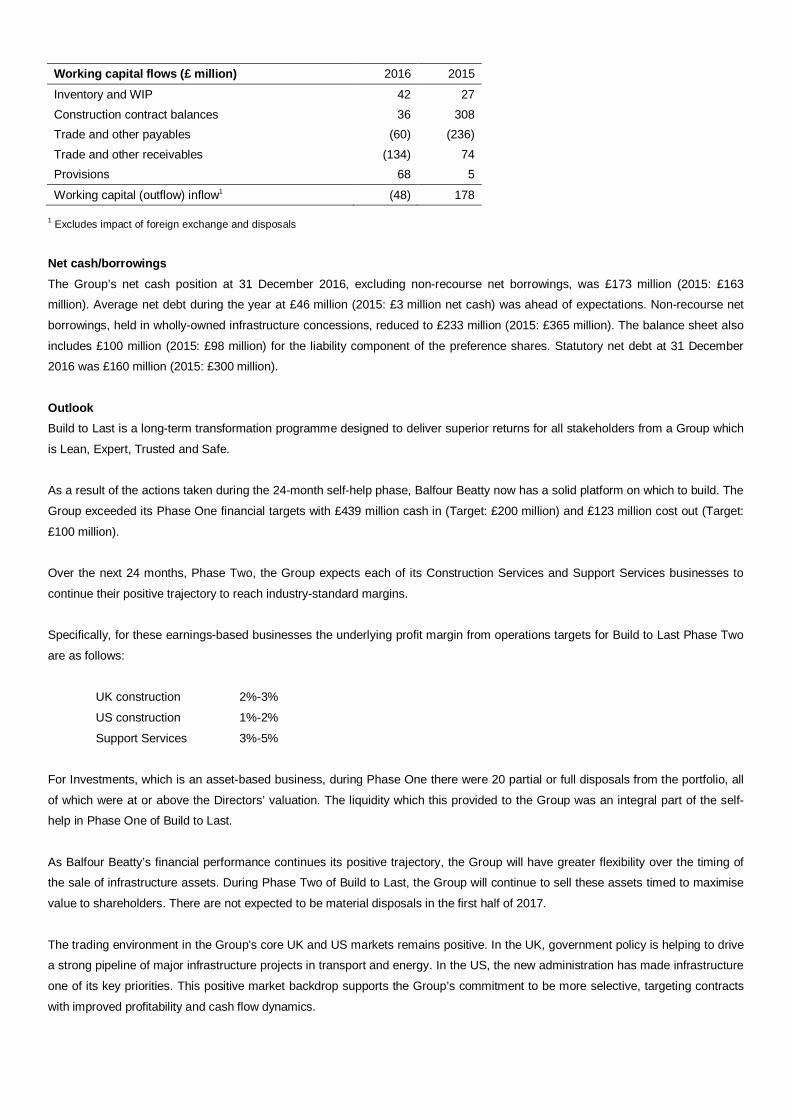
Working capital flows (£ million) 2016 2015
Inventory and WIP 42 27Construction contract balances 36 308Trade and other payables (60) (236)Trade and other receivables (134) 74Provisions 68 5
Working capital (outflow) inflow1 (48) 178
1 Excludes impact of foreign exchange and disposals
Net cash/borrowingsThe Group’s net cash position at 31 December 2016, excluding non-recourse net borrowings, was £173 million (2015: £163
million). Average net debt during the year at £46 million (2015: £3 million net cash) was ahead of expectations. Non-recourse net
borrowings, held in wholly-owned infrastructure concessions, reduced to £233 million (2015: £365 million). The balance sheet also
includes £100 million (2015: £98 million) for the liability component of the preference shares. Statutory net debt at 31 December
2016 was £160 million (2015: £300 million).
OutlookBuild to Last is a long-term transformation programme designed to deliver superior returns for all stakeholders from a Group which
is Lean, Expert, Trusted and Safe.
As a result of the actions taken during the 24-month self-help phase, Balfour Beatty now has a solid platform on which to build. The
Group exceeded its Phase One financial targets with £439 million cash in (Target: £200 million) and £123 million cost out (Target:
£100 million).
Over the next 24 months, Phase Two, the Group expects each of its Construction Services and Support Services businesses to
continue their positive trajectory to reach industry-standard margins.
Specifically, for these earnings-based businesses the underlying profit margin from operations targets for Build to Last Phase Two
are as follows:
UK construction 2%-3%
US construction 1%-2%
Support Services 3%-5%
For Investments, which is an asset-based business, during Phase One there were 20 partial or full disposals from the portfolio, all
of which were at or above the Directors’ valuation. The liquidity which this provided to the Group was an integral part of the self-
help in Phase One of Build to Last.
As Balfour Beatty’s financial performance continues its positive trajectory, the Group will have greater flexibility over the timing of
the sale of infrastructure assets. During Phase Two of Build to Last, the Group will continue to sell these assets timed to maximise
value to shareholders. There are not expected to be material disposals in the first half of 2017.
The trading environment in the Group's core UK and US markets remains positive. In the UK, government policy is helping to drive
a strong pipeline of major infrastructure projects in transport and energy. In the US, the new administration has made infrastructure
one of its key priorities. This positive market backdrop supports the Group’s commitment to be more selective, targeting contracts
with improved profitability and cash flow dynamics.
In Phase Three (2019+), Balfour Beatty aims to command a premium to industry-standard margins as market-leading strength
should be matched by market-leading performance.
DividendThe Board took the decision to suspend the dividend in 2015, to ensure balance sheet strength was maintained during initial stages
of Build to Last. Following the demonstrable progress made by the Group in the first year of the transformation programme and in
the expectation of further solid and measurable improvements, it was decided to reinstate the dividend at an appropriate level in
2016.
Following the 0.9 pence per share dividend declared at the half year, the Board is recommending a final dividend of 1.8 pence per
share, giving a total recommended dividend for the year of 2.7 pence per share. The Board recognises the importance of dividends
to shareholders and anticipates a progressive dividend policy going forward.
BUILD TO LAST
Balfour Beatty launched its Build to Last transformation programme in early 2015 as a framework to drive continuous improvement
for all stakeholders against four goals – Lean, Expert, Trusted and Safe – as measured by cash flow and profits from operations,
employee engagement, customer satisfaction and Zero Harm.
Phase One consisted of 24 months self-help. Rapid action was taken to remove management layers, upgrade leadership and
strengthen governance within a simplified Group structure. In Phase Two (2017-2018) Balfour Beatty will return to industry-
standard margins and in Phase Three deliver a Group with market-leading strengths and performance.
During Phase One, Balfour Beatty made significant progress on its four goals:
Lean• Deliver value to customers by improving operational efficiency and eliminating waste right through the supply chain.
• The Group metric is cash flow and underlying profit from operations – in Phase One, delivering £200 million of cash in and
£100 million of cost out in the first 24 months.
Group net cash at 31 December 2016 was £173 million, a £10 million improvement on 2015.
Overall in Phase One the Group exceeded the £200 million cash in target: cash flow in 2016 was £439 million better than in 2014,
excluding the proceeds from the sale of Parsons Brinckerhoff. This is the result of the continuing focus on tight management of
cash and working capital, improvements to financial systems and controls, employee training and aligning incentives to deliver
better performance.
A new Group financial consolidation system has been introduced and the process to transfer data from the ERP system to the
consolidation system has been automated, building on the progress made in 2015. Improved weekly cash flow performance
reconciliations are leading to significant improvement in the business’ ability to forecast cash flow, enabling more effective
management of draw-down of the Company’s debt facility.
Further progress was made on the £60 million of annualised cost savings achieved in 2015. By the end of 2016, £123 million of
annualised savings (compared to 2014) had been achieved, exceeding the £100 million target. The business continues to exploit
opportunities to make further savings through standardisation and leaning out processes.
Savings have been driven by simplifying the business, including creating unified back office operations, eliminating waste,
standardising working practices and moving the culture of the organisation to encourage and reward efficient practices. During
2016:
· The US construction and infrastructure businesses have been brought together under a single leader with back office
functions (IT, legal, finance etc.) unified to provide high-quality, efficient support (in a similar model to that deployed in the
UK during 2015) and leadership across the business has been upgraded;
· The IT service which had previously been delivered though a sub-optimal outsourcing agreement was successfully
brought back in-house. This continues to deliver a more responsive and efficient IT operation with annualised savings of
approximately £5 million;
· The Site Mobilisation Hub was introduced for all UK contract start-ups in the summer. By centralising and standardising
this process, resources can be efficiently redeployed from one job to the next. This reduces wastage, cost and delays
caused by sites not being operationally ready. At the same time, project managers are freed up to focus on their project
rather than site set-up. The Hub has engaged with 445 projects, of which 45 mobilisations have now been delivered, all
on time and to budget or better, achieving significant savings;
· Framework agreements have been developed with a shortlist of preferred design consultants with the express aims of
strengthening business relationships and providing greater consistency in the way that design services are provided,
reducing cost and delivering greater value to customers;
· The US strategic procurement group established over 40 national agreements with suppliers selected on their ability to
deliver superior products and services to all major US geographies, as well as offer highly competitive pricing; and
· Further progress has been made in rationalising the property portfolio, bringing business units together in shared offices,
thus aiding collaboration, reducing floor space requirements by 35% and providing more productive working
environments. Over the first two years of Build to Last, UK property costs have been cut by approximately 25%.
The Group has made considerable progress in simplifying its portfolio with the disposal of non-strategic businesses, in order to
focus on its core markets:
· Balfour Beatty Infrastructure Partners, an independently managed infrastructure fund business focusing on secondary
opportunities, was disposed of to Wafra Investment Advisory Group, Inc;
· Balfour Beatty Investments’ sole project in Australia was sold and Balfour Beatty staff and pipeline transferred to Infrared;
· Balfour Resource Group, a healthcare facilities planning consultancy that became part of Balfour Beatty through the
Centex acquisition, was sold to management;
· The sale of Balfour Beatty’s share of its Indonesian joint venture, Balfour Beatty Sakti, to its joint venture partner;
· In early 2017, Balfour Beatty’s entire share of its Middle Eastern joint ventures, Dutco Balfour Beatty and BK Gulf, were
sold to its joint venture partner; and
· Following completion of the sole rail maintenance contract in Chile, the decision was taken to wind up that business.
Expert
· Ensure that Balfour Beatty is attracting, retaining and motivating employees to enable it to offer customers the best
engineering, design, project management and delivery capabilities.
· The Group metric is average employee satisfaction.
Quality of leadership is the number one factor in driving a world class organisation. During 2016, the Group built on its progress in
2015 by further upgrading the quality of senior management, particularly through promotion.
In addition to the unification of the US businesses described in the previous section: in the UK, Engineering Services and
Engineering Construction were brought together under the banner of Balfour Beatty Kilpatrick and a unified leadership; and a new
leadership team was put in place in the UK Power business.
The model of centralised support functions (HR, IT, finance etc.) as first rolled out in the UK continues to provide higher service
levels to the business compared to the previous devolved model, whilst continuing to outperform with respect to re-engineering
process and reducing cost.
During the year, further work has been completed to build communities of practice for key skills across the business. These
communities allow the sharing of best practice across the Group and provide opportunities for career development to the staff
involved.
· A Group-level Project Management Academy has been developed, aligned to international standards through an
accredited training programme, to provide a common approach to professional development and practice. This initiative
provides clarity on the competence level required for each project manager (PM) role and provides an Assignment
Database to match PM competence to contract risk and complexity, greatly enhancing the probability of a successful
outcome for customers.
· Building on the success of the Project Management Competency Assessment carried out across all levels of Balfour
Beatty’s project management employees, work is underway to extend the assessment process into several key Alliances.
· A new strategic approach to bidding and winning key business has been introduced to co-ordinate major opportunities
which straddle business units, in order to ensure that Balfour Beatty has a unified and compelling offer. Business
Acquisition Method training has been rolled out to 200 employees across the UK and US businesses, introducing a
common and systematic approach to winning business. The new training programme boosts estimating skills and
improves the quality of proposals, reducing the risk of underbidding.
· A similar focus on the commercial expertise within the business has enabled better sharing of best practice and a forum
for senior commercial professionals to identify training and development opportunities. As a result an extensive
programme of training has commenced to give the Commercial team the skills to work more productively with customers
on more collaborative forms of contract.
During 2016, Balfour Beatty made significant progress towards becoming a digitally empowered business. Development of staff
capabilities such as the training of six new drone pilots, a digital surveying team with full laser scanning service, a high-end
visualisation team and a significant increase in BIM support have all led to an increase in quality, a leaner approach and a safer
working environment. As a result of Balfour Beatty’s investment in BIM, in 2016 it became one of the first companies to receive the
British Standards Institute’s BIM Kitemark, an accolade only three other companies have achieved. The Group also achieved
another first during the year by winning the V3 Digital Technology Leaders Award for best Public Sector Project in partnership with
Southampton Council.
2016 also saw global collaboration in the fields of Virtual Reality and construction robotics, utilising skills from the UK, US and Hong
Kong. Both technologies are vital to the future of Balfour Beatty as an industry leader.
Training and retaining staff remain critical to the long-term success of Balfour Beatty and is therefore a central tenet of Build to Last.
A new redeployment tool was introduced during the year to identify appropriate opportunities for staff when their current project
concludes, keeping skilled workers in the business and reducing redundancy and recruitment costs.
Two leadership development programmes have been launched, with 50 delegates in 2016. One works with the leadership teams to
actively improve and measure the culture and climate they create in their business. The second identifies high-potential employees
to join a 12-month programme to develop their management skills and capabilities and their transition to leadership roles.
Skills shortages within construction have been a challenge for several years. The UK’s decision to leave the European Union with
the potential for reduction in free movement of people is likely to exacerbate the situation at a time when demand for skilled workers
will increase given the pipeline of projects due to start in the coming years.
Balfour Beatty believes that employers are best placed to determine and train their required future capabilities and therefore must
take the lead by making a long-term commitment to invest in the next generation workforce. For this reason, Balfour Beatty belongs
to and is sponsoring The 5% Club, an employer-led organisation whose members commit to striving to achieve 5% of their UK
workforce in ‘earn and learn’ positions within five years of joining.
During 2016 Balfour Beatty recruited 114 apprentices and 110 graduate trainees. The percentage of the workforce in ‘earn and
learn’ positions at year end stood at 4.3%, a slight reduction on the 2015 number as a result of an unusually high level of
recruitment to these positions in the previous two years, where participants have now been appointed into mainstream roles.
Balfour Beatty’s aspiration remains to reach 5% or above.
My Contribution is the mechanism which directly engages all staff in Build to Last by enabling employees to suggest and drive
changes in the business to help deliver on Build to Last’s Lean, Expert, Trusted and Safe goals. In 2016, 3,114 ideas for business
benefits were logged by Balfour Beatty employees, of which 417 were progressed as projects and delivered with financial savings
of £19 million and over 230,000 hours of time savings.
For the second year a company-wide employee engagement survey was carried out. This is the first time that all the necessary
questions have been asked which allows for Balfour Beatty’s performance to be benchmarked against other businesses by Best
Companies. Balfour Beatty’s employee engagement score was 626.4, which is regarded by Best Companies as demonstrating
good levels of employee engagement. Response rate for the survey at 67% was up on the 2015 survey (61%). The Group
employee satisfaction score for 2016 was 58% (2015: 60%).
Trusted• Be the construction partner of choice for customers and supply chain by delivering on promises.
• The Group metric is customer satisfaction.
Customer satisfaction is achieved by doing what we say we will do. Balfour Beatty continued to win landmark contracts in all its
selected markets with the order book up 15% (4% at CER) at £12.7 billion.
During 2015, the 8-Gated Lifecycle was introduced across Balfour Beatty. In 2016, the framework has been further refined with the
addition of a ‘make or buy’ decision step to promote greater use of internal capabilities. Internal reviews of the bidding Gates (1-4)
across all UK and US business units demonstrate compliance with all new processes. As a result of the early qualification Gates (1-
2) there has been a sharp reduction in the value of work tendered and lost. The UK win rate for 2016 was almost double that of
2015.
To further enhance the control and rigour of the Gated Lifecycle, a secure web-based platform effectively digitises the governance
and document control through all stages and gates of acquiring contracts and delivering projects. This Digital Briefcase was
released at the end of 2016 and is now installed across UK business units with over 500 key users and approvers trained and
utilising the functionality successfully.
Within the industry there continues to be a strong dependence on joint ventures to execute major projects. A key area of focus
going forward will be to ensure the Group can exercise the same degree of governance and control in these instances as it is
gaining through its Build to Last transformation on sole projects.
The rationalisation, upgrade and standardisation of the ERP systems continues. The use of data analytics and automated risk
scoring is now fully embedded in both UK Regional Construction and Balfour Beatty Kilpatrick where the majority of legacy losses
have previously been recorded. Following a successful pilot in 2016 this is now being rolled out across buildings and civils in the
US in conjunction with a simplification of their associated legacy system architecture. This now provides management with
consistent and timely information in regards to project performance (Project on a Page) based on an increasingly broadening
balanced scorecard of metrics. Looking forwards, with further planned improvements and development, it is expected that
integrating multiple key operational data sources in 2017 will maximise the ability to influence project performance at the earliest
possible stage.
A major review of the Business Management System (BMS) was undertaken in 2016 to create a single refreshed and improved
system across all UK businesses. The BMS provides guidance and rules about how Balfour Beatty delivers tasks. The new system
includes offline access and simplified access to information. The BMS will continue to be improved throughout the year and will
define how the Group manages and delivers activities.
During the year 2,107 customer satisfaction reviews were carried out, primarily in the UK. The Group customer satisfaction average
was 91% (2015: 82%). Scores in the UK were generally significantly higher than those in the US.
Safe• Ensure the health and safety of everyone who comes into contact with Balfour Beatty’s activities.
• The Group metric is Zero Harm.
Many of the activities carried out by Balfour Beatty can be, by their nature, potentially dangerous. It is therefore essential that the
health, both physical and mental, and safety of employees, and those who come into contact with Balfour Beatty, including
subcontractors and the general public, are always Balfour Beatty’s first priority.
Health and Safety takes a risk-based approach to identify and prioritise action plans, focused on communicating the Zero Harm
vision, leadership, learning and sharing, clear co-ordinated governance, supply chain engagement, health and safety by design
(including offsite modular assembly), simplifying and improving management systems and processes, training and competence,
behavioural safety, innovation, recognition and reward, clear performance indicators and locally sponsored initiatives. Group
initiatives are proactive and evidence based and include quarterly campaigns and Group-wide stand downs. In 2016 fatal risk
groups were reviewed with leadership at managing director level and initiatives taken to increase skills and awareness, improve
performance and promote employee and supply chain engagement.
Each week senior management report and consider any accident or near misses that have occurred and a weekly report, available
to all employees, shares safety best practice as well as reporting on significant incidents and learning which can be drawn from
Balfour Beatty or elsewhere in the industry.
In May 2016, a Balfour Beatty company was sentenced in connection with its conviction and guilty plea to breaches of Section 3 of
the Health & Safety at Work Act 1974 and related health and safety regulations. The HSE prosecution was in relation to a fatality
on the Heysham Power Station project in Lancashire on 14 April 2010. Balfour Beatty received a fine of £2.6 million. The fine was
judged on the basis of the new sentencing guidelines published by the Department of Justice and demonstrates the increasingly
heavy financial consequences for failures to meet the necessary safety and environmental standards.
Safety is monitored through a combination of leading and lagging performance indicators. The Group Lost Time Incident Rate
excluding international joint ventures fell to 0.22 (2015: 0.24), however, very regrettably there were a number of serious incidents
which resulted in a total of five fatalities, one in each of the UK and US and three in the Far East.
DIVISIONAL OPERATING REVIEWS
CONSTRUCTION SERVICESFinancial reviewConstruction Services made significant progress in 2016. The order book increased from £7.9 billion to £9.6 billion. Underlying
revenue increased from £6.4 billion to £6.9 billion, and although the business still reported underlying losses from operations of £23
million the trajectory is positive.
Progress continued to be made on returning the business to profitability, with the second half seeing a £37 million underlying profit,
after the loss of £60 million in the first half. Included within the £37 million profit in the second half, UK construction continued its
recovery as it returned to £2 million underlying profit from operations.
Despite the increase in order book, the construction business continued to be more selective in the work that it bid, through
increased bid margin thresholds, improved risk frameworks and better contract governance. Following the introduction of the Gated
Lifecycle there has been a much narrower range of outcomes as a direct result of the tighter, more effective control environment.
In addition, there has also been a shift towards a lower risk contract portfolio. Approximately 45% of the value of new UK regional
orders won in 2016 were two-stage tender projects. This represented a material increase on 2015 with two-stage tenders generally
replacing standard project contracts.
1 including share of joint ventures and associates2 from continuing operations3 non-underlying items (Note 8)
A reconciliation of the Group’s performance measures to its statutory results is provided in the Measuring Our Performance section.
Underlying revenue increased by 7% to £6,852 million (2015: £6,388 million), 1% decrease at CER. Underlying revenues in the UK
fell by 6% as forecast, as improved bidding disciplines and selectivity adopted in 2015 resulted in lower levels of contracts in
previous problem areas. This was more than offset by an underlying revenue increase of 11% in the US (2% decrease at CER) and
a 21% increase in the Far East (8% increase at CER).
The underlying loss was £23 million (2015: £229 million) as underlying profits in the US (£33 million) were offset by losses in the
UK (£64 million). The losses in the UK, caused by historical contracts which are still being traded through to completion, are
substantially lower than the prior year, and in the second half of 2016, UK construction continued its positive trajectory as it
delivered an underlying profit from operations of £2 million.
Construction Services
2016 2015
Rev1,2 PFO2 Orderbook1,2 Rev1,2 PFO2 Order
book1,2
£m £m £bn £m £m £bn
US 3,427 33 5.5 3,097 (22) 4.1UK 1,894 (64) 2.1 2,024 (187) 1.9Rail 249 (1) 0.2 274 (5) 0.2Overseas JVs- Far East 967 11 1.5 796 19 1.2
- Middle East 315 (2) 0.3 197 (34) 0.5
Underlying 6,852 (23) 9.6 6,388 (229) 7.9Non-underlying3 153 (34) 0.0 209 (51) 0.2
Total 7,005 (57) 9.6 6,597 (280) 8.1
The order book increased by 22% (5% at CER) due to growth in both the UK and the US core markets. The UK order book
increased by 11% to £2.1 billion, despite the more disciplined and selective approach to bidding. The US order book increased by
34% (10% at CER) due to strong levels of order intake, such as the Caltrain rail corridor electrification contract. The Far East order
book increased by 25% (14% at CER) with a number of notable awards during the year including the redevelopment of Somerset
House, Hong Kong.
Across the construction portfolio there remain a small number of long-term and complex projects where the Group has incorporated
significant judgements over contractual entitlements. The range of potential outcomes could result in a materially positive or
negative swing to profitability and cash flow. In the UK, the majority of these contracts are within the Major Projects business unit.
Outside the UK, the Group still has a number of significant contracts in Hong Kong where the range of potential outcomes could
result in a materially positive or negative swing to profitability.
UKThe UK construction business is organised into two business units consisting of:
· Major Projects: focused on complex projects and ground engineering services in key market sectors such as
transportation, heavy infrastructure and energy.
· Regional: private and public, civil engineering, mechanical and electrical engineering and building, providing customers
with locally delivered, flexible and fully integrated civil and building services.
During the year, the business continued to simplify. Engineering Construction and Engineering Services (mechanical and electrical
engineering) merged in August 2016, with the new business rebranded as Balfour Beatty Kilpatrick, led by a new managing director
and standardised on a single ERP system. Within Regional, the number of live projects continued to fall from around 400 at
December 2015 to around 250 by December 2016. Over 150 of the current live projects have been through the Gated Lifecycle
process.
Underlying revenue in the UK fell by 6% to £1,894 million (2015: £2,024 million), predominantly due to a decline in the Regional
construction business. The UK business continued to be more selective in the work that it bid, through increased bid margin
thresholds, improved risk frameworks and better contract governance. The Group qualified out nearly £7 billion worth of projects in
2016, whilst at the same time almost doubling the win rate.
Despite the focus on improving the quality of new orders, the UK order book increased by 11% to £2.1 billion (2015: £1.9 billion)
following a number of notable awards including: a contract to widen a 10-mile stretch of the existing A14; a contract to upgrade
baggage screening and handling systems for Heathrow airport; the main construction works for The Madison Tower, a 53-storey
residential building in Canary Wharf; and construction of engineering and training facilities at RAF Marham in Norfolk.
The underlying loss from the UK construction business was £64 million (2015: £187 million), representing an improvement from the
prior year. The loss in the period was caused by three main factors: additional losses incurred on historical contracts; lower
overhead absorption due to the lower revenue base; and newer projects not being progressed to a stage where it is appropriate to
begin to recognise gross margin.
There is a positive trajectory, with the £64 million underlying loss from operations in 2016 split between a £66 million loss in the first
half and a £2 million profit in the second half of the year.
The business is continuing to manage historical problem contracts through to completion. At the 2015 half year 89 historical
contracts were identified that had a material negative impact on profitability and cash. As at the end of December 2016, and in line
with previous guidance given, 90% of these projects were at practical completion (60% at end December 2015) with over 70% at
financial completion. Four of the remaining nine contracts are expected to reach practical completion in 2017, with the remainder in
2018.
The Group is working constructively with industry bodies and the UK Government to identify and manage any direct challenges
caused by the UK’s exit from the European Union. At this stage Balfour Beatty has not seen an impact on the building market;
however the Group remains vigilant to respond to any changes in market conditions.
In 2016, the Major Projects business successfully completed the complex engineering transformation of the former London Olympic
stadium, to allow West Ham United FC to start using the multi-purpose venue in time for the new football season. Work was also
completed on the upgrade to Junction 30 of the M25 in Essex.
On Crossrail, Balfour Beatty’s three major projects: C510 (Liverpool Street and Whitechapel Station tunnels); C512 (Whitechapel
Station); and C530 (Woolwich Station) all made significant progress during the year. At the Thames Tideway Tunnel work has
commenced on the 6-kilometer ‘West’ section which runs from Acton to Wandsworth. In Highways, material ongoing work includes
the conversion of the M3 Motorway (J2-J4) into a Smart Motorway and the construction of dual carriageways for the A21 between
Tonbridge and Pembury, the Aberdeen Western Peripheral Route and the Norwich Northern Distributor Road.
Notable new contract awards in the period include a £146 million construction package to widen a critical and complex 10-mile
stretch of the existing A14 and a contract to build an energy from waste facility for Gloucestershire County Council. Included within
awarded but not contracted (ABNC), the Highways business has been selected to deliver a Smart Motorway package to upgrade
sections of the M6 and M4 (J3–J12). Additionally, a contract from Highways England for the construction of a proposed lorry area
near the M20, worth up to £130 million, has been awarded but is currently under consultation.
The Major Projects business continues to pursue a number of major infrastructure opportunities across core transportation and
energy markets. Over the next few years High Speed 2 (HS2) rail, new nuclear power stations at Hinkley Point C and Wylfa and the
third runway at Heathrow airport will all contribute to the Government’s investment in infrastructure target, which is forecast to rise
to over 1% of GDP by 2020-21.
The proposed HS2 rail route will connect London, Birmingham, Leeds and Manchester with total estimated costs of over £50 billion.
Balfour Beatty and VINCI are in a joint venture pursuing work on HS2, utilising the expertise acquired by both companies on High
Speed 1, VINCI’s involvement on the €8 billion Tours-Bordeaux high-speed rail project in France, and Balfour Beatty’s extensive
work on transport networks across the UK and overseas. Balfour Beatty VINCI were unsuccessful in tendering for the enabling
works packages during the year, but the joint venture has recently tendered for four major civil engineering works packages (two in
the Central section, two in the North section), with contract awards expected in 2017. In addition, the highways market continues to
provide good growth opportunities following the Government’s commitment of £15 billion to Highways England in order to deliver
the first Roads Investment Strategy.
The Regional business is organised into four regions and Balfour Beatty Kilpatrick, following the merger of Engineering
Construction and Engineering Services in August 2016.
· Regional Construction: four regions (Scotland, North & Midlands, South and London) providing public and private
customers with locally delivered, flexible and fully integrated civil and building services.
· Balfour Beatty Kilpatrick: heavy mechanical and electrical (M&E) installations and building services.
As a result of the focus on bidding for contracts with increased margins and more favourable contract terms, the Regional business
is now focused on fewer, larger contracts and continues to reduce its exposure to contracts under £5 million. This allows the
business to focus on projects with better pricing and risk dynamics, but also improves the span of control as it operates fewer sites.
As a result, the total number of live jobs in the Regional business has reduced from over 400 at December 2015 to approximately
250 at December 2016. Over 150 of the current live projects have been through the Gated Lifecycle process.
In 2016, the Regional business successfully completed the A1 improvement scheme where lane capacity was increased from two
lanes to three lanes in each direction from the Metro Centre to Coal House junction. Other key milestones included the completion
of the Kent bound platform at the new Abbey Wood Crossrail station and the North Ayrshire community hospital. Material ongoing
projects include the Kennedy Street student accommodation project in Glasgow, Clyde and Pen y Cymoedd windfarms, Redwood
luxury retirement village for Audley and the renovation and new build scheme at No. 1 Palace Street in St James’, London.
The Regional business had a number of landmark successes in 2016. Notable new contract awards in the period included:
· £170 million contract to upgrade baggage screening and handling systems for Heathrow airport;
· £150 million contract to deliver the main construction works of The Madison Tower, a 53-storey residential building in
Canary Wharf, London;
· £82 million contract to build engineering and training facilities at RAF Marham in Norfolk, in readiness for the arrival of the
UK’s first F-35 Lightning aircraft in 2018;
· £47 million contract to deliver a 1,350 pupil academy on behalf of Hub North Scotland and Aberdeen City Council; and
· Having previously delivered 2,520 units across five Central London student accommodation schemes, the latest contract
with Urbanest is a £42 million development in Vauxhall, London.
Following its reorganisation, Balfour Beatty Kilpatrick has been awarded a contract in excess of £20 million for the mechanical and
electrical services for a pharmaceutical research and innovation facility being built in Hull. The Government’s approval for Hinkley
Point C formalised the selection of a 50:50 joint venture between Balfour Beatty and NG Bailey for the £460 million power station
electrical package. The work will deliver the critical infrastructure to power the station, including cabling totalling over 3,000
kilometres in length, fire and environmental sealing and specialist packages associated with data acquisition and plant control.
The Regional business also continues to secure a number of significant projects operated by Scape Group, which is open to all
public sector bodies in the UK and covers projects ranging from road repairs, new bridges and coastal defence works to light rail
schemes and major road projects. In 2016, the Group was awarded a £35 million contract to deliver the first phase of the Perth
Transport futures project and a £14 million contract to deliver the second phase of the Almond Bank flood defence scheme.
Included within ‘awarded but not contracted’, Balfour Beatty has been selected as construction partner on Manchester University’s
flagship project, the £350 million Engineering Campus development and has also been awarded the Eastwick and Sweetwater
residential development project.
The Regional business continues to pursue a number of opportunities across its core defence, education, health, residential-led
neighbourhoods, student accommodation and transportation markets.
USUnderlying revenues in the US grew by 11% in the period (2% decline at CER) and the order book increased by 34% (10%
increase at CER). The business reported an underlying profit from operations for the year of £33 million (2015: £22 million loss), as
the US returned to profitability following a number of write-downs in the prior year. The underlying operating profit margin at 1.0% is
at the low end of the Group’s Build to Last Phase Two target of 1%-2% for US construction, as the effects of legacy contracts trade
out, but the trajectory is positive and market conditions are considered favourable.
The US business continued to drive operational focus and business simplification. The general building business and the
infrastructure business have now been united under a single leader, which further develops and complements the move to a leaner
organisational structure. The business has been refocused on certain geographies, known as ‘The Southern Smile’. This starts in
the Pacific North West, runs through California, Texas, Florida and up through Georgia and the Carolinas to Washington DC. In the
US approximately 85% of revenues are generated from the general building market, with the infrastructure market (rail, road and
water) accounting for the remaining 15%.
In the building business, underlying revenues were up 12% (stable at CER). The order book increased by 30% (5% at CER), as the
business continued to see strong order intake, notwithstanding the improved bidding disciplines. The business remains focused on
working with repeat customers, in known geographies where it can deliver value. It has therefore intentionally withdrawn from
bidding on most stick frame multi-family housing, in order to switch to better quality revenues in core markets such as office,
education, hospitality, residential and healthcare.
Notable awards in the period included a US$276 million contract for a 42-storey mixed-use residential project in downtown San
Francisco; a US$199 million contract for a mixed-used development in Dallas, comprising a 20-storey office tower and a second
34-storey tower with 253 residential units; a US$196 million contract in Washington for the construction of two 12-storey office
towers to be built on top of an existing platform; a US$126 million contract for Ohlone College, in California, for the development of
three new multi-storey academic core buildings that will house classrooms, laboratories, offices, conference rooms and a library; a
US$110 million contract to construct four new elementary schools and renovate a fifth school for the Highland Park Independent
School District in Texas; a US$99 million contract for the BPM Real Estate Group in downtown Portland to construct a 19-storey
office and hotel development; and a US$84 million contract to build a luxury mixed-use residential tower in midtown Atlanta.
In the infrastructure business, underlying revenues were up 4% (8% down at CER). The order book increased 38% (12% up at
CER) following the notable award of a US$697 million contract for the electrification of the 52-mile Caltrain rail corridor between
San Francisco and San Jose, laying the foundations for the operation of high-speed trains from 2020. This award leverages
expertise demonstrated in constructing the extension of Regional Transport District’s light-rail line across Denver’s south-east
suburbs, which was successfully opened in April 2016.
The infrastructure business continues to pursue design-build and alternative delivery projects in its key rail, highway and water
markets to reflect ongoing changes in procurement trends in the marketplace.
Even before the election of the new President, there was a strong market outlook for construction in the US. In December 2015, the
FAST Act (Fixing America’s Surface Transportation), a US$305 billion transportation bill was signed, providing guaranteed funding
for a five-year period. This bill permits longer term project planning horizons in the public market and is leading to improved visibility
for public funded projects that had been slow to come to market. There are further opportunities being created with the number of
state backed infrastructure bonds (US$30 billion of education bonds in California, US$190 billion multi-state transportation bonds),
and potentially an increase in US private public partnership schemes.
RailUnderlying revenue in the rail business fell by £25 million to £249 million (2015: £274 million). Underlying losses in the year were
£1 million (2015: £5 million) as the business continued to be impacted by poor contract performance on a small number of historical
rail projects. The order book was stable at £0.2 billion. Given the materiality of the segment, future results announcements will
include Rail within UK construction.
InternationalUnderlying revenue in the Group’s Hong Kong and Singapore joint venture, Gammon Construction, increased by 21% (8% at
CER), due to growth in major building projects including the construction of seven towers at the TW5 Cityside residential property
development, 33 Tong Yin Street (residential towers and retail areas) and the conversion of the ex-government Murray building into
a hotel.
Underlying profit from operations in the region reduced to £11 million (2015: £19 million) as new contracts are yet to meet the
required revenue recognition milestones. In Hong Kong there are a number of significant contracts where the range of potential
outcomes could result in a materially positive or negative swing to profitability.
The order book grew by 25% (14% at CER), following the award of a number of notable major building projects: a HK$4 billion
contract for the redevelopment of Somerset House into a 48-storey office building; a HK$2.6 billion contract for a residential
development project for 12 residential towers and five four-storey houses, which together will provide 857 new homes; and a
HK$1.6 billion contract for the construction of the Lee Garden Three Project, which will include 20 floors of office space atop a five-
level retail podium.
In the Middle East, underlying revenue increased to £315 million (2015: £197 million). However, the business continued to make
underlying losses, £2 million in the year (2015: £34 million), reflecting the challenging nature of the region. In early 2017, Balfour
Beatty sold the Group’s entire share in Dutco Balfour Beatty and BK Gulf, for a total cash consideration of £11 million, to its joint
venture partner. As part of the transaction, the local partner assumed responsibility for Balfour Beatty’s guarantees of bonding
obligations in the joint ventures.
Since the start of 2015, Balfour Beatty has exited the Middle East, Indonesia and Australia in order to focus on its chosen markets,
in the UK, US and Far East.
SUPPORT SERVICESFinancial reviewThe Support Services segment comprises utilities and transportation businesses. Utilities operates across power transmission and
distribution and the gas and water sectors. Transportation operates across rail, highways and managed road schemes for local
authorities.
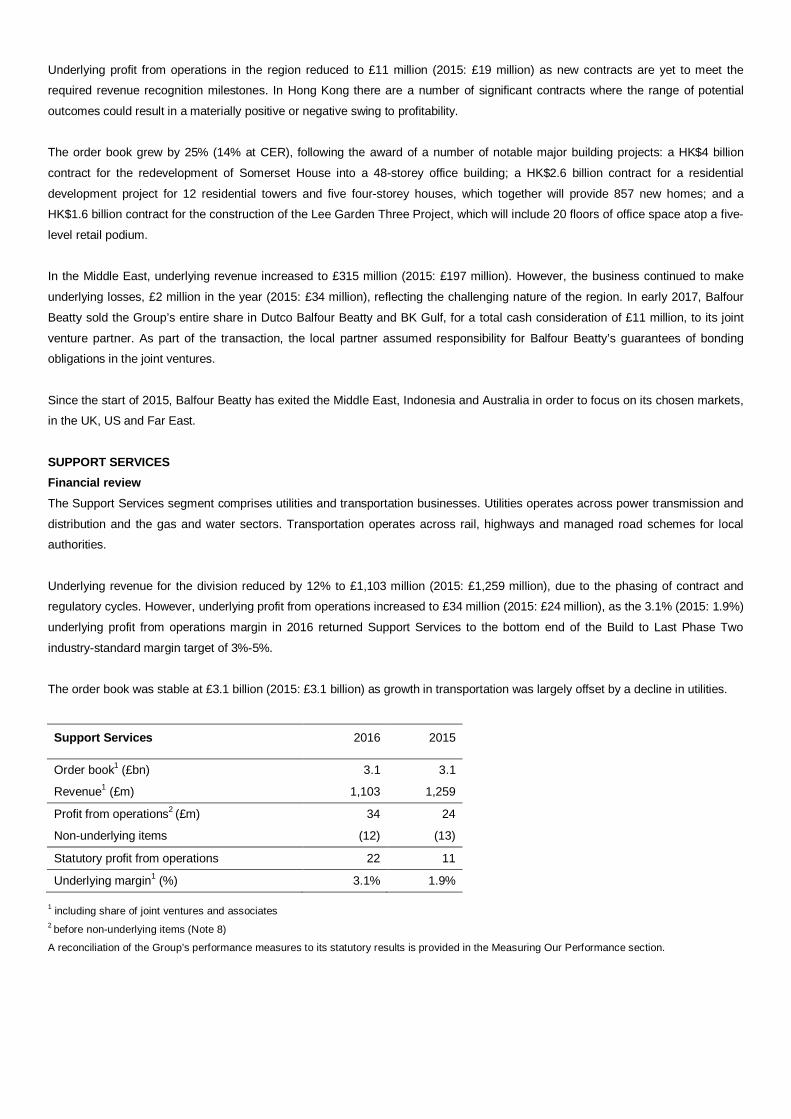
Underlying revenue for the division reduced by 12% to £1,103 million (2015: £1,259 million), due to the phasing of contract and
regulatory cycles. However, underlying profit from operations increased to £34 million (2015: £24 million), as the 3.1% (2015: 1.9%)
underlying profit from operations margin in 2016 returned Support Services to the bottom end of the Build to Last Phase Two
industry-standard margin target of 3%-5%.
The order book was stable at £3.1 billion (2015: £3.1 billion) as growth in transportation was largely offset by a decline in utilities.
Support Services 2016 2015
Order book1 (£bn) 3.1 3.1
Revenue1 (£m) 1,103 1,259
Profit from operations2 (£m) 34 24
Non-underlying items (12) (13)
Statutory profit from operations 22 11
Underlying margin1 (%) 3.1% 1.9%
1 including share of joint ventures and associates2 before non-underlying items (Note 8)
A reconciliation of the Group’s performance measures to its statutory results is provided in the Measuring Our Performance section.
Operating reviewUnderlying utilities revenue reduced by 6% to £590 million, with power transmission and distribution down 10% and gas and water
down 3%. The utilities order book reduced by 10%, with power transmission and distribution down 13% and gas and water down
9%.
Volumes in power transmission and distribution saw a decline in cabling and distribution network operator works, with 2015 also
having significant one-off repair works in offshore transmission.
The power business has undertaken a significant restructure and cost removal during 2016, including the internal appointment of a
new managing director, along with several other senior changes. The business has also focused on qualifying out low-value works
and areas which do not align to its risk profile, including significantly reducing its reliance on volume-based and second-tier
subcontracting projects.
In March 2016, power transmission and distribution was awarded contracts worth £35 million by Scottish Hydro Electric for the
design and construction of the Bhlaraidh and Beinnuen wind farms connections project near Fort Augustus, in Scotland. Most of the
project was successfully delivered during 2016.
In November 2016, the power business was awarded a £120 million contract by ElecLink Ltd to install two 50-kilometer electricity
cables between France and Great Britain through the Channel Tunnel. This will be the first ever installation of a High Voltage Direct
Current (HVDC) interconnector in a live rail tunnel environment.
The slight reduction in gas and water underlying revenue was caused by the dip in the UK water regulatory cycle between the
completion of Asset Management Period 2010-2015 (AMP5) and new contracts continuing to mature under AMP6 (2015-2020).
The reduction in the order book was as expected, given the progress of the AMP6 delivery cycle. Many water contracts are
extended over multiple AMP periods and the Group has already started to engage on the AMP7 planning cycle.
In 2016, gas and water secured an extension, through to 2020, to the gas transmission and distribution contract worth £130 million
for Bord Gais, in Ireland, and also won a £38 million water treatment scheme for South West Water. The delivery of key and
complex schemes remains on track. Gas and water expect a peak volume year in 2017, as it represents the middle of the current
AMP6 cycle.
Underlying transportation revenues reduced by 18% to £513 million, due to expected volume declines from rail and highways.
Underlying rail revenues were lower following the completion of a rail grinding contract in the prior year. Underlying highways
revenues declined due to lower capital spend on a number of contracts for Highways England and completion of the contract for
Area 4 during the period.
The transportation order book grew by 14%, due to strong order intake in rail and from local authorities. The rail business was
awarded a £170 million two-year extension to its Track Partnership contract with London Underground, to deliver essential track
renewal work across the network. In local authorities Balfour Beatty was awarded a £245 million seven-year highways maintenance
contract for Coventry City Council, Solihull Metropolitan Borough Council and Warwickshire County Council. This unique
collaborative arrangement will deliver better value for money, improved service resilience and flexibility in services. Additionally the
Group was awarded a £55 million two-year extension by West Sussex County Council to continue its highways maintenance and
improvement scheme works and Connect Roads signed a £36 million, 10-year extension to its Balfour Beatty Major Projects
Highway Services contract to deliver the essential maintenance works on the A50. The contract covers a 56-kilometer section of
the A50 between Stoke and Derby which acts as a strategic east to west link between the M1 and M6.
In September, the Group acquired Omnicom Engineering Ltd. Omnicom complements Balfour Beatty’s existing rail technology
business by bringing remote surveying hardware and software to enhance the Group’s Digital Rail strategy.
INFRASTRUCTURE INVESTMENTS
Financial reviewThe Investments business delivered another strong performance, having continued its strategy of optimising value through the
disposal of mature assets, whilst also continuing to invest in new opportunities and expanding the breadth of assets.
During the year Investments made significant progress in simplifying its operations by exiting Balfour Beatty Infrastructure Partners
(BBIP), an infrastructure fund run at arm’s length and focused on secondary opportunities, and exiting from the Australian market.
In total 16 assets were either sold or part sold in the period, with all transactions either at, or above, the Directors’ valuation.
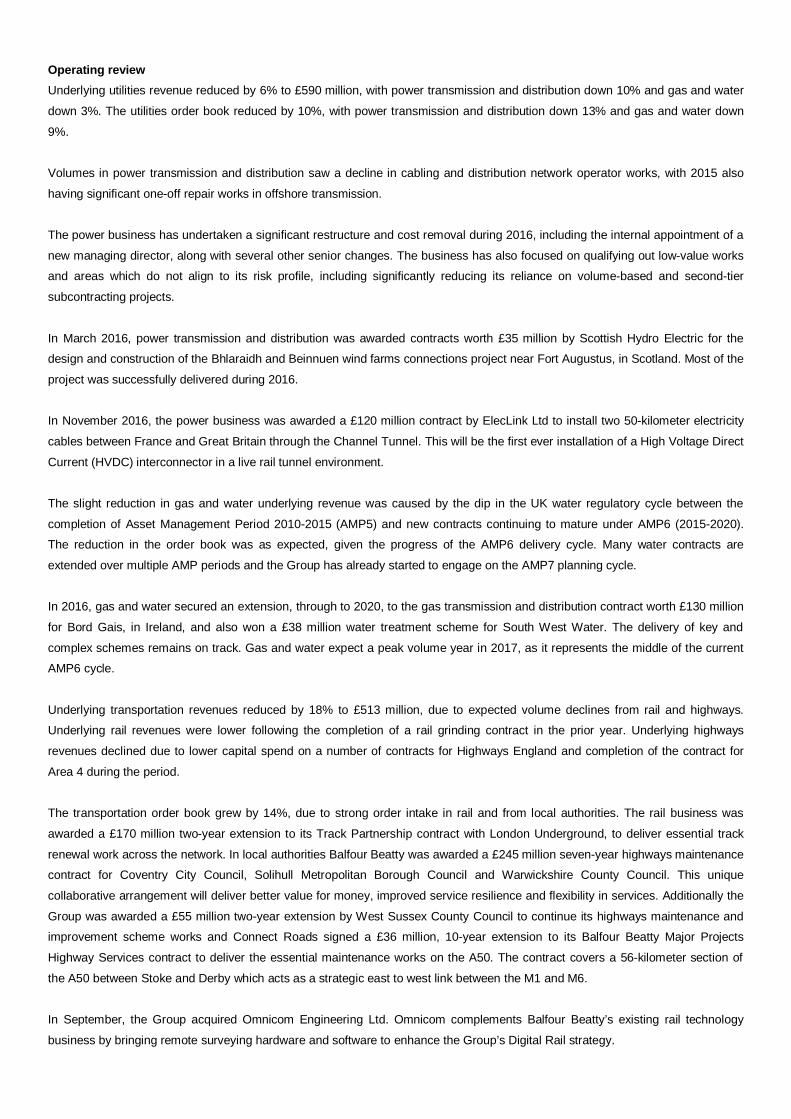
Underlying profit from operations at £89 million (2015: £132 million) was lower than the prior year, predominantly due to a reduction
in profit on disposals as a different mix of assets was sold. Despite an increase in proceeds to £189 million (2015: £145 million) the
reduction in profit on disposals reflected the accounting profile of the assets sold in 2016. Pre-disposals underlying operating profit
decreased to £24 million (2015: £37 million) due to lost income from previous disposals. Net interest income remained broadly
consistent year on year at £26 million (2015: £29 million). The lower underlying profit from operations resulted in a lower profit
before tax at £115 million (2015: £161 million).
Infrastructure Investments 2016 £m
2015 £m
Pre-disposals operating profit1 24 37
Profit on disposals1 65 95
Profit from operations1 89 132
Net interest income from PPP concessions2 26 29
Profit before tax1 115 161
Non-underlying items (6) (10)
Statutory profit before tax 109 151
1 before non-underlying items (Note 8).2 subordinated debt interest receivable and net interest receivable on PPP financial assets and non-recourse borrowings
A reconciliation of the Group’s performance measures to its statutory results is provided in the Measuring Our Performance section.
Operational reviewThe Investments business continued to grow with four wins on new projects where equity will be invested, comprising: three private
rental housing projects and one data centre project. In addition, the Investments business was appointed as third-party manager on
two fee-based projects located in Pennsylvania and Florida. In these fee-based projects no equity will be invested.
In the private rented and regeneration sector, the North American business continues to expand and successfully acquired a stake
in two private rental housing projects in Mobile, Alabama and Atlanta, Georgia. The Mobile portfolio consists of three properties
totalling 320 units and the Atlanta property consists of 437 units. Balfour Beatty Communities will perform property management
services for the properties, leveraging its existing capabilities. In the UK the business acquired its first private development site at
Manchester New Cross. This project will provide a number of units to the private rented housing sector and construction is
expected to begin following financial close in 2017. The Investments business also won a data centre project in Ontario, Canada.
The project is located on the Canadian Forces Base in Borden, Ontario and covers the design and construction, financing and
maintenance for a new 10,000m2 data centre.
Financial close was reached on seven projects: a primary care centres project in Ireland; a student accommodation project in
Glasgow; an offshore transmission project in the North Sea; an energy from waste facility in Gloucestershire; the two US private
rental housing projects; and the data centre in Canada. Five projects have not yet reached financial close.
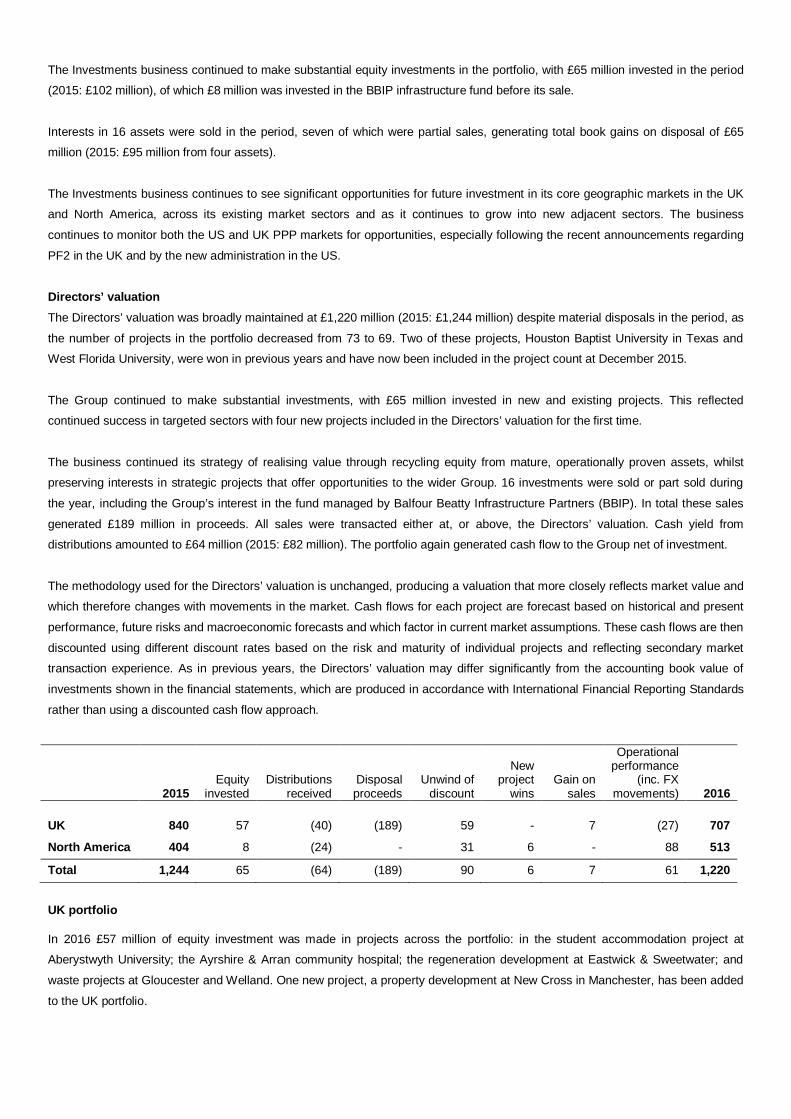
The Investments business continued to make substantial equity investments in the portfolio, with £65 million invested in the period
(2015: £102 million), of which £8 million was invested in the BBIP infrastructure fund before its sale.
Interests in 16 assets were sold in the period, seven of which were partial sales, generating total book gains on disposal of £65
million (2015: £95 million from four assets).
The Investments business continues to see significant opportunities for future investment in its core geographic markets in the UK
and North America, across its existing market sectors and as it continues to grow into new adjacent sectors. The business
continues to monitor both the US and UK PPP markets for opportunities, especially following the recent announcements regarding
PF2 in the UK and by the new administration in the US.
Directors’ valuationThe Directors’ valuation was broadly maintained at £1,220 million (2015: £1,244 million) despite material disposals in the period, as
the number of projects in the portfolio decreased from 73 to 69. Two of these projects, Houston Baptist University in Texas and
West Florida University, were won in previous years and have now been included in the project count at December 2015.
The Group continued to make substantial investments, with £65 million invested in new and existing projects. This reflected
continued success in targeted sectors with four new projects included in the Directors’ valuation for the first time.
The business continued its strategy of realising value through recycling equity from mature, operationally proven assets, whilst
preserving interests in strategic projects that offer opportunities to the wider Group. 16 investments were sold or part sold during
the year, including the Group’s interest in the fund managed by Balfour Beatty Infrastructure Partners (BBIP). In total these sales
generated £189 million in proceeds. All sales were transacted either at, or above, the Directors’ valuation. Cash yield from
distributions amounted to £64 million (2015: £82 million). The portfolio again generated cash flow to the Group net of investment.
The methodology used for the Directors’ valuation is unchanged, producing a valuation that more closely reflects market value and
which therefore changes with movements in the market. Cash flows for each project are forecast based on historical and present
performance, future risks and macroeconomic forecasts and which factor in current market assumptions. These cash flows are then
discounted using different discount rates based on the risk and maturity of individual projects and reflecting secondary market
transaction experience. As in previous years, the Directors’ valuation may differ significantly from the accounting book value of
investments shown in the financial statements, which are produced in accordance with International Financial Reporting Standards
rather than using a discounted cash flow approach.
2015Equity
investedDistributions
receivedDisposalproceeds
Unwind ofdiscount
Newproject
winsGain on
sales
Operationalperformance
(inc. FXmovements) 2016
UK 840 57 (40) (189) 59 - 7 (27) 707
North America 404 8 (24) - 31 6 - 88 513
Total 1,244 65 (64) (189) 90 6 7 61 1,220
UK portfolio
In 2016 £57 million of equity investment was made in projects across the portfolio: in the student accommodation project at
Aberystwyth University; the Ayrshire & Arran community hospital; the regeneration development at Eastwick & Sweetwater; and
waste projects at Gloucester and Welland. One new project, a property development at New Cross in Manchester, has been added
to the UK portfolio.
Demand for high-quality infrastructure investments in the secondary market remained strong and the Group took advantage of this
through further sales of mature assets. Investor appetite for yield in the ongoing, low interest rate environment continues unabated
and pricing in the secondary market is therefore expected to remain strong for the foreseeable future.
Interests in 16 assets were sold in the period, seven of which were partial sales, generating total book gains on disposal of £65
million (2015: £95 million from four assets). The business sold its entire 50% interest in the Wollongong project in Australia, a 30%
interest in the M1/A1 project (where the Group retains a 20% interest), a 40% interest in the Humber Gateway OFTO (where the
Group retains a 20% interest), its entire interest in the BSF portfolio comprised of seven schools projects and an 80% interest in
five street lighting projects (where the Group retains a 20% interest). The Group’s interest in Balfour Beatty Infrastructure Partners
(BBIP), which was included in the Directors’ valuation but not as a line item in the project total, was sold during the year. All
disposals were either at, or above, the Directors’ valuation.
Operational performance movements resulted in a £27 million reduction in value. The most significant components of this were
lower inflation, lower forecast deposit interest rates, and an increase in the assumed tax burden for potential purchasers. The
operational movement reflects lower inflation in 2016 followed by a step-up in 2017 before reaching a 3% long-term assumption in
2018. The change to interest rates incorporates a lowering of the long-term rate to 2% as a consequence of the Bank of England’s
0.25% reduction in base rates in the second half of 2016. In line with government announcements in the year the corporation tax
rate has been further reduced from a long-term rate of 18% to 17% from April 2020.
Discount rates applied to the UK portfolio range between 7% and 14% depending on project risk and maturity. The implied
weighted average discount rate for the UK portfolio is 8.3% (2015: 8.3%). The impact of selling mature assets has been offset by a
number of investments moving from construction to operations phase. A 1% change in discount rate would change the value of the
UK portfolio by approximately £80 million.
Consistent with other infrastructure funds, Balfour Beatty’s experience is that there is limited correlation between the discount rates
used to value PPP (and similar infrastructure investments) and long-term interest rates. In the event that interest rates increased in
response to rising inflation, the impact of any increase in discount rates would be mitigated by the positive correlation between the
value of the UK portfolio and changes in inflation.
Following on from the OECD BEPS project’s recommendations on the tax deductibility of interest expense in 2015, HM Treasury
and HM Revenue and Customs issued their consultation on policy design and implementation in May 2016 and published detailed
draft legislation in early 2017. The draft legislation preserves the concept of the public infrastructure exemption put forward by the
OECD and also includes other helpful measures to protect such projects. The proposals and their application are complex and
remain subject to further review, but the initial assessment is that the impact on the Directors’ valuation will not be material. Balfour
Beatty will remain engaged with the UK Government to clarify and evaluate the impact of the draft legislation.
North American portfolioIn 2016, the business won three projects, two investments in residential housing developments at Mobile in Alabama and Atlanta in
Georgia and a PPP data centre in Borden, Canada. In addition, a second phase of the project at University of Texas, Dallas has
been included in the Directors’ valuation.
Operational performance movements resulted in an £88 million increase in the value of the portfolio, of which £85 million was due
to the fall in the value of sterling.
Discount rates applied to the North American portfolio range between 7.5% and 10%. The implied weighted average discount rate
is 8.2% (2015: 8.2%) and a 1% change in the discount would change the value of the North American portfolio by approximately
£72 million.
OTHER FINANCIAL ITEMS
Non-underlying itemsThe Board believes non-underlying items should be separately identified on the face of the income statement to assist in
understanding the underlying financial performance achieved by the Group.
Non-underlying items from continuing operations before tax of £52 million were charged to the income statement in 2016. Items
included £25 million of costs related to the reassessment of potential liabilities on historical health and safety breaches, following
new sentencing guidelines, and £14 million of restructuring costs incurred relating to the Group’s Build to Last transformation
programme which was launched in early 2015.
In 2016, the Group also commissioned a revised independent actuarial report on its historical exposure to industrial disease related
liabilities. As a result, the Group has increased its provision with a £14 million charge to the income statement in the year. Other
non-underlying items included amortisation of acquired intangible assets of £9 million, the profits from Rail Germany of £1 million,
and losses resulting from legacy ES contracts of £6 million. The non-underlying charges recognised in 2016 were partially offset by
a £9 million gain following the release of all remaining provisions relating to Trans4m Ltd (Trans4m). Trans4m went into creditors’
voluntary liquidation on 27 June 2016.
TaxationThe Group’s underlying profit before tax from continuing operations for subsidiaries of £5 million (2015: £170 million loss) resulted
in an underlying tax charge of £12 million (2015: £11 million). The tax charge principally arises due to significant non-recognition of
deferred tax assets on losses incurred in the year. In addition tax is levied at the subsidiary level for US and Canada joint ventures
and associates, rather than within the share of joint ventures and associates.
Discontinued operationsIn 2016, Balfour Beatty reached a settlement with the purchaser of Parsons Brinckerhoff (PB), the Group’s former professional
services business disposed in October 2014, in relation to outstanding tax matters and indemnities. The Group received an
additional £9 million as a result of the settlement. Provisions in relation to these matters have been released, resulting in an overall
non-underlying gain to the Group of £24 million.
PensionsThe Group’s balance sheet includes aggregate deficits of £231 million (2015: £146 million) for pension schemes. The increase in
pension deficit in the year is largely due to a reduction in long-term interest rates and a contraction in credit spreads. Although the
scheme obligations increased, the hedging programmes put in place offset a significant element of this change with an increase in
scheme assets.
A formal triennial funding valuation of the Balfour Beatty Pension Fund (BBPF) was carried out as at 31 March 2016. The Company
and the trustees agreed the key commercial principles of the plan for the BBPF to reach self-sufficiency during 2027 (some three
years earlier than previously planned). Balfour Beatty will make cash contributions totalling £182 million over the next eight years;
under the previous agreement cash contributions totalled £376 million over the same period. These payments include contributions
related to the Scottish Limited Partnership (SLP) structure established in 2015. The Company will also transfer additional assets
into the SLP worth up to £87 million by 2019. The Company has agreed to amend the existing dividend sharing mechanism such
that if the dividend cover ratio falls below 3x in 2016, 2.5x in 2017 or 2x from 2018 onwards, funding to the BBPF will be
accelerated.
The Group also completed the formal triennial funding valuation for the Railways Pension Scheme carried out as at 31 December
2013. As a result, the Group agreed to make ongoing fixed deficit contributions of £6 million per annum which should reduce the
deficit to zero by 2031. The triennial funding valuation as at 31 December 2016 is now underway.
GoodwillThe goodwill on the Group’s balance sheet at 31 December 2016 increased to £937 million (2015: £844 million), primarily relating
to movements in foreign exchange rates. Impairment reviews have been carried out, and none of the carrying values have been
impaired.
In light of the significant, albeit reduced, losses incurred within the UK construction business in 2016 the Group has considered
whether a reasonable possible change in assumptions would lead to an impairment of the goodwill in the related cash-generating
units and concluded that it is not the case. The stabilisation and recovery of the Group’s UK construction business to more normal
levels of performance is, however, a key assumption underpinning the cash flow forecasts used to assess the recoverable amount
of the related goodwill.
Banking facilitiesBalfour Beatty’s committed banking facility totals £400 million. The purpose of this syndicated revolving credit facility is to provide
liquidity from a set of core relationship banks to support ongoing activities. The Company completed its refinancing in December
2015 with the facility extending through to 2018. In November 2016, £375 million of the facility was extended until December 2019.
A further one-year extension, through to 2020, is available, subject to bank approval. At 31 December 2016, £350 million of this
facility was undrawn.
Financial risk factors and going concernThe key financial risk factors for the Group remain largely unchanged. Some elements of the Group’s markets are recovering, and
this can lead to increased risk of subcontractor failures, due to their cash requirements for increased working capital, and also the
potential for inflationary pressures in some areas. On the other hand, this should also reduce pressure on bidding margins.
The Group’s US private placement and committed bank facilities contain certain financial covenants, such as the ratio of the
Group’s EBITDA to its net debt which needs to be less than 3.0 and the ratio of its EBITA to net borrowing costs which needs to be
in excess of 3.0. These covenants are tested on a rolling 12-month basis as at the June and December reporting dates. At 31
December 2016, both these covenants were passed as the Group had net cash and net interest income from a covenant test
perspective.
The Group is forecasting to remain within its banking covenants during 2017. While recognising that there can be no absolute
certainty, the Directors believe that these covenant tests will be met.
The Directors have acknowledged the guidance ‘Going Concern and Liquidity Risk: Guidance for Directors of UK Companies 2009’
published by the Financial Reporting Council in October 2009. In reviewing the future prospects of the Group, the following factors
are relevant:
· the Group has a strong order backlog;
· there continues to be underlying demand in infrastructure markets in the countries in which the Group operates;
· excluding the non-recourse net borrowings of PPP subsidiaries, the Group had net cash balances of £173 million at 31
December 2016; and
· the Group’s committed bank facility totals £400 million, of which £350 million was undrawn at 31 December 2016.
Based on the above, and having made appropriate enquiries and reviewed medium-term cash forecasts, the Directors consider it
reasonable to assume that the Group and the Company have adequate resources to continue for the foreseeable future and, for
this reason, have continued to adopt the going concern basis in preparing the financial statements.
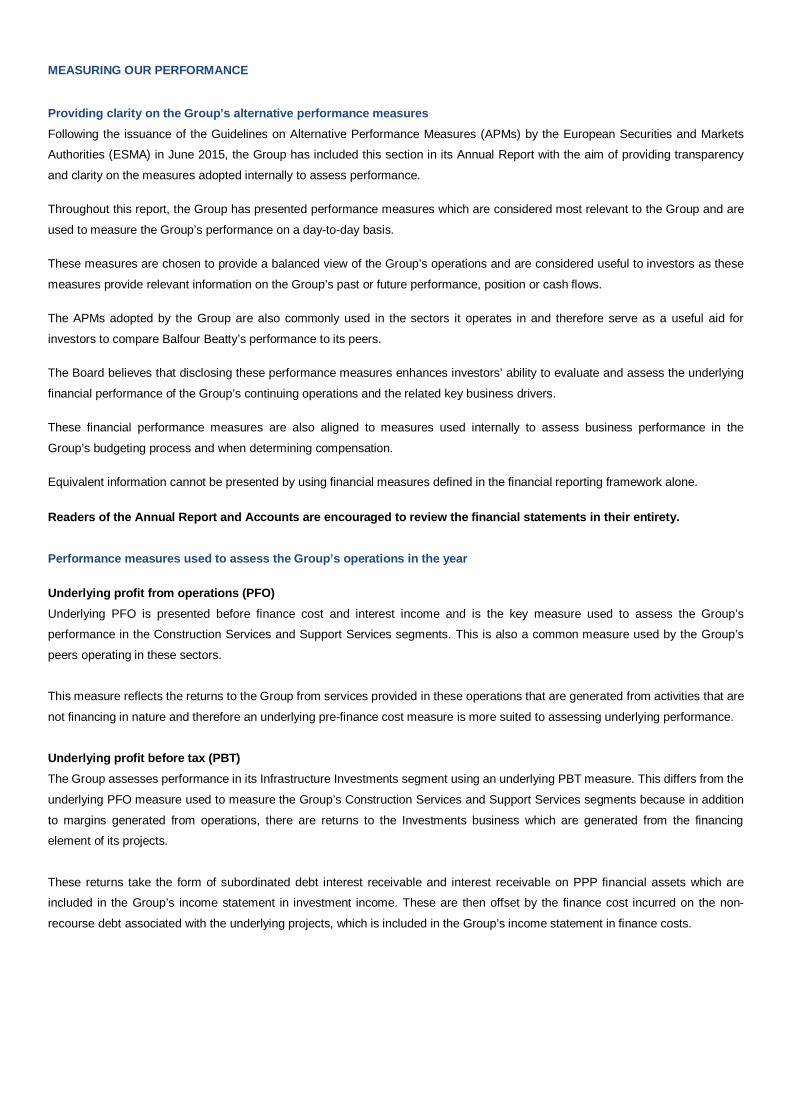
MEASURING OUR PERFORMANCE
Providing clarity on the Group’s alternative performance measuresFollowing the issuance of the Guidelines on Alternative Performance Measures (APMs) by the European Securities and Markets
Authorities (ESMA) in June 2015, the Group has included this section in its Annual Report with the aim of providing transparency
and clarity on the measures adopted internally to assess performance.
Throughout this report, the Group has presented performance measures which are considered most relevant to the Group and are
used to measure the Group’s performance on a day-to-day basis.
These measures are chosen to provide a balanced view of the Group’s operations and are considered useful to investors as these
measures provide relevant information on the Group’s past or future performance, position or cash flows.
The APMs adopted by the Group are also commonly used in the sectors it operates in and therefore serve as a useful aid for
investors to compare Balfour Beatty’s performance to its peers.
The Board believes that disclosing these performance measures enhances investors’ ability to evaluate and assess the underlying
financial performance of the Group’s continuing operations and the related key business drivers.
These financial performance measures are also aligned to measures used internally to assess business performance in the
Group’s budgeting process and when determining compensation.
Equivalent information cannot be presented by using financial measures defined in the financial reporting framework alone.
Readers of the Annual Report and Accounts are encouraged to review the financial statements in their entirety.
Performance measures used to assess the Group’s operations in the year
Underlying profit from operations (PFO)Underlying PFO is presented before finance cost and interest income and is the key measure used to assess the Group’s
performance in the Construction Services and Support Services segments. This is also a common measure used by the Group’s
peers operating in these sectors.
This measure reflects the returns to the Group from services provided in these operations that are generated from activities that are
not financing in nature and therefore an underlying pre-finance cost measure is more suited to assessing underlying performance.
Underlying profit before tax (PBT)The Group assesses performance in its Infrastructure Investments segment using an underlying PBT measure. This differs from the
underlying PFO measure used to measure the Group’s Construction Services and Support Services segments because in addition
to margins generated from operations, there are returns to the Investments business which are generated from the financing
element of its projects.
These returns take the form of subordinated debt interest receivable and interest receivable on PPP financial assets which are
included in the Group’s income statement in investment income. These are then offset by the finance cost incurred on the non-
recourse debt associated with the underlying projects, which is included in the Group’s income statement in finance costs.
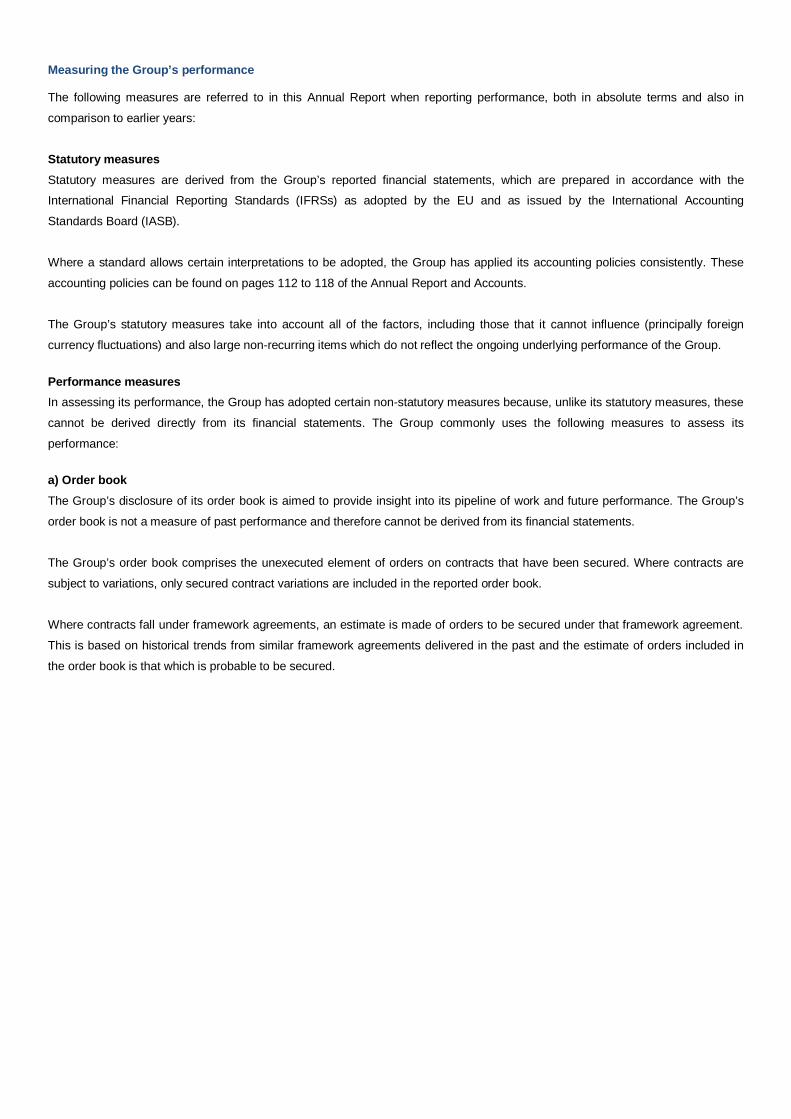
Measuring the Group’s performance
The following measures are referred to in this Annual Report when reporting performance, both in absolute terms and also in
comparison to earlier years:
Statutory measuresStatutory measures are derived from the Group’s reported financial statements, which are prepared in accordance with the
International Financial Reporting Standards (IFRSs) as adopted by the EU and as issued by the International Accounting
Standards Board (IASB).
Where a standard allows certain interpretations to be adopted, the Group has applied its accounting policies consistently. These
accounting policies can be found on pages 112 to 118 of the Annual Report and Accounts.
The Group’s statutory measures take into account all of the factors, including those that it cannot influence (principally foreign
currency fluctuations) and also large non-recurring items which do not reflect the ongoing underlying performance of the Group.
Performance measuresIn assessing its performance, the Group has adopted certain non-statutory measures because, unlike its statutory measures, these
cannot be derived directly from its financial statements. The Group commonly uses the following measures to assess its
performance:
a) Order bookThe Group’s disclosure of its order book is aimed to provide insight into its pipeline of work and future performance. The Group’s
order book is not a measure of past performance and therefore cannot be derived from its financial statements.
The Group’s order book comprises the unexecuted element of orders on contracts that have been secured. Where contracts are
subject to variations, only secured contract variations are included in the reported order book.
Where contracts fall under framework agreements, an estimate is made of orders to be secured under that framework agreement.
This is based on historical trends from similar framework agreements delivered in the past and the estimate of orders included in
the order book is that which is probable to be secured.

b) Underlying performanceThe Group adjusts for certain non-underlying items which the Board believes assists in understanding the performance achieved by
the Group. These items include:
− gains and losses on the disposal of businesses and investments, unless this is part of a programme of releasing value from the
disposal of similar businesses or investments such as infrastructure concessions
− costs of major restructuring and reorganisation of existing businesses
− acquisition and similar costs related to business combinations such as transaction costs
− impairment and amortisation charges on intangible assets arising on business combinations (amortisation of acquired intangible
assets). These are non-underlying costs as they do not relate to the underlying performance of the Group.
From time to time, it may be appropriate to disclose further items as non-underlying items in order to reflect the underlying
performance of the Group.
The results of Rail Germany and certain legacy ES contracts have been treated as non-underlying items as the Group is committed
to exiting these parts of the business.
Further details of these non-underlying items are provided in Note 8.
A reconciliation has been provided on the next page to show how the Group’s statutory results are adjusted to exclude significant
items that are non-recurring and their impact on its statutory financial information, both as a whole and in respect of specific line
items.
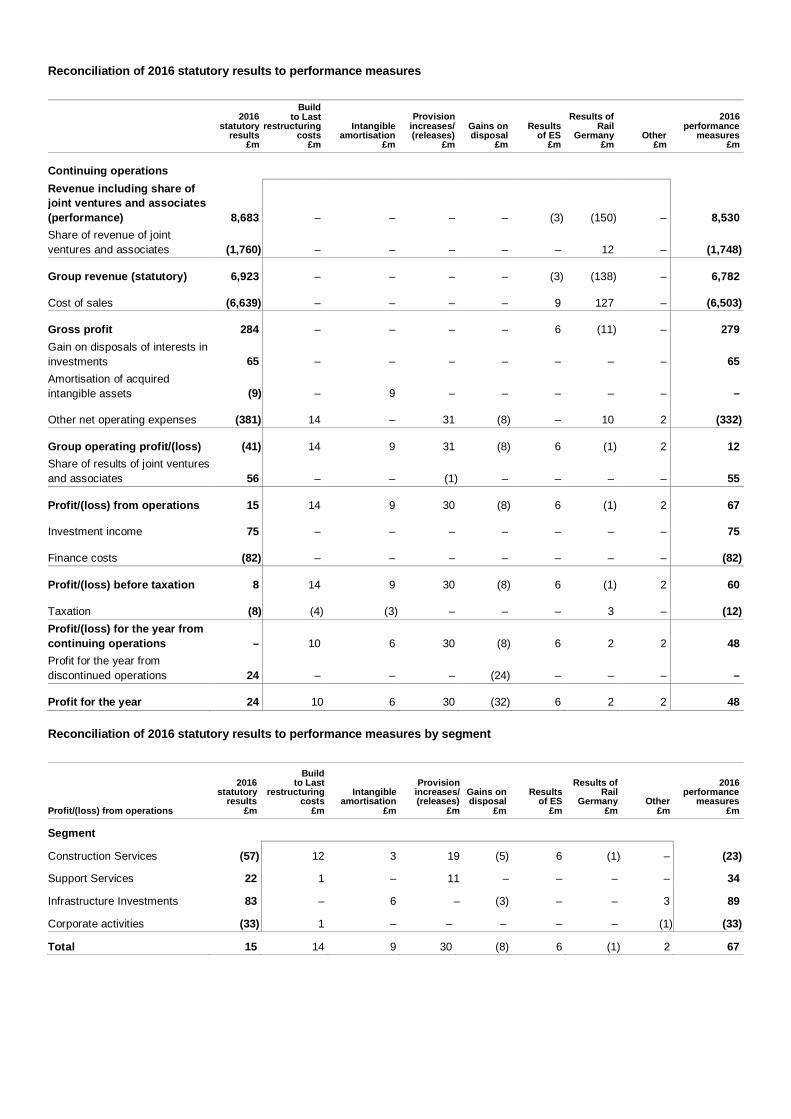
Reconciliation of 2016 statutory results to performance measures
2016statutory
results£m
Buildto Last
restructuringcosts
£m
Intangibleamortisation
£m
Provisionincreases/(releases)
£m
Gains ondisposal
£m
Resultsof ES
£m
Results ofRail
Germany£m
Other£m
2016performance
measures£m
Continuing operationsRevenue including share ofjoint ventures and associates(performance) 8,683 – – – – (3) (150) – 8,530Share of revenue of jointventures and associates (1,760) – – – – – 12 – (1,748)
Group revenue (statutory) 6,923 – – – – (3) (138) – 6,782
Cost of sales (6,639) – – – – 9 127 – (6,503)
Gross profit 284 – – – – 6 (11) – 279Gain on disposals of interests ininvestments 65 – – – – – – – 65Amortisation of acquiredintangible assets (9) – 9 – – – – – –
Other net operating expenses (381) 14 – 31 (8) – 10 2 (332)
Group operating profit/(loss) (41) 14 9 31 (8) 6 (1) 2 12Share of results of joint venturesand associates 56 – – (1) – – – – 55
Profit/(loss) from operations 15 14 9 30 (8) 6 (1) 2 67
Investment income 75 – – – – – – – 75
Finance costs (82) – – – – – – – (82)
Profit/(loss) before taxation 8 14 9 30 (8) 6 (1) 2 60
Taxation (8) (4) (3) – – – 3 – (12)Profit/(loss) for the year fromcontinuing operations – 10 6 30 (8) 6 2 2 48Profit for the year fromdiscontinued operations 24 – – – (24) – – – –
Profit for the year 24 10 6 30 (32) 6 2 2 48
Reconciliation of 2016 statutory results to performance measures by segment
Profit/(loss) from operations
2016statutory
results£m
Buildto Last
restructuringcosts
£m
Intangibleamortisation
£m
Provisionincreases/(releases)
£m
Gains ondisposal
£m
Resultsof ES
£m
Results ofRail
Germany£m
Other£m
2016performance
measures£m
Segment
Construction Services (57) 12 3 19 (5) 6 (1) – (23)
Support Services 22 1 – 11 – – – – 34
Infrastructure Investments 83 – 6 – (3) – – 3 89
Corporate activities (33) 1 – – – – – (1) (33)
Total 15 14 9 30 (8) 6 (1) 2 67
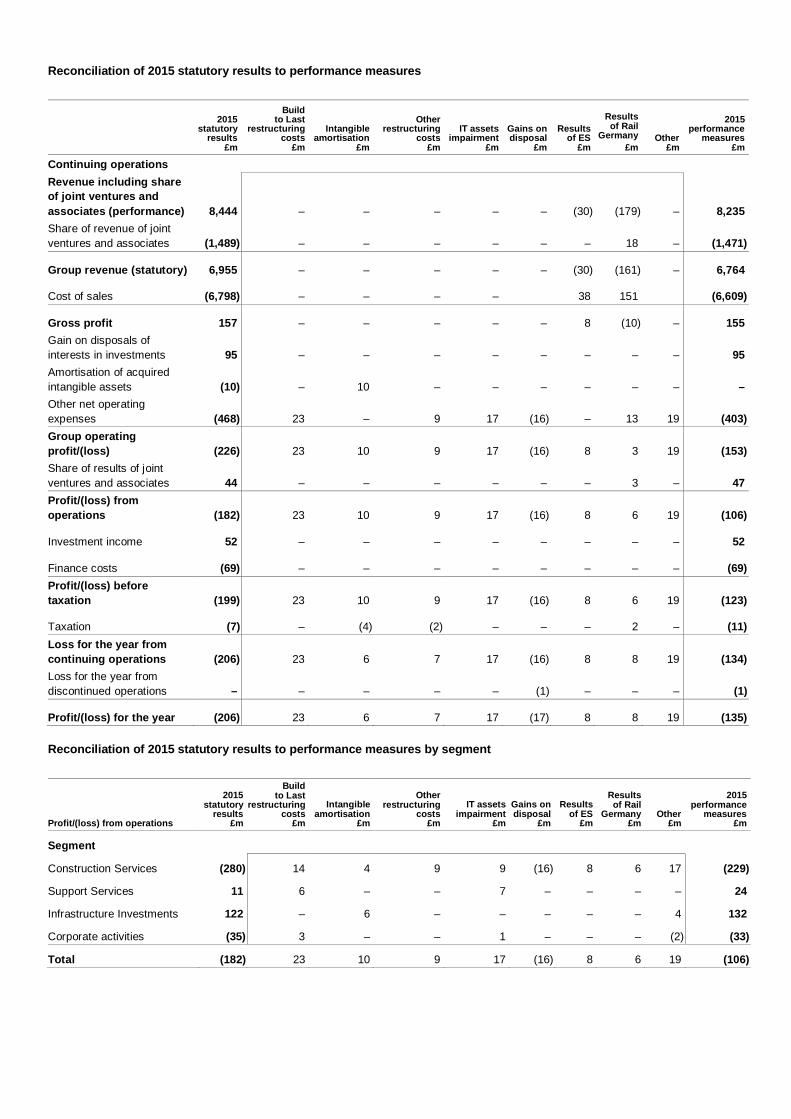
Reconciliation of 2015 statutory results to performance measures
2015statutory
results£m
Buildto Last
restructuringcosts
£m
Intangibleamortisation
£m
Otherrestructuring
costs£m
IT assetsimpairment
£m
Gains ondisposal
£m
Resultsof ES
£m
Resultsof Rail
Germany£m
Other£m
2015performance
measures£m
Continuing operationsRevenue including shareof joint ventures andassociates (performance) 8,444 – – – – – (30) (179) – 8,235Share of revenue of jointventures and associates (1,489) – – – – – – 18 – (1,471)
Group revenue (statutory) 6,955 – – – – – (30) (161) – 6,764
Cost of sales (6,798) – – – – 38 151 (6,609)
Gross profit 157 – – – – – 8 (10) – 155Gain on disposals ofinterests in investments 95 – – – – – – – – 95Amortisation of acquiredintangible assets (10) – 10 – – – – – – –Other net operatingexpenses (468) 23 – 9 17 (16) – 13 19 (403)Group operatingprofit/(loss) (226) 23 10 9 17 (16) 8 3 19 (153)Share of results of jointventures and associates 44 – – – – – – 3 – 47Profit/(loss) fromoperations (182) 23 10 9 17 (16) 8 6 19 (106)
Investment income 52 – – – – – – – – 52
Finance costs (69) – – – – – – – – (69)Profit/(loss) beforetaxation (199) 23 10 9 17 (16) 8 6 19 (123)
Taxation (7) – (4) (2) – – – 2 – (11)Loss for the year fromcontinuing operations (206) 23 6 7 17 (16) 8 8 19 (134)Loss for the year fromdiscontinued operations – – – – – (1) – – – (1)
Profit/(loss) for the year (206) 23 6 7 17 (17) 8 8 19 (135)
Reconciliation of 2015 statutory results to performance measures by segment
Profit/(loss) from operations
2015statutory
results£m
Buildto Last
restructuringcosts
£m
Intangibleamortisation
£m
Otherrestructuring
costs£m
IT assetsimpairment
£m
Gains ondisposal
£m
Resultsof ES
£m
Resultsof Rail
Germany£m
Other£m
2015performance
measures£m
Segment
Construction Services (280) 14 4 9 9 (16) 8 6 17 (229)
Support Services 11 6 – – 7 – – – – 24
Infrastructure Investments 122 – 6 – – – – – 4 132
Corporate activities (35) 3 – – 1 – – – (2) (33)
Total (182) 23 10 9 17 (16) 8 6 19 (106)
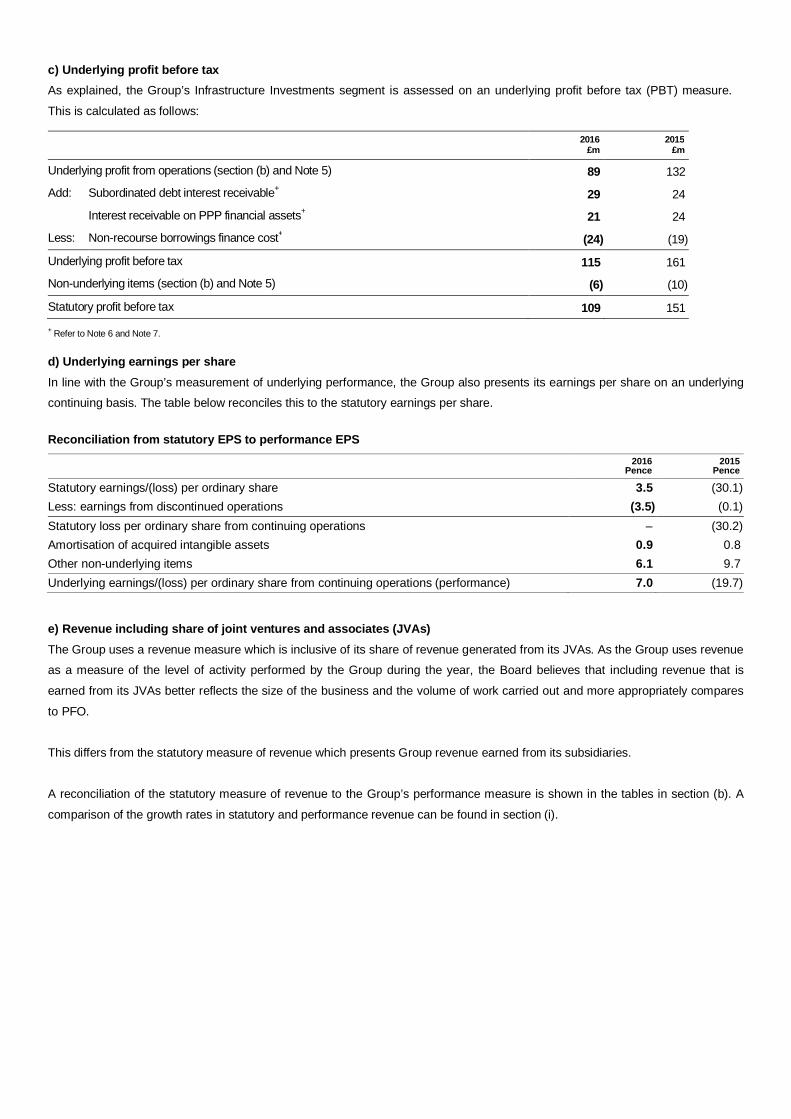
c) Underlying profit before taxAs explained, the Group’s Infrastructure Investments segment is assessed on an underlying profit before tax (PBT) measure.
This is calculated as follows:
2016£m
2015£m
Underlying profit from operations (section (b) and Note 5) 89 132
Add: Subordinated debt interest receivable+ 29 24
Interest receivable on PPP financial assets+ 21 24
Less: Non-recourse borrowings finance cost+ (24) (19)
Underlying profit before tax 115 161
Non-underlying items (section (b) and Note 5) (6) (10)
Statutory profit before tax 109 151+ Refer to Note 6 and Note 7.
d) Underlying earnings per shareIn line with the Group’s measurement of underlying performance, the Group also presents its earnings per share on an underlying
continuing basis. The table below reconciles this to the statutory earnings per share.
Reconciliation from statutory EPS to performance EPS2016
Pence2015
Pence
Statutory earnings/(loss) per ordinary share 3.5 (30.1)Less: earnings from discontinued operations (3.5) (0.1)Statutory loss per ordinary share from continuing operations – (30.2)Amortisation of acquired intangible assets 0.9 0.8Other non-underlying items 6.1 9.7Underlying earnings/(loss) per ordinary share from continuing operations (performance) 7.0 (19.7)
e) Revenue including share of joint ventures and associates (JVAs)The Group uses a revenue measure which is inclusive of its share of revenue generated from its JVAs. As the Group uses revenue
as a measure of the level of activity performed by the Group during the year, the Board believes that including revenue that is
earned from its JVAs better reflects the size of the business and the volume of work carried out and more appropriately compares
to PFO.
This differs from the statutory measure of revenue which presents Group revenue earned from its subsidiaries.
A reconciliation of the statutory measure of revenue to the Group’s performance measure is shown in the tables in section (b). A
comparison of the growth rates in statutory and performance revenue can be found in section (i).
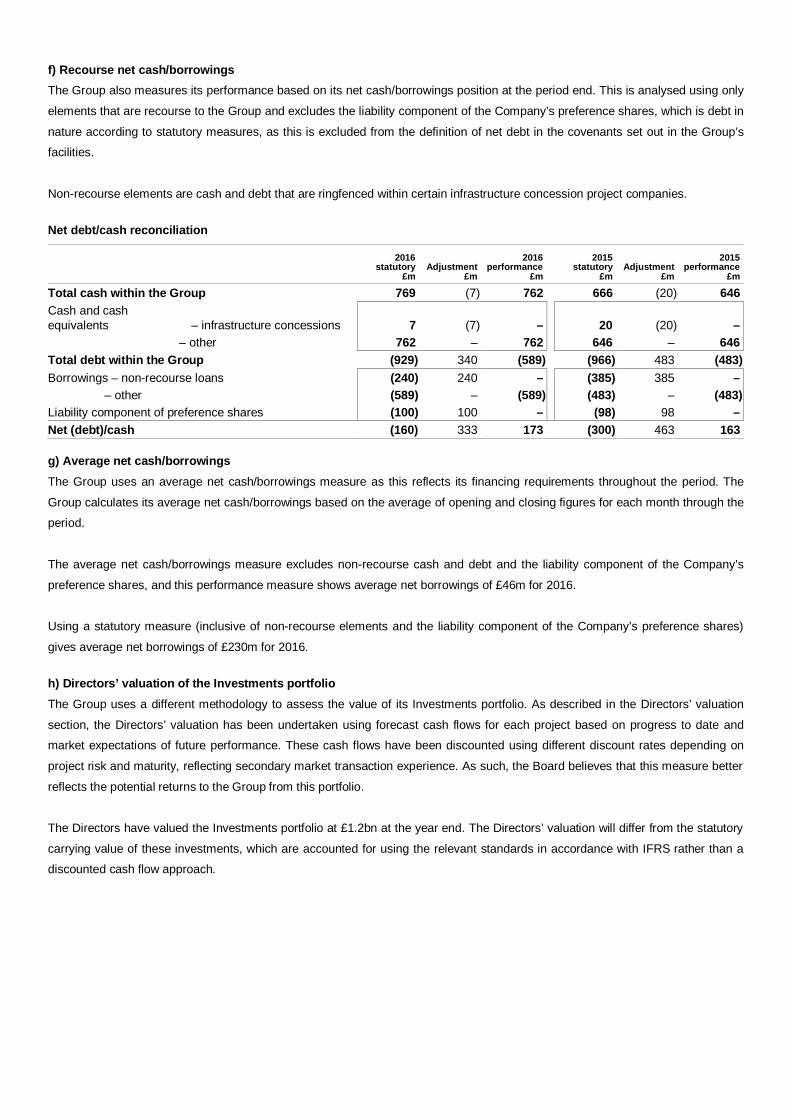
f) Recourse net cash/borrowingsThe Group also measures its performance based on its net cash/borrowings position at the period end. This is analysed using only
elements that are recourse to the Group and excludes the liability component of the Company’s preference shares, which is debt in
nature according to statutory measures, as this is excluded from the definition of net debt in the covenants set out in the Group’s
facilities.
Non-recourse elements are cash and debt that are ringfenced within certain infrastructure concession project companies.
Net debt/cash reconciliation
2016statutory
£mAdjustment
£m
2016performance
£m
2015statutory
£mAdjustment
£m
2015performance
£m
Total cash within the Group 769 (7) 762 666 (20) 646Cash and cashequivalents – infrastructure concessions 7 (7) – 20 (20) –
– other 762 – 762 646 – 646Total debt within the Group (929) 340 (589) (966) 483 (483)Borrowings – non-recourse loans (240) 240 – (385) 385 –
– other (589) – (589) (483) – (483)Liability component of preference shares (100) 100 – (98) 98 –Net (debt)/cash (160) 333 173 (300) 463 163
g) Average net cash/borrowingsThe Group uses an average net cash/borrowings measure as this reflects its financing requirements throughout the period. The
Group calculates its average net cash/borrowings based on the average of opening and closing figures for each month through the
period.
The average net cash/borrowings measure excludes non-recourse cash and debt and the liability component of the Company’s
preference shares, and this performance measure shows average net borrowings of £46m for 2016.
Using a statutory measure (inclusive of non-recourse elements and the liability component of the Company’s preference shares)
gives average net borrowings of £230m for 2016.
h) Directors’ valuation of the Investments portfolioThe Group uses a different methodology to assess the value of its Investments portfolio. As described in the Directors’ valuation
section, the Directors’ valuation has been undertaken using forecast cash flows for each project based on progress to date and
market expectations of future performance. These cash flows have been discounted using different discount rates depending on
project risk and maturity, reflecting secondary market transaction experience. As such, the Board believes that this measure better
reflects the potential returns to the Group from this portfolio.
The Directors have valued the Investments portfolio at £1.2bn at the year end. The Directors’ valuation will differ from the statutory
carrying value of these investments, which are accounted for using the relevant standards in accordance with IFRS rather than a
discounted cash flow approach.
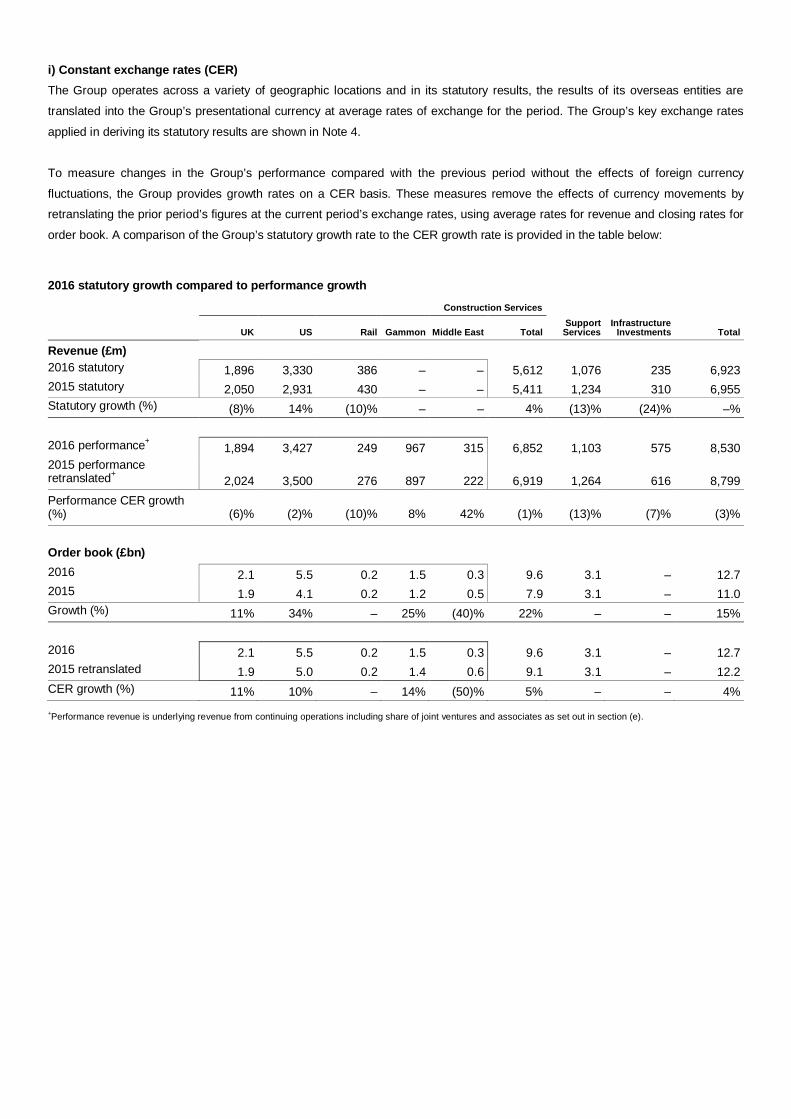
i) Constant exchange rates (CER)The Group operates across a variety of geographic locations and in its statutory results, the results of its overseas entities are
translated into the Group’s presentational currency at average rates of exchange for the period. The Group’s key exchange rates
applied in deriving its statutory results are shown in Note 4.
To measure changes in the Group’s performance compared with the previous period without the effects of foreign currency
fluctuations, the Group provides growth rates on a CER basis. These measures remove the effects of currency movements by
retranslating the prior period’s figures at the current period’s exchange rates, using average rates for revenue and closing rates for
order book. A comparison of the Group’s statutory growth rate to the CER growth rate is provided in the table below:
2016 statutory growth compared to performance growth
Construction Services
UK US Rail Gammon Middle East TotalSupportServices
InfrastructureInvestments Total
Revenue (£m)2016 statutory 1,896 3,330 386 – – 5,612 1,076 235 6,9232015 statutory 2,050 2,931 430 – – 5,411 1,234 310 6,955Statutory growth (%) (8)% 14% (10)% – – 4% (13)% (24)% –%
2016 performance+1,894 3,427 249 967 315 6,852 1,103 575 8,530
2015 performanceretranslated+
2,024 3,500 276 897 222 6,919 1,264 616 8,799Performance CER growth(%) (6)% (2)% (10)% 8% 42% (1)% (13)% (7)% (3)%
Order book (£bn)2016 2.1 5.5 0.2 1.5 0.3 9.6 3.1 – 12.72015 1.9 4.1 0.2 1.2 0.5 7.9 3.1 – 11.0Growth (%) 11% 34% – 25% (40)% 22% – – 15%
2016 2.1 5.5 0.2 1.5 0.3 9.6 3.1 – 12.72015 retranslated 1.9 5.0 0.2 1.4 0.6 9.1 3.1 – 12.2CER growth (%) 11% 10% – 14% (50)% 5% – – 4%+Performance revenue is underlying revenue from continuing operations including share of joint ventures and associates as set out in section (e).
Forward-looking statementsThis announcement may include certain forward-looking statements, beliefs or opinions, including statements with respect to
Balfour Beatty plc’s business, financial condition and results of operations. These forward-looking statements can be identified by
the use of forward-looking terminology, including the terms "believes", "estimates", "plans", "anticipates", "targets", "aims",
"continues", "expects", "intends", "hopes", "may", "will", "would", "could" or "should" or, in each case, their negative or other various
or comparable terminology. These statements are made by the Balfour Beatty plc Directors in good faith based on the information
available to them at the date of this announcement and reflect the Balfour Beatty plc Directors’ beliefs and expectations. By their
nature these statements involve risk and uncertainty because they relate to events and depend on circumstances that may or may
not occur in the future. A number of factors could cause actual results and developments to differ materially from those expressed
or implied by the forward-looking statements, including, without limitation, developments in the global economy, changes in UK and
US government policies, spending and procurement methodologies, and failure in Balfour Beatty's health, safety or environmental
policies.
No representation or warranty is made that any of these statements or forecasts will come to pass or that any forecast results will
be achieved. Forward-looking statements speak only as at the date of this announcement and Balfour Beatty plc and its advisers
expressly disclaim any obligations or undertaking to release any update of, or revisions to, any forward-looking statements in this
announcement. No statement in the announcement is intended to be, or intended to be construed as, a profit forecast or profit
estimate or to be interpreted to mean that earnings per Balfour Beatty plc share for the current or future financial years will
necessarily match or exceed the historical earnings per Balfour Beatty plc share. As a result, you are cautioned not to place any
undue reliance on such forward-looking statements.
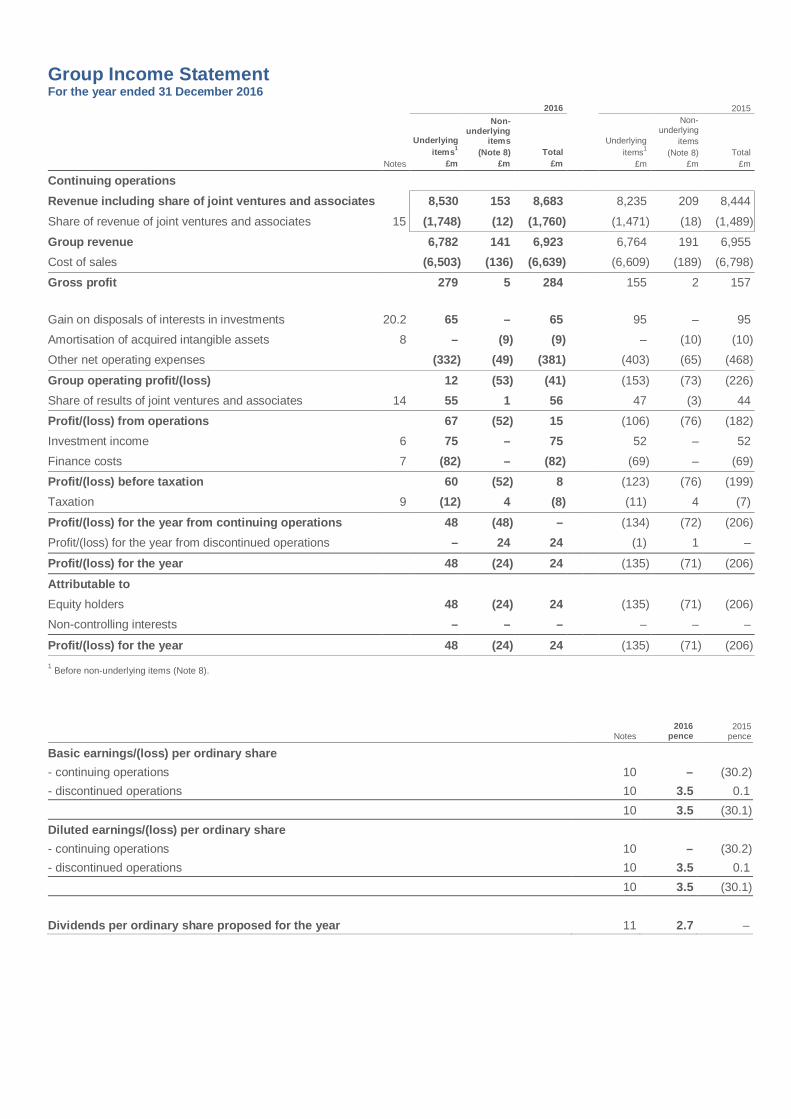
Group Income StatementFor the year ended 31 December 2016
2016 2015
Notes
Underlyingitems1
£m
Non-underlying
items(Note 8)
£mTotal
£m
Underlying items1
£m
Non-underlying
items(Note 8)
£mTotal
£m
Continuing operationsRevenue including share of joint ventures and associates 8,530 153 8,683 8,235 209 8,444
Share of revenue of joint ventures and associates 15 (1,748) (12) (1,760) (1,471) (18) (1,489)
Group revenue 6,782 141 6,923 6,764 191 6,955Cost of sales (6,503) (136) (6,639) (6,609) (189) (6,798)
Gross profit 279 5 284 155 2 157
Gain on disposals of interests in investments 20.2 65 – 65 95 – 95Amortisation of acquired intangible assets 8 – (9) (9) – (10) (10)Other net operating expenses (332) (49) (381) (403) (65) (468)
Group operating profit/(loss) 12 (53) (41) (153) (73) (226)Share of results of joint ventures and associates 14 55 1 56 47 (3) 44
Profit/(loss) from operations 67 (52) 15 (106) (76) (182)Investment income 6 75 – 75 52 – 52Finance costs 7 (82) – (82) (69) – (69)
Profit/(loss) before taxation 60 (52) 8 (123) (76) (199)Taxation 9 (12) 4 (8) (11) 4 (7)
Profit/(loss) for the year from continuing operations 48 (48) – (134) (72) (206)Profit/(loss) for the year from discontinued operations – 24 24 (1) 1 –
Profit/(loss) for the year 48 (24) 24 (135) (71) (206)
Attributable toEquity holders 48 (24) 24 (135) (71) (206)Non-controlling interests – – – – – –
Profit/(loss) for the year 48 (24) 24 (135) (71) (206)1 Before non-underlying items (Note 8).
Notes2016
pence2015
pence
Basic earnings/(loss) per ordinary share- continuing operations 10 – (30.2)- discontinued operations 10 3.5 0.1
10 3.5 (30.1)Diluted earnings/(loss) per ordinary share- continuing operations 10 – (30.2)- discontinued operations 10 3.5 0.1
10 3.5 (30.1)
Dividends per ordinary share proposed for the year 11 2.7 –
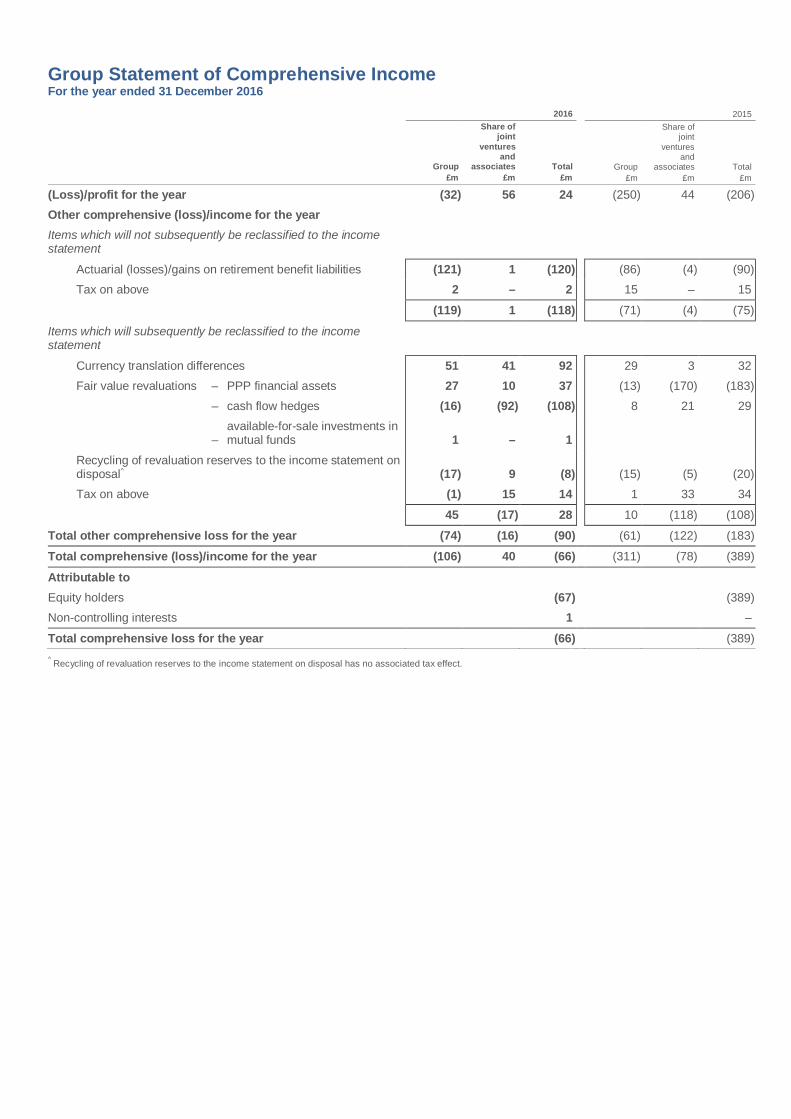
Group Statement of Comprehensive IncomeFor the year ended 31 December 2016
2016 2015
Group£m
Share ofjoint
venturesand
associates£m
Total£m
Group£m
Share ofjoint
ventures and
associates£m
Total£m
(Loss)/profit for the year (32) 56 24 (250) 44 (206)Other comprehensive (loss)/income for the yearItems which will not subsequently be reclassified to the incomestatement
Actuarial (losses)/gains on retirement benefit liabilities (121) 1 (120) (86) (4) (90)Tax on above 2 – 2 15 – 15
(119) 1 (118) (71) (4) (75)
Items which will subsequently be reclassified to the incomestatement
Currency translation differences 51 41 92 29 3 32Fair value revaluations – PPP financial assets 27 10 37 (13) (170) (183)
– cash flow hedges (16) (92) (108) 8 21 29
–available-for-sale investments inmutual funds 1 – 1
Recycling of revaluation reserves to the income statement ondisposal^ (17) 9 (8) (15) (5) (20)Tax on above (1) 15 14 1 33 34
45 (17) 28 10 (118) (108)
Total other comprehensive loss for the year (74) (16) (90) (61) (122) (183)
Total comprehensive (loss)/income for the year (106) 40 (66) (311) (78) (389)
Attributable toEquity holders (67) (389)Non-controlling interests 1 –
Total comprehensive loss for the year (66) (389)^ Recycling of revaluation reserves to the income statement on disposal has no associated tax effect.
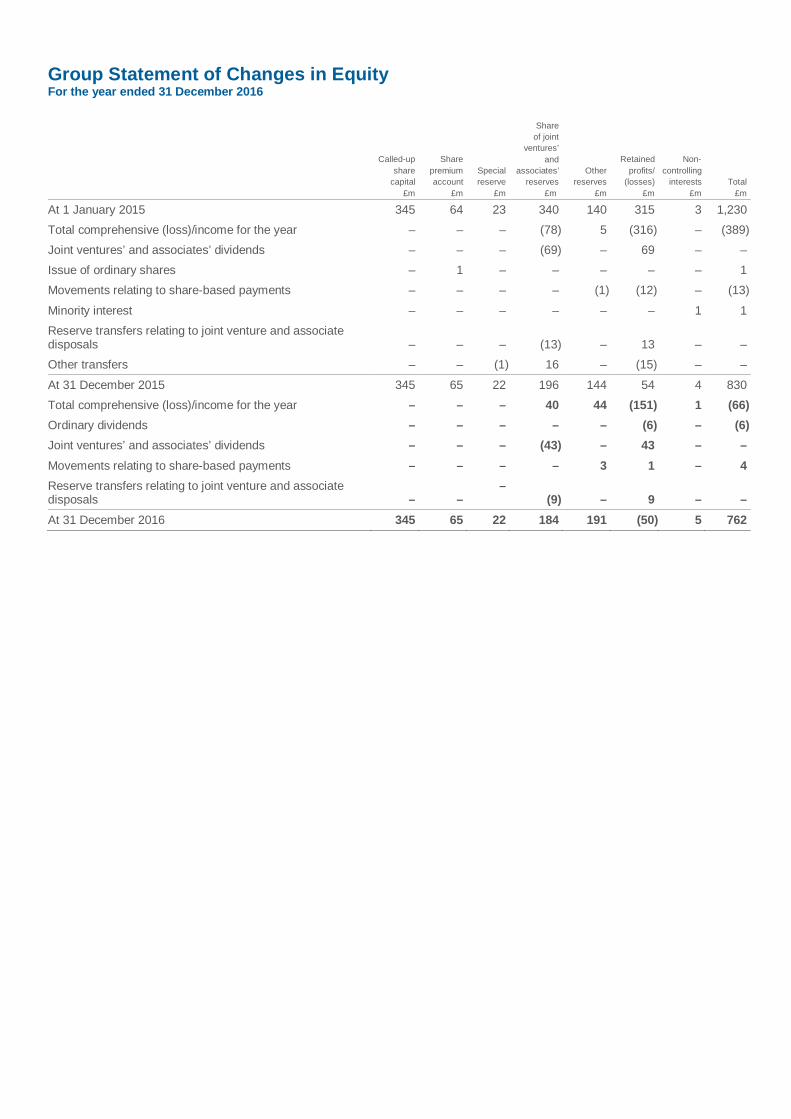
Group Statement of Changes in EquityFor the year ended 31 December 2016
Called-upshare
capital£m
Sharepremiumaccount
£m
Specialreserve
£m
Shareof joint
ventures’and
associates’reserves
£m
Otherreserves
£m
Retainedprofits/
(losses)£m
Non-controlling
interests£m
Total£m
At 1 January 2015 345 64 23 340 140 315 3 1,230Total comprehensive (loss)/income for the year – – – (78) 5 (316) – (389)Joint ventures’ and associates’ dividends – – – (69) – 69 – –Issue of ordinary shares – 1 – – – – – 1Movements relating to share-based payments – – – – (1) (12) – (13)
Minority interest – – – – – – 1 1Reserve transfers relating to joint venture and associatedisposals – – – (13) – 13 – –Other transfers – – (1) 16 – (15) – –
At 31 December 2015 345 65 22 196 144 54 4 830Total comprehensive (loss)/income for the year – – – 40 44 (151) 1 (66)Ordinary dividends – – – – – (6) – (6)Joint ventures’ and associates’ dividends – – – (43) – 43 – –Movements relating to share-based payments – – – – 3 1 – 4Reserve transfers relating to joint venture and associatedisposals – –
–(9) – 9 – –
At 31 December 2016 345 65 22 184 191 (50) 5 762
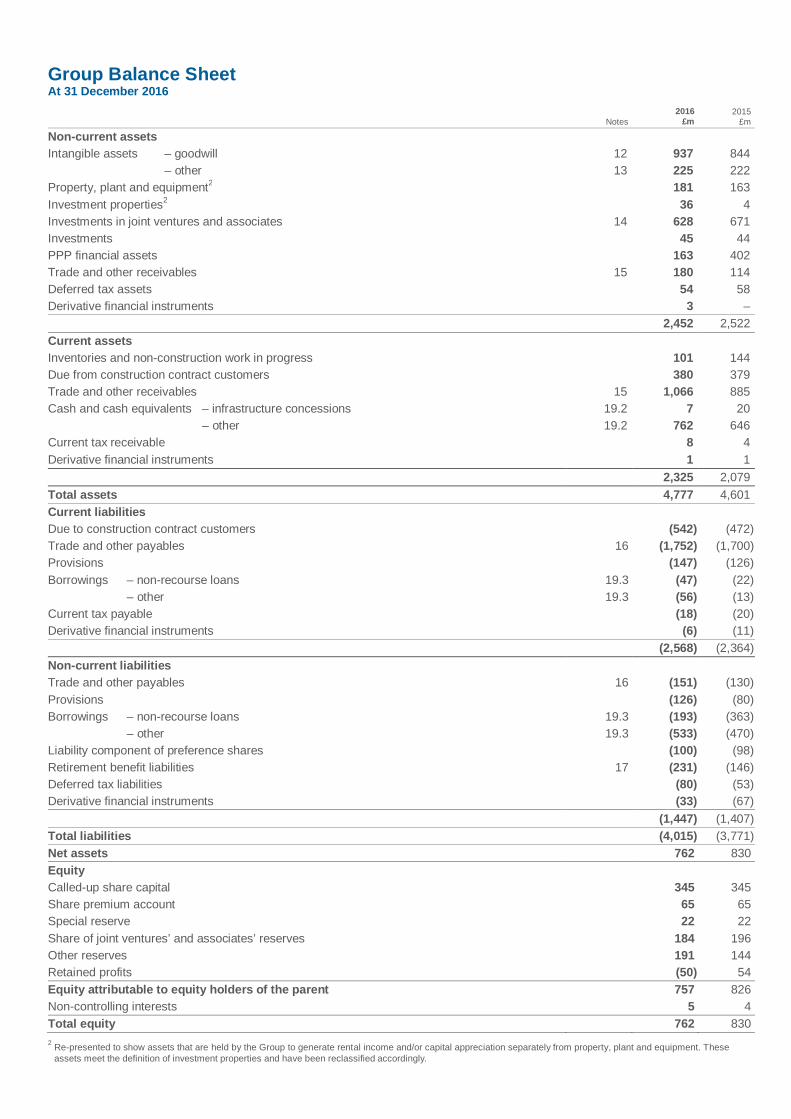
Group Balance SheetAt 31 December 2016
Notes2016
£m2015
£m
Non-current assetsIntangible assets – goodwill 12 937 844
– other 13 225 222Property, plant and equipment2 181 163Investment properties2 36 4Investments in joint ventures and associates 14 628 671Investments 45 44PPP financial assets 163 402Trade and other receivables 15 180 114Deferred tax assets 54 58Derivative financial instruments 3 –
2,452 2,522Current assetsInventories and non-construction work in progress 101 144Due from construction contract customers 380 379Trade and other receivables 15 1,066 885Cash and cash equivalents – infrastructure concessions 19.2 7 20
– other 19.2 762 646Current tax receivable 8 4Derivative financial instruments 1 1
2,325 2,079Total assets 4,777 4,601Current liabilitiesDue to construction contract customers (542) (472)Trade and other payables 16 (1,752) (1,700)Provisions (147) (126)Borrowings – non-recourse loans 19.3 (47) (22)
– other 19.3 (56) (13)Current tax payable (18) (20)Derivative financial instruments (6) (11)
(2,568) (2,364)Non-current liabilitiesTrade and other payables 16 (151) (130)Provisions (126) (80)Borrowings – non-recourse loans 19.3 (193) (363)
– other 19.3 (533) (470)Liability component of preference shares (100) (98)Retirement benefit liabilities 17 (231) (146)Deferred tax liabilities (80) (53)Derivative financial instruments (33) (67)
(1,447) (1,407)Total liabilities (4,015) (3,771)Net assets 762 830EquityCalled-up share capital 345 345Share premium account 65 65Special reserve 22 22Share of joint ventures’ and associates’ reserves 184 196Other reserves 191 144Retained profits (50) 54Equity attributable to equity holders of the parent 757 826Non-controlling interests 5 4Total equity 762 8302 Re-presented to show assets that are held by the Group to generate rental income and/or capital appreciation separately from property, plant and equipment. These
assets meet the definition of investment properties and have been reclassified accordingly.
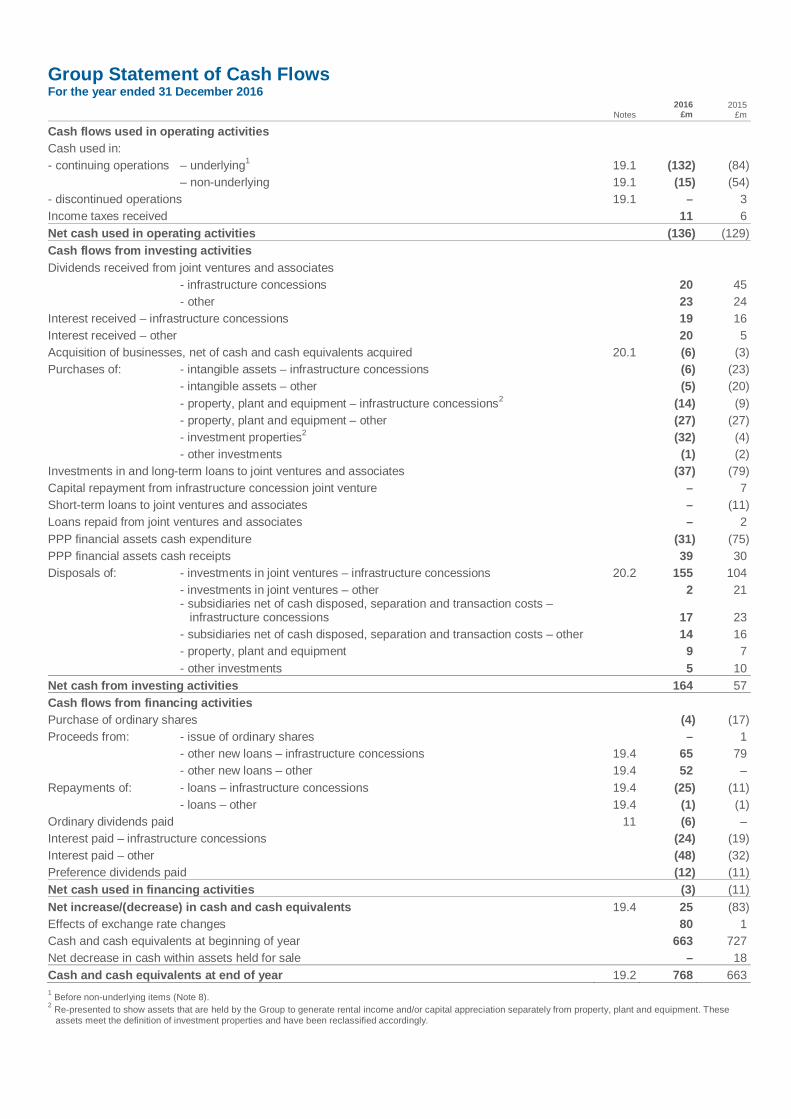
Group Statement of Cash FlowsFor the year ended 31 December 2016
Notes2016
£m2015
£m
Cash flows used in operating activitiesCash used in:- continuing operations – underlying1 19.1 (132) (84)
– non-underlying 19.1 (15) (54)- discontinued operations 19.1 – 3Income taxes received 11 6Net cash used in operating activities (136) (129)Cash flows from investing activitiesDividends received from joint ventures and associates
- infrastructure concessions 20 45- other 23 24
Interest received – infrastructure concessions 19 16Interest received – other 20 5Acquisition of businesses, net of cash and cash equivalents acquired 20.1 (6) (3)Purchases of: - intangible assets – infrastructure concessions (6) (23)
- intangible assets – other (5) (20)- property, plant and equipment – infrastructure concessions2 (14) (9)- property, plant and equipment – other (27) (27)- investment properties2 (32) (4)- other investments (1) (2)
Investments in and long-term loans to joint ventures and associates (37) (79)Capital repayment from infrastructure concession joint venture – 7Short-term loans to joint ventures and associates – (11)Loans repaid from joint ventures and associates – 2PPP financial assets cash expenditure (31) (75)PPP financial assets cash receipts 39 30Disposals of: - investments in joint ventures – infrastructure concessions 20.2 155 104
- investments in joint ventures – other 2 21- subsidiaries net of cash disposed, separation and transaction costs –
infrastructure concessions 17 23- subsidiaries net of cash disposed, separation and transaction costs – other 14 16- property, plant and equipment 9 7- other investments 5 10
Net cash from investing activities 164 57Cash flows from financing activitiesPurchase of ordinary shares (4) (17)Proceeds from: - issue of ordinary shares – 1
- other new loans – infrastructure concessions 19.4 65 79- other new loans – other 19.4 52 –
Repayments of: - loans – infrastructure concessions 19.4 (25) (11)- loans – other 19.4 (1) (1)
Ordinary dividends paid 11 (6) –Interest paid – infrastructure concessions (24) (19)Interest paid – other (48) (32)Preference dividends paid (12) (11)Net cash used in financing activities (3) (11)Net increase/(decrease) in cash and cash equivalents 19.4 25 (83)Effects of exchange rate changes 80 1Cash and cash equivalents at beginning of year 663 727Net decrease in cash within assets held for sale – 18Cash and cash equivalents at end of year 19.2 768 6631 Before non-underlying items (Note 8).2 Re-presented to show assets that are held by the Group to generate rental income and/or capital appreciation separately from property, plant and equipment. These
assets meet the definition of investment properties and have been reclassified accordingly.
Notes to the financial statements
1 Basis of accountingThe annual financial statements have been prepared on a going concern basis and in accordance with International Financial
Reporting Standards (IFRS) as adopted by the European Union and therefore comply with Article 4 of the EU IAS Regulation and
with those parts of the Companies Act 2006 that are applicable to companies reporting under IFRS. The Group has applied all
accounting standards and interpretations issued by the International Accounting Standards Board (IASB) and International
Financial Reporting Interpretations Committee as adopted by the European Union and effective for accounting periods beginning
on 1 January 2016. The presentational currency of the Group is sterling.
The financial information in this announcement, which was approved by the Board of Directors on 15 March 2017, does not
constitute the Company's statutory accounts for the years ended 31 December 2016 or 2015, but is derived from those accounts.
Statutory accounts for 2015 have been delivered to the Registrar of Companies and those for 2016 will be delivered following the
Company's Annual General Meeting. The auditor has reported on the 2016 accounts; the report is unqualified, did not draw
attention to any matters by way of emphasis without qualifying the report and did not contain statements under Section 498(2) or
(3) of the Companies Act 2006.
Whilst the financial information included in this preliminary announcement has been computed in accordance with IFRS, this
announcement does not itself contain sufficient information to comply with IFRS. The Company expects to publish full financial
statements for the Group that comply with IFRS in April 2017.
2 Going concernThe Directors have acknowledged the guidance ‘Going Concern and Liquidity Risk: Guidance for Directors of UK Companies 2009’
published by the Financial Reporting Council in October 2009 and consider it reasonable to assume that the Group has adequate
resources to continue for the foreseeable future and, for this reason, have continued to adopt the going concern basis in preparing
the financial statements. Further information is provided within the Other Financial Items section.
3 Accounting policies
3.1 Judgements and key sources of estimation uncertaintyThe Group’s principal judgements and key sources of uncertainty are set out in Note 2.27 of the Annual Report and Accounts 2016.
Across Construction Services there remain a small number of long-term and complex projects where the Group has incorporated
significant judgements over contractual entitlements. The range of potential outcomes could result in a materially positive or
negative swing to underlying profitability and cash flow. In the UK, the majority of these contracts are within Major Projects. Outside
the UK, this primarily relates to a number of significant contracts in Hong Kong where the range of potential outcomes could result
in a materially positive or negative swing to profitability. The majority of these claims are expected to reach commercial settlement
by 2018.
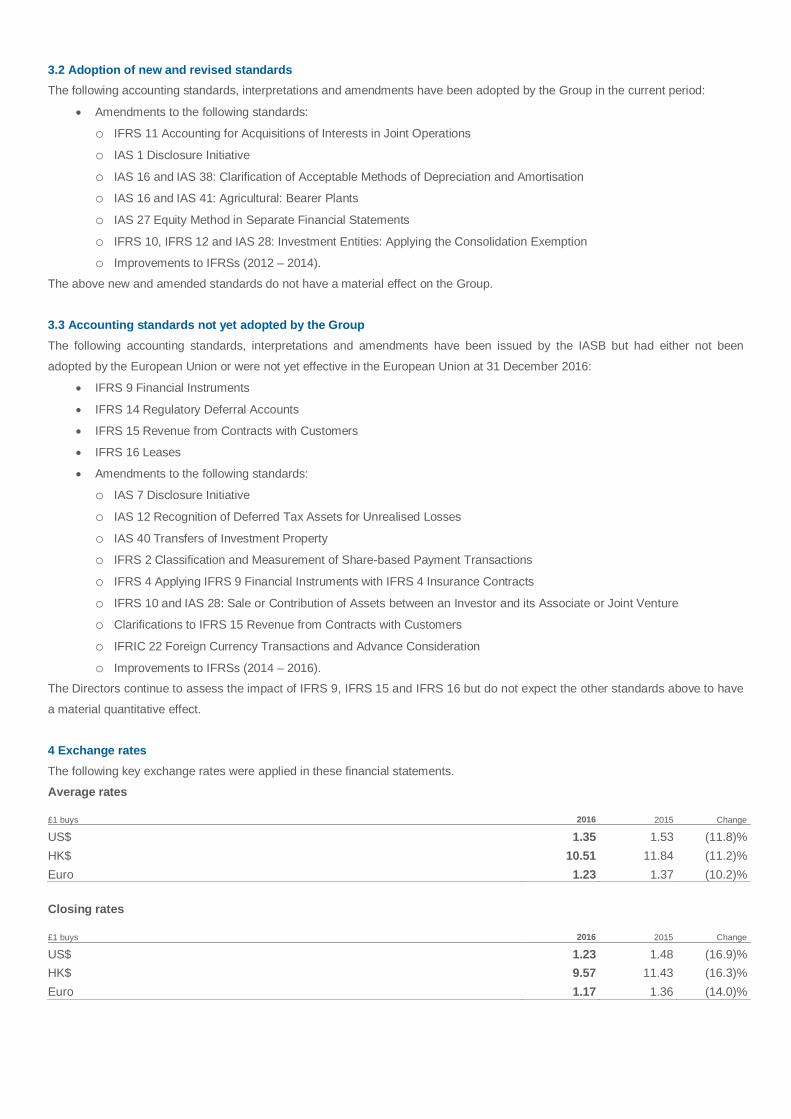
3.2 Adoption of new and revised standardsThe following accounting standards, interpretations and amendments have been adopted by the Group in the current period:
· Amendments to the following standards:
o IFRS 11 Accounting for Acquisitions of Interests in Joint Operations
o IAS 1 Disclosure Initiative
o IAS 16 and IAS 38: Clarification of Acceptable Methods of Depreciation and Amortisation
o IAS 16 and IAS 41: Agricultural: Bearer Plants
o IAS 27 Equity Method in Separate Financial Statements
o IFRS 10, IFRS 12 and IAS 28: Investment Entities: Applying the Consolidation Exemption
o Improvements to IFRSs (2012 – 2014).
The above new and amended standards do not have a material effect on the Group.
3.3 Accounting standards not yet adopted by the GroupThe following accounting standards, interpretations and amendments have been issued by the IASB but had either not been
adopted by the European Union or were not yet effective in the European Union at 31 December 2016:
· IFRS 9 Financial Instruments
· IFRS 14 Regulatory Deferral Accounts
· IFRS 15 Revenue from Contracts with Customers
· IFRS 16 Leases
· Amendments to the following standards:
o IAS 7 Disclosure Initiative
o IAS 12 Recognition of Deferred Tax Assets for Unrealised Losses
o IAS 40 Transfers of Investment Property
o IFRS 2 Classification and Measurement of Share-based Payment Transactions
o IFRS 4 Applying IFRS 9 Financial Instruments with IFRS 4 Insurance Contracts
o IFRS 10 and IAS 28: Sale or Contribution of Assets between an Investor and its Associate or Joint Venture
o Clarifications to IFRS 15 Revenue from Contracts with Customers
o IFRIC 22 Foreign Currency Transactions and Advance Consideration
o Improvements to IFRSs (2014 – 2016).
The Directors continue to assess the impact of IFRS 9, IFRS 15 and IFRS 16 but do not expect the other standards above to have
a material quantitative effect.
4 Exchange ratesThe following key exchange rates were applied in these financial statements.
Average rates
£1 buys 2016 2015 Change
US$ 1.35 1.53 (11.8)%HK$ 10.51 11.84 (11.2)%Euro 1.23 1.37 (10.2)%
Closing rates
£1 buys 2016 2015 Change
US$ 1.23 1.48 (16.9)%HK$ 9.57 11.43 (16.3)%Euro 1.17 1.36 (14.0)%
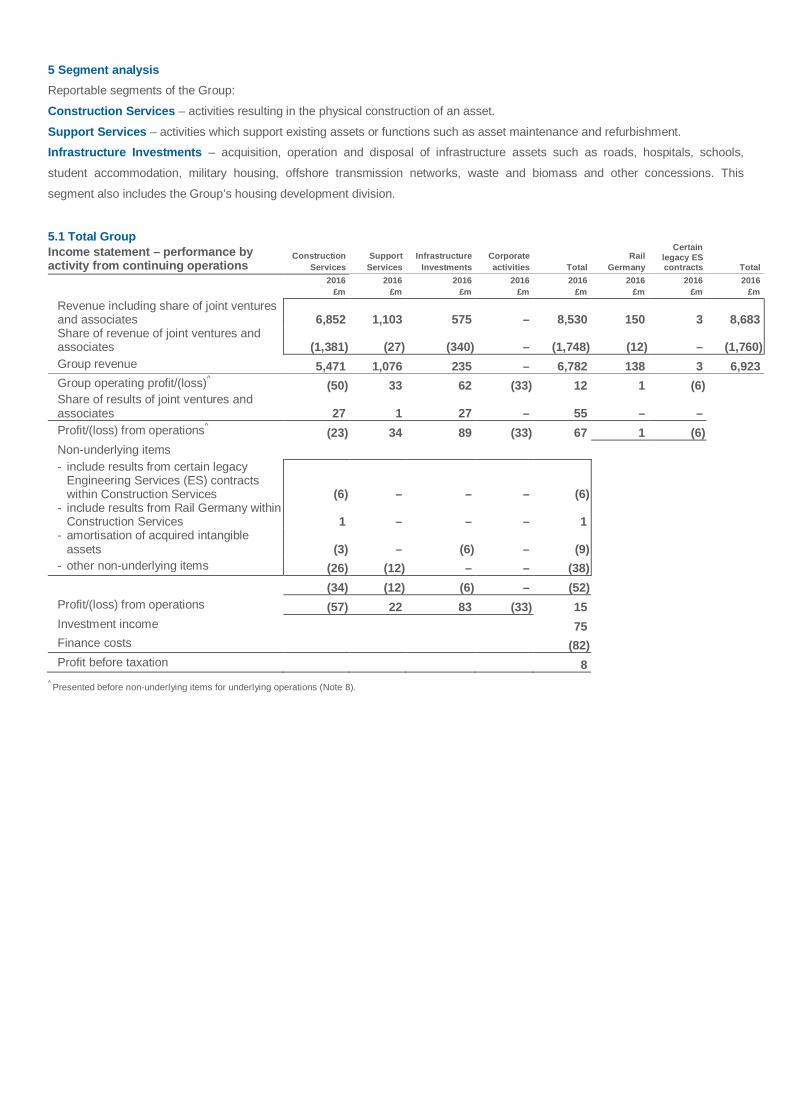
5 Segment analysisReportable segments of the Group:
Construction Services – activities resulting in the physical construction of an asset.
Support Services – activities which support existing assets or functions such as asset maintenance and refurbishment.
Infrastructure Investments – acquisition, operation and disposal of infrastructure assets such as roads, hospitals, schools,
student accommodation, military housing, offshore transmission networks, waste and biomass and other concessions. This
segment also includes the Group’s housing development division.
5.1 Total GroupIncome statement – performance byactivity from continuing operations
ConstructionServices
SupportServices
InfrastructureInvestments
Corporateactivities Total
RailGermany
Certainlegacy EScontracts Total
2016£m
2016£m
2016£m
2016£m
2016£m
2016£m
2016£m
2016£m
Revenue including share of joint venturesand associates 6,852 1,103 575 – 8,530 150 3 8,683Share of revenue of joint ventures andassociates (1,381) (27) (340) – (1,748) (12) – (1,760)Group revenue 5,471 1,076 235 – 6,782 138 3 6,923Group operating profit/(loss)^
(50) 33 62 (33) 12 1 (6)Share of results of joint ventures andassociates 27 1 27 – 55 – –Profit/(loss) from operations^
(23) 34 89 (33) 67 1 (6)Non-underlying items- include results from certain legacy
Engineering Services (ES) contractswithin Construction Services (6) – – – (6)
- include results from Rail Germany withinConstruction Services 1 – – – 1
- amortisation of acquired intangibleassets (3) – (6) – (9)
- other non-underlying items (26) (12) – – (38)(34) (12) (6) – (52)
Profit/(loss) from operations (57) 22 83 (33) 15Investment income 75Finance costs (82)Profit before taxation 8
^ Presented before non-underlying items for underlying operations (Note 8).
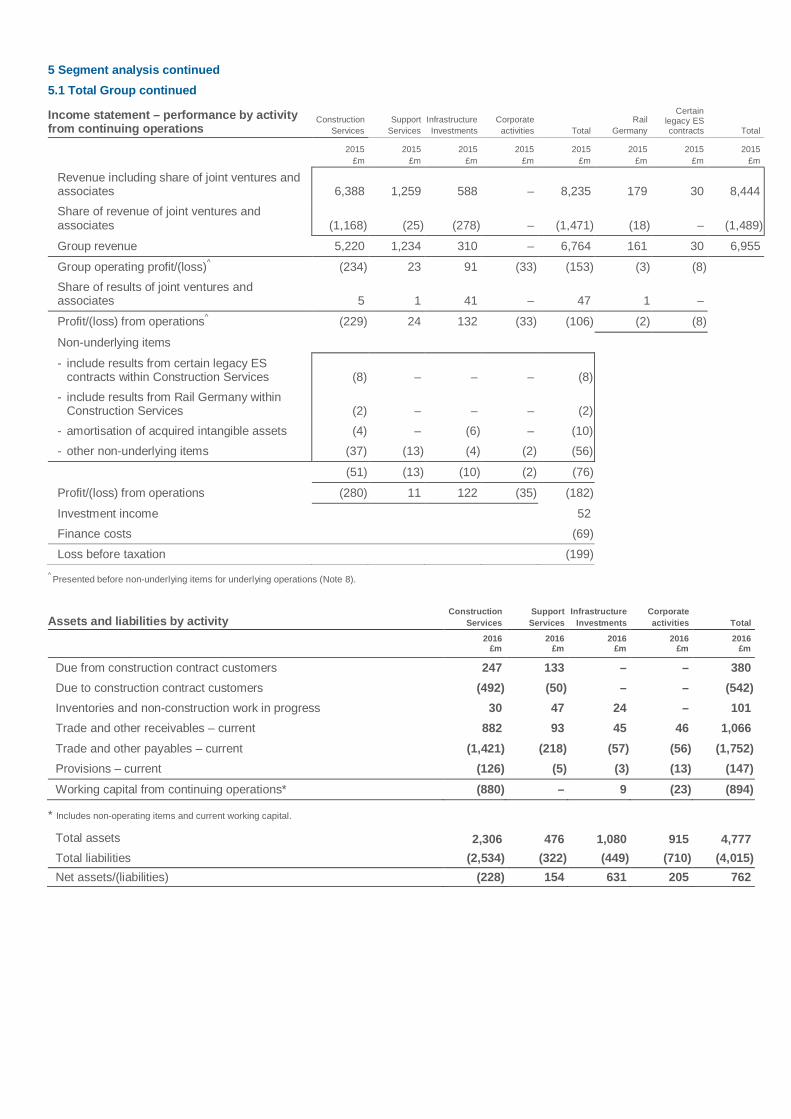
5 Segment analysis continued5.1 Total Group continued
Income statement – performance by activityfrom continuing operations
ConstructionServices
SupportServices
InfrastructureInvestments
Corporateactivities Total
RailGermany
Certainlegacy EScontracts Total
2015£m
2015£m
2015£m
2015£m
2015£m
2015£m
2015£m
2015£m
Revenue including share of joint ventures andassociates 6,388 1,259 588 – 8,235 179 30 8,444Share of revenue of joint ventures andassociates (1,168) (25) (278) – (1,471) (18) – (1,489)
Group revenue 5,220 1,234 310 – 6,764 161 30 6,955
Group operating profit/(loss)^ (234) 23 91 (33) (153) (3) (8)Share of results of joint ventures andassociates 5 1 41 – 47 1 –
Profit/(loss) from operations^ (229) 24 132 (33) (106) (2) (8)
Non-underlying items
- include results from certain legacy EScontracts within Construction Services (8) – – – (8)
- include results from Rail Germany withinConstruction Services (2) – – – (2)
- amortisation of acquired intangible assets (4) – (6) – (10)- other non-underlying items (37) (13) (4) (2) (56)
(51) (13) (10) (2) (76)
Profit/(loss) from operations (280) 11 122 (35) (182)
Investment income 52Finance costs (69)
Loss before taxation (199)^ Presented before non-underlying items for underlying operations (Note 8).
Assets and liabilities by activityConstruction
ServicesSupportServices
InfrastructureInvestments
Corporateactivities Total
2016£m
2016£m
2016£m
2016£m
2016£m
Due from construction contract customers 247 133 – – 380Due to construction contract customers (492) (50) – – (542)Inventories and non-construction work in progress 30 47 24 – 101Trade and other receivables – current 882 93 45 46 1,066Trade and other payables – current (1,421) (218) (57) (56) (1,752)Provisions – current (126) (5) (3) (13) (147)Working capital from continuing operations* (880) – 9 (23) (894)
* Includes non-operating items and current working capital.
Total assets 2,306 476 1,080 915 4,777Total liabilities (2,534) (322) (449) (710) (4,015)Net assets/(liabilities) (228) 154 631 205 762
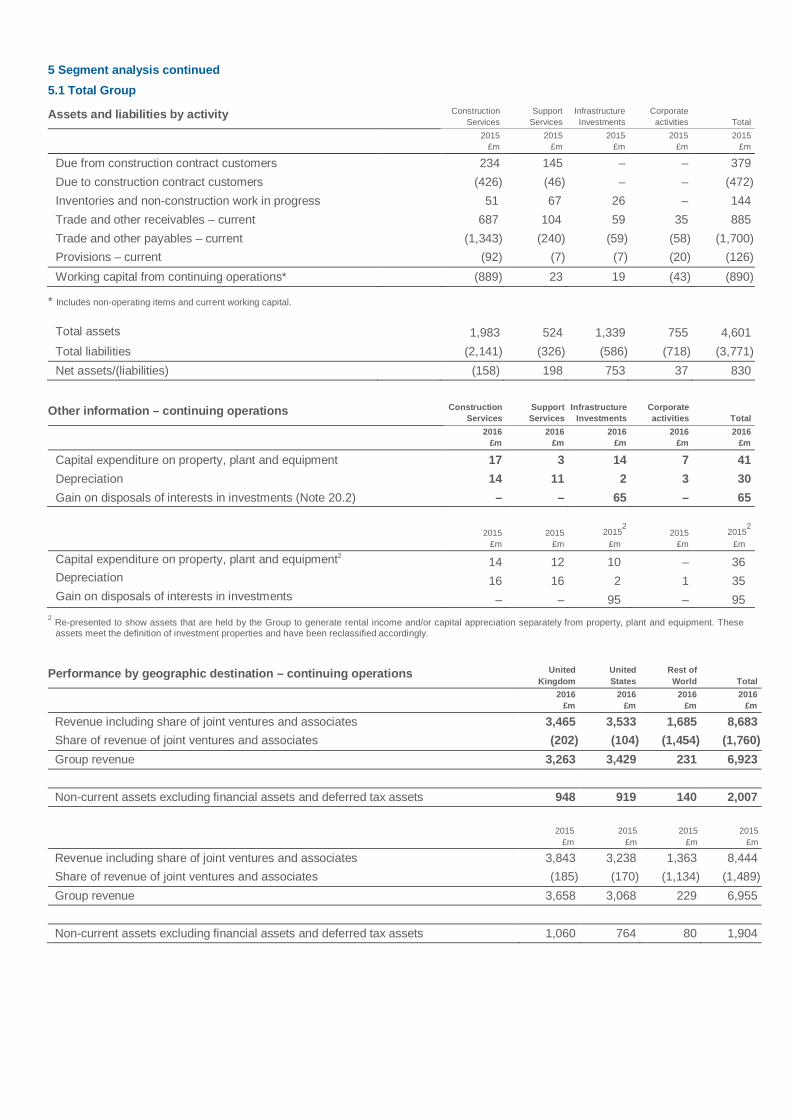
5 Segment analysis continued5.1 Total Group
Assets and liabilities by activity ConstructionServices
SupportServices
InfrastructureInvestments
Corporateactivities Total
2015£m
2015£m
2015£m
2015£m
2015£m
Due from construction contract customers 234 145 – – 379Due to construction contract customers (426) (46) – – (472)Inventories and non-construction work in progress 51 67 26 – 144Trade and other receivables – current 687 104 59 35 885Trade and other payables – current (1,343) (240) (59) (58) (1,700)Provisions – current (92) (7) (7) (20) (126)Working capital from continuing operations* (889) 23 19 (43) (890)
* Includes non-operating items and current working capital.
Total assets 1,983 524 1,339 755 4,601Total liabilities (2,141) (326) (586) (718) (3,771)Net assets/(liabilities) (158) 198 753 37 830
Other information – continuing operations ConstructionServices
SupportServices
InfrastructureInvestments
Corporateactivities Total
2016£m
2016£m
2016£m
2016£m
2016£m
Capital expenditure on property, plant and equipment 17 3 14 7 41Depreciation 14 11 2 3 30Gain on disposals of interests in investments (Note 20.2) – – 65 – 65
2015£m
2015£m
20152
£m2015
£m2015
2
£m
Capital expenditure on property, plant and equipment214 12 10 – 36
Depreciation 16 16 2 1 35Gain on disposals of interests in investments – – 95 – 95
2 Re-presented to show assets that are held by the Group to generate rental income and/or capital appreciation separately from property, plant and equipment. Theseassets meet the definition of investment properties and have been reclassified accordingly.
Performance by geographic destination – continuing operations UnitedKingdom
UnitedStates
Rest ofWorld Total
2016£m
2016£m
2016£m
2016£m
Revenue including share of joint ventures and associates 3,465 3,533 1,685 8,683Share of revenue of joint ventures and associates (202) (104) (1,454) (1,760)Group revenue 3,263 3,429 231 6,923
Non-current assets excluding financial assets and deferred tax assets 948 919 140 2,007
2015£m
2015£m
2015£m
2015£m
Revenue including share of joint ventures and associates 3,843 3,238 1,363 8,444Share of revenue of joint ventures and associates (185) (170) (1,134) (1,489)Group revenue 3,658 3,068 229 6,955
Non-current assets excluding financial assets and deferred tax assets 1,060 764 80 1,904
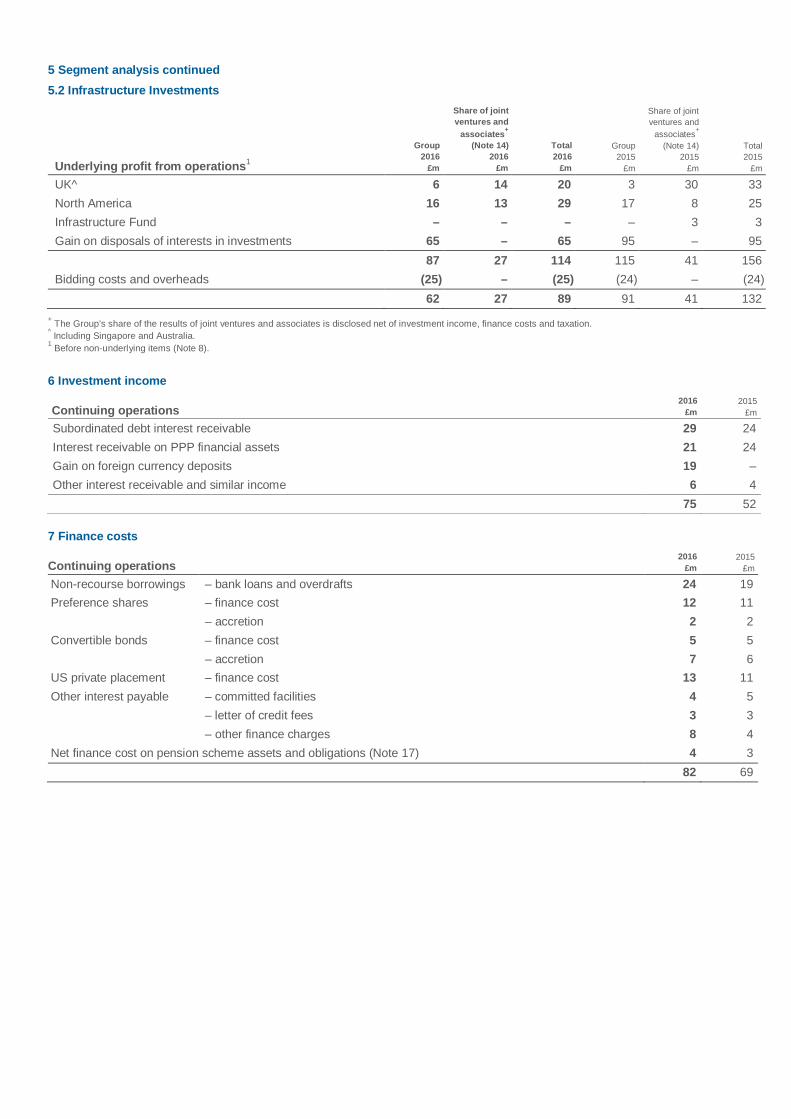
5 Segment analysis continued5.2 Infrastructure Investments
Underlying profit from operations1
Group2016
£m
Share of jointventures and
associates+
(Note 14)2016
£m
Total2016
£m
Group2015
£m
Share of jointventures and
associates+
(Note 14)2015
£m
Total2015
£m
UK^ 6 14 20 3 30 33North America 16 13 29 17 8 25Infrastructure Fund – – – – 3 3Gain on disposals of interests in investments 65 – 65 95 – 95
87 27 114 115 41 156Bidding costs and overheads (25) – (25) (24) – (24)
62 27 89 91 41 132+ The Group’s share of the results of joint ventures and associates is disclosed net of investment income, finance costs and taxation.^ Including Singapore and Australia.1 Before non-underlying items (Note 8).
6 Investment income
Continuing operations2016
£m2015
£m
Subordinated debt interest receivable 29 24Interest receivable on PPP financial assets 21 24Gain on foreign currency deposits 19 –Other interest receivable and similar income 6 4
75 52
7 Finance costs
Continuing operations2016
£m 2015
£m
Non-recourse borrowings – bank loans and overdrafts 24 19Preference shares – finance cost 12 11
– accretion 2 2Convertible bonds – finance cost 5 5
– accretion 7 6US private placement – finance cost 13 11Other interest payable – committed facilities 4 5
– letter of credit fees 3 3 – other finance charges 8 4
Net finance cost on pension scheme assets and obligations (Note 17) 4 382 69
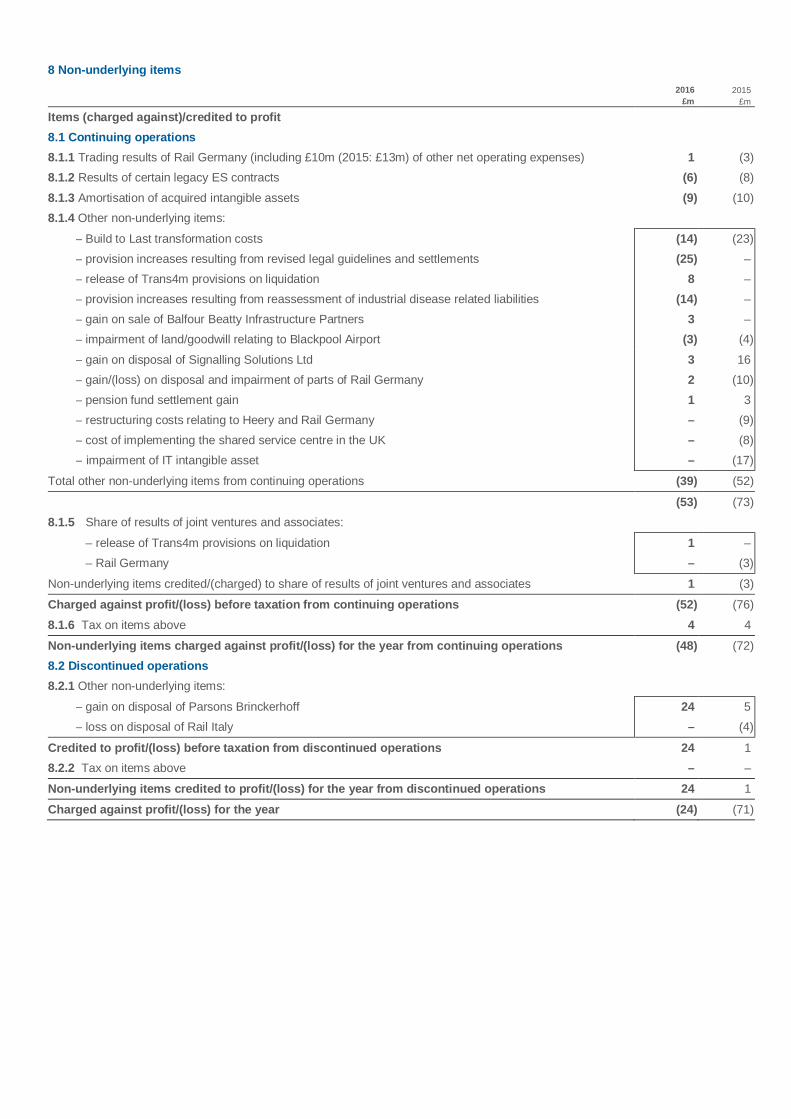
8 Non-underlying items2016
£m2015
£m
Items (charged against)/credited to profit8.1 Continuing operations8.1.1 Trading results of Rail Germany (including £10m (2015: £13m) of other net operating expenses) 1 (3)8.1.2 Results of certain legacy ES contracts (6) (8)
8.1.3 Amortisation of acquired intangible assets (9) (10)8.1.4 Other non-underlying items:
– Build to Last transformation costs (14) (23)– provision increases resulting from revised legal guidelines and settlements (25) –– release of Trans4m provisions on liquidation 8 –– provision increases resulting from reassessment of industrial disease related liabilities (14) –– gain on sale of Balfour Beatty Infrastructure Partners 3 –– impairment of land/goodwill relating to Blackpool Airport (3) (4)
– gain on disposal of Signalling Solutions Ltd 3 16– gain/(loss) on disposal and impairment of parts of Rail Germany 2 (10)– pension fund settlement gain 1 3– restructuring costs relating to Heery and Rail Germany – (9)– cost of implementing the shared service centre in the UK – (8)– impairment of IT intangible asset – (17)
Total other non-underlying items from continuing operations (39) (52)
(53) (73)8.1.5 Share of results of joint ventures and associates:
– release of Trans4m provisions on liquidation 1 –– Rail Germany – (3)
Non-underlying items credited/(charged) to share of results of joint ventures and associates 1 (3)
Charged against profit/(loss) before taxation from continuing operations (52) (76)
8.1.6 Tax on items above 4 4
Non-underlying items charged against profit/(loss) for the year from continuing operations (48) (72)8.2 Discontinued operations8.2.1 Other non-underlying items:
– gain on disposal of Parsons Brinckerhoff 24 5– loss on disposal of Rail Italy – (4)
Credited to profit/(loss) before taxation from discontinued operations 24 18.2.2 Tax on items above – –
Non-underlying items credited to profit/(loss) for the year from discontinued operations 24 1
Charged against profit/(loss) for the year (24) (71)
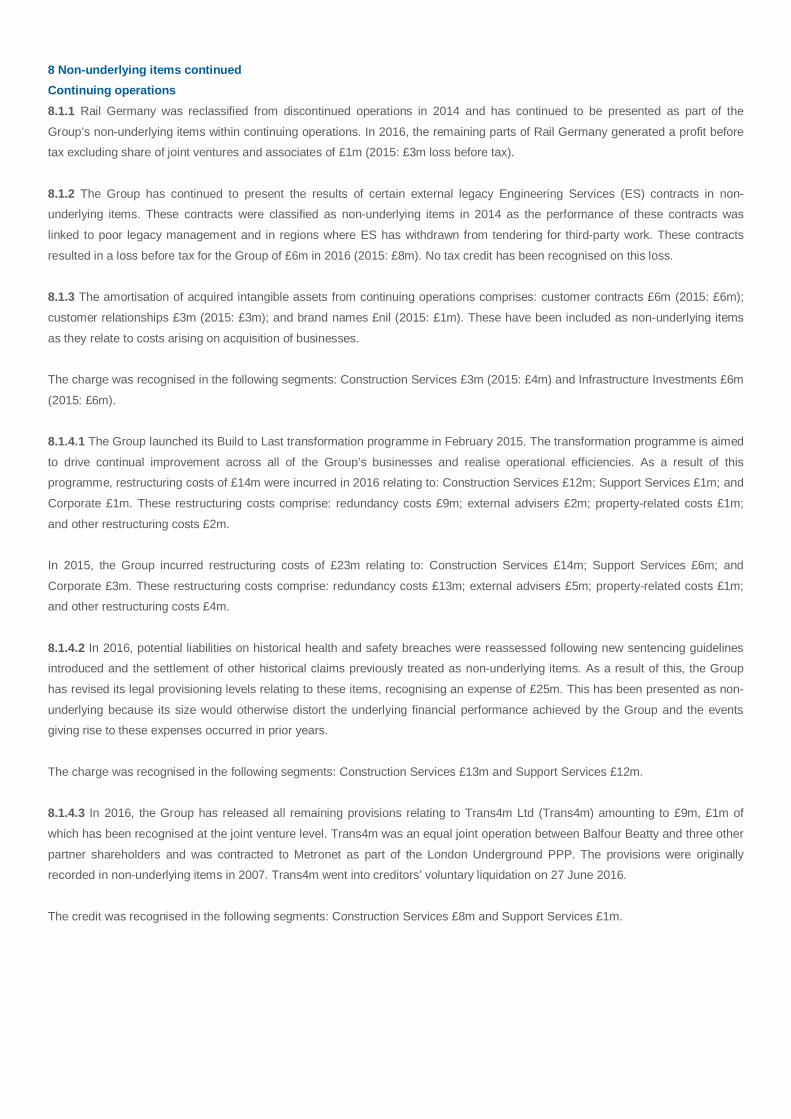
8 Non-underlying items continuedContinuing operations8.1.1 Rail Germany was reclassified from discontinued operations in 2014 and has continued to be presented as part of the
Group’s non-underlying items within continuing operations. In 2016, the remaining parts of Rail Germany generated a profit before
tax excluding share of joint ventures and associates of £1m (2015: £3m loss before tax).
8.1.2 The Group has continued to present the results of certain external legacy Engineering Services (ES) contracts in non-
underlying items. These contracts were classified as non-underlying items in 2014 as the performance of these contracts was
linked to poor legacy management and in regions where ES has withdrawn from tendering for third-party work. These contracts
resulted in a loss before tax for the Group of £6m in 2016 (2015: £8m). No tax credit has been recognised on this loss.
8.1.3 The amortisation of acquired intangible assets from continuing operations comprises: customer contracts £6m (2015: £6m);
customer relationships £3m (2015: £3m); and brand names £nil (2015: £1m). These have been included as non-underlying items
as they relate to costs arising on acquisition of businesses.
The charge was recognised in the following segments: Construction Services £3m (2015: £4m) and Infrastructure Investments £6m
(2015: £6m).
8.1.4.1 The Group launched its Build to Last transformation programme in February 2015. The transformation programme is aimed
to drive continual improvement across all of the Group’s businesses and realise operational efficiencies. As a result of this
programme, restructuring costs of £14m were incurred in 2016 relating to: Construction Services £12m; Support Services £1m; and
Corporate £1m. These restructuring costs comprise: redundancy costs £9m; external advisers £2m; property-related costs £1m;
and other restructuring costs £2m.
In 2015, the Group incurred restructuring costs of £23m relating to: Construction Services £14m; Support Services £6m; and
Corporate £3m. These restructuring costs comprise: redundancy costs £13m; external advisers £5m; property-related costs £1m;
and other restructuring costs £4m.
8.1.4.2 In 2016, potential liabilities on historical health and safety breaches were reassessed following new sentencing guidelines
introduced and the settlement of other historical claims previously treated as non-underlying items. As a result of this, the Group
has revised its legal provisioning levels relating to these items, recognising an expense of £25m. This has been presented as non-
underlying because its size would otherwise distort the underlying financial performance achieved by the Group and the events
giving rise to these expenses occurred in prior years.
The charge was recognised in the following segments: Construction Services £13m and Support Services £12m.
8.1.4.3 In 2016, the Group has released all remaining provisions relating to Trans4m Ltd (Trans4m) amounting to £9m, £1m of
which has been recognised at the joint venture level. Trans4m was an equal joint operation between Balfour Beatty and three other
partner shareholders and was contracted to Metronet as part of the London Underground PPP. The provisions were originally
recorded in non-underlying items in 2007. Trans4m went into creditors’ voluntary liquidation on 27 June 2016.
The credit was recognised in the following segments: Construction Services £8m and Support Services £1m.
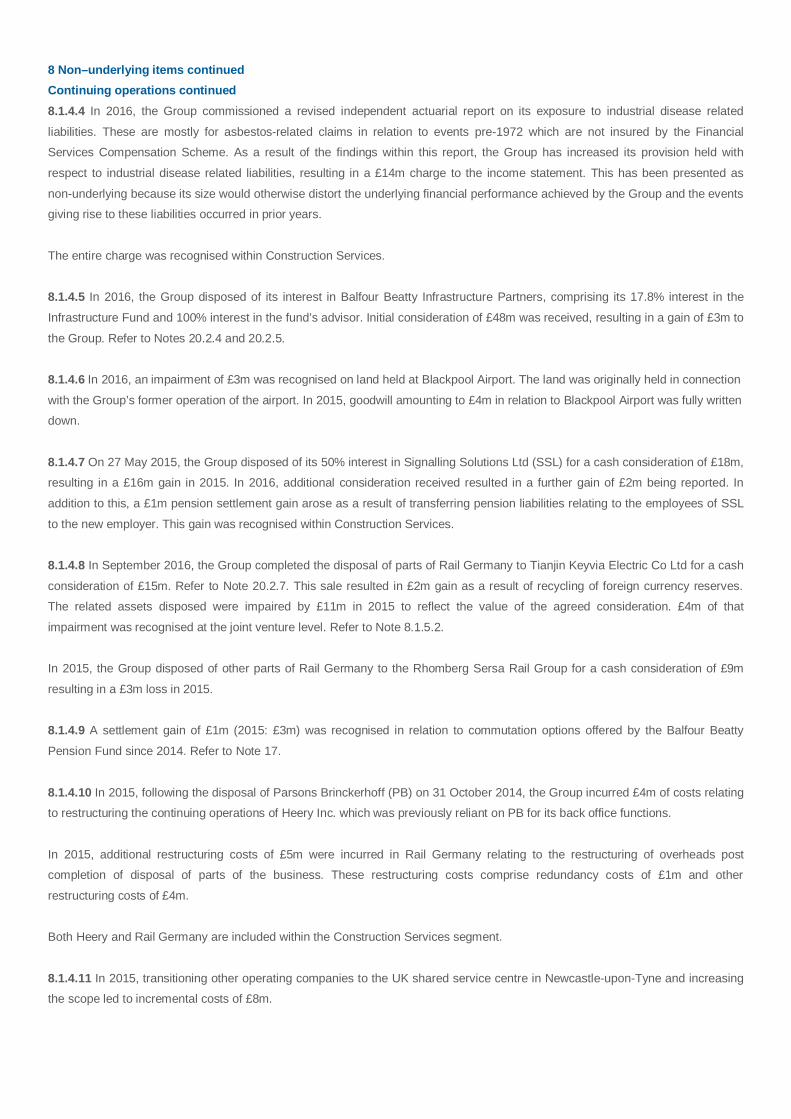
8 Non–underlying items continuedContinuing operations continued8.1.4.4 In 2016, the Group commissioned a revised independent actuarial report on its exposure to industrial disease related
liabilities. These are mostly for asbestos-related claims in relation to events pre-1972 which are not insured by the Financial
Services Compensation Scheme. As a result of the findings within this report, the Group has increased its provision held with
respect to industrial disease related liabilities, resulting in a £14m charge to the income statement. This has been presented as
non-underlying because its size would otherwise distort the underlying financial performance achieved by the Group and the events
giving rise to these liabilities occurred in prior years.
The entire charge was recognised within Construction Services.
8.1.4.5 In 2016, the Group disposed of its interest in Balfour Beatty Infrastructure Partners, comprising its 17.8% interest in the
Infrastructure Fund and 100% interest in the fund’s advisor. Initial consideration of £48m was received, resulting in a gain of £3m to
the Group. Refer to Notes 20.2.4 and 20.2.5.
8.1.4.6 In 2016, an impairment of £3m was recognised on land held at Blackpool Airport. The land was originally held in connection
with the Group’s former operation of the airport. In 2015, goodwill amounting to £4m in relation to Blackpool Airport was fully written
down.
8.1.4.7 On 27 May 2015, the Group disposed of its 50% interest in Signalling Solutions Ltd (SSL) for a cash consideration of £18m,
resulting in a £16m gain in 2015. In 2016, additional consideration received resulted in a further gain of £2m being reported. In
addition to this, a £1m pension settlement gain arose as a result of transferring pension liabilities relating to the employees of SSL
to the new employer. This gain was recognised within Construction Services.
8.1.4.8 In September 2016, the Group completed the disposal of parts of Rail Germany to Tianjin Keyvia Electric Co Ltd for a cash
consideration of £15m. Refer to Note 20.2.7. This sale resulted in £2m gain as a result of recycling of foreign currency reserves.
The related assets disposed were impaired by £11m in 2015 to reflect the value of the agreed consideration. £4m of that
impairment was recognised at the joint venture level. Refer to Note 8.1.5.2.
In 2015, the Group disposed of other parts of Rail Germany to the Rhomberg Sersa Rail Group for a cash consideration of £9m
resulting in a £3m loss in 2015.
8.1.4.9 A settlement gain of £1m (2015: £3m) was recognised in relation to commutation options offered by the Balfour Beatty
Pension Fund since 2014. Refer to Note 17.
8.1.4.10 In 2015, following the disposal of Parsons Brinckerhoff (PB) on 31 October 2014, the Group incurred £4m of costs relating
to restructuring the continuing operations of Heery Inc. which was previously reliant on PB for its back office functions.
In 2015, additional restructuring costs of £5m were incurred in Rail Germany relating to the restructuring of overheads post
completion of disposal of parts of the business. These restructuring costs comprise redundancy costs of £1m and other
restructuring costs of £4m.
Both Heery and Rail Germany are included within the Construction Services segment.
8.1.4.11 In 2015, transitioning other operating companies to the UK shared service centre in Newcastle-upon-Tyne and increasing
the scope led to incremental costs of £8m.
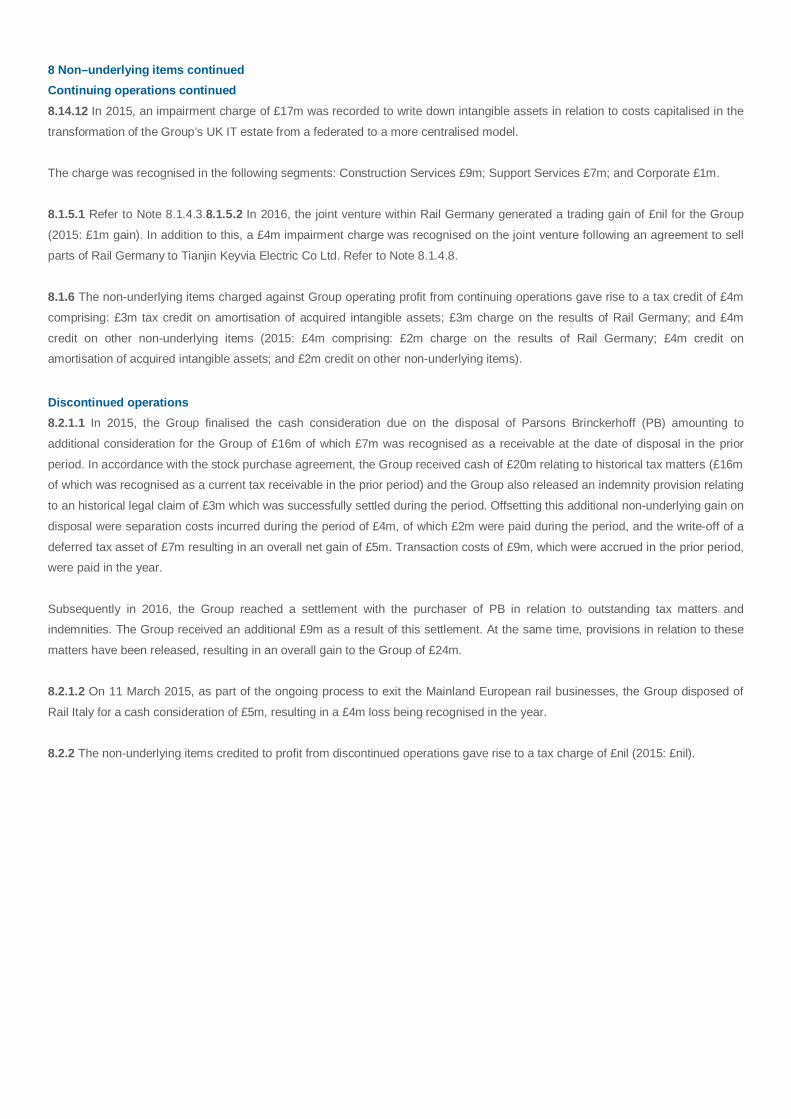
8 Non–underlying items continuedContinuing operations continued8.14.12 In 2015, an impairment charge of £17m was recorded to write down intangible assets in relation to costs capitalised in the
transformation of the Group’s UK IT estate from a federated to a more centralised model.
The charge was recognised in the following segments: Construction Services £9m; Support Services £7m; and Corporate £1m.
8.1.5.1 Refer to Note 8.1.4.3.8.1.5.2 In 2016, the joint venture within Rail Germany generated a trading gain of £nil for the Group
(2015: £1m gain). In addition to this, a £4m impairment charge was recognised on the joint venture following an agreement to sell
parts of Rail Germany to Tianjin Keyvia Electric Co Ltd. Refer to Note 8.1.4.8.
8.1.6 The non-underlying items charged against Group operating profit from continuing operations gave rise to a tax credit of £4m
comprising: £3m tax credit on amortisation of acquired intangible assets; £3m charge on the results of Rail Germany; and £4m
credit on other non-underlying items (2015: £4m comprising: £2m charge on the results of Rail Germany; £4m credit on
amortisation of acquired intangible assets; and £2m credit on other non-underlying items).
Discontinued operations8.2.1.1 In 2015, the Group finalised the cash consideration due on the disposal of Parsons Brinckerhoff (PB) amounting to
additional consideration for the Group of £16m of which £7m was recognised as a receivable at the date of disposal in the prior
period. In accordance with the stock purchase agreement, the Group received cash of £20m relating to historical tax matters (£16m
of which was recognised as a current tax receivable in the prior period) and the Group also released an indemnity provision relating
to an historical legal claim of £3m which was successfully settled during the period. Offsetting this additional non-underlying gain on
disposal were separation costs incurred during the period of £4m, of which £2m were paid during the period, and the write-off of a
deferred tax asset of £7m resulting in an overall net gain of £5m. Transaction costs of £9m, which were accrued in the prior period,
were paid in the year.
Subsequently in 2016, the Group reached a settlement with the purchaser of PB in relation to outstanding tax matters and
indemnities. The Group received an additional £9m as a result of this settlement. At the same time, provisions in relation to these
matters have been released, resulting in an overall gain to the Group of £24m.
8.2.1.2 On 11 March 2015, as part of the ongoing process to exit the Mainland European rail businesses, the Group disposed of
Rail Italy for a cash consideration of £5m, resulting in a £4m loss being recognised in the year.
8.2.2 The non-underlying items credited to profit from discontinued operations gave rise to a tax charge of £nil (2015: £nil).
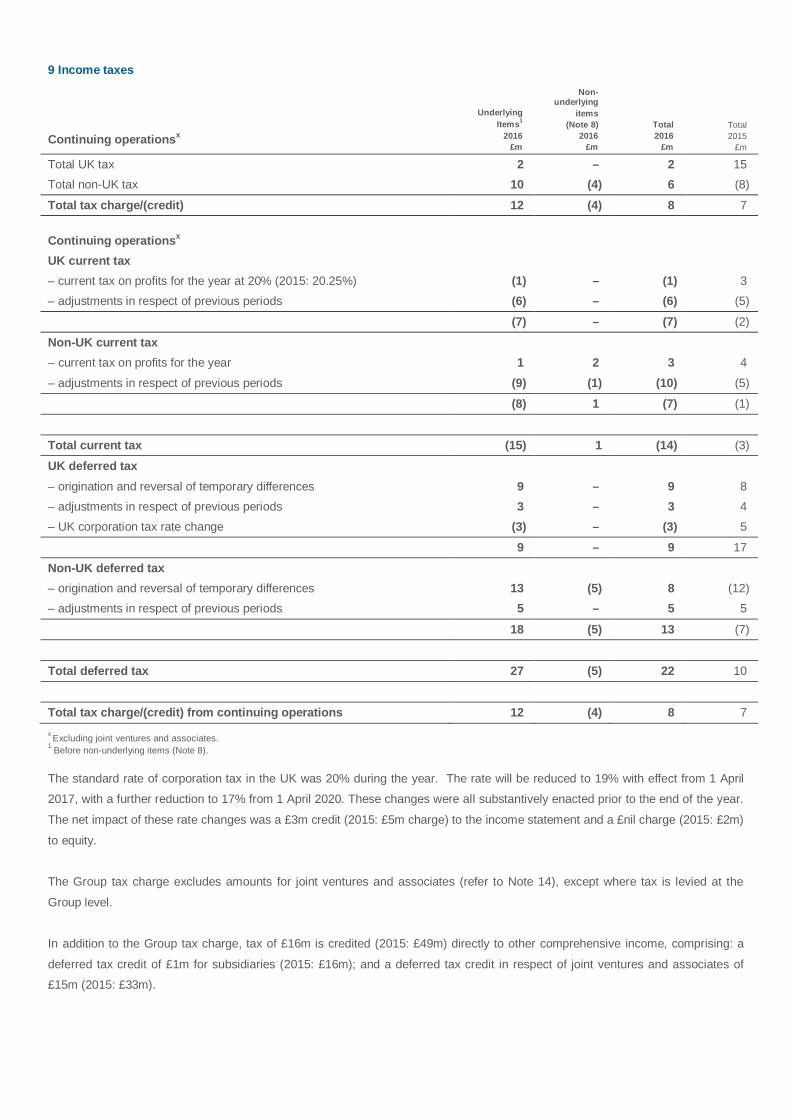
9 Income taxes
Continuing operationsx
UnderlyingItems1
2016£m
Non-underlying
items(Note 8)
2016£m
Total2016
£m
Total2015
£m
Total UK tax 2 – 2 15Total non-UK tax 10 (4) 6 (8)
Total tax charge/(credit) 12 (4) 8 7
Continuing operationsx
UK current tax– current tax on profits for the year at 20% (2015: 20.25%) (1) – (1) 3– adjustments in respect of previous periods (6) – (6) (5)
(7) – (7) (2)
Non-UK current tax– current tax on profits for the year 1 2 3 4
– adjustments in respect of previous periods (9) (1) (10) (5)
(8) 1 (7) (1)
Total current tax (15) 1 (14) (3)
UK deferred tax– origination and reversal of temporary differences 9 – 9 8– adjustments in respect of previous periods 3 – 3 4– UK corporation tax rate change (3) – (3) 5
9 – 9 17
Non-UK deferred tax– origination and reversal of temporary differences 13 (5) 8 (12)– adjustments in respect of previous periods 5 – 5 5
18 (5) 13 (7)
Total deferred tax 27 (5) 22 10
Total tax charge/(credit) from continuing operations 12 (4) 8 7x Excluding joint ventures and associates.1 Before non-underlying items (Note 8).
The standard rate of corporation tax in the UK was 20% during the year. The rate will be reduced to 19% with effect from 1 April
2017, with a further reduction to 17% from 1 April 2020. These changes were all substantively enacted prior to the end of the year.
The net impact of these rate changes was a £3m credit (2015: £5m charge) to the income statement and a £nil charge (2015: £2m)
to equity.
The Group tax charge excludes amounts for joint ventures and associates (refer to Note 14), except where tax is levied at the
Group level.
In addition to the Group tax charge, tax of £16m is credited (2015: £49m) directly to other comprehensive income, comprising: a
deferred tax credit of £1m for subsidiaries (2015: £16m); and a deferred tax credit in respect of joint ventures and associates of
£15m (2015: £33m).
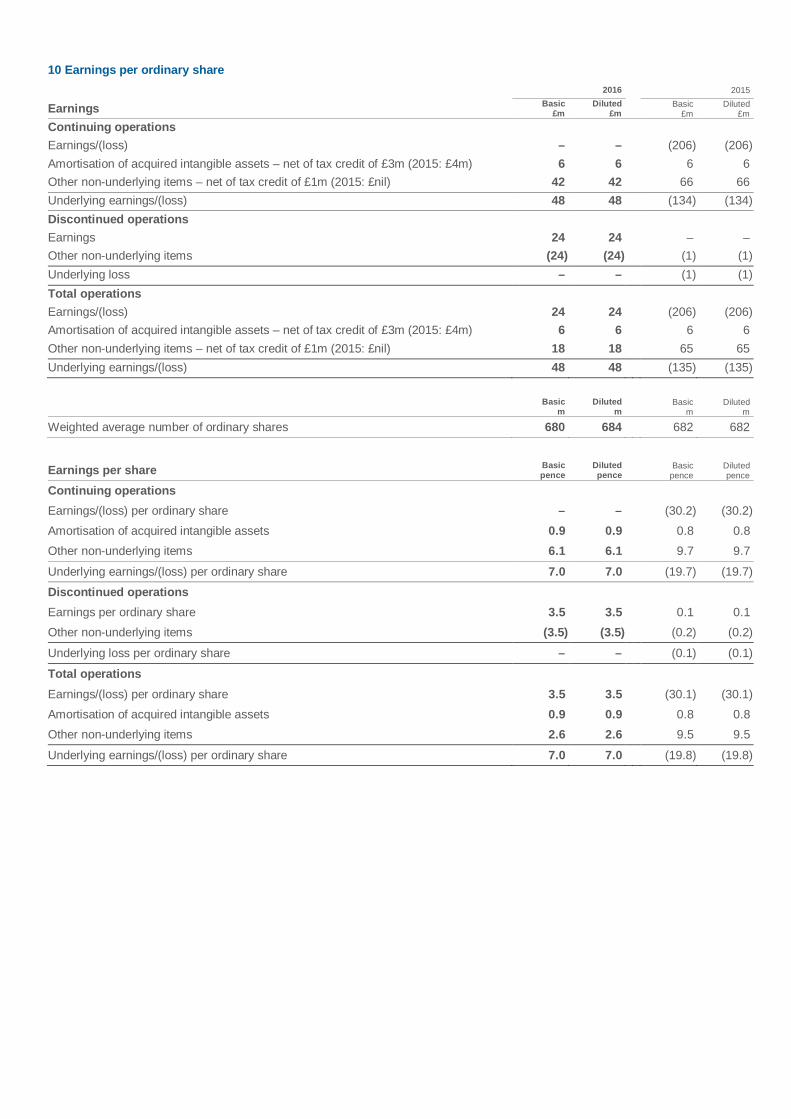
10 Earnings per ordinary share2016 2015
Earnings Basic£m
Diluted£m
Basic£m
Diluted£m
Continuing operationsEarnings/(loss) – – (206) (206)Amortisation of acquired intangible assets – net of tax credit of £3m (2015: £4m) 6 6 6 6Other non-underlying items – net of tax credit of £1m (2015: £nil) 42 42 66 66Underlying earnings/(loss) 48 48 (134) (134)Discontinued operationsEarnings 24 24 – –Other non-underlying items (24) (24) (1) (1)Underlying loss – – (1) (1)Total operationsEarnings/(loss) 24 24 (206) (206)Amortisation of acquired intangible assets – net of tax credit of £3m (2015: £4m) 6 6 6 6Other non-underlying items – net of tax credit of £1m (2015: £nil) 18 18 65 65Underlying earnings/(loss) 48 48 (135) (135)
Basicm
Dilutedm
Basicm
Dilutedm
Weighted average number of ordinary shares 680 684 682 682
Earnings per share Basicpence
Dilutedpence
Basicpence
Dilutedpence
Continuing operationsEarnings/(loss) per ordinary share – – (30.2) (30.2)Amortisation of acquired intangible assets 0.9 0.9 0.8 0.8Other non-underlying items 6.1 6.1 9.7 9.7
Underlying earnings/(loss) per ordinary share 7.0 7.0 (19.7) (19.7)
Discontinued operationsEarnings per ordinary share 3.5 3.5 0.1 0.1Other non-underlying items (3.5) (3.5) (0.2) (0.2)
Underlying loss per ordinary share – – (0.1) (0.1)
Total operationsEarnings/(loss) per ordinary share 3.5 3.5 (30.1) (30.1)Amortisation of acquired intangible assets 0.9 0.9 0.8 0.8Other non-underlying items 2.6 2.6 9.5 9.5
Underlying earnings/(loss) per ordinary share 7.0 7.0 (19.8) (19.8)
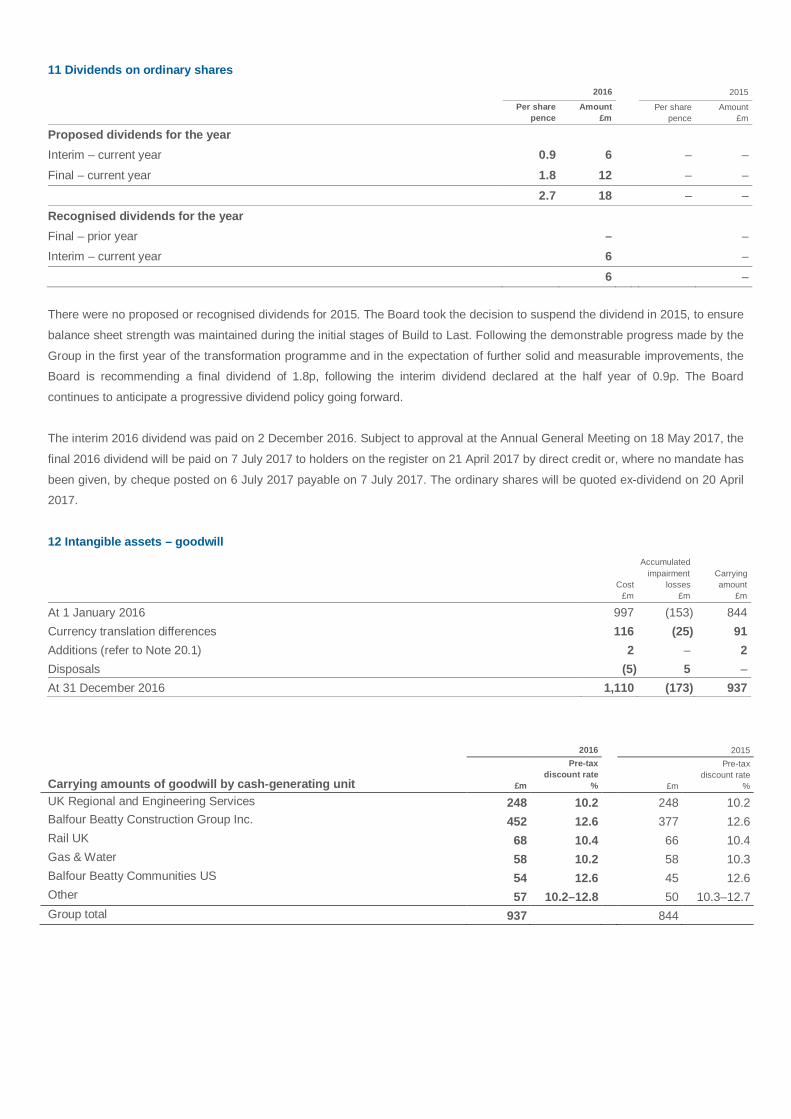
11 Dividends on ordinary shares2016 2015
Per sharepence
Amount£m
Per sharepence
Amount£m
Proposed dividends for the yearInterim – current year 0.9 6 – –
Final – current year 1.8 12 – –
2.7 18 – –
Recognised dividends for the yearFinal – prior year – –Interim – current year 6 –
6 –
There were no proposed or recognised dividends for 2015. The Board took the decision to suspend the dividend in 2015, to ensure
balance sheet strength was maintained during the initial stages of Build to Last. Following the demonstrable progress made by the
Group in the first year of the transformation programme and in the expectation of further solid and measurable improvements, the
Board is recommending a final dividend of 1.8p, following the interim dividend declared at the half year of 0.9p. The Board
continues to anticipate a progressive dividend policy going forward.
The interim 2016 dividend was paid on 2 December 2016. Subject to approval at the Annual General Meeting on 18 May 2017, the
final 2016 dividend will be paid on 7 July 2017 to holders on the register on 21 April 2017 by direct credit or, where no mandate has
been given, by cheque posted on 6 July 2017 payable on 7 July 2017. The ordinary shares will be quoted ex-dividend on 20 April
2017.
12 Intangible assets – goodwill
Cost£m
Accumulatedimpairment
losses£m
Carryingamount
£m
At 1 January 2016 997 (153) 844Currency translation differences 116 (25) 91Additions (refer to Note 20.1) 2 – 2Disposals (5) 5 –At 31 December 2016 1,110 (173) 937
2016 2015
Carrying amounts of goodwill by cash-generating unit £m
Pre-taxdiscount rate
% £m
Pre-taxdiscount rate
%
UK Regional and Engineering Services 248 10.2 248 10.2Balfour Beatty Construction Group Inc. 452 12.6 377 12.6Rail UK 68 10.4 66 10.4Gas & Water 58 10.2 58 10.3Balfour Beatty Communities US 54 12.6 45 12.6Other 57 10.2–12.8 50 10.3–12.7Group total 937 844
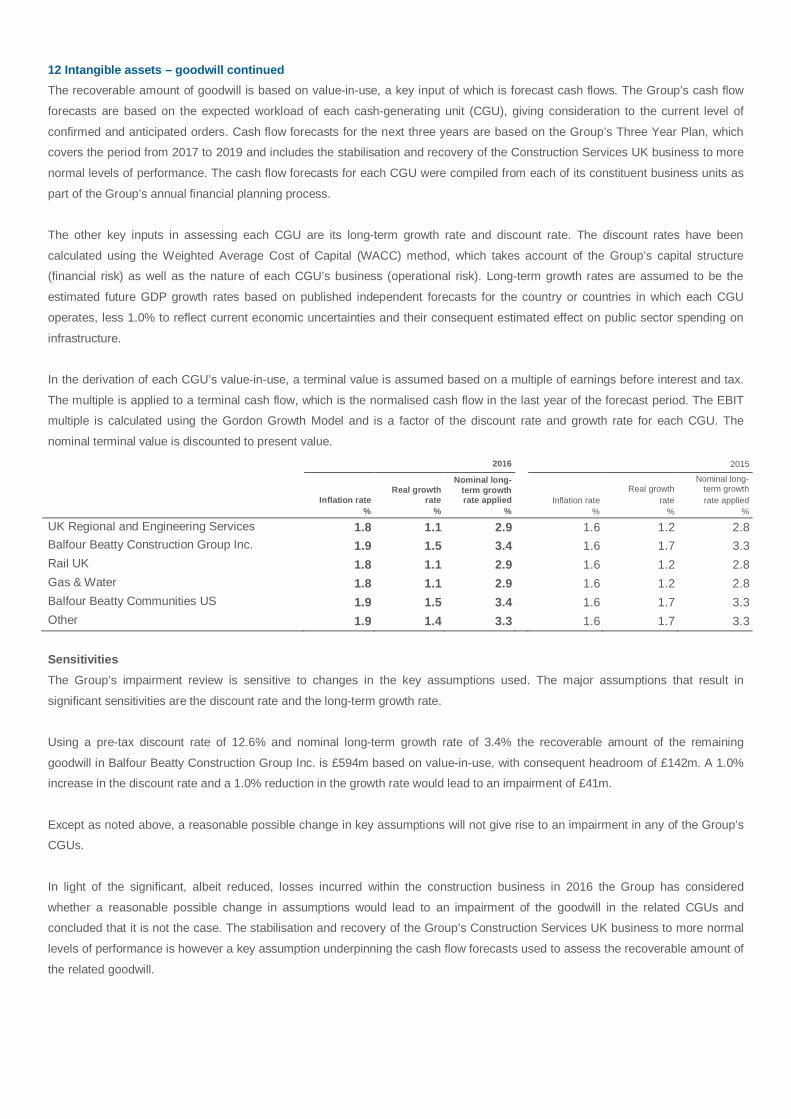
12 Intangible assets – goodwill continuedThe recoverable amount of goodwill is based on value-in-use, a key input of which is forecast cash flows. The Group’s cash flow
forecasts are based on the expected workload of each cash-generating unit (CGU), giving consideration to the current level of
confirmed and anticipated orders. Cash flow forecasts for the next three years are based on the Group’s Three Year Plan, which
covers the period from 2017 to 2019 and includes the stabilisation and recovery of the Construction Services UK business to more
normal levels of performance. The cash flow forecasts for each CGU were compiled from each of its constituent business units as
part of the Group’s annual financial planning process.
The other key inputs in assessing each CGU are its long-term growth rate and discount rate. The discount rates have been
calculated using the Weighted Average Cost of Capital (WACC) method, which takes account of the Group’s capital structure
(financial risk) as well as the nature of each CGU’s business (operational risk). Long-term growth rates are assumed to be the
estimated future GDP growth rates based on published independent forecasts for the country or countries in which each CGU
operates, less 1.0% to reflect current economic uncertainties and their consequent estimated effect on public sector spending on
infrastructure.
In the derivation of each CGU’s value-in-use, a terminal value is assumed based on a multiple of earnings before interest and tax.
The multiple is applied to a terminal cash flow, which is the normalised cash flow in the last year of the forecast period. The EBIT
multiple is calculated using the Gordon Growth Model and is a factor of the discount rate and growth rate for each CGU. The
nominal terminal value is discounted to present value.
2016 2015
Inflation rate%
Real growthrate
%
Nominal long-term growthrate applied
%Inflation rate
%
Real growthrate
%
Nominal long-term growthrate applied
%
UK Regional and Engineering Services 1.8 1.1 2.9 1.6 1.2 2.8Balfour Beatty Construction Group Inc. 1.9 1.5 3.4 1.6 1.7 3.3Rail UK 1.8 1.1 2.9 1.6 1.2 2.8Gas & Water 1.8 1.1 2.9 1.6 1.2 2.8Balfour Beatty Communities US 1.9 1.5 3.4 1.6 1.7 3.3Other 1.9 1.4 3.3 1.6 1.7 3.3
SensitivitiesThe Group’s impairment review is sensitive to changes in the key assumptions used. The major assumptions that result in
significant sensitivities are the discount rate and the long-term growth rate.
Using a pre-tax discount rate of 12.6% and nominal long-term growth rate of 3.4% the recoverable amount of the remaining
goodwill in Balfour Beatty Construction Group Inc. is £594m based on value-in-use, with consequent headroom of £142m. A 1.0%
increase in the discount rate and a 1.0% reduction in the growth rate would lead to an impairment of £41m.
Except as noted above, a reasonable possible change in key assumptions will not give rise to an impairment in any of the Group’s
CGUs.
In light of the significant, albeit reduced, losses incurred within the construction business in 2016 the Group has considered
whether a reasonable possible change in assumptions would lead to an impairment of the goodwill in the related CGUs and
concluded that it is not the case. The stabilisation and recovery of the Group’s Construction Services UK business to more normal
levels of performance is however a key assumption underpinning the cash flow forecasts used to assess the recoverable amount of
the related goodwill.
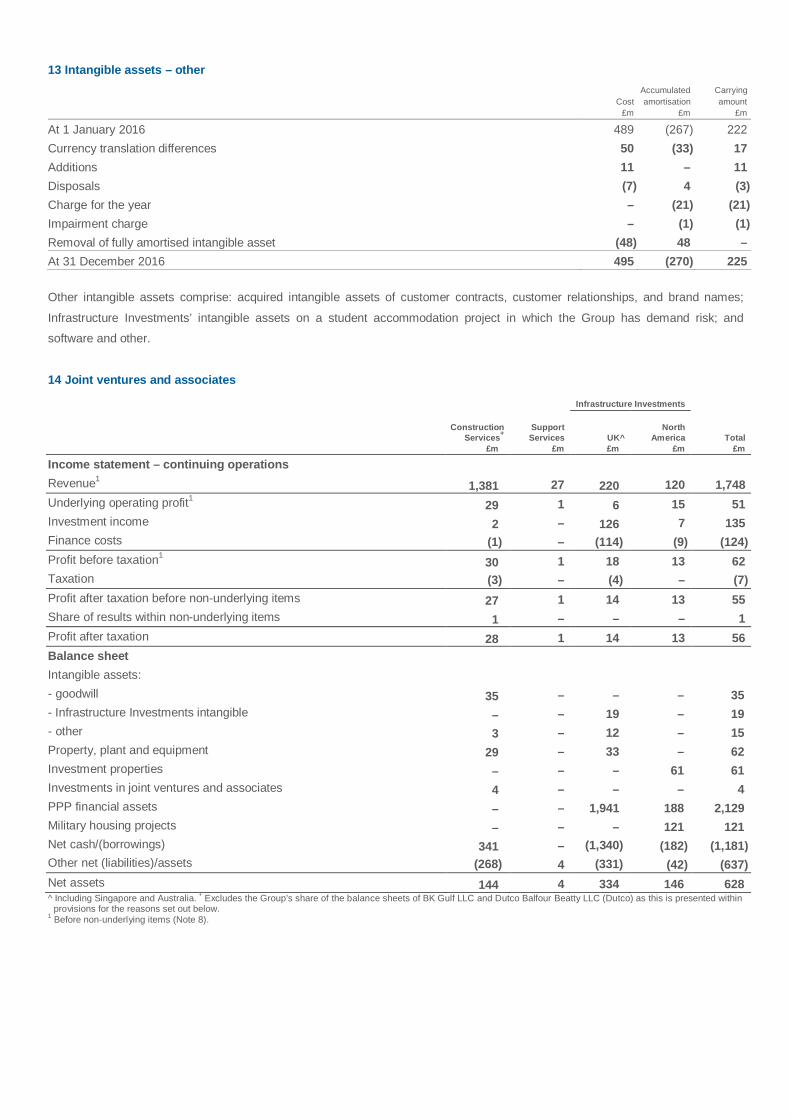
13 Intangible assets – other
Cost£m
Accumulatedamortisation
£m
Carryingamount
£m
At 1 January 2016 489 (267) 222Currency translation differences 50 (33) 17Additions 11 – 11Disposals (7) 4 (3)Charge for the year – (21) (21)Impairment charge – (1) (1)Removal of fully amortised intangible asset (48) 48 –At 31 December 2016 495 (270) 225
Other intangible assets comprise: acquired intangible assets of customer contracts, customer relationships, and brand names;
Infrastructure Investments’ intangible assets on a student accommodation project in which the Group has demand risk; and
software and other.
14 Joint ventures and associates
Infrastructure Investments
ConstructionServices+
£m
SupportServices
£mUK^£m
North America
£mTotal
£m
Income statement – continuing operationsRevenue1
1,381 27 220 120 1,748Underlying operating profit1 29 1 6 15 51Investment income 2 – 126 7 135Finance costs (1) – (114) (9) (124)Profit before taxation1
30 1 18 13 62Taxation (3) – (4) – (7)Profit after taxation before non-underlying items 27 1 14 13 55Share of results within non-underlying items 1 – – – 1Profit after taxation 28 1 14 13 56Balance sheetIntangible assets:- goodwill 35 – – – 35- Infrastructure Investments intangible – – 19 – 19- other 3 – 12 – 15Property, plant and equipment 29 – 33 – 62Investment properties – – – 61 61Investments in joint ventures and associates 4 – – – 4PPP financial assets – – 1,941 188 2,129Military housing projects – – – 121 121Net cash/(borrowings) 341 – (1,340) (182) (1,181)Other net (liabilities)/assets (268) 4 (331) (42) (637)Net assets 144 4 334 146 628^ Including Singapore and Australia. + Excludes the Group’s share of the balance sheets of BK Gulf LLC and Dutco Balfour Beatty LLC (Dutco) as this is presented within
provisions for the reasons set out below.1 Before non-underlying items (Note 8).
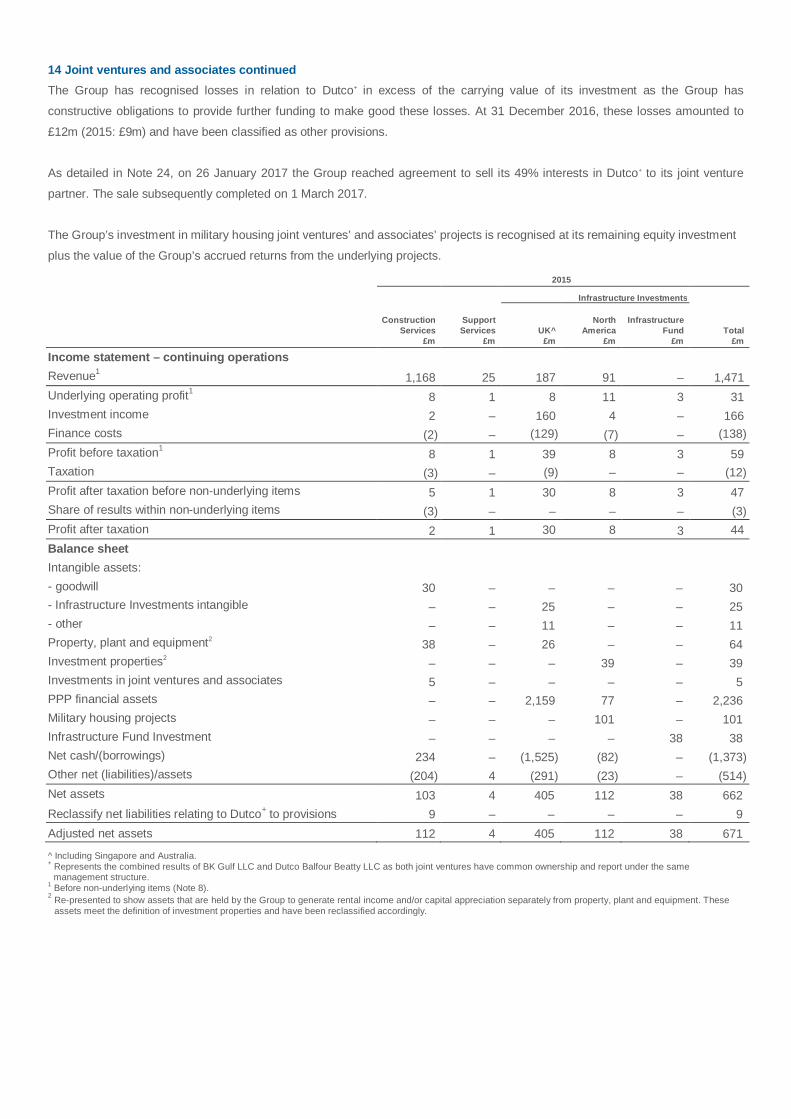
14 Joint ventures and associates continuedThe Group has recognised losses in relation to Dutco+ in excess of the carrying value of its investment as the Group has
constructive obligations to provide further funding to make good these losses. At 31 December 2016, these losses amounted to
£12m (2015: £9m) and have been classified as other provisions.
As detailed in Note 24, on 26 January 2017 the Group reached agreement to sell its 49% interests in Dutco+ to its joint venture
partner. The sale subsequently completed on 1 March 2017.
The Group’s investment in military housing joint ventures’ and associates’ projects is recognised at its remaining equity investment
plus the value of the Group’s accrued returns from the underlying projects.
2015
Infrastructure Investments
ConstructionServices
£m
SupportServices
£mUK^
£m
North America
£m
InfrastructureFund
£mTotal
£m
Income statement – continuing operationsRevenue1 1,168 25 187 91 – 1,471Underlying operating profit1 8 1 8 11 3 31Investment income 2 – 160 4 – 166Finance costs (2) – (129) (7) – (138)Profit before taxation1 8 1 39 8 3 59Taxation (3) – (9) – – (12)Profit after taxation before non-underlying items 5 1 30 8 3 47Share of results within non-underlying items (3) – – – – (3)Profit after taxation 2 1 30 8 3 44Balance sheetIntangible assets:- goodwill 30 – – – – 30- Infrastructure Investments intangible – – 25 – – 25- other – – 11 – – 11Property, plant and equipment2 38 – 26 – – 64Investment properties2 – – – 39 – 39Investments in joint ventures and associates 5 – – – – 5PPP financial assets – – 2,159 77 – 2,236Military housing projects – – – 101 – 101Infrastructure Fund Investment – – – – 38 38Net cash/(borrowings) 234 – (1,525) (82) – (1,373)Other net (liabilities)/assets (204) 4 (291) (23) – (514)Net assets 103 4 405 112 38 662Reclassify net liabilities relating to Dutco+ to provisions 9 – – – – 9Adjusted net assets 112 4 405 112 38 671
^ Including Singapore and Australia.+ Represents the combined results of BK Gulf LLC and Dutco Balfour Beatty LLC as both joint ventures have common ownership and report under the same
management structure.1 Before non-underlying items (Note 8).2 Re-presented to show assets that are held by the Group to generate rental income and/or capital appreciation separately from property, plant and equipment. These
assets meet the definition of investment properties and have been reclassified accordingly.
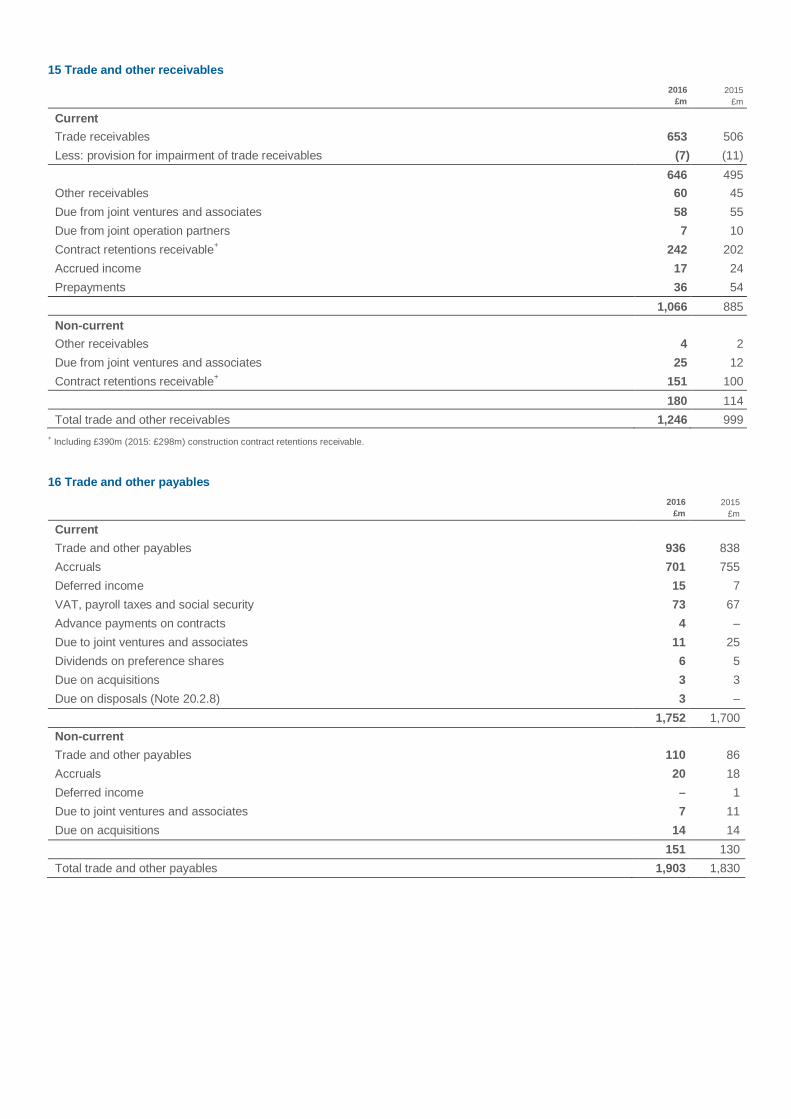
15 Trade and other receivables2016
£m2015
£m
CurrentTrade receivables 653 506Less: provision for impairment of trade receivables (7) (11)
646 495Other receivables 60 45Due from joint ventures and associates 58 55Due from joint operation partners 7 10Contract retentions receivable+ 242 202Accrued income 17 24Prepayments 36 54
1,066 885Non-currentOther receivables 4 2Due from joint ventures and associates 25 12Contract retentions receivable+ 151 100
180 114Total trade and other receivables 1,246 999
+ Including £390m (2015: £298m) construction contract retentions receivable.
16 Trade and other payables2016
£m2015
£m
CurrentTrade and other payables 936 838Accruals 701 755Deferred income 15 7VAT, payroll taxes and social security 73 67Advance payments on contracts 4 –Due to joint ventures and associates 11 25Dividends on preference shares 6 5Due on acquisitions 3 3Due on disposals (Note 20.2.8) 3 –
1,752 1,700Non-currentTrade and other payables 110 86Accruals 20 18Deferred income – 1Due to joint ventures and associates 7 11Due on acquisitions 14 14
151 130Total trade and other payables 1,903 1,830
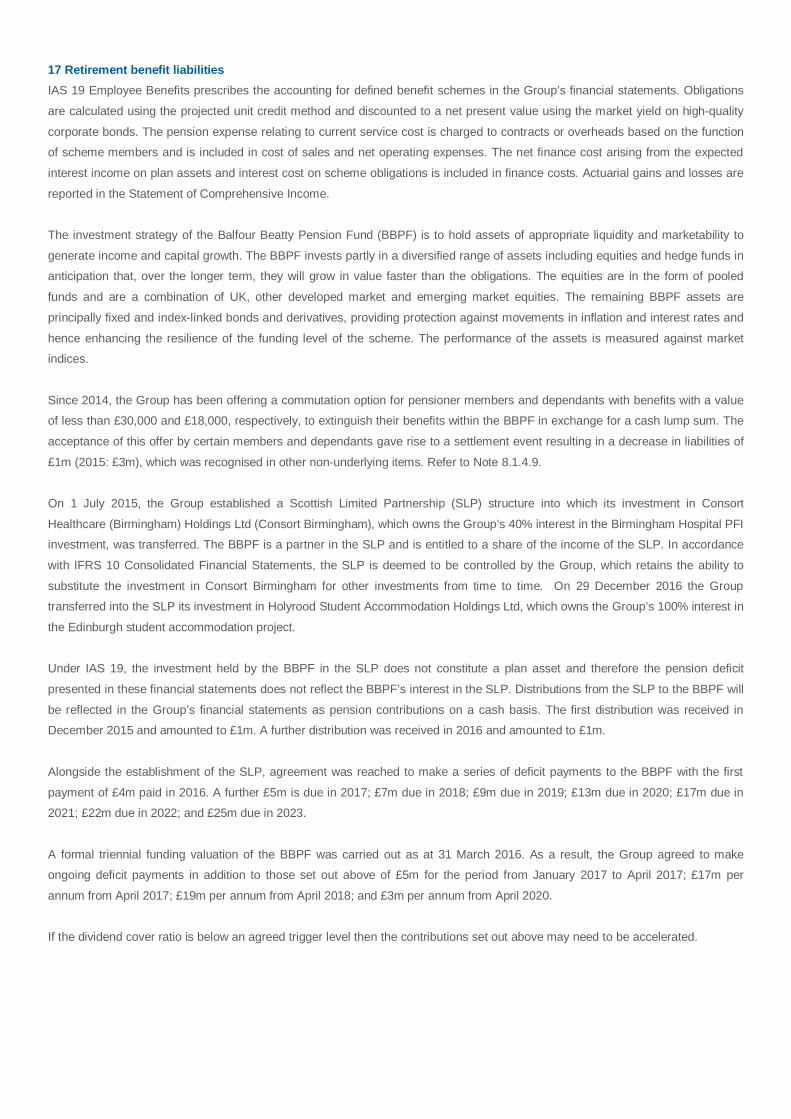
17 Retirement benefit liabilitiesIAS 19 Employee Benefits prescribes the accounting for defined benefit schemes in the Group’s financial statements. Obligations
are calculated using the projected unit credit method and discounted to a net present value using the market yield on high-quality
corporate bonds. The pension expense relating to current service cost is charged to contracts or overheads based on the function
of scheme members and is included in cost of sales and net operating expenses. The net finance cost arising from the expected
interest income on plan assets and interest cost on scheme obligations is included in finance costs. Actuarial gains and losses are
reported in the Statement of Comprehensive Income.
The investment strategy of the Balfour Beatty Pension Fund (BBPF) is to hold assets of appropriate liquidity and marketability to
generate income and capital growth. The BBPF invests partly in a diversified range of assets including equities and hedge funds in
anticipation that, over the longer term, they will grow in value faster than the obligations. The equities are in the form of pooled
funds and are a combination of UK, other developed market and emerging market equities. The remaining BBPF assets are
principally fixed and index-linked bonds and derivatives, providing protection against movements in inflation and interest rates and
hence enhancing the resilience of the funding level of the scheme. The performance of the assets is measured against market
indices.
Since 2014, the Group has been offering a commutation option for pensioner members and dependants with benefits with a value
of less than £30,000 and £18,000, respectively, to extinguish their benefits within the BBPF in exchange for a cash lump sum. The
acceptance of this offer by certain members and dependants gave rise to a settlement event resulting in a decrease in liabilities of
£1m (2015: £3m), which was recognised in other non-underlying items. Refer to Note 8.1.4.9.
On 1 July 2015, the Group established a Scottish Limited Partnership (SLP) structure into which its investment in Consort
Healthcare (Birmingham) Holdings Ltd (Consort Birmingham), which owns the Group’s 40% interest in the Birmingham Hospital PFI
investment, was transferred. The BBPF is a partner in the SLP and is entitled to a share of the income of the SLP. In accordance
with IFRS 10 Consolidated Financial Statements, the SLP is deemed to be controlled by the Group, which retains the ability to
substitute the investment in Consort Birmingham for other investments from time to time. On 29 December 2016 the Group
transferred into the SLP its investment in Holyrood Student Accommodation Holdings Ltd, which owns the Group’s 100% interest in
the Edinburgh student accommodation project.
Under IAS 19, the investment held by the BBPF in the SLP does not constitute a plan asset and therefore the pension deficit
presented in these financial statements does not reflect the BBPF’s interest in the SLP. Distributions from the SLP to the BBPF will
be reflected in the Group’s financial statements as pension contributions on a cash basis. The first distribution was received in
December 2015 and amounted to £1m. A further distribution was received in 2016 and amounted to £1m.
Alongside the establishment of the SLP, agreement was reached to make a series of deficit payments to the BBPF with the first
payment of £4m paid in 2016. A further £5m is due in 2017; £7m due in 2018; £9m due in 2019; £13m due in 2020; £17m due in
2021; £22m due in 2022; and £25m due in 2023.
A formal triennial funding valuation of the BBPF was carried out as at 31 March 2016. As a result, the Group agreed to make
ongoing deficit payments in addition to those set out above of £5m for the period from January 2017 to April 2017; £17m per
annum from April 2017; £19m per annum from April 2018; and £3m per annum from April 2020.
If the dividend cover ratio is below an agreed trigger level then the contributions set out above may need to be accelerated.
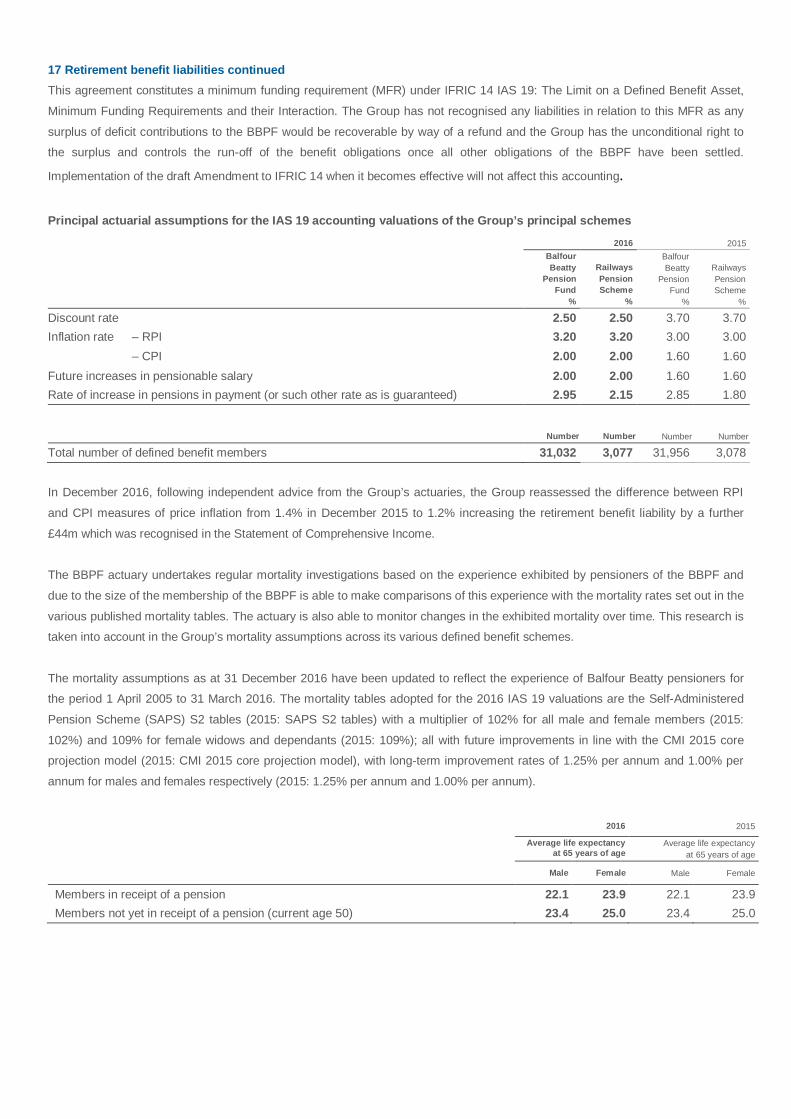
17 Retirement benefit liabilities continuedThis agreement constitutes a minimum funding requirement (MFR) under IFRIC 14 IAS 19: The Limit on a Defined Benefit Asset,
Minimum Funding Requirements and their Interaction. The Group has not recognised any liabilities in relation to this MFR as any
surplus of deficit contributions to the BBPF would be recoverable by way of a refund and the Group has the unconditional right to
the surplus and controls the run-off of the benefit obligations once all other obligations of the BBPF have been settled.
Implementation of the draft Amendment to IFRIC 14 when it becomes effective will not affect this accounting.
Principal actuarial assumptions for the IAS 19 accounting valuations of the Group’s principal schemes
2016 2015BalfourBeatty
PensionFund
%
RailwaysPensionScheme
%
BalfourBeatty
PensionFund
%
RailwaysPensionScheme
%
Discount rate 2.50 2.50 3.70 3.70Inflation rate – RPI 3.20 3.20 3.00 3.00
– CPI 2.00 2.00 1.60 1.60Future increases in pensionable salary 2.00 2.00 1.60 1.60Rate of increase in pensions in payment (or such other rate as is guaranteed) 2.95 2.15 2.85 1.80
Number Number Number Number
Total number of defined benefit members 31,032 3,077 31,956 3,078
In December 2016, following independent advice from the Group’s actuaries, the Group reassessed the difference between RPI
and CPI measures of price inflation from 1.4% in December 2015 to 1.2% increasing the retirement benefit liability by a further
£44m which was recognised in the Statement of Comprehensive Income.
The BBPF actuary undertakes regular mortality investigations based on the experience exhibited by pensioners of the BBPF and
due to the size of the membership of the BBPF is able to make comparisons of this experience with the mortality rates set out in the
various published mortality tables. The actuary is also able to monitor changes in the exhibited mortality over time. This research is
taken into account in the Group’s mortality assumptions across its various defined benefit schemes.
The mortality assumptions as at 31 December 2016 have been updated to reflect the experience of Balfour Beatty pensioners for
the period 1 April 2005 to 31 March 2016. The mortality tables adopted for the 2016 IAS 19 valuations are the Self-Administered
Pension Scheme (SAPS) S2 tables (2015: SAPS S2 tables) with a multiplier of 102% for all male and female members (2015:
102%) and 109% for female widows and dependants (2015: 109%); all with future improvements in line with the CMI 2015 core
projection model (2015: CMI 2015 core projection model), with long-term improvement rates of 1.25% per annum and 1.00% per
annum for males and females respectively (2015: 1.25% per annum and 1.00% per annum).
2016 2015
Average life expectancyat 65 years of age
Average life expectancyat 65 years of age
Male Female Male Female
Members in receipt of a pension 22.1 23.9 22.1 23.9Members not yet in receipt of a pension (current age 50) 23.4 25.0 23.4 25.0
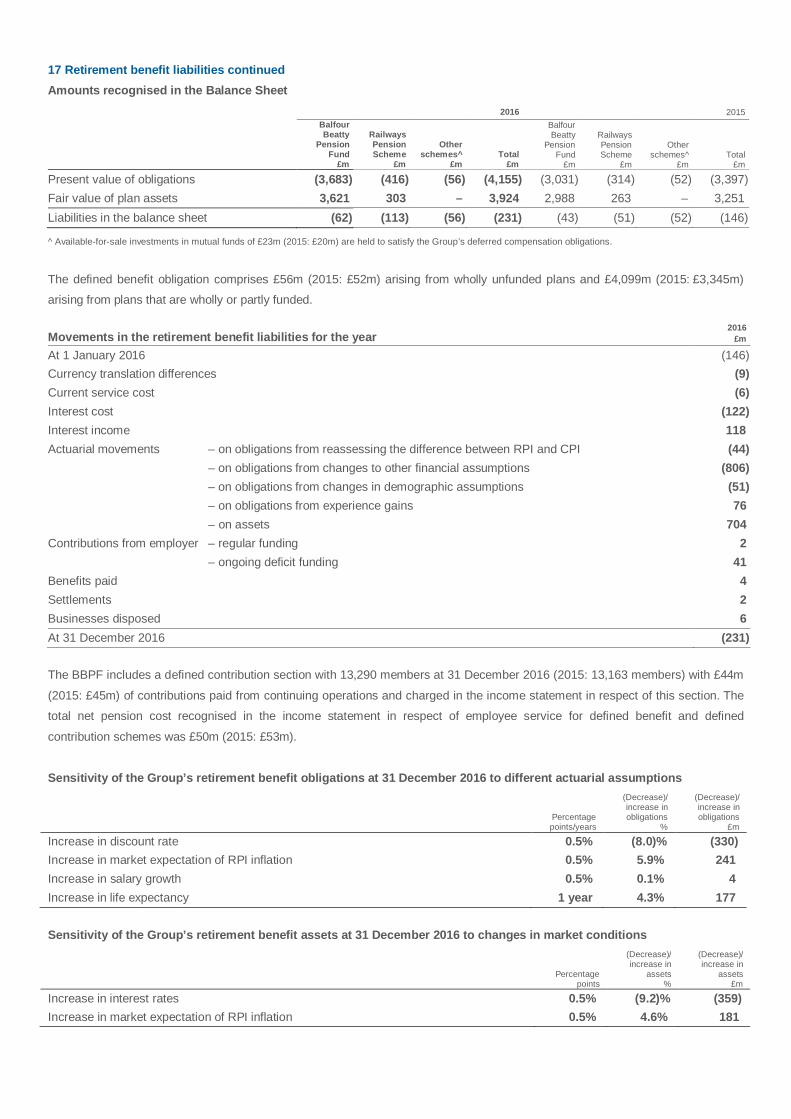
17 Retirement benefit liabilities continuedAmounts recognised in the Balance Sheet
2016 2015BalfourBeatty
PensionFund
£m
RailwaysPensionScheme
£m
Otherschemes^
£mTotal
£m
BalfourBeatty
PensionFund
£m
RailwaysPensionScheme
£m
Otherschemes^
£mTotal
£m
Present value of obligations (3,683) (416) (56) (4,155) (3,031) (314) (52) (3,397)Fair value of plan assets 3,621 303 – 3,924 2,988 263 – 3,251Liabilities in the balance sheet (62) (113) (56) (231) (43) (51) (52) (146)
^ Available-for-sale investments in mutual funds of £23m (2015: £20m) are held to satisfy the Group’s deferred compensation obligations.
The defined benefit obligation comprises £56m (2015: £52m) arising from wholly unfunded plans and £4,099m (2015: £3,345m)
arising from plans that are wholly or partly funded.
Movements in the retirement benefit liabilities for the year2016
£m
At 1 January 2016 (146)Currency translation differences (9)Current service cost (6)Interest cost (122)Interest income 118Actuarial movements – on obligations from reassessing the difference between RPI and CPI (44)
– on obligations from changes to other financial assumptions (806)– on obligations from changes in demographic assumptions (51)– on obligations from experience gains 76– on assets 704
Contributions from employer – regular funding 2– ongoing deficit funding 41
Benefits paid 4Settlements 2Businesses disposed 6At 31 December 2016 (231)
The BBPF includes a defined contribution section with 13,290 members at 31 December 2016 (2015: 13,163 members) with £44m
(2015: £45m) of contributions paid from continuing operations and charged in the income statement in respect of this section. The
total net pension cost recognised in the income statement in respect of employee service for defined benefit and defined
contribution schemes was £50m (2015: £53m).
Sensitivity of the Group’s retirement benefit obligations at 31 December 2016 to different actuarial assumptions
Percentagepoints/years
(Decrease)/increase inobligations
%
(Decrease)/increase inobligations
£m
Increase in discount rate 0.5% (8.0)% (330)Increase in market expectation of RPI inflation 0.5% 5.9% 241Increase in salary growth 0.5% 0.1% 4Increase in life expectancy 1 year 4.3% 177
Sensitivity of the Group’s retirement benefit assets at 31 December 2016 to changes in market conditions
Percentagepoints
(Decrease)/increase in
assets%
(Decrease)/increase in
assets£m
Increase in interest rates 0.5% (9.2)% (359)Increase in market expectation of RPI inflation 0.5% 4.6% 181
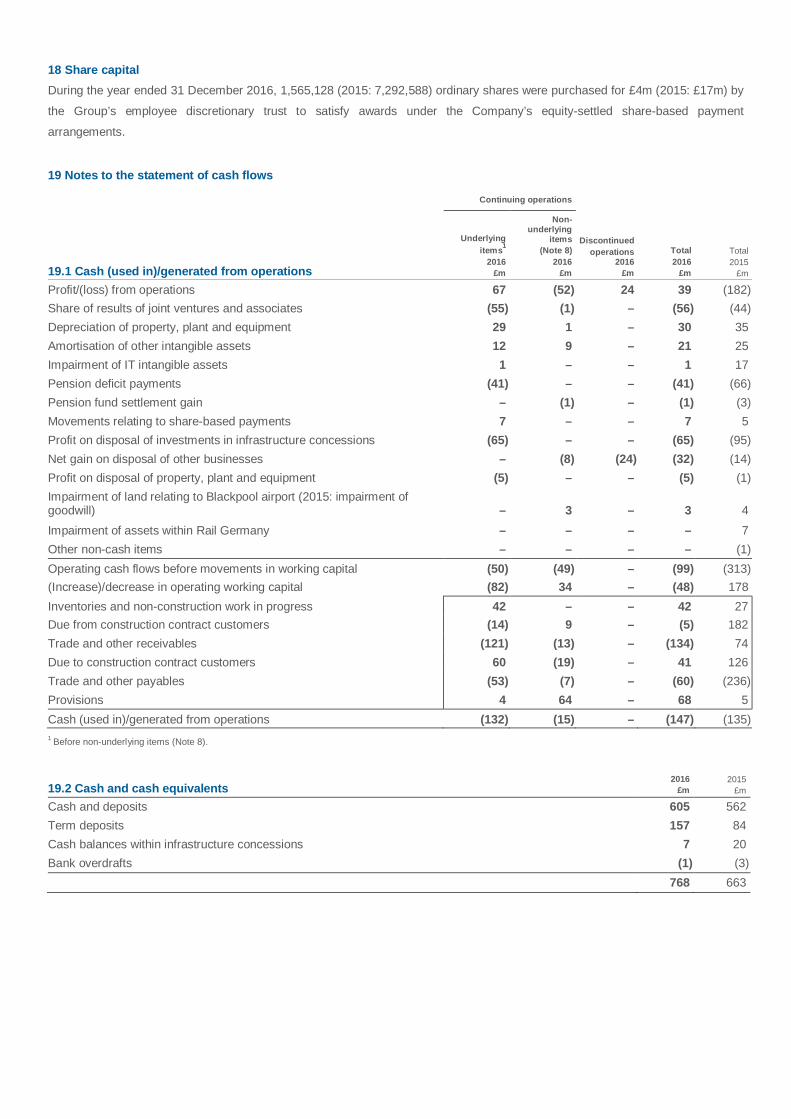
18 Share capitalDuring the year ended 31 December 2016, 1,565,128 (2015: 7,292,588) ordinary shares were purchased for £4m (2015: £17m) by
the Group’s employee discretionary trust to satisfy awards under the Company’s equity-settled share-based payment
arrangements.
19 Notes to the statement of cash flows
Continuing operations
19.1 Cash (used in)/generated from operations
Underlyingitems1
2016£m
Non-underlying
items(Note 8)
2016£m
Discontinuedoperations
2016£m
Total2016
£m
Total2015
£m
Profit/(loss) from operations 67 (52)))
24 39 (182)Share of results of joint ventures and associates (55) (1) – (56) (44)Depreciation of property, plant and equipment 29 1 – 30 35Amortisation of other intangible assets 12 9 – 21 25Impairment of IT intangible assets 1 – – 1 17Pension deficit payments (41) – – (41) (66)Pension fund settlement gain – (1) – (1) (3)Movements relating to share-based payments 7 – – 7 5Profit on disposal of investments in infrastructure concessions (65) – – (65) (95)Net gain on disposal of other businesses – (8) (24) (32) (14)Profit on disposal of property, plant and equipment (5) – – (5) (1)Impairment of land relating to Blackpool airport (2015: impairment ofgoodwill) – 3 – 3 4Impairment of assets within Rail Germany – – – – 7Other non-cash items – – – – (1)Operating cash flows before movements in working capital (50) (49) – (99) (313)(Increase)/decrease in operating working capital (82) 34 – (48) 178Inventories and non-construction work in progress 42 – – 42 27Due from construction contract customers (14) 9 – (5) 182Trade and other receivables (121) (13) – (134) 74Due to construction contract customers 60 (19) – 41 126Trade and other payables (53) (7) – (60) (236)Provisions 4 64 – 68 5Cash (used in)/generated from operations (132) (15) – (147) (135)1 Before non-underlying items (Note 8).
19.2 Cash and cash equivalents2016
£m2015
£m
Cash and deposits 605 562Term deposits 157 84Cash balances within infrastructure concessions 7 20Bank overdrafts (1) (3)
768 663
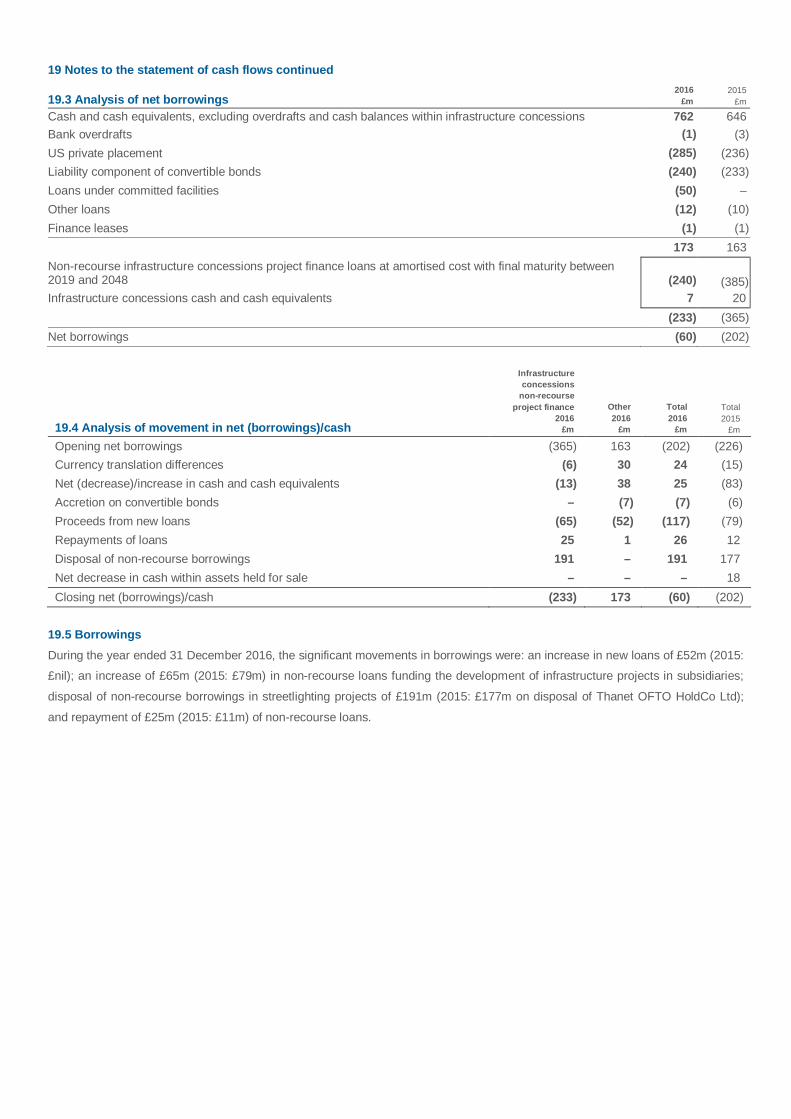
19 Notes to the statement of cash flows continued
19.3 Analysis of net borrowings2016
£m2015
£m
Cash and cash equivalents, excluding overdrafts and cash balances within infrastructure concessions 762 646Bank overdrafts (1) (3)US private placement (285) (236)Liability component of convertible bonds (240) (233)Loans under committed facilities (50) –Other loans (12) (10)Finance leases (1) (1)
173 163Non-recourse infrastructure concessions project finance loans at amortised cost with final maturity between2019 and 2048 (240) (385)Infrastructure concessions cash and cash equivalents 7 20
(233) (365)Net borrowings (60) (202)
19.4 Analysis of movement in net (borrowings)/cash
Infrastructureconcessions
non-recourseproject finance
2016£m
Other2016
£m
Total2016
£m
Total2015
£m
Opening net borrowings (365) 163 (202) (226)Currency translation differences (6) 30 24 (15)Net (decrease)/increase in cash and cash equivalents (13) 38 25 (83)Accretion on convertible bonds – (7) (7) (6)Proceeds from new loans (65) (52) (117) (79)Repayments of loans 25 1 26 12Disposal of non-recourse borrowings 191 – 191 177Net decrease in cash within assets held for sale – – – 18Closing net (borrowings)/cash (233) 173 (60) (202)
19.5 BorrowingsDuring the year ended 31 December 2016, the significant movements in borrowings were: an increase in new loans of £52m (2015:
£nil); an increase of £65m (2015: £79m) in non-recourse loans funding the development of infrastructure projects in subsidiaries;
disposal of non-recourse borrowings in streetlighting projects of £191m (2015: £177m on disposal of Thanet OFTO HoldCo Ltd);
and repayment of £25m (2015: £11m) of non-recourse loans.
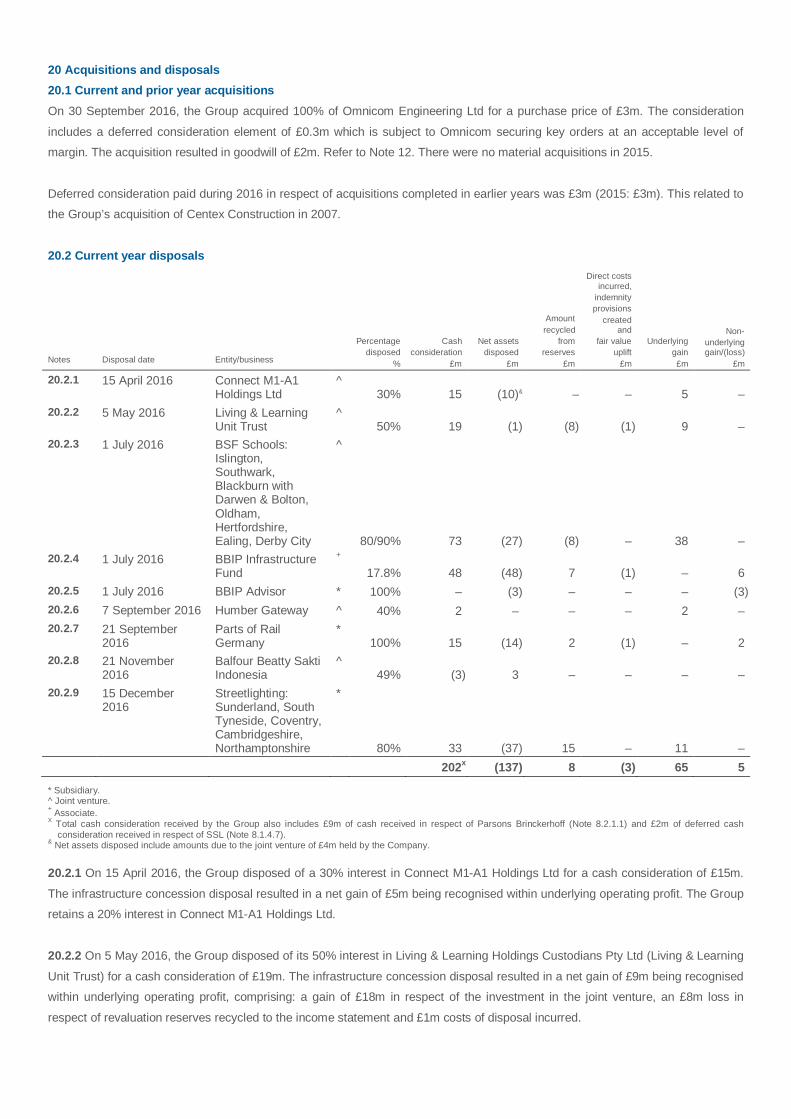
20 Acquisitions and disposals20.1 Current and prior year acquisitionsOn 30 September 2016, the Group acquired 100% of Omnicom Engineering Ltd for a purchase price of £3m. The consideration
includes a deferred consideration element of £0.3m which is subject to Omnicom securing key orders at an acceptable level of
margin. The acquisition resulted in goodwill of £2m. Refer to Note 12. There were no material acquisitions in 2015.
Deferred consideration paid during 2016 in respect of acquisitions completed in earlier years was £3m (2015: £3m). This related to
the Group’s acquisition of Centex Construction in 2007.
20.2 Current year disposals
Notes Disposal date Entity/business
Percentagedisposed
%
Cashconsideration
£m
Net assetsdisposed
£m
Amount recycled
fromreserves
£m
Direct costsincurred,
indemnityprovisions
createdand
fair valueuplift £m
Underlying gain £m
Non-underlyinggain/(loss)
£m
20.2.1 15 April 2016 Connect M1-A1Holdings Ltd
^30% 15 (10)& – – 5 –
20.2.2 5 May 2016 Living & LearningUnit Trust
^50% 19 (1) (8) (1) 9 –
20.2.3 1 July 2016 BSF Schools:Islington,Southwark,Blackburn withDarwen & Bolton,Oldham,Hertfordshire,Ealing, Derby City
^
80/90% 73 (27) (8) – 38 –20.2.4 1 July 2016 BBIP Infrastructure
Fund+
17.8% 48 (48) 7 (1) – 620.2.5 1 July 2016 BBIP Advisor * 100% – (3) – – – (3)20.2.6 7 September 2016 Humber Gateway ^ 40% 2 – – – 2 –20.2.7 21 September
2016Parts of RailGermany
*100% 15 (14) 2 (1) – 2
20.2.8 21 November2016
Balfour Beatty SaktiIndonesia
^49% (3) 3 – – – –
20.2.9 15 December2016
Streetlighting:Sunderland, SouthTyneside, Coventry,Cambridgeshire,Northamptonshire
*
80% 33 (37) 15 – 11 –202x (137) 8 (3) 65 5
* Subsidiary.^ Joint venture.+ Associate.X Total cash consideration received by the Group also includes £9m of cash received in respect of Parsons Brinckerhoff (Note 8.2.1.1) and £2m of deferred cash
consideration received in respect of SSL (Note 8.1.4.7).& Net assets disposed include amounts due to the joint venture of £4m held by the Company.
20.2.1 On 15 April 2016, the Group disposed of a 30% interest in Connect M1-A1 Holdings Ltd for a cash consideration of £15m.
The infrastructure concession disposal resulted in a net gain of £5m being recognised within underlying operating profit. The Group
retains a 20% interest in Connect M1-A1 Holdings Ltd.
20.2.2 On 5 May 2016, the Group disposed of its 50% interest in Living & Learning Holdings Custodians Pty Ltd (Living & Learning
Unit Trust) for a cash consideration of £19m. The infrastructure concession disposal resulted in a net gain of £9m being recognised
within underlying operating profit, comprising: a gain of £18m in respect of the investment in the joint venture, an £8m loss in
respect of revaluation reserves recycled to the income statement and £1m costs of disposal incurred.
20 Acquisitions and disposals continued20.2.3 On 1 July 2016, the Group disposed of its entire interest in seven BSF (Building Schools for the Future) projects: Islington,
Southwark, Blackburn with Darwen & Bolton, Oldham, Hertfordshire, Ealing and Derby City for a cash consideration of £73m. On
this date, the Group ceased to jointly control these BSF projects by virtue of a put/call structure with a preferred bidder. The
disposal completed on 22 August 2016. The infrastructure concession disposal resulted in a net gain of £38m being recognised
within underlying operating profit, comprising: a gain of £46m in respect of the investments in the joint ventures and an £8m loss in
respect of revaluation reserves recycled to the income statement.
20.2.4 On 1 July 2016, the Group disposed of its 17.8% interest in the BBIP Infrastructure Fund for an initial cash consideration of
£48m. The disposal resulted in a net gain of £6m being recognised within non-underlying operating profit, comprising: a gain of £nil
in respect of the investment in the associated undertaking, a £7m gain in respect of revaluation reserves recycled to the income
statement and £1m costs of disposal incurred.
20.2.5 On 1 July 2016, the Group disposed of its 100% interest in the BBIP Advisor for a cash consideration of £nil. The disposal
resulted in a net loss of £3m being recognised within non-underlying operating profit, comprising a loss of £3m in respect of the
investment in the subsidiary.
20.2.6 On 7 September 2016, the Group disposed of its right to a 40% interest in Humber Gateway OFTO Holdings Ltd. The
infrastructure concession disposal resulted in a net gain of £2m being recognised within underlying operating profit comprising a
£2m fee received on disposing of the Group’s interest. The Group retains a 20% interest in Humber Gateway OFTO Holdings Ltd.
20.2.7 On 21 September 2016, as part of the ongoing process to exit the Mainland European rail business, the Group disposed of
part of its Rail business in Germany to Tianjin Keyvia Electric Co Ltd for a cash consideration of £15m. This sale resulted in a £2m
gain as a result of recycling of foreign currency reserves. The related assets disposed were impaired by £11m in 2015 to reflect the
value of the agreed consideration which was recognised within non-underlying items (refer to Note 8.1.4.8). The disposal included
cash disposed of £10m.
20.2.8 On 21 November 2016, the Group reached agreement to dispose of its 49% interest in Balfour Beatty Sakti Indonesia to its
joint venture partner for a payment by the Group of £3m reflecting the Group’s share of the net liabilities of the joint venture. This
has been recognised as a disposal in the year as completion of the sale is not subject to any substantive terms at the year end.
The amount due to the purchaser has been recognised in amounts due on disposal within trade and other payables (refer to Note
16).
20.2.9 On 16 December 2016, the Group disposed of 80% interests in five streetlighting projects for a cash consideration of £33m.
This infrastructure concession disposal resulted in a net gain of £11m being recognised within underlying operating profit,
comprising: a loss of £4m in respect of the investments in subsidiaries and a £15m gain in respect of fair value reserves recycled to
the income statement. The Group retains 20% interests in the infrastructure concession projects which are accounted for as joint
ventures under the equity method. The disposal included cash disposed of £16m.
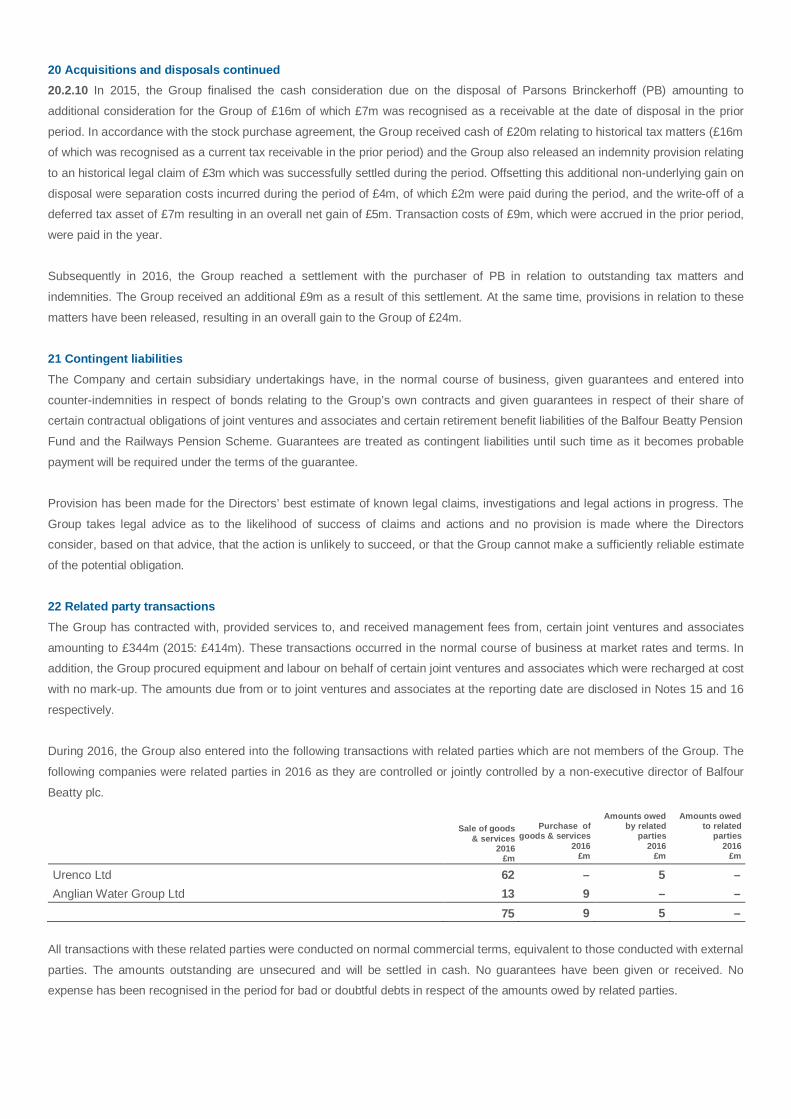
20 Acquisitions and disposals continued20.2.10 In 2015, the Group finalised the cash consideration due on the disposal of Parsons Brinckerhoff (PB) amounting to
additional consideration for the Group of £16m of which £7m was recognised as a receivable at the date of disposal in the prior
period. In accordance with the stock purchase agreement, the Group received cash of £20m relating to historical tax matters (£16m
of which was recognised as a current tax receivable in the prior period) and the Group also released an indemnity provision relating
to an historical legal claim of £3m which was successfully settled during the period. Offsetting this additional non-underlying gain on
disposal were separation costs incurred during the period of £4m, of which £2m were paid during the period, and the write-off of a
deferred tax asset of £7m resulting in an overall net gain of £5m. Transaction costs of £9m, which were accrued in the prior period,
were paid in the year.
Subsequently in 2016, the Group reached a settlement with the purchaser of PB in relation to outstanding tax matters and
indemnities. The Group received an additional £9m as a result of this settlement. At the same time, provisions in relation to these
matters have been released, resulting in an overall gain to the Group of £24m.
21 Contingent liabilitiesThe Company and certain subsidiary undertakings have, in the normal course of business, given guarantees and entered into
counter-indemnities in respect of bonds relating to the Group’s own contracts and given guarantees in respect of their share of
certain contractual obligations of joint ventures and associates and certain retirement benefit liabilities of the Balfour Beatty Pension
Fund and the Railways Pension Scheme. Guarantees are treated as contingent liabilities until such time as it becomes probable
payment will be required under the terms of the guarantee.
Provision has been made for the Directors’ best estimate of known legal claims, investigations and legal actions in progress. The
Group takes legal advice as to the likelihood of success of claims and actions and no provision is made where the Directors
consider, based on that advice, that the action is unlikely to succeed, or that the Group cannot make a sufficiently reliable estimate
of the potential obligation.
22 Related party transactionsThe Group has contracted with, provided services to, and received management fees from, certain joint ventures and associates
amounting to £344m (2015: £414m). These transactions occurred in the normal course of business at market rates and terms. In
addition, the Group procured equipment and labour on behalf of certain joint ventures and associates which were recharged at cost
with no mark-up. The amounts due from or to joint ventures and associates at the reporting date are disclosed in Notes 15 and 16
respectively.
During 2016, the Group also entered into the following transactions with related parties which are not members of the Group. The
following companies were related parties in 2016 as they are controlled or jointly controlled by a non-executive director of Balfour
Beatty plc.
Sale of goods& services
2016£m
Purchase ofgoods & services
2016£m
Amounts owedby related
parties2016
£m
Amounts owedto related
parties2016
£m
Urenco Ltd 62 – 5 –Anglian Water Group Ltd 13 9 – –
75 9 5 –
All transactions with these related parties were conducted on normal commercial terms, equivalent to those conducted with external
parties. The amounts outstanding are unsecured and will be settled in cash. No guarantees have been given or received. No
expense has been recognised in the period for bad or doubtful debts in respect of the amounts owed by related parties.
23 Principal risks and uncertaintiesThe nature of the principal risks and uncertainties which could adversely impact the Group’s profitability and ability to achieve its
strategic objectives include: external risks arising from the effects of national or market trends and political change and the complex
and evolving legal and regulatory environments in which the Group operates; strategic risks which may arise as the Group moves
into new territories and expands through acquisitions; organisation and management risks including business conduct and people
related risks; and operational risks arising from bidding, project execution, supply chain and health, safety and sustainability
matters.
The Directors do not consider that the nature of the principal risks and uncertainties facing the Group has fundamentally changed
since the publication of the Annual Report and Accounts 2015.
The transformation of Balfour Beatty over the last two years means that management has much greater visibility and control over
the business than was the case prior to Build to Last. This means that the strengthened leadership team is much better positioned
to adjust and respond to changes in market conditions in the UK or elsewhere.
Skills shortages within construction have been a challenge for several years. The UK’s decision to leave the European Union with
the potential for reduction in free movement of people is likely to exacerbate the situation at a time when demand for skilled workers
will increase given the pipeline of projects due to start in the coming years.
24 Events after the reporting dateOn 26 January 2017, the Group reached agreement to sell its 49% interests in Dutco Balfour Beatty LLC and BK Gulf LLC to its
joint venture partner for a total cash consideration of £11m. The sale subsequently completed on 1 March 2017. The Group’s
investment in these entities did not satisfy the criteria under IFRS 5 Non-current Assets Held for Sale and Discontinued
Operations at the balance sheet date and therefore continued to be presented within the Group’s underlying continuing
operations. Following the agreement to sell in January 2017, the criteria under IFRS 5 are now satisfied and therefore the
Group’s share of results in these entities will be presented as part of its discontinued operations with comparatives restated
accordingly in its 2017 financial statements. The impact of the disposal will be presented as non-underlying within discontinued
operations.