
Balancing the plate motion budget in the South Island, New...
21
Geophys. J. Int. (2006) doi: 10.1111/j.1365-246X.2006.03183.x GJI Tectonics and geodynamics Balancing the plate motion budget in the South Island, New Zealand using GPS, geological and seismological data Laura M. Wallace, 1 John Beavan, 1 Robert McCaffrey, 2 Kelvin Berryman 1 and Paul Denys 3 1 GNS Science, PO Box 30368, Lower Hutt, New Zealand. E-mails: [email protected]; [email protected]; [email protected] 2 Department of Earth and Environmental Sciences, Rensselaer Polytechnic Inst, Troy, NY, USA. E-mail: [email protected] 3 School of Surveying, University of Otago, 310 Castle St., Dunedin, New Zealand. E-mail: [email protected] Accepted 2006 August 11. Received 2006 August 10; in original form 2005 November 1 SUMMARY The landmass of New Zealand exists as a consequence of transpressional collision between the Australian and Pacific plates, providing an excellent opportunity to quantify the kinematics of deformation at this type of tectonic boundary. We interpret GPS, geological and seismological data describing the active deformation in the South Island, New Zealand by using an elastic, rotating block approach that automatically balances the Pacific/Australia relative plate motion budget. The data in New Zealand are fit to within uncertainty when inverted simultaneously for angular velocities of rotating tectonic blocks and the degree of coupling on faults bounding the blocks. We find that most of the plate motion budget has been accounted for in previous geological studies, although we suggest that the Porter’s Pass/Amberley fault zone in North Canterbury, and a zone of faults in the foothills of the Southern Alps may have slip rates about twice that of the geological estimates. Up to 5 mm yr −1 of active deformation on faults distributed within the Southern Alps <100 km to the east of the Alpine Fault is possible. The role of tectonic block rotations in partitioning plate boundary deformation is less pronounced in the South Island compared to the North Island. Vertical axis rotation rates of tectonic blocks in the South Island are similar to that of the Pacific Plate, suggesting that edge forces dominate the block kinematics there. The southward migrating Chatham Rise exerts a major influence on the evolution of the New Zealand plate boundary; we discuss a model for the development of the Marlborough fault system and Hikurangi subduction zone in the context of this migration. Key words: deformation, fault slip, geodynamics, GPS, New Zealand, tectonics. 1 INTRODUCTION GPS-derived site velocities within wide-plate boundary zones help to quantify where strain is accumulating and how slip is partitioned in such zones. Accurate knowledge of the motion of the bound- ing plates from GPS-derived site velocities allows quantification of the total ‘plate motion budget’ that must be accommodated within the plate boundary zone. Unfortunately, it is not uncommon for multiple tectonic interpretations to fit the GPS data sets equally well at plate boundary zones (e.g. Wallace et al. 2004a). This non- uniqueness is due to trade-offs among the various sources of sur- face velocities in the plate boundary zone, and is particularly trou- blesome adjacent to subduction zones and in regions with many closely spaced active faults. However, when geodetic data from a plate boundary zone are interpreted in conjunction with Quaternary fault slip rates (from geological studies) and fault slip azimuth data (usually in the form of earthquake slip vectors), we can significantly narrow the range of viable kinematic models. An approach for inte- grating these datasets is to assess them in terms of rotating, elastic tectonic blocks (e.g. McCaffrey 1995, 2002). Fault slip rate and az- imuth data provide information about the relative motion between the blocks (Morgan 1968) while GPS-derived site velocities provide information on rates, azimuths, reference frame, and interseismic coupling on faults bounding the blocks. New Zealand, which occupies the boundary zone between the Pa- cific and Australian plates (Fig. 1), is well-suited for using GPS, geo- logical, and earthquake slip vector data to study how plate boundary deformation is accommodated. Repeated campaign-style GPS mea- surements have been conducted at more than 800 points throughout the country since the early 1990’s (e.g. Beavan et al. 1999; Beavan & Haines 2001; Darby & Beavan 2001; Wallace et al. 2004a, Fig. 2). Active faulting studies have been conducted for decades in New Zealand (e.g. Wellman 1953; Lensen 1968; Berryman et al. 1992; Van Dissen & Berryman 1996) and have yielded a com- prehensive dataset of fault slip rates (GNS active faults database: http://data.gns.cri.nz/af/). Seismologists have utilized both histori- cal data from earthquakes over the last 100 yr (e.g. Doser et al. 1999; Doser & Webb 2003), and modern data collected in the last 50 yr C 2006 The Authors 1 Journal compilation C 2006 RAS
Transcript of Balancing the plate motion budget in the South Island, New...

November 17, 2006 20:55 Geophysical Journal International gji3183
Geophys. J. Int. (2006) doi: 10.1111/j.1365-246X.2006.03183.x
GJI
Tec
toni
csan
dge
ody
nam
ics
Balancing the plate motion budget in the South Island, New Zealandusing GPS, geological and seismological data
Laura M. Wallace,1 John Beavan,1 Robert McCaffrey,2 Kelvin Berryman1
and Paul Denys3
1GNS Science, PO Box 30368, Lower Hutt, New Zealand. E-mails: [email protected]; [email protected]; [email protected] of Earth and Environmental Sciences, Rensselaer Polytechnic Inst, Troy, NY, USA. E-mail: [email protected] of Surveying, University of Otago, 310 Castle St., Dunedin, New Zealand. E-mail: [email protected]
Accepted 2006 August 11. Received 2006 August 10; in original form 2005 November 1
S U M M A R YThe landmass of New Zealand exists as a consequence of transpressional collision between theAustralian and Pacific plates, providing an excellent opportunity to quantify the kinematics ofdeformation at this type of tectonic boundary. We interpret GPS, geological and seismologicaldata describing the active deformation in the South Island, New Zealand by using an elastic,rotating block approach that automatically balances the Pacific/Australia relative plate motionbudget. The data in New Zealand are fit to within uncertainty when inverted simultaneouslyfor angular velocities of rotating tectonic blocks and the degree of coupling on faults boundingthe blocks. We find that most of the plate motion budget has been accounted for in previousgeological studies, although we suggest that the Porter’s Pass/Amberley fault zone in NorthCanterbury, and a zone of faults in the foothills of the Southern Alps may have slip ratesabout twice that of the geological estimates. Up to 5 mm yr−1 of active deformation on faultsdistributed within the Southern Alps <100 km to the east of the Alpine Fault is possible. Therole of tectonic block rotations in partitioning plate boundary deformation is less pronouncedin the South Island compared to the North Island. Vertical axis rotation rates of tectonic blocksin the South Island are similar to that of the Pacific Plate, suggesting that edge forces dominatethe block kinematics there. The southward migrating Chatham Rise exerts a major influenceon the evolution of the New Zealand plate boundary; we discuss a model for the developmentof the Marlborough fault system and Hikurangi subduction zone in the context of this migration.
Key words: deformation, fault slip, geodynamics, GPS, New Zealand, tectonics.
1 I N T RO D U C T I O N
GPS-derived site velocities within wide-plate boundary zones helpto quantify where strain is accumulating and how slip is partitionedin such zones. Accurate knowledge of the motion of the bound-ing plates from GPS-derived site velocities allows quantification ofthe total ‘plate motion budget’ that must be accommodated withinthe plate boundary zone. Unfortunately, it is not uncommon formultiple tectonic interpretations to fit the GPS data sets equallywell at plate boundary zones (e.g. Wallace et al. 2004a). This non-uniqueness is due to trade-offs among the various sources of sur-face velocities in the plate boundary zone, and is particularly trou-blesome adjacent to subduction zones and in regions with manyclosely spaced active faults. However, when geodetic data from aplate boundary zone are interpreted in conjunction with Quaternaryfault slip rates (from geological studies) and fault slip azimuth data(usually in the form of earthquake slip vectors), we can significantlynarrow the range of viable kinematic models. An approach for inte-grating these datasets is to assess them in terms of rotating, elastic
tectonic blocks (e.g. McCaffrey 1995, 2002). Fault slip rate and az-imuth data provide information about the relative motion betweenthe blocks (Morgan 1968) while GPS-derived site velocities provideinformation on rates, azimuths, reference frame, and interseismiccoupling on faults bounding the blocks.
New Zealand, which occupies the boundary zone between the Pa-cific and Australian plates (Fig. 1), is well-suited for using GPS, geo-logical, and earthquake slip vector data to study how plate boundarydeformation is accommodated. Repeated campaign-style GPS mea-surements have been conducted at more than 800 points throughoutthe country since the early 1990’s (e.g. Beavan et al. 1999; Beavan& Haines 2001; Darby & Beavan 2001; Wallace et al. 2004a,Fig. 2). Active faulting studies have been conducted for decadesin New Zealand (e.g. Wellman 1953; Lensen 1968; Berryman et al.1992; Van Dissen & Berryman 1996) and have yielded a com-prehensive dataset of fault slip rates (GNS active faults database:http://data.gns.cri.nz/af/). Seismologists have utilized both histori-cal data from earthquakes over the last 100 yr (e.g. Doser et al. 1999;Doser & Webb 2003), and modern data collected in the last 50 yr
C© 2006 The Authors 1Journal compilation C© 2006 RAS

November 17, 2006 20:55 Geophysical Journal International gji3183
2 L. M. Wallace et al.
Figure 1. Regional tectonic setting of New Zealand (orange: shallow; blue: deep). MFS: Marlborough Fault System; NIDFB: North Island Dextral Fault Belt;TVZ; Taupo Volcanic Zone; BR denotes approximate location of shortening-related faults of the Buller region. Thin, black lines in the onland portion are activefault traces. Black arrows show Pacific/Australia relative convergence (e.g. Beavan et al. 2002).
166˚ 168˚ 170˚ 172˚ 174˚ 176˚ 178˚
−48˚
−46˚
−44˚
−42˚
−40˚
−38˚
0 50 100
km
30 mm yr−1
Figure 2. Velocities at GPS observation points in New Zealand, relativeto the Australian Plate. Uncertainty ellipses are at 95 per cent confidencelevel.
(e.g. Anderson et al. 1993; Webb & Anderson 1998) to estimateearthquake source parameters for seismic events occurring in NewZealand.
As in our interpretation of the GPS velocity field and other datafrom the North Island (Wallace et al. 2004a), we use the elastic,rotating block approach (e.g. McCaffrey 2002) to integrate GPS,geological, and seismological data from the South Island of NewZealand. We include the Pacific-Australian relative plate motion(Beavan et al. 2002) as a fixed boundary condition in our kinematicmodel. We then use the model to quantify possible rates of faultingin regions where fault slip rates are not well-known. We also esti-mate the degree of interseismic coupling (defined in Section 4.0)on faults bounding the tectonic blocks, which has implications forseismic hazard assessment in New Zealand. Because the style ofdeformation varies significantly along strike of the plate boundary,with subduction, strike-slip, and oblique collision all represented,we are particularly interested in how the mode of slip partitioningchanges along strike. For example, how do the roles of block ro-tation and faulting in slip partitioning vary along strike? We alsodiscuss possible driving mechanisms for the observed block rota-tions in the South Island and explore the role of the migration ofbuoyant continental fragments in the evolution of the New Zealandplate boundary.
2 N E W Z E A L A N D ’ S T E C T O N I CS E T T I N G
The Australian and Pacific plates converge obliquely at 48–39 mm yr−1 in New Zealand. Partly due to along strike variations
C© 2006 The Authors, GJI
Journal compilation C© 2006 RAS

November 17, 2006 20:55 Geophysical Journal International gji3183
Balancing the plate motion budget, South Island, New Zealand 3
166˚ 167˚ 168˚ 169˚ 170˚ 171˚ 172˚ 173˚ 174˚ 175˚
−47˚
−46˚
−45˚
−44˚
−43˚
−42˚
−41˚
−40˚
WanganuiBlock (WANG)
Canterbury/OtagoBlock (CANT)
Fiord
land
Block
(FIO
R)
North Canterbury
Block (NCAN)
Cloudy Bay Block (CBAY)
IKAI SKAI
Pacific Plate (PACI)
Australian Plate (AUST)
Puysegur Sliv
er (PUYS)
Alpine Fault
HF
CF
AF
WF
Fiordland subduction zone
JTKF
BRF
Kaikoura
Dunedin
PPAFZ
DFNCPG
OFIC
FP
LHFC
CS
Canterbury PlainsHaast
MS
Wanganui Basin
Southern
Alps
Block
Southland block?
??
HAF
MFZ
AKF
Figure 3. Tectonic block configuration used in this paper; heavy graylines show block boundaries. Block names are shown in bold italics. Sur-face traces of known active faults (from GNS’s active faults database;http://data.gns.cri.nz/af) are also shown as thin black lines (and some arelabeled). Key to abbreviations: AF: Awatere Fault; AKF: Akatore Fault;BRF: Buller region faults; CS: Cook Strait; DF: Dunstan Fault; FC: For-est Creek Fault; FP; Fox Peak Fault; HAF: Haurako Fault; HF: HopeFault; IC: Irishman’s Creek Fault; IKAI: Inland Kaikoura block; JT: JordanThrust; KF: Kekerengu Fault; LH: Lake Heron Fault; MFZ: Moonlight FaultZone; MS: Milford Sound; NC: Nevis-Cadrona Fault; OF: Ostler Fault; PG:Pisa-Grandview Fault; PPAFZ: Porter’s Pass-Amberley Fault Zone; SKAI:Seaward Kaikoura block; WF: Wairau fault.
in the orientations of both the plate boundary and the direction ofrelative motion between the plates, the deformation takes on a largerstrike-slip component southward. Accordingly, the style of deforma-tion changes southwards from subduction of the Pacific Plate andbackarc rifting in the North Island, to nearly pure strike-slip in theMarlborough region, to oblique convergence in the central SouthIsland (causing formation of the central Southern Alps), and backto subduction of the Australian Plate at the Fiordland subductionzone in the southwestern South Island (Figs 1 and 3).
In the North Island, active tectonics are dominated by subductionof the Hikurangi Plateau (part of the Pacific Plate) beneath the east-ern North Island at the Hikurangi Trough. North of 39◦S, backarcrifting in the Taupo Volcanic Zone (TVZ) occurs (Fig. 1), while inthe southern half of the North Island upper plate deformation is dom-inated by shortening and strike-slip. Subduction eventually ceasesadjacent to where the thick continental crust of the Chatham Riseintersects the margin near 43◦S. The subducted Pacific lithosphereunderlies part of the northern South Island. An abrupt termination inintermediate depth seismicity beneath the Marlborough fault system(MFS) may mark the southern end of the subducting Pacific Plate(Anderson & Webb 1994), although the location of this slab edgeis still debated (e.g. Anderson et al. 1994; Reyners & Robertson2004).
The MFS in the northern South Island is dominated by four strike-slip faults (some with a component of reverse slip in northern Marl-borough) that take up most of the relative plate motion: the Hope,
Clarence, Awatere, and Wairau faults (e.g. Van Dissen & Yeats 1991,fig. 3). The Awatere (Little et al. 1998; Benson et al. 2001), Clarence(Kneupfer 1992; Nicol & Van Dissen 2002) and Wairau (Berrymanet al. 1992; Zachariasen et al. 2006) faults each have Quaternary sliprates ranging from 4–8 mm yr−1, while the Hope fault is slipping at∼20 mm yr−1 (Cowan 1990; Van Dissen & Yeats 1991; Kneupfer1992; Langridge & Berryman 2005). There is a general decrease inage of the Marlborough faults southwards (e.g. Yeats & Berryman1987; Little & Jones 1998) that will be discussed later in connectionwith the evolution of the deforming zone (Section 6.3).
Slip on the MFS is eventually transferred onto the predominantlydextral strike-slip Alpine fault in the central South Island. TheAlpine fault accommodates at least 70–75 per cent of the Pacific—Australia relative plate motion (e.g. Norris & Cooper 2001;Sutherland et al. 2006). A component of reverse slip on this fault islargely responsible for the growth of the Southern Alps. Paleoseis-mological studies in general indicate 27 ± 5 mm yr−1 of strike-slipand 5–10 mm yr−1 of dip-slip on the Alpine Fault (see review inNorris & Cooper 2001). The total dextral offset estimated on theAlpine Fault since its inception in the late Oligocene/early Miocene(e.g. Carter & Norris 1976; Cooper et al. 1987) is 480 km (reportedby Wellman in 1949, quoted by Benson, 1952).
The Alpine Fault continues south into the Fiordland region andtakes on a more purely strike-slip character (e.g. Hull & Berryman1986; Sutherland & Norris 1995), with most of the activity on awestern strand south of where where it goes offshore near MilfordSound (Barnes et al. 2005). Part of the Pacific/Australia conver-gence is accommodated on the Fiordland subduction zone, wherethe Australian Plate underthrusts the southwestern South Island.While several conceptual models for the 3-D configuration of thispart of the plate boundary have been suggested (e.g. Lebrun et al.2000; Reyners & Webb 2002; Malservisi et al. 2003), the Fiord-land region is arguably the least well-understood section of the NewZealand plate boundary zone.
3 DATA U S E D I N T H I S S T U DY
3.1 GPS data analysis
The GPS data we use for the North Island and northern South Islandare the same as those used by Wallace et al. (2004a). For the centraland lower South Island, we use data from 15 regional GPS defor-mation surveys conducted between 1994 and 2004. The pre-1995surveys in the Arthur’s Pass region are not used because of co-seismic and possible early postseismic deformation from the 1994Arthur’s Pass and 1995 Cass earthquakes (Arnadottir et al. 1995;Abercrombie et al. 2000). In each campaign, multiple sessions wereobserved where possible, with session lengths of 18–24 hr at moststations but as short as 7–8 hr in some cases. In the South Island,these shorter sessions occur only in some of the 1996 campaigns.The resulting network comprises about 800 stations distributed overthe country, with the greatest density of GPS sites in the southernNorth Island (Fig. 2).
The GPS phase data from all surveys were processed by stan-dard methods using Bernese software versions 3.5 through 4.2(Rothacher & Mervart 1996; Beutler et al. 2001) to determine dailyestimates of relative coordinates and their covariance matrices. Ofmore than 5000 station-days of data, about 3 per cent of stationobservations are rejected because they appear as outliers (residualsgreater than 3 standard errors) in single-survey variation of coor-dinate solutions. Some poorly-determined station observations are
C© 2006 The Authors, GJI
Journal compilation C© 2006 RAS

November 17, 2006 20:55 Geophysical Journal International gji3183
4 L. M. Wallace et al.
rejected as a result of observing sessions significantly less than 7 hr.The processing methods used to obtain relative coordinates, stationvelocities, and their uncertainties, and to place the velocities into anAustralia-fixed reference frame, are identical to those described byWallace et al. (2004a) so are not repeated here.
3.2 Other data used
In addition to the GPS data discussed above, we use GPS velocitiesof geodetic sites on the Pacific and Australian plates (Beavan et al.2002). These velocities help to establish an Australian Plate refer-ence frame as well as providing a Pacific Plate velocity boundarycondition for the kinematic modelling. GPS velocities from siteson the interior of the Pacific and Australian plates provide the bestdata bearing on the current kinematics of those plates, and the GPS-derived kinematics are reasonably consistent with longer-term platemotions obtained from seafloor spreading studies (DeMets et al.1994; Sutherland 1995; Cande & Stock 2004). We also use a re-gional velocity solution (in the ITRF 2000 reference frame) thatwe submitted to the global strain-rate project (Holt et al. 2005).This velocity field includes a number of Pacific and Australian IGS(International GNSS Service) stations, together with New Zealandcontinuous and first-order campaign stations. Because of its nation-wide coverage and connection to regional IGS sites, this velocityfield improves the accuracy with which the various local campaignvelocity solutions are rotated into the Australia-fixed frame.
Earthquake slip vector azimuths on faults in the region are fromAnderson et al. (1993), Doser et al. (1999) and Reyners & Webb(2002) (Table 1). Estimates of long-term fault slip rates and az-imuths from major faults in the South Island (largely from activefault studies; Table 1) provide constraints on the kinematics of de-formation in the plate boundary zone. We also require that relativemotion across a block boundary should occur within a range ofdirections consistent with geological observations. The geologicalslip azimuths and earthquake slip vector azimuths are treated asnormally-distributed data, with 1σ uncertainties. In the case of faultslip rate estimates, where slip rates are often quoted as a range ofvalues, we usually treat them as uniformly distributed between thoseminimum/maximum values with some uncertainty on either side ofthose values (see Appendix B in McCaffrey, 2005 for detailed de-scriptions of the fitting functions). We assume this uncertainty tobe ∼25 per cent of the range of slip rates, in contrast to McCaffrey(2005) who assumes 50 per cent of the range in his study of westernUS block kinematics. In a few cases, we treat the geological sliprate data as a ‘hard constraint’, where a severe penalty is imposed ifthe model relative motion direction and rates fall outside the appro-priate range of values (these data also have a uniform distributionwithin the range). We use hard constraints (e.g. for the Marlboroughfaults, see Section 5.3) in cases where the GPS velocities can be fitby a variety of kinematic models; in such situations we rely on thegeological data to narrow the range of valid kinematic models. Thehard constraints are intended to overcome the statistical dominanceof the numerous GPS velocities on the parameter estimation. Allslip azimuth and slip rate data used, and whether they are treated asGaussian or uniformly distributed data, or as a hard constraint, aregiven in Table 1.
4 M O D E L L I N G A P P ROA C H
Interseismic deformation in the New Zealand plate boundary zoneis dominated by a number of factors, but primarily by interseismic
coupling on faults and rotation of tectonic blocks (e.g. Walcott 1984;Beavan et al. 1999; Beavan & Haines 2001; Darby & Beavan 2001;Wallace et al. 2004a). To interpret the South Island GPS velocityfield, we implement a method developed by McCaffrey (1995, 2002)that matches the GPS velocities with long-term rotations of tectonicblocks (represented here as spherical caps), and elastic strain due tocoupling on block-bounding faults. The non-linear inversion appliessimulated annealing to downhill simplex minimization (Press et al.1989) to simultaneously estimate the angular velocities of elasticblocks and coupling coefficients (defined below) on block-boundingfaults, to give the best fit to the GPS velocities, earthquake slipvectors, and geological fault slip rates and azimuths. We minimizedata misfit, defined by the reduced chi-squared statistic (χ2
n). Themethod also allows us to optimally rotate multiple GPS velocitysolutions into a common reference frame. In our case, we rotate theNew Zealand-derived GPS velocity fields (nine different solutions,discussed in Section 3.1), and the regional velocity solution that wesubmitted to the global strain rate project, into an Australian Platereference frame. Of the 873 GPS velocities available for this study,we remove 55 (6 per cent) that are clearly inconsistent with those ofneighbouring sites or have horizontal velocity uncertainties higherthan 3 mm yr−1.
We divide the South Island into multiple tectonic blocks basedon the locations of known, active faults (Fig. 3). Surface tracescompiled in Stirling et al. (2002) and fault dips from the relevantgeological and seismological studies define block-bounding faultgeometries. Faults are defined by an irregular grid of nodes that ex-tends both along strike and down dip (Fig. 5). In some cases, wherethe spatial density of GPS data are not sufficient to discriminatebetween multiple, nearby faults, our block boundaries are chosento approximate a zone of distributed deformation (e.g. the bound-ary between the Southern Alps/Southland and Canterbury/Otagoblocks, and the Porter’s Pass/Amberley Fault zone; Fig. 3). Whilethere is evidence for very slow deformation on faults (that we do notdefine) in the interiors of some of the tectonic blocks, the rates ofmotion on them are generally too low (�1 mm yr−1) to be detectableusing GPS techniques. However, in cases where distributed defor-mation on faults within a block might be significant, we invert foradditional parameters that describe uniform horizontal (permanent)strain rates within the block (e.g. Savage et al. 2001; McCaffrey2005), which allows the blocks themselves to undergo permanentdeformation. This is particularly helpful in the South Island, wherethere are areas of distributed active faulting scattered throughoutour chosen tectonic blocks (e.g. Little 2004), whose overall ratesof deformation may exceed 1 mm yr−1. In reality, there could benumerous, small-scale tectonic blocks in the South Island; however,the spatial distribution and uncertainties of our GPS velocities donot warrant such a complex model.
The short-term (interseismic) site velocities within a few tens ofkilometers of most faults are considerably less than the long-termvelocities expected from the relative motion of the adjacent tectonicblocks. This slowing is due to elastic strain adjacent to the faultcaused by the friction (sometimes called ‘locking’ or ‘coupling’)between the two sides of the fault. There is some controversy re-garding how to describe this phenomenon and what it means (Lay& Schwartz 2004; Wang & Dixon 2004). For our purposes we referto a purely kinematic quantity we call the ‘coupling coefficient’,φ, to describe the process whereby friction causes the fault to bestuck for long periods. If V is the long-term slip rate on the fault(over many earthquake cycles) and Vc the short-term creep rate (thesteady displacement rate across the fault surface over a short time,which may vary spatially), then φ = 1 − Vc/V . If φ = 0 the fault
C© 2006 The Authors, GJI
Journal compilation C© 2006 RAS

November 17, 2006 20:55 Geophysical Journal International gji3183
Balancing the plate motion budget, South Island, New Zealand 5
is creeping at the full long-term slip rate and if φ = 1 there is nocreep in the interseismic period. We represent fault slip behaviouras somewhere between those two extremes. In the case where φ
is neither 0 nor 1, one could interpret it as a spatial average ofcreeping and non-creeping patches (Scholz 1990; McCaffrey et al.2000a; Lay & Schwartz 2004). ‘φ’ is sometimes referred to as ‘in-terseismic coupling’ or ‘interplate coupling’ by other authors. Inthe inversion, we estimate φ at a grid of pre-defined nodes on theblock-bounding faults, allowing us to determine along-strike and
Table 1. Slip vector and fault slip rate data used in the inversion.
Block pairs Fault Longitude Latitude Data type Slip rate/azi data UNC Modelled value Source (see(see notes) used (mm yr−1 or ◦) (mm yr−1 or ◦) notes below)
SKAI-NCAN Hope 172.5 −42.57 GSR/HC 17–24 18.1 K88, K84, C89SKAI-NCAN Hope 173.47 −42.38 GSR/HC 18–36 18 VDY91CBAY-IKAI Awatere 173.86 −41.74 GSR/HC 4–8 5.7 B01IKAI-SKAI Clarence 173.0 −42.3 GSR/HC 4–8 5.3. VDY91IKAI-SKAI Clarence 172.13 −42.59 GSR/HC 4–8 5.4 VDY91WANG-CBAY Wairau 172.8 −41.8 GSR/UD 3–6 0.8 3.4 VDY91WANG-CBAY Wairau 172.8 −41.8 AZI EST/GD 60 10 65 VDY91WANG-CBAY Wairau 173.64 −41.55 GSR/UD 3–6 0.8 4.0 VDY91WANG-CBAY Wairau 173.64 −41.55 AZI EST/GD 103 17 99 MARLSSSKAI-NCAN Hope 172.29 −42.6 AZI EST/GD 70 10 69 MARLSSIKAI-CBAY Awatere 172.81 −42.16 AZI EST/GD 242 12 241 MARLSSIKAI-CBAY Awatere 173.54 −41.89 AZI EST/GD 240 10 239 MARLSSIKAI-SKAI Clarence 171.74 −42.59 AZI EST/GD 70 10 80 MARLSSNCAN-PACI Offshore 173 −42.8 AZI EST/GD 130 50 93 OSSHORT
KaikouraNCAN-PACI Offshore 174.17 −42.34 GSR EST/UD 1–8 1.8 8.7 OSSHORT
KaikouraNCAN-CANT PPAFZ 172.0 −43.28 GSR/HC 2–7 6.9 PPAFZESTNCAN-CANT PPAFZ 172.0 −43.28 AZI EST/GD 70 30 97 PPAFZESTCANT-PACI 172.5 −44.8 GSR/UD 0–1.5 0.3 1.3 OSSHORTCANT-PACI 174 −44 GSR/UD 0–1.5 0.3 1.6 OSSHORTCANT-PACI 170 −47 GSR/UD 0–1.5 0.3 2.6 OSSHORTCANT-PACI 172.5 −44.8 AZI EST/GD 100 50 20 OSSHORTSALP-CANT EALPF 168.3 −46.6 AZI EST/HC 30–150 31 EALPFESTSALP-CANT EALPF 169.4 −45.13 AZI EST/GD 35 115 78 EALPFESTSALP-CANT EALPF 169.4 −45.13 GSR EST/UD 0.5–5 1.1 3.7 EALPFESTSKAI-AUST Alpine F. 171.47 −42.73 GSR/UD/FP 8.5–11.8 2 14.6 BE92SKAI-AUST Alpine F. 171.47 −42.73 GSR/UD/SH 5.4–6.4 1 1.9 BE92AUST-SALP Alpine F. 170.5 −43.2 GSR/UD/FP 23–35 3 31.4 W97/98AUST-SALP Alpine F. 170.5 −43.2 GSR/UD/SH 4–7 1 4.3 W97/98AUST-SALP Alpine F. 170.1 −43.38 GSR/UD/FP 22–34 3 31.4 CN94AUST-SALP Alpine F. 170.1 −43.38 GSR/UD/SH 5–6 1 4.5 CN94AUST-SALP Alpine F. 170.05 −43.45 GSR/UD/FP 22–32 2.5 31.4 NC97AUST-SALP Alpine F. 170.05 −43.45 GSR/UD/SH 3.5–8 1.2 4.5 NC97PUYS-SALP Alpine F. 169.1 −43.9 GSR/UD/FP 21–32 2.6 24.9 CN95, BE98PUYS-SALP Alpine F. 169.1 −43.9 GSR/UD/SH 0.1–2 0.2 1.1 CN95PUYS-SALP Alpine F. 169.08 −43.92 GSR/UD/FP 24–32 2 24.9 BE98PUYS-SALP Alpine F. 169.08 −43.92 GSR/UD/SH 1.5–3 0.5 1.1 BE98PUYS-FIOR Alpine F. 168.05 −44.33 GSR/UD/FP 20–32 3 23.9 SN95PUYS-FIOR Alpine F. 168.05 −44.33 GSR/UD/SH 1–2 0.3 2.0 SN95PUYS-FIOR Alpine F. 168.03 −44.42 GSR/UD/FP 19–33 3.5 23.9 HB86, SN95PUYS-FIOR Alpine F. 168.03 −44.42 GSR/UD/SH 0.1–1.0 1.0 2.1 HB86, SN95AUST-PUYS FIORSZ 165.03 −46.06 EQSV/GD 110 20 112 A93PUYS-FIOR Alpine F. 166.87 −45.1 AZI EST/GD 45 10 47 SS-SALPFAUST-PUYS FIOR SZ 165.03 −46.06 EQSV/GD 290 20 292 A93AUST-FIOR FIOR SZ 166.88 −45.27 EQSV/GD 229 10 244 A93AUST-PUYS FIOR SZ 167.45 −44.67 EQSV/GD 268 18 285 A93CBAY-IKAI Awatere 172.74 −42.32 EQSV/GD 235 10 242 A93AUST-WANG Buller 171.67 −41.90 EQSV/GD 297 10 300 A93AUST-WANG Buller 171.58 −41.89 EQSV/GD 302 10 302 A93AUST-WANG Buller 171.96 −41.76 EQSV/GD 291 10 297 A93
down-dip variations in φ. Values of φ between the nodes are deter-mined by bi-linear interpolation. φ may also vary as a function oftime, but we consider it to be time-invariant over the ∼12 yr spanof our GPS data.
The relative motion (slip) vector (V ) on the faults is determinedby the Euler vectors describing the motions of the blocks on eitherside of the fault. The slip rate deficit vector on the fault is the scalarcoupling value φ multiplied by the relative motion vector Vbetweenthe two blocks at a given fault point. The elastic contribution to the
C© 2006 The Authors, GJI
Journal compilation C© 2006 RAS

November 17, 2006 20:55 Geophysical Journal International gji3183
6 L. M. Wallace et al.
Table 1. (Continued.)
Block pairs Fault Longitude Latitude Data type Slip rate/azi data UNC Modelled value Source (see(see notes) used (mm yr−1 or ◦) (mm yr−1 or ◦) notes below)
IKAI-SKAI Clarence 174.4 −41.63 EQSV/GD 254 15 235 A93SKAI-NCAN Hope 171.93 −42.79 EQSV/GD 244 10 249 D99SKAI-NCAN Hope 172.99 −42.48 EQSV/GD 244 12 250 D99AUST-PUYS FIORSZ 166.56 −45.11 EQSV/GD 289 10 288 R02
Notes: Key to Abbreviations: AZI: azimuth; HC; data treated as a hard constraint using a penalty function; EQSV: earthquake slip vector; GSR = geologicalslip rate; AZI EST: possible range of sense of motion across a fault system/block boundary; GD: data with uncertainties treated as a Gaussian distribution;UD: data range treated as a uniform distribution (see McCaffrey 2005, Appendix B for detailed discussion of UD and GD treatment); FP: Fault parallelcomponent of slip rate used; SH; horizontal shortening component of slip rate used; UNC: data uncertainties used for GD and UD cases; K88: Kneupfer(1988); K84: Kneupfer (1984); C89: Cowan (1989); VDY91: Van Dissen & Yeats (1991); B01: Benson et al. (2001); Y98: Yetton et al. (1998); BE92:Berryman et al. (1992); W97/98: Wright et al. (1997), Wright (1998); CN94: Cooper & Norris (1994); NC97: Norris & Cooper (1997); CN95: Cooper &Norris (1995); BE98: Berryman et al. (1998); SN95: Sutherland (1995); HB86 = Hull & Berryman (1986); A93: Anderson et al. (1993); D99: Doser et al.(1999); R02 = Reyners & Webb (2002); MARLSS: a range of azimuths consistent with domination of strike-slip on the faults in the Marlborough FaultSystem; OSSHORT: consistent with observations of slow shortening offshore N. Canterbury (Barnes 1996); PPAFZ: Porters Pass/Amberley Fault Zone;PPAFZEST: rough estimates of azimuth and rate of strike-slip and shortening on the PPAFZ, consistent with work by Berryman (1979), Kneupfer (1992),Cowan et al. (1996) and Pettinga et al. (2001). Note that we have allowed for the possibility that the slip rate in the PPAFZ could be higher than the geologicalestimates (2–5 mm yr−1), as the only published slip rate estimates available for the PPAFZ are for a few of the main faults within this zone. Thus, the total slipaccommodated across the PPAFZ could be somewhat higher; EALPF = zone of active faults in the eastern foothills of the Southern Alps, including theOstler, Irishman Creeks, and Fox Peak faults, among others; EALPFEST = rough GSR and AZI estimates for the Southern Alps’ eastern foothills faultsconsistent with slow shortening and/or strike-slip observed on these features; FIORSZ: Fiordland subduction thrust. All GSR data shown are in mm yr−1, andall EQSV and AZI EST are shown in degrees east of north for the first block relative to the second block. Key to block abbreviations: AUST: Australia; PACI:Pacific; SKAI: Seaward Kaikoura block; IKAI: Inland Kaikoura block; CBAY: Cloudy Bay block; NCAN: North Canterbury block; CANT: Canterbury/Otagoblock; SALP: Southern Alps/Southland block; FIOR: Fiordland block; PUYS: Puysegur block; WANG = Wanganui block.
velocity field from the fault slip rate deficit is calculated using aback-slip approach to elastic dislocation modelling (Savage 1983),using the formulations of Okada (1985) for surface displacementsdue to dislocations in an elastic, half-space. With this approach, thepre-defined geometry of the fault in the region where interseismiccoupling occurs influences the inversion result greatly, making itimportant to define realistic fault geometries where coupling mightoccur. In contrast, assumptions made about the geometry of thefault at depths where it creeps aseismically do not have an influ-ence on our results (e.g. we cannot differentiate whether or not thecreeping portion of the fault might project at depth as a vertical shearzone versus flattening out on a mid-crustal detachment). We also im-pose the constraint that φ decreases monotonically down-dip froma value of one (full interseismic coupling) at the surface to zeroat some depth, because terrestrial faults in New Zealand reveal noevidence for aseismic surface creep.
4.1 Tectonic block and fault configurations used for theSouth Island
In the northwestern South Island, the Wanganui block (discussedin Wallace et al. 2004a) also encompasses part of the southwesternNorth Island and the Wanganui Basin (Fig. 3). In the South Island,the western boundary of this block is defined by a distinctive seismiclineation through the Buller region associated with a zone of reversefaulting, and the eastern boundary is the Wairau Fault (WF). We alsodefine blocks between: (1) the Wairau and Awatere faults (AF) (the‘Cloudy Bay block’), (2) the Awatere and Clarence faults (CF) (the‘Inland Kaikoura block’; IKAI) and (3) the Clarence and Hope faults(HF) (the ‘Seaward Kaikoura block’; SKAI). Where the Hope Faultgoes offshore near Kaikoura, most of its slip is transferred onto theKekerengu Fault via the Jordan Thrust (JT; Van Dissen and Yeats,1991). Based on this, we use the Kekerengu Fault (KF) as the majorblock-bounding fault north of where motion slows on the Hope Fault.The Hope and Kekerengu faults provide a northwestern boundary for
a ‘North Canterbury block’ whose southeastern boundary projectsroughly through the Porter’s Pass/Amberley Fault Zone (PPAFZ).For this paper, we do not attempt to connect the Hope, Clarence, andAwatere faults with strike-slip faults in the southern North Island,hence the arbitrary tectonic block boundary between the North andSouth Island in our model (with the exception of the Wanganuiblock). It is presently unclear how and if these faults connect acrossCook Strait (e.g. Carter et al. 1988). We use estimates from surfacegeological studies for the dips of the Marlborough faults to definethe block-bounding fault geometries at depth.
The Marlborough faults merge with the Alpine Fault, which is themajor block-bounding fault in the central South Island. To mergethe Alpine and Marlborough faults together at depth in the struc-tural model, and avoid overlapping fault segments, we truncate theMarlborough faults against the Alpine Fault where they intersect atthe surface, and the truncated ends of the Marlborough faults followthe plane of the Alpine Fault at depth.
The central Alpine Fault is set to dip 45◦–55◦ to the east, consis-tent with geological (Sibson et al. 1981) and seismological evidence(Davey et al. 1995; Kleffmann et al. 1998). In the central South Is-land, we consider the block to the west of the Alpine Fault to be partof the Australian Plate. It is possible that there is a small amountof plate boundary deformation just west of the central Alpine Fault(e.g. Rattenbury 1986); however, GPS sites west of the fault areinsufficient in areal coverage to accurately resolve slow motion ofa west coast block relative to the Australian Plate. The Quaternaryslip rate on the Alpine Fault (estimated from active faulting stud-ies) accounts for ∼75 per cent of Pacific/Australia relative motion(e.g. Norris & Cooper 2001); the remainder must be accommodatedelsewhere in the South Island.
Active deformation in the eastern foothills of the central South-ern Alps is characterized by oblique (dextral) contraction (Fig. 3;e.g. the Ostler (OF), Irishman Creek (IC), Fox Peak (FP), ForestCreek (FC), and Lake Heron (LH) faults; Van Dissen et al. 1994;Pettinga et al. 2001; Upton et al. 2004). To represent this defor-mation, we have chosen the eastern boundary of a ‘Southern Alps
C© 2006 The Authors, GJI
Journal compilation C© 2006 RAS

November 17, 2006 20:55 Geophysical Journal International gji3183
Balancing the plate motion budget, South Island, New Zealand 7
block’ to project roughly through this zone of active faults in theeastern foothills of the Southern Alps (Fig. 3). We use a single faultsurface to represent these known discontinuous faults because thespatial density of GPS velocities is insufficient to discriminate slipon multiple nearby faults. Because we place the eastern boundaryof the Southern Alps block on the eastern edge of the zone of activefaults in the Southern Alps foothills, we choose our block-boundingfault to dip to the west (beneath the zone of faults) in order to betterreplicate this zone of deformation. The Alpine fault constitutes thewestern boundary of the Southern Alps block.
It is possible that a separate ‘Southland block’ exists to the southof the Southern Alps block, partly based on the distinct modes ofdeformation observed within these two regions. However, due tothe sparsity of GPS data in Southland, and the lack of an obviousstructure/zone of faults forming a boundary between the Southlandand Southern Alps blocks, we treat these two blocks as a single com-posite block (Southern Alps/Southland block, or SALP block) formost of this study. However, in Section 5.5, we do address the pos-sibility that substantial internal deformation of the Southern Alpscrustal block occurs, and that the Southern Alps and Southlandblocks are separate entities. The eastern boundary of the compositeSALP block projects southwards through a zone (∼75 km wide) ofactive reverse faults in central Otago, including the Nevis-Cadrona(NC), Pisa-Grandview (PG), and Dunstan Faults (DF) (e.g. Bean-land & Barrow-Hurlbert 1988; Beanland & Berryman 1989, Fig. 3).Deformation on this part of the SALP boundary is very diffuse, andusing the block approach we aim only to estimate the total rate ofpossible deformation across this zone.
We define the ‘Canterbury/Otago block’ (CANT) between thedistributed zone of faulting in the foothills east of the SouthernAlps, and a somewhat arbitrary block boundary just off the eastcoast of the South Island largely to test the possibility that the east-ern South Island is not part of the Pacific Plate (e.g. Beavan et al.2002). There is also geological evidence for slow convergent de-formation near the east coast of the South Island (e.g. the AkatoreFault near Dunedin, Litchfield & Norris 2000, and along the edgeof the Canterbury Plains, Barrell et al. 1996) and offshore of northCanterbury (e.g. Barnes 1996).
In the Fiordland region, we define a ‘Fiordland block’ (FIOR)which is bounded on the east by a zone of faults including theHollyford and Haurako faults and the Moonlight Fault Zone (e.g.Norris & Carter 1982), and on the west by the southern portion ofthe Alpine Fault. The Alpine Fault becomes very steep and takes onnearly pure strike-slip motion in Fiordland and the region south ofHaast (e.g. Berryman et al. 1992; Sutherland & Norris 1995). Wealso define a narrow crustal block, the ‘Puysegur sliver’ (PUYS)between the Fiordland subduction zone trench and the Alpine Faultoffshore. We use the seismologically-defined configuration of theFiordland subduction zone (e.g. Eberhart-Phillips & Reyners 2001)to define the subduction zone fault bounding the northwestern sideof the Puysegur sliver.
5 I N V E R S I O N R E S U LT S
We present here the results for our best-fitting model based on theblock boundaries described in Section 4 and the data in Section 3.In Section 5.5 we discuss an alternative model that may be moreappropriate for the central Southern Alps region. We obtain an ex-cellent fit to GPS velocities, geological fault slip rates and azimuths,and earthquake slip vectors in the South Island (Fig. 4; Table 1). Inour best-fitting model the χ2
n = 1.17, indicating that the data are fit
at their level of uncertainty. We estimate 217 parameters (includ-ing 138 free parameters for angular velocities and fault couplingcoefficients for the North Island; see Wallace et al. 2004a) using818 horizontal GPS velocities (1636 observations), 30 earthquakeslip vectors/fault slip azimuths, and 35 geological slip rates. Thefree parameters include: three rotation parameters for each of 13tectonic blocks and 10 GPS datasets, three components of the strainrate tensor for two blocks (SALP and CHCH), and φ at 148 faultnodes. Our inversion results for the North Island are nearly the sameas those presented in Wallace et al. (2004a) with the exception thatthe slip rate deficit distribution on the Hikurangi subduction inter-face has changed slightly due to the inclusion of additional northernSouth Island GPS velocities.
Most of the South Island blocks rotate about distant poles(Table 2) in contrast to the North Island where rotation occurs aboutpoles located within a few hundred km of the blocks (Wallace et al.2004a). All the faults we use as block boundaries appear to be cou-pled to some degree in the interseismic period (Fig. 5), consistentwith the lack of evidence in New Zealand for faults with activesurface creep. The elastic (Fig. 6) and long-term tectonic rotation(Fig. 7) velocity components are both important contributors to theGPS velocity field, highlighting the need for simultaneous inversionof block rotations and fault coupling parameters. It is also neces-sary to invert the entire New Zealand GPS dataset simultaneously(including the North Island), as the velocities in one region are in-fluenced by faults from adjacent regions (for example, GPS sitevelocities in Marlborough are impacted by slip rate deficits on thenearby Hikurangi subduction zone and the Alpine Fault).
5.1 Fault slip rate deficit estimates
Substantial fault slip rate deficits are apparent on most major faults inthe South Island; elastic effects from fault slip rate deficits influencethe velocities at all GPS sites in the South Island (Figs 5 and 6). InMarlborough, we obtain φ values of 0.9 for the Awatere, and 0.6for the Clarence fault to a depth of 13 km. The φ estimates on theHope and Wairau faults are 0.8–0.9 down to 20 km depth, possiblyindicating deeper coupling than the other Marlborough faults.
From seismological studies, the base of the seismogenic zone ofthe Alpine Fault between 42.5◦ and 44◦S is estimated to be 10–12 km depth (e.g. Leitner et al. 2001), while previous geodetic stud-ies indicate an interseismic coupling depth of only 5–8 km (Beavanet al. 1999). The previous geodetic estimates are based on a 2-Dapproach, assuming that slip rate deficits do not vary along strike ofthe fault and that GPS velocities in the central South Island are notinfluenced by slip rate deficits on other nearby faults (Beavan et al.1999). Here, we allow along-strike variation of slip rate deficits onthe Alpine Fault and influences from other nearby faults. Comparedto Beavan et al. (1999), we obtain a deeper interseismic couplingdepth estimate of 18 km (φ = 0.7–0.85) for most of the Alpine Fault.However, since our φ values are less than 1.0 (full interseismic cou-pling), the equivalent depth of a fully locked fault may be less than18 km (McCaffrey 2005), but still deeper than seismological esti-mates of 12 km. It should also be considered that seismological datagives us information about the depth to the base of the seismogeniczone, which may not be the same thing as the geodetically measured‘coupling depth’, so drawing comparisons between ‘seismological’and ‘geodetic’ coupling depths might not be appropriate. Our deepercoupling estimate may also be due to other factors, like ongoing de-formation on structures <100 km to the east of the Alpine Fault(e.g. Cox & Findlay 1995; Little 2004), the implications of which
C© 2006 The Authors, GJI
Journal compilation C© 2006 RAS

November 17, 2006 20:55 Geophysical Journal International gji3183
8 L. M. Wallace et al.
166˚ 168˚ 170˚ 172˚ 174˚
−47˚
−46˚
−45˚
−44˚
−43˚
−42˚
−41˚
−40˚
5 mm yr−1
0 100 200
km
Figure 4. GPS velocity residuals for best-fitting block rotation/fault locking model with 95 per cent confidence data uncertainties (i.e. no contribution to theuncertainties from the model).
Table 2. Euler vectors for the tectonic blocks discussed in this study relative to the Australian Plate. Vertical axis rotation rates (V.A. rot.rate) at a point in the center of each block are shown in the last column. In all cases, Euler vectors are for the second plate relative to thefirst. emax, emin, and azimuth refer to the maximum and minimum standard errors of the uncertainty ellipse (in degrees), and the azimuthof the major axis, respectively. Negative rotation rates indicate clockwise motion. See Fig. 8 caption for key to block name abbreviations.
Plate pairs Longitude Latitude Rate (◦ Myr−1) emax emin Azimuth V.A. rot. rate
AUST/WANGa 173.34 −39.67 −0.43 ± 0.09 0.43 0.28 234 −0.43AUST/FIOR 252.07 −71.40 0.38 ± 0.33 60.8 1.7 11 0.27AUST/SALP 228.33 −71.27 0.45 ± 0.3 40.1 1.2 168 0.35AUST/CANT 183.60 −60.47 1.04 ± 0.08 1.8 0.2 119 1.00AUST/NCAN 183.38 −56.84 1.07 ± 0.32 6.8 0.44 121 1.03AUST/IKAI 175.19 −45.94 1.20 ± 0.44 2.44 0.39 116 1.20AUST/SKAI 179.28 −51.81 0.73 ± 0.36 7.29 0.55 121 0.72AUST/CLBY 173.41 −43.66 1.35 ± 0.57 1.03 0.22 98 1.35AUST/PUYS 170.88 −33.69 −0.45 ± 0.42 12.98 1.54 259 −0.44AUST/PACIb 184.19 −61.04 1.08 ± 0.004 0.37 0.17 82 1.03AUST/AXIRc 174.33 −39.98 −2.80 ± 0.40 0.24 0.20 211
aAUST/WANG pole shown here is slightly different from that of Wallace et al. (2004a) due to the inclusion of additional data in thenorthern South Island in this paper.bFrom Beavan et al. (2002).cAUST/AXIR pole is for the Axial Ranges block (relative to Australia) in the North Island. Wallace et al. (2004a) published anincorrect location for that pole in their Table 3, so here we publish the corrected pole location. Note that all slip rate calculations anddiagrams in Wallace et al. (2004a) are based on the correct AUST/AXIR pole, the error is only in Table 3.
C© 2006 The Authors, GJI
Journal compilation C© 2006 RAS

November 17, 2006 20:55 Geophysical Journal International gji3183
Balancing the plate motion budget, South Island, New Zealand 9
166˚ 168˚ 170˚ 172˚ 174˚−47˚
−46˚
−45˚
−44˚
−43˚
−42˚
−41˚
−40˚
0 10 20 30
166˚ 168˚ 170˚ 172˚ 174˚−47˚
−46˚
−45˚
−44˚
−43˚
−42˚
−41˚
−40˚
0
Profile A
Profile B
Profile C
1
slip rate deficit (mm yr−1)
(b)
(a)
φ
dep
th
0
dmax φ0 1
Figure 5. (a) Magnitudes of slip rate deficits (mm yr−1) on block-boundingfaults in the South Island. Dashed lines show locations of profiles in Fig. 11.(b) φ values (from 0 to 1) on the block bounding faults. The slip rate deficit isthe scalar coupling coefficient (φ) multiplied by the relative block velocity.Locations of nodes used to specify 3-D fault geometries are shown as blackdots that are projected vertically to the Earth’s surface such that the width ofthe faults in the diagram reflects the dip of the fault (steeply dipping faultsappear narrow, while shallowly dipping faults appear wide). Inset graph in(b) is a schematic of how φ might vary with depth, given our constraint thatφ = 1 at the surface, and φ must decrease in value down-dip to 0 at thedeepest fault node (dmax = depth to deepest defined fault node). Black dotsrepresent node locations along a hypothetical down-dip fault profile.
we discuss in detail in Section 5.5. For example, some of the shearstrain that we interpret here as being due to deeper coupling on theAlpine Fault may instead be due to distributed dextral deformationwithin the Southern Alps.
166˚ 168˚ 170˚ 172˚ 174˚−47˚
−46˚
−45˚
−44˚
−43˚
−42˚
−41˚
−40˚
15 mm yr−1
0 100 200
km
Figure 6. GPS site velocities predicted by the elastic strain component only,due to interseismic fault slip deficit rates calculated using the back-slipapproach (i.e. rotations removed).
Our inversion results suggest some variation in the degree ofcoupling along strike of the Alpine Fault, between 42.5◦ and 44◦S.For example, coupling on the central Alpine Fault from 1 to 18 kmdepth between 43◦ and 43.5◦S appears to be slightly weaker (φ =0.7) than in surrounding segments (φ = 0.85), which may indicatea relatively shallower coupling depth on the central portion of theAlpine Fault. The existence of a comparatively shallow seismogeniczone along the central Alpine Fault has been suggested previouslybased on elevated temperatures implying a thermally weakened crust(e.g. Allis et al. 1979; Koons 1987), and seismological evidence forhigh fluid pressures beneath the central Southern Alps (Stern et al.2001).
We estimate full coupling down to 18 km depth for the AlpineFault south of 44◦S, indicating larger slip rate deficits for the south-ern half of the Alpine Fault (including the offshore portion) com-pared to further north. We also estimate high φ values along theFiordland subduction zone, consistent with the occurrence of mod-erately large subduction earthquakes in recent times (e.g. Andersonet al. 1993; Doser et al. 1999; Reyners & Webb 2002; Reyners et al.2003).
5.2 Possible internal strain of South Island tectonic blocks
To assess the possibility of distributed permanent strain east of theAlpine Fault in the CANT and SALP blocks, we invert for compo-nents of the horizontal strain rate tensor for these blocks in our bestfitting model (Table 4). It is likely that some of the internal ‘perma-nent’ block strain that we estimate is actually elastic (due to couplingon faults inside the tectonic blocks); however, given the uncertain-ties in the GPS dataset we cannot differentiate between permanentdeformation on aseismically slipping block interior faults versusinterseismic coupling on these block interior faults. The improve-ment in fit to the data when we estimate strain rates in these blocksis not significant when compared to the elastic block assumption
C© 2006 The Authors, GJI
Journal compilation C© 2006 RAS

November 17, 2006 20:55 Geophysical Journal International gji3183
10 L. M. Wallace et al.
166˚ 168˚ 170˚ 172˚ 174˚−47˚
−46˚
−45˚
−44˚
−43˚
−42˚
−41˚
−40˚
0 50 100
km
25 mm yr−1
166˚ 168˚ 170˚ 172˚ 174˚−47˚
−46˚
−45˚
−44˚
−43˚
−42˚
−41˚
−40˚
0 50 100
km
25 mm yr−1
(a)
(b)
Figure 7. GPS site velocities predicted from long-term block rotations (i.e.short-term, elastic components removed), relative to (a) Australian Plate, (b)Pacific Plate.
(compare Scenario 3 with Scenario 1, Table 3). For CANT, we esti-mate a strain rate ε1 = −16.5 ± 3.5 nstrain/year oriented −70◦ ±8◦, and the orthogonal ε2 = −2.8 ± 1.7 nstrain/year (contractionis negative) (Fig. 8). This strain rate corresponds to ∼2 mm yr−1
of permanent contraction of CANT in a WNW direction for a125-km-wide block. Assuming incompressibility, this horizontalstrain rate tensor results in 20 nstrain yr−1 of vertical strain which,for a 30 km thick crust, suggests 0.6 mm yr−1 of crustal thickening.If isostatically balanced, this crustal thickening would result in about0.1 to 0.2 mm yr−1 of uplift. The SALP block has a residual internalstrain rate of ε1 = −3.9 ± 6.4 nstrain/year oriented 22◦ ± 17◦, andε2 = 11.8 ± 8.5 nstrain/year (Fig. 8), corresponding to <1 mm yr−1
of permanent deformation over the 100 km wide block. However,as we demonstrate in Section 5.5, part of the GPS signal that weinterpret as elastic strain from Alpine Fault coupling may insteadbe due to distributed deformation within the Southern Alps ∼0–100 km to the east of Alpine Fault. In this case, permanent strainof the SALP block may be larger than we estimate in the modeldiscussed here.
For the other blocks, we do not formally solve for the componentsof the permanent strain rate tensor but instead calculate a residualstrain rate from the velocity residuals for the best-fitting elastic blockmodel (Table 4). In nearly all cases, the residual strain rates are smalland marginally significant (due to high uncertainties), indicatingthat the data can be fit well by assuming that there is negligibleinternal deformation of the blocks. The one exception is the NorthCanterbury (NCAN) block, that has a residual strain rate of ε1 =−8.8 ± 3.1 nstrain/year, and ε2 = 19.7 ± 8.1 nstrain yr−1, with ε1
oriented −83◦ ± 8◦.
5.3 Block kinematics and fault slip rates in theMarlborough region
Due to elastic strain from slip rate deficits on the closely spacedMarlborough faults, it is difficult to estimate Marlborough faultslip rates uniquely with GPS data alone. The narrow width of theMarlborough fault bounded blocks (15–40 km wide) in the NW di-rection results in large uncertainties in the poles of rotation for theMarlborough blocks, particularly in the WNW–ESE (100◦–120◦)direction (Table 2). Geological data (Table 1) used in the inversion(as a hard constraint) are critical for resolving some of these pa-rameters because, unlike GPS, they are not influenced by the elasticstrain component.
In general, we obtain an excellent fit to the GPS velocities andgeological fault slip rates and azimuths in the Marlborough region(Table 1, Figs 4 and 8). In the inversion we obtain∼18 mm yr−1 right-lateral strike-slip on the Hope Fault, and 5.3, 5.7 and 3.5 mm yr−1 ofright-lateral strike-slip for the Clarence, Awatere, and Wairau faults,respectively. These rates add up to 32.5 mm yr−1 of the predicted41–42 mm yr−1 of Pacific-Australia relative plate motion. The re-mainder of the plate motion budget (8.5–9.5 mm yr−1) is accommo-dated by shortening in the Buller region on the western boundaryof the Wanganui block (1–2 mm yr−1) and slip on faults within thePPAFZ (6.5–7.5 mm yr−1) (Fig. 8). Our PPAFZ rate is nearly dou-ble that of previous geological estimates (3–5 mm yr−1; e.g. Cowanet al. 1996; Howard et al. 2005). However, geological slip rates forfaults in the PPAFZ have only been estimated for the major faults inthe zone (e.g. the Porter’s Pass Fault), while the PPAFZ is a complex,wide fault zone, composed of many faults that accommodate dextraltranspression (e.g. Pettinga et al. 2001). Our GPS velocities indicatethat approximately half of the total slip rate across the PPAFZ hasbeen accounted for in geological studies, while the remaining 2–4 mm yr−1 of slip must occur on other uncharacterized or undiscov-ered faults within the PPAFZ. Where the PPAFZ projects offshore,we predict ∼8–9 mm yr−1 oblique (right-lateral) shortening. Thiscombination of right-lateral strike-slip and shortening could be ac-commodated along the Kekerengu Bank, Te Rapa, and Kaikourafaults, among other active faults and folds observed in the offshoreregion (e.g. Barnes & Audru 1999). Very slow shortening betweenthe Pacific Plate and the Canterbury/Otago block (∼1–2 mm yr−1)offshore of the east coast of the South Island may accommodatesome relative plate motion (Fig. 8; see also Beavan et al. 2002)
C© 2006 The Authors, GJI
Journal compilation C© 2006 RAS

November 17, 2006 20:55 Geophysical Journal International gji3183
Balancing the plate motion budget, South Island, New Zealand 11
Table 3. Results of F-tests for independence of some South Island blocks.
Model N data N parameters DOF χ2n No. of South Island blocks
(1) Best Model 1701 217 1484 1.17 10(2) No couplinga 1636 69 1567 9.88 10(3) No SALP, CANT strain 1701 211 1490 1.22 10(4) One blockc 1698 207 1491 1.34 8(5) SALP = CANTd 1699 210 1489 1.34 9(6) FIOR = SALP 1700 214 1486 1.16 9(7) ESIL = PACIb 1693 201 1492 1.45 8(8) SALP, CANT = PACI 1694 204 1490 1.44 9(9) CANT = PACI 1696 211 1485 1.27 10Comparison of models F-test probability InferenceIs (1) better than (2)? 0.99 YesIs (1) better than (3)? 0.79 MaybeIs (1) better than (4)? 0.99 YesIs (1) better than (5)? 0.99 YesIs (1) better than (6)? 0.43 NoIs (1) better than (7)? 0.99 YesIs (1) better than (8)? 0.99 YesIs (1) better than (9)? 0.94 Probably
See Fig. 8 caption for block name abbreviations. DOF: Degrees of freedom.aThe ‘no coupling’ model refers to the situation where block rotations only are allowed. Note that this model was done with GPS dataonly: no slip rates or slip azimuths were included in the inversion.bThis model assumes that the Fiordland, Southern Alps/Southland and Canterbury/Otago blocks are part of the Pacific Plate.cThe ‘one block’ model is where all the southeastern South Island blocks (SALP, CANT, FIOR) are considered to rotate as a single,large block.dThe SALP and CANT blocks rotate as a single block, but the block can strain uniformly.
indicated by active folding (with shortening rates of 0.1–0.9 mmyr−1) offshore of North Canterbury (Barnes 1996).
Paleomagnetic and geological data indicate ∼35◦ of clockwiserotation of tectonic blocks relative to the bounding Pacific and Aus-tralian plates in the northeastern part of Marlborough since 8 Ma(Fig. 9; Walcott et al. 1981; Mumme & Walcott 1985; Vickery &Lamb 1995; Little & Roberts 1997; Hall et al. 2004). By com-parison, vertical axis rotation rates that we obtain for the Marlbor-ough blocks (relative to the Australian Plate) are much lower (0.7–1.3◦ Myr−1) and with the opposite sense of rotation (anti-clockwise).However, paleomagnetic samples younger than 8 Ma age from cen-tral and southern Marlborough exhibit negligible clockwise rota-tions and in some cases show anti-clockwise rotation (e.g. Roberts1992; Vickery 1994; Little & Roberts 1997; Hall et al. 2004, Fig. 9).Based on paleomagnetic and structural geological evidence Vickery& Lamb (1995) and Little & Roberts (1997) suggest that the north-eastern portion of Marlborough has undergone more rotation thanits central and southwestern parts (Fig. 9). Therefore it is likely thatour results mostly reflect what is occurring in central and southernMarlborough. In the northeastern corner there may be smaller, morerapidly rotating tectonic blocks (e.g. Little & Roberts 1997), similarto the North Island. The Marlborough blocks appear to be rotatingabout significantly different poles than the North Island blocks, im-plying that the central Marlborough and North Island blocks (withthe exception of the Wanganui block, and possibly the northeasterncorner of Marlborough) are not likely to be continuous, through-going tectonic blocks from the North through to the South Island.
5.4 Slip rates on the Alpine Fault
Overall, predicted slip rates on the Alpine Fault agree well with ge-ological estimates (Fig. 8; Table 1). Rates on the far northern end(between 42.5◦S and 43◦S) gradually increase southward as slip isfed from the Marlborough faults onto the Alpine Fault (Berryman
et al. 1992) (Fig. 8). Our kinematic model indicates nearly purestrike-slip motion on the Alpine Fault between the Awatere andHope fault intersection points (Fig. 3), with rates of ∼8 mm yr−1
on the Alpine Fault between the Awatere and Clarence fault inter-sections, and ∼15 mm yr−1 slip rate on the Alpine Fault betweenthe Clarence and Hope fault intersections. South of the intersectionof the Hope and Alpine faults, the Alpine Fault takes on a muchlarger convergent component (∼5 mm yr−1) in addition to ∼30–31 mm yr−1 right-lateral strike-slip, which is at the upper end of itsgeological strike-slip rate (27 ± 5 mm yr−1) estimates. In view of thegeological data, our 30–31 mm yr−1 strike-slip rate estimate may betoo high; in Section 5.5 we discuss an alternative kinematic modelwhich can fit the GPS velocities and produce a lower Alpine Faultslip rate. South of Haast (Fig. 8), movement on the Alpine Faultbecomes nearly pure strike-slip and decreases to ∼24 mm yr−1,in agreement with geological observations (e.g. Hull & Berryman1986; Sutherland & Norris 1995; Sutherland et al. 2006). The de-crease in slip rate indicates that some of the slip from the centralAlpine Fault is transferred onto the Fiordland subduction zone southof 44◦S.
Our predicted convergent component of motion for the centralAlpine Fault (43◦ to 44◦S) is ∼5 mm yr−1, ∼1–2 mm yr−1 less thanaverage estimates from geological studies (e.g. Norris & Cooper2001, and references therein). In our model (Fig. 8) the strike-slipcomponent of motion for the central Alpine fault (south of its inter-section with the Hope Fault at 43◦S) accommodates ∼80 per centof Pacific-Australia relative motion parallel to the plate boundarystrike while the convergent component accommodates ∼50 per centof the required component normal to the plate boundary.
5.5 Distributed deformation within the Southern Alps
The strike-slip component of motion that we estimate for the cen-tral Alpine Fault (31.0 ± 1.5 mm yr−1 between 43◦ and 44◦S) is at
C© 2006 The Authors, GJI
Journal compilation C© 2006 RAS

November 17, 2006 20:55 Geophysical Journal International gji3183
12 L. M. Wallace et al.
166˚ 167˚ 168˚ 169˚ 170˚ 171˚ 172˚ 173˚ 174˚ 175˚ −47˚
−46˚
−45˚
−44˚
−43˚
−42˚
−41˚
−40˚
7
8.7(-) 8.3
3.1
4.1
31.7
31.6
14.7
18.2 18.0
18.1
5.2 5.3
5.3
5.7
5.7 2.2(-)
1.5(-)
0.7(-)
7.6(-)
6.6(-)
10.4
9.5
9.0
23.9
23.9
6.9(-)
5.1(-)
4.0(-)
3.0(-)
2.5(-) 2.6(-)
1.3(-)
1.2(-)
1.3
0.8(-)
1.0(-)
PUYS/AUST
FIOR/P
UYS
SALP/F
IOR
SALP
/CAN
T
CANT/PACI
NCAN/CANTSKAI/NCANIKAI/SKAI
CBAY/IKAICBAY/WANGWANG/AUST
SALP/AUST
SKAI/AUST
Haast
-16.4
-2.8
11.8
-3.9
nstrain yr−1
nstrain yr−1
0 100 200
km
Figure 8. Predicted horizontal component of relative slip vectors across block boundaries (red arrows labeled with red numbers in mm yr−1) for our best-fittingkinematic model, with 65 per cent confidence uncertainty ellipses. ‘+’ and ‘−’ signify extension and contraction, respectively. Each boundary is labeled withthe two blocks involved in the relative motion with the vector indicating the motion of the first-named block relative to the second-named block. For example,at the boundary labeled ‘SALP/CANT’, the vectors show the Southern Alps/Southland (SALP) block movement relative to the Canterbury/Otago (CANT)block. Principal axes of the horizontal strain tensor we estimate for the SALP and CANT blocks (Table 4) are shown with strain rates in nstrain/year. Key toabbreviations: Australian Plate (AUST), Canterbury/Otago block (CANT), Cloudy Bay block (CBAY), Fiordland block (FIOR), Inland Kaikoura block (IKAI),North Canterbury block (NCAN), Pacific Plate (PACI), Puysegur sliver (PUYS), Southern Alps/Southland block (SALP), Seaward Kaikoura block (SKAI),and Wanganui block (WANG).
the high end for the average slip rates estimated from active faultstudies of 27 ± 5 mm yr−1 (e.g. Norris & Cooper 2001, and refer-ences therein). Little (2004) suggested that dextral slip on numer-ous, closely spaced shear zones observed within the Alpine Faulthanging-wall can accommodate some of the plate boundary shearrequired in the central South Island. Structures observed in the nowinactive Main Divide Fault Zone provide additional evidence thatdistributed deformation within the Southern Alps has occurred inthe past (Cox & Findlay 1995). If significant distributed shear isaccommodated on faults within 100 km east of the Alpine Fault,we may be incorrectly modelling this shear as elastic strain dueto interseismic slip rate deficits on the Alpine Fault. This possiblemis-identification of strain may explain why our best-fitting modelsuggests significantly deeper (∼18 km) interseismic coupling thanthe base of the seismogenic layer (∼12 km).
To test for the possibility of distributed deformation within theSouthern Alps we divide the SALP block into separate SouthernAlps and Southland blocks (Figs 3 and 10). We force the strike-slip rate on the central Alpine Fault to lie between 22 and 27 mm
yr−1 and the total relative motion on the Southern Alps and Can-terbury/Otago block boundary to be less than 7 mm yr−1. Theseconstraints effectively force the inversion to fit much of the GPSdata in the central South Island by large permanent strain within theSouthern Alps block. In this inversion, we are able to satisfy the sliprate constraints and GPS velocities in the Southern Alps block witha χ 2
n = 1.63 (Fig. 10) by permanent strain of the block with ε1 =−57.2 ± 10.2 nstrain/year, and ε2 = 65.3 ± 7.6 nstrain yr−1 withε1 oriented −70◦ ± 3◦. The orientation of ε1 is consistent withseismological estimates of principal horizontal shortening directionfor the South Island of 110◦–120◦ (Leitner et al. 2001). This modelproduces ∼5 mm yr−1 of permanent dextral deformation withinthe Southern Alps block (in good agreement with estimates ofLittle 2004) parallel to the Alpine Fault, accommodating ∼10–15 per cent of Pacific/Australia relative motion. Additionally, ourestimate of the φ distribution on the Alpine fault changes markedly,with a much shallower coupling depth estimate (Fig. 10), more con-sistent with estimates of the maximum seismogenic depth in theAlpine Fault region from seismological studies (e.g. Leitner et al.
C© 2006 The Authors, GJI
Journal compilation C© 2006 RAS
November 17, 2006 20:55 Geophysical Journal International gji3183
Balancing the plate motion budget, South Island, New Zealand 13
Table 4. Block principal strain rate estimates and 1σ uncertainties(10−9 yr−1). Negative numbers signify contraction.
Blocka ε1 ε2 Azimuthb ε1
FIORc −4.6 ± 6.2 0.2 ± 5.7 −115◦ ± 21◦NCANc −8.8 ± 3.1 19.7 ± 8.1 −83◦ ± 8◦SKAIc −5.8 ± 11 8.1 ± 6 21◦ ± 19◦IKAIc −7.6 ± 16.1 33.8 ± 28 −117◦ ± 17◦CBAYc −12 ± 10.6 14 ± 19.2 −80◦ ± 23◦WANGc −0.7 ± 2.4 4.8 ± 2.4 32◦ ± 15◦SALPd −3.9 ± 6.4 11.8 ± 8.5 22◦ ± 17◦CANTd −16.4 ± 3.4 −2.8 ± 1.7 −70◦ ± 8◦Southern Alpse −57.2 ± 10.2 65.3 ± 7.6 −70◦ ± 3◦CANTe −16.6 ± 2.6 −0.42 ± 1.6 −60◦ ± 6◦
aSee the caption for Fig. 8 for the key to block name abbreviations.bAzimuth is in degrees east of north.cThese are strain rates estimated from the residual to the best-fitting model.dStrain rates estimated in the inversion (SALP, CANT blocks only).eStrain rate estimated in the test where the Southern Alps block undergoeshigher strain to replicate distributed deformation within the Southern Alps(Section 5.5).
173˚ 174˚
0 50
km
173˚ 174˚
Pacific Ocean
North IslandSouth Island
Hope FaultClarence Fault
Awatere Fault
Wairau Fault
boundary between structural zones (Little and Roberts, 1997)
PPAFZ
Non-rotating domain
FC
Rotating domain
arrows representing < 8 Ma paleomagnetic declinations
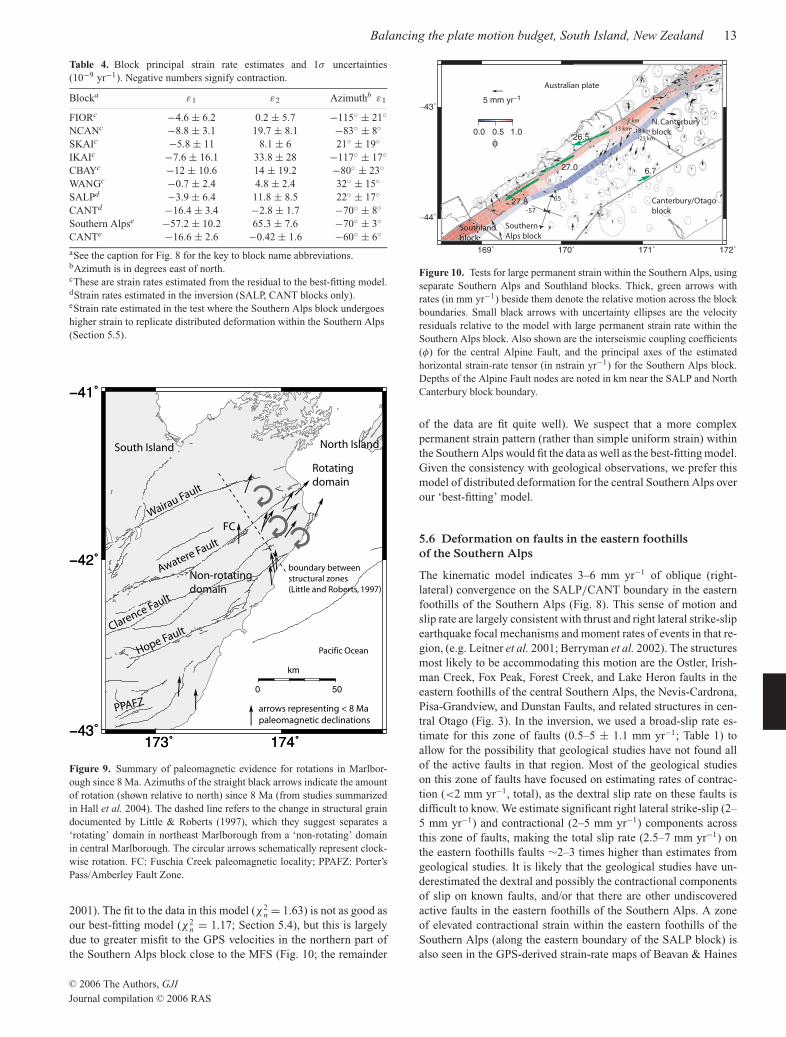
Figure 9. Summary of paleomagnetic evidence for rotations in Marlbor-ough since 8 Ma. Azimuths of the straight black arrows indicate the amountof rotation (shown relative to north) since 8 Ma (from studies summarizedin Hall et al. 2004). The dashed line refers to the change in structural graindocumented by Little & Roberts (1997), which they suggest separates a‘rotating’ domain in northeast Marlborough from a ‘non-rotating’ domainin central Marlborough. The circular arrows schematically represent clock-wise rotation. FC: Fuschia Creek paleomagnetic locality; PPAFZ: Porter’sPass/Amberley Fault Zone.
2001). The fit to the data in this model (χ2n = 1.63) is not as good as
our best-fitting model (χ2n = 1.17; Section 5.4), but this is largely
due to greater misfit to the GPS velocities in the northern part ofthe Southern Alps block close to the MFS (Fig. 10; the remainder
169˚ 170˚ 171˚ 172˚
−44˚
−43˚
27.8
27.0
26.5
15.2
5
6.7
5 mm yr−1
Southern Alps block
Canterbury/Otago block
N. Canterburyblock
Australian plate
-57
65
φ0.0 0.5 1.0 18 km13 km
7 km
25 km
Southland block
Figure 10. Tests for large permanent strain within the Southern Alps, usingseparate Southern Alps and Southland blocks. Thick, green arrows withrates (in mm yr−1) beside them denote the relative motion across the blockboundaries. Small black arrows with uncertainty ellipses are the velocityresiduals relative to the model with large permanent strain rate within theSouthern Alps block. Also shown are the interseismic coupling coefficients(φ) for the central Alpine Fault, and the principal axes of the estimatedhorizontal strain-rate tensor (in nstrain yr−1) for the Southern Alps block.Depths of the Alpine Fault nodes are noted in km near the SALP and NorthCanterbury block boundary.
of the data are fit quite well). We suspect that a more complexpermanent strain pattern (rather than simple uniform strain) withinthe Southern Alps would fit the data as well as the best-fitting model.Given the consistency with geological observations, we prefer thismodel of distributed deformation for the central Southern Alps overour ‘best-fitting’ model.
5.6 Deformation on faults in the eastern foothillsof the Southern Alps
The kinematic model indicates 3–6 mm yr−1 of oblique (right-lateral) convergence on the SALP/CANT boundary in the easternfoothills of the Southern Alps (Fig. 8). This sense of motion andslip rate are largely consistent with thrust and right lateral strike-slipearthquake focal mechanisms and moment rates of events in that re-gion, (e.g. Leitner et al. 2001; Berryman et al. 2002). The structuresmost likely to be accommodating this motion are the Ostler, Irish-man Creek, Fox Peak, Forest Creek, and Lake Heron faults in theeastern foothills of the central Southern Alps, the Nevis-Cardrona,Pisa-Grandview, and Dunstan Faults, and related structures in cen-tral Otago (Fig. 3). In the inversion, we used a broad-slip rate es-timate for this zone of faults (0.5–5 ± 1.1 mm yr−1; Table 1) toallow for the possibility that geological studies have not found allof the active faults in that region. Most of the geological studieson this zone of faults have focused on estimating rates of contrac-tion (<2 mm yr−1, total), as the dextral slip rate on these faults isdifficult to know. We estimate significant right lateral strike-slip (2–5 mm yr−1) and contractional (2–5 mm yr−1) components acrossthis zone of faults, making the total slip rate (2.5–7 mm yr−1) onthe eastern foothills faults ∼2–3 times higher than estimates fromgeological studies. It is likely that the geological studies have un-derestimated the dextral and possibly the contractional componentsof slip on known faults, and/or that there are other undiscoveredactive faults in the eastern foothills of the Southern Alps. A zoneof elevated contractional strain within the eastern foothills of theSouthern Alps (along the eastern boundary of the SALP block) isalso seen in the GPS-derived strain-rate maps of Beavan & Haines
C© 2006 The Authors, GJI
Journal compilation C© 2006 RAS

November 17, 2006 20:55 Geophysical Journal International gji3183
14 L. M. Wallace et al.
(2001), suggesting that contraction in this zone of faults is uniquelyconstrained by GPS data.
Our kinematic model also predicts 1–2 mm yr−1 of shortening(somewhat oblique) offshore between the CANT block and the Pa-cific Plate. This shortening is likely to be accommodated by activefolding offshore of Canterbury (Barnes, 1996) and by reverse faults,such as the Akatore Fault near Dunedin (Fig. 3) that may accommo-date 0.5–1 mm yr−1 of shortening, with a possible small componentof right-lateral strike-slip (Litchfield & Norris 2000). Beavan et al.(2002) noted a ∼3 mm yr−1 ENE motion of GPS sites near Dunedinand Christchurch (OUSD and 5508) with respect to the Pacific Plate.This mismatch is explained in our kinematic model by 1–2 mm yr−1
of shortening on the CANT/PACI boundary and elastic strain due tointerseismic slip rate deficits on the Alpine Fault and Marlboroughfault system.
5.7 Fiordland region
Our kinematic model for the Fiordland region is constrained byGPS velocities, earthquake slip vectors on the Fiordland subductionzone (Anderson et al. 1993), fault slip azimuth estimates consis-tent with pure strike-slip on the offshore Alpine Fault (Barnes et al.2005), and fault slip rate estimates from the on-land portion of theAlpine Fault (Hull & Berryman 1986; Sutherland & Norris 1995;Sutherland et al. 2006). We obtain a slip rate for the Alpine Faultoffshore of Fiordland of 23.9 ± 2.5 mm yr−1, and oblique con-vergence of 9–10 mm yr−1 at the Fiordland subduction boundary(∼88 per cent of PAC/AUS motion altogether). Like the suggestionof Norris & Cooper (2001), the geodetic data show that the conver-gent component of relative plate motion that occurs on the centralAlpine Fault must be transferred offshore to the west of the southernAlpine Fault (south of Haast, where the sense of motion becomespurely strike-slip).
Barnes et al. (2002) use seismic reflection profiles to estimate1–5 mm yr−1 of shortening perpendicular to the margin withinthe accretionary wedge in the Fiordland Basin. We obtain short-ening rates perpendicular to the Fiordland subduction zone of 6.5–8 mm yr−1, slightly higher than the upper end of their estimate. Wealso estimate that a component of dextral shear (3.5–6.0 mm yr−1)must be accommodated within the Fiordland Basin thrust wedge,consistent with suggestions by Barnes et al. (2002) that 0–6 mm yr−1 of dextral shear is possible within the wedge. Their sug-gestion is partially based on the slight obliquity of earthquake slipvectors from events on the Fiordland subduction zone (seaward ofthe subduction zone’s intersection with the Alpine Fault) with respectto the Fiordland subduction margin (Anderson et al. 1993). Theyalso observe possible shutter ridges (and similar features) withinthe Fiordland Basin accretionary wedge that may indicate ongoingdextral shear.
We caution that the use of GPS velocities on their own cannotgive insight into the details of how plate boundary deformation ispartitioned between the southern Alpine Fault and the subductionzone offshore of Fiordland. The details of our kinematic model inthis case require the use of earthquake slip vectors and fault sliprate estimates. Nor can we differentiate between the various sce-narios that have been proposed for the cross-sectional developmentof the Fiordland region (e.g. Lebrun et al. 2000; Reyners & Webb2002). However, the GPS velocities indicate that 85–90 per cent ofPacific/Australia relative motion must be accommodated offshoreof Fiordland on the Alpine Fault and thrust faults. The remaining10–15 per cent (3–6 mm yr−1) probably occurs on reverse/obliqueslip faults east of the Fiordland region (Fig. 8).
5.8 Statistical tests for South Island tectonic blockindependence
We conducted statistical tests of possible tectonic block configura-tions in the South Island (Table 3). For example, can the data dis-tinguish an independent Canterbury/Otago block from the SouthernAlps/Southland block and their motions from that of the PacificPlate? Could the blocks in the eastern and southern South Island(CANT, SALP and FIOR blocks) constitute a single block? A testrun in which all of the eastern and southern South Island blocks(SALP, CANT, and FIOR blocks) rotate as one block indicates thatthe data are not fit as well as alternative configurations (compareScenario 4 to Scenarios 1, 5, and 6; Table 3). F-tests on the resid-ual distributions suggest that the CANT and SALP blocks moveindependently (compare Scenario 5 to Scenario 1), indicating thatsome of the Australia-Pacific deformation not accommodated onthe Alpine Fault must occur somewhere between the Southern Alpsand the east coast. However, it is difficult to discern from the GPSvelocities whether or not the FIOR block is independent of the SALPblock (compare Scenario 6 to Scenario 1), as we get an equally goodfit to either scenario. If deformation occurs between the FIOR andSALP blocks, it is likely to be very slow (e.g. Fig. 8).
Based on these tests, much of the South Island east of the AlpineFault appears not to be part of the rigid Pacific Plate. A test in whichall blocks east of the Alpine Fault (FIOR, SALP, CANT) are assumedto be part of the Pacific Plate (scenario 7) yields a significantly worsefit to the data than does the best-fitting model. The scenario wherethe SALP and CANT blocks are part of PACI (scenario 8) yields asimilarly poor fit to the data. When the CANT block alone is forcedto move with the Pacific Plate, the F-tests indicate that this scenariofits the data reasonably well, although still not as well as our best-fitting scenario (compare scenarios 1 and 9). This suggests that theCANT block is more similar to Pacific Plate motion than any otherSouth Island block, but it is still likely (at 94 per cent probability)to be independent of the Pacific Plate.
6 D I S C U S S I O N
6.1 Variations in the mode of slip partitioning in the SouthIsland compared to the rest of New Zealand
Pacific/Australia relative motion is oriented obliquely relative to thevariable strike of the New Zealand plate boundary zone. The vari-ation in the plate boundary type, from subduction at the Hikurangimargin to nearly pure strike-slip in the Marlborough region, andoblique collision in the Southern Alps, causes large changes in themode of slip partitioning along the New Zealand plate boundary.
In the North Island, the margin-parallel component of relativeplate motion (assuming a 30◦ strike of the margin in the north,and a 40◦ strike at the southern end) is ∼28 mm yr−1 near 37.5◦S,and ∼32 mm yr−1 near 41◦S (Table 5; Beavan et al. 2002). Slippartitioning is known to occur in the North Island, as is evidentfrom the orientation of subduction zone earthquake slip vectorsperpendicular to the Hikurangi subduction margin (e.g. Webb &Anderson 1998), and from geological evidence for strike-slip fault-ing in the upper plate (e.g. Cashman et al. 1992). However, geologi-cal rates of strike-slip faulting reach only ∼6 mm yr−1 near 38◦S and∼21 mm yr−1 near 41◦S (e.g. Beanland 1995; Van Dissen &Berryman 1996). Wallace et al. (2004a) demonstrate that clockwiserotation of the eastern North Island accommodates the remainderof the total margin-parallel component of Pacific-Australia relativemotion. The net result of clockwise rotation of the eastern North
C© 2006 The Authors, GJI
Journal compilation C© 2006 RAS

November 17, 2006 20:55 Geophysical Journal International gji3183
Balancing the plate motion budget, South Island, New Zealand 15
Table 5. Pacific-Australia relative motion at various points in New Zealand from Euler vector of Beavan et al. (2002).
Long. Lat. Total Rate Vn Ve Strike-parallel Strike-normal Strike of Feature used(mm yr−1) (mm yr−1) (mm yr−1) rate (mm yr−1) rate (mm yr−1) margin used for strike
167 −45 38.9 −17.2 −35 38.1 8.0 52 ALPF168.86 −44 39.6 −15.3 −36.6 38.8 7.8 56 ALPF169.91 −43.5 40 −14.3 −37.4 39.0 9.0 56 ALPF170.77 −43.1 40.3 −13.5 −38 39.0 10.1 56 ALPF179.6 −37.68 47.9 −4.6 −47.6 27.8 38.9 30 HIKM179.36 −38.1 47.1 −4.9 −46.8 27.7 38.1 30 HIKM178.73 −39.38 44.7 −5.5 −44.4 26.9 35.7 30 HIKM178.41 −40.25 43.1 −5.8 −42.7 26.4 34.1 30 HIKM177.69 −41.06 41.7 −6.6 −41.2 26.3 32.4 30 HIKM177.69 −41.06 41.7 −6.6 −41.2 31.5 27.4 40 HIKM174.85 −41.52 41.6 −9.4 −40.6 28.4 30.4 30 HIKM173.36 −42.19 40.9 −10.9 −39.4 40.3 6.8 65 MFS172.13 −42.59 40.6 −12.1 −38.8 40.2 5.4 65 MFS
Key to abbreviations: ALPF = Alpine Fault; HIKM = Hikurangi subduction margin; MFS = Marlborough fault system.
Island is extension in the TVZ (e.g. Villamor & Berryman 2001,and references therein), and shortening in the southern North Is-land, south of the TVZ (e.g. Melhuish et al. 1996; Nicol et al. 2002).Hence, slip partitioning in most of the North Island occurs largely bytectonic block rotation while strike-slip faulting plays a secondaryrole.
Though the margin-parallel rate of relative plate motion staysroughly the same along the Hikurangi margin, the margin-perpendicular component decreases significantly southwards (thisdecrease in proportion of the margin-normal component relative tomargin-parallel causes the southward increase in obliquity; Table 5).Therefore, the southward increase in the observed rate of strike-slipfaulting in the eastern North Island is not due to an along-strikechange in Pacific/Australia relative plate motion. We argue insteadthat the greater strike-slip rate on faults in the southern North Islandis due to the decreased role of rotation in accommodating the margin-parallel component of plate motion. Because the total change in tan-gential velocity across a rotating block is proportional to the block’swidth times the vertical axis spin rate, the southward decrease inthe importance of rotation in the North Island is largely due to thenarrower zone within which the plate boundary rotation occurs inthe south (125 km) versus the north (200–250 km) (Fig. 11) and notdue to slower rotation rates in the south.
In contrast to the North Island, block rotations in central andsouthern Marlborough region contribute very little to slip parti-tioning (Fig. 11). In this region, 97 per cent of AUS/PAC relativemotion occurs via strike-slip on the Marlborough faults (includ-ing the PPAFZ). Slow shortening (1–2 mm yr−1) in the Buller re-gion accommodates the remaining 3 per cent. In Marlborough, themargin-parallel and perpendicular components of relative plate mo-tion largely occur on separate structures (e.g. strike-slip in the MFS,and shortening in the Buller region), similar to ‘classical’ notionsof slip partitioning (e.g. Fitch 1972; McCaffrey 1992). However,faults in the northern part of Marlborough probably accommodatea large amount of contraction as they have a more northerly strike(e.g. Jordan Thrust, Van Dissen & Yeats 1991; northern AwatereFault, Little et al. 1998; London Hills Fault, Townsend & Little 1998;Clarence Fault, Nicol & Van Dissen 2002). Similarly, some faults inthe PPAFZ accommodate dextral transpression. Paleomagnetic evi-dence for recent (<8 Ma) clockwise block rotations in northeasternMarlborough (e.g. Vickery & Lamb 1995; Little & Roberts 1997)suggest that rotation may also play a role in slip partitioning there,although we are unable to resolve with GPS whether or not these
rotations still occur, presumably due to the small dimension of theregion. If the paleomagnetically observed rotations continue today,it is likely that NE Marlborough is in a transitional zone betweenthe North Island tectonic regime (characterized by rapid clockwiseblock rotations) and the nearly pure strike-slip observed in centralMarlborough.
The Alpine Fault accommodates at least ∼75 per cent of relativeplate motion, and has components of convergence and strike-slip.Norris et al. (1990) and Norris & Cooper (1997) point out that indetail at the surface in the central Southern Alps, oblique slip ispartitioned onto ENE trending thrust fault structures that are con-nected in a zig-zag pattern by WNW striking nearly pure strike-slipfeatures. It is expected that these faults merge at depth where theslip is oblique. The remaining plate motion is distributed amongstrike-slip, oblique slip, and contractional faults to the east of theAlpine Fault.
In Fiordland, south of 44◦S, ∼63 per cent of the margin parallelcomponent of relative plate motion occurs on the Alpine Fault (as-suming a 50◦–55◦ strike; Barnes et al. 2005), and 80–100 per centof the convergent component of relative plate motion occurs on theFiordland subduction thrust. Some oblique slip probably occurs atthe Fiordland subduction zone (e.g. Barnes et al. 2002); we esti-mate up to 9–15 per cent of the margin parallel component couldbe accommodated within the Fiordland Basin thrust wedge (3.5–6.0 mm yr−1). This is similar to the situation in Sumatra, where∼2/3 of margin-parallel plate motion occurs on the Sumatra Fault(strike-slip), while the remaining 1/3 occurs on the subduction thrust(McCaffrey et al. 2000b). The remaining 10–15 per cent of AUS/
PAC motion (3–5 mm yr−1) occurs as distributed deformation acrossthe southern half of the South Island (east of the Alpine Fault).
Overall, in the North Island, the slip partitioning process is facil-itated by block rotations, while in the South Island such rotationsoccur about more distant poles resulting in lower velocity gradients.Hence, relative plate motion in the South Island is accommodatedmore directly by faulting, some of which is quite oblique (e.g. theAlpine Fault).
6.2 Driving mechanisms for block rotationsin New Zealand
Vertical axis rotation rates of all of the South Island tectonic blocks(including those in the Marlborough region) are similar in rate andsense (anti-clockwise, relative to the Australian Plate) to that of
C© 2006 The Authors, GJI
Journal compilation C© 2006 RAS

November 17, 2006 20:55 Geophysical Journal International gji3183
16 L. M. Wallace et al.
010203040
100 200 300 400
40
100 200 300 400-10
0102030
-10
10
20
100 200 300 400
0
Southern Hikurangi Profile (North Island)
i) elastic
ii) rotation
iii) elastic + rotation
NWSE distance along profile (km)
Hik
uran
gi T
renc
h
~25%
100 200 300 400 500
100 200 300 400 500
403020100
-10-20
403020100
-10-20
403020100
-10
100 200 300 400 500
Northern Hikurangi Profile (North Island)
i) elastic
ii) rotation
iii) elastic + rotation
NWSE distance along profile (km)
rate
(m
m y
r−1)
rate
(m
m y
r−1)
Hik
uran
gi T
renc
h
TVZ(west)
~65 %
−10010203040
0 100 200 300 400
−10010203040
0 100 200 300 400
−30−20−10010
0 100 200 300 400
i) elastic
ii) rotation
iii) elastic + rotation
NWSE distance along profile (km)
rate
(m
m y
r−1)
Profile C (Fiordland)
−10010203040
100 200 300
−10
10203040
100 200 300
0
100 200 300−30−20−10
010
i) elastic
ii) rotation
iii) elastic + rotation
NWSE distance along profile (km)
rate
(m
m y
r−1)
Profile B (central South Island)
−10010203040
100 200 300 400
41.627 276.752 8.595 0.629 1.415 0.816 8.710 1.030 2.641 0.764 8.300 0.657 260.651 0.000 0.220 0.818 11.667 1187 MARL WNIS G 172.541 41.552 303.597 5.956 0.680 0.176 0.867 5.959 1.102 2.861 0.816 5.227 0.709 88.307 0.000 0.125 0.202 23.043 1189 MAR
−10010203040
100 200 300 400
R
−10010203040
100 200 300 400
MAR
i) elastic
ii) rotation
iii) elastic + rotation
distance along profile (km)
rate
(m
m y
r−1)
Profile A (Marlborough)
NWSE
AUSPAC
AUS
AUS
PAC
PAC
Alp
ine
F.
HFCF
AF WF
Fio
r. su
bd
.
Alp
ine
F.
125 km
clockwiserotating zone
clockwiserotating zone
AUS AUSPAC
240 km
(a) (b)
(c)
(d) (e)
Figure 11. Profiles normal to the New Zealand plate boundary showing the margin-parallel (grey) and margin-perpendicular (black) components of the (i)elastic, (ii) rotational and (iii) combined elastic and rotational velocities. Observed velocities from GPS are projected onto the profiles as black and gray symbols.Locations of the three profile lines (a, b, c) from the South Island are shown in Fig. 5. Profile lines (d) and (e) from the North Island cross the northern (d) andsouthern (e) Hikurangi margin (Wallace et al. 2004a). Key features to note in the rotational component profiles are steps where there are faults and sloping linesbetween the faults where there are rotations. For the North Island profiles (d, e) the percentage of margin-parallel relative motion accommodated by rotation isgiven, and the grey shaded area indicates the zone where block rotations contribute to the margin parallel component of relative plate motion. In all cases thereference frame is the Australian Plate. AF; Awatere Fault; CF: Clarence Fault; HF: Hope Fault; WF: Wairau Fault; AUS: Australian Plate; PAC: Pacific Plate.
C© 2006 The Authors, GJI
Journal compilation C© 2006 RAS

November 17, 2006 20:55 Geophysical Journal International gji3183
Balancing the plate motion budget, South Island, New Zealand 17
the Pacific Plate (Table 2). This implies that the kinematics of theSouth Island blocks are influenced more by the Pacific Plate thanthe Australian Plate. Likewise, in the western United States, verti-cal axis rotation rates relative to North America of tectonic blocks(caught up in the North America-Pacific plate boundary zone) aresimilar to that of the Pacific Plate (McCaffrey 2005). McCaffrey(2005) suggested that this occurs due to edge-forces being com-municated across a block’s boundaries (faults) to the neighbouringblock, as opposed to the block rotations being driven by shear onthe base of the blocks from a broadly deforming mantle substrate(e.g. the ‘floating block’ model, McKenzie & Jackson 1983; Lamb1987) or ball-bearing type models (Schouten et al. 1993). Interest-ingly, the SALP block vertical axis rotation rate relative to Australia(0.35◦ Myr−1, anti-clockwise) is smaller than the rotation rate of theCANT block relative to Australia (0.99◦ Myr−1, anti-clockwise).This indicates that as the tectonic blocks get closer to the AustralianPlate, the block kinematics may become progressively more influ-enced by edge forces arising from interaction with the AustralianPlate. A comparable situation occurs in the western US, where thetectonic blocks closest to the North American Plate have verticalaxis rotation rates more similar to that of the North American Plate(see fig. 14b in McCaffrey, 2005).
Some workers (e.g. Molnar et al. 1999; Stern et al. 2000) suggestthat the mantle beneath the central South Island is undergoing dextralshear deformation over a zone up to 400 km wide, although othersuse a model of ‘intracontinental subduction’, where the Pacific Platemantle is subducted beneath the Southern Alps, and deformation inthe mantle occurs along a localized shear zone (e.g. Wellman 1979;Beaumont et al. 1996). If the eastern South Island crustal blocks(SALP, CANT blocks) were coupled to and sheared by a 400 km-wide zone of dextrally deforming mantle, they would be induced torotate clockwise relative to the Pacific and Australian plates (e.g. thefloating block model). Thus, the anti-clockwise rotation (relative toAustralia) of the SALP and CANT blocks that we observe in geode-tic data argues against a broad deforming zone in the mantle be-neath the South Island, unless there is extreme decoupling betweenthe crust and mantle. We note that the vertical axis rotation rate ofthe SALP block relative to the Pacific Plate is slightly clockwise(0.6◦ Myr−1). However, for rotation of SALP to be consistent withthe floating block model, it should exhibit clockwise rotation rela-tive to both bounding plates (Australia and Pacific), and its verticalaxis rotation rate should be somewhat greater than the relative rota-tion rate between the two bounding plates (here, >1◦ Myr−1) (e.g.McCaffrey 2005). Finite-element modelling by Ellis et al. (GJI, inpress, 2006) of GPS velocities from the central South Island indicatethat if there is a deforming zone in the mantle beneath the centralSouth Island, its width cannot be greater than ∼100 km. They foundthis to be the case even if the lower crust is very weak, as their mod-elling results suggest that deformation in the mantle is still likely toinfluence crustal deformation at the surface.
In northeastern Marlborough, paleomagnetic and geological stud-ies (e.g. Vickery & Lamb 1995; Little & Roberts 1997) show thatsubstantial clockwise rotations (up to 35◦) have occurred in the last 8Myr (Fig. 9). In the eastern North Island, paleomagnetic (e.g. Wright& Walcott 1986; Wilson & McGuire 1995) and geodetic data(Wallace et al. 2004a) indicate rapid clockwise rotations. Wallaceet al. (2004a) suggest that the cause of this rotation is the influenceon the subduction process of the southward increase in buoyancy ofthe subducting Pacific Plate. Although the ‘floating block’ model hasbeen suggested to explain clockwise block rotations in northeasternMarlborough (Lamb 1988), we believe it is more likely that theseclockwise rotations are due to subduction-related processes (Little
& Roberts 1997; Reyners et al. 1997) similar to those that causetectonic block rotations in the North Island (Wallace et al. 2004a).If so, northeast Marlborough may be connected to the North Islandtectonic blocks across Cook Strait. However, the current distribu-tion and accuracy of GPS velocities in northeastern Marlborough(Fig. 2) do not allow us to determine if these clockwise rotations areongoing at present.
6.3 Major influences on the evolution of the New Zealandplate boundary zone
The Chatham Rise migrates southwest along the New Zealand plateboundary (relative to the Australian Plate) at ∼28–37 mm yr−1,depending on the strike of the margin used (e.g. 30◦ strike of theHikurangi Margin, or a 55◦ strike of the Alpine Fault) (Fig. 12). Thesouthward migration of the Chatham Rise and Hikurangi Plateau(Fig. 1) permits southward propagation of the Hikurangi subductionzone relative to Australia. This propagation may in turn cause south-ward migration of the locus of activity in the MFS (and initiation ofnew faults in the MFS, such as the PPAFZ) as the Marlboroughfaults link up with the subduction zone (Berryman et al. 1992;Little & Roberts 1997). This southwards migration of subduction(and subsequent southeast-migrating faults in the MFS) is evidencedby the pattern of younger faults now found southeast of older faults
166˚ 170˚ 174˚ 178˚−48˚
−44˚
−40˚
−36˚
0 100 200km
Chatham Rise (CR)
Challenger PlateauNorth Island
South Island~38 mm yr-1
TVZrifting
current ENIS poleof rotationrelative to AUS
future ENIS/AUSpole if CR migratesSW relative to AUS
southwardpropagationof TVZ
CR pinning point for rotation of ENIS relative toPAC
ENIS rel PAC
ENIS
rel A
US
WFAF
CFHF
Alpine Fault
Figure 12. Schematic of the migration of the Chatham Rise, the NewZealand coastline and the TVZ relative to the Australian Plate over 2 Myr.The red dashed lines show the projected east coast of the North and SouthIsland and the Chatham Rise (relative to a fixed Australian Plate) 2 Myrfrom now (ignoring coastal sedimentation and erosion). Small circular ar-rows (black = current, red = future) indicate poles of rotation of the easternNorth Island (ENIS) relative to the Australian Plate (AUS) (poles locatedwest of the central North Island), and poles of rotation for ENIS relativeto the Pacific Plate (PAC), located near the Chatham Rise (CR). The largesemi-circular arrows in the eastern North Island schematically depict its ro-tation relative to the Australian (grey arrows) and the Pacific (black arrows)plates. TVZ: Taupo Volcanic Zone; HF: Hope Fault; CF: Clarence Fault; AF:Awatere Fault; WF: Wairau Fault.
C© 2006 The Authors, GJI
Journal compilation C© 2006 RAS

November 17, 2006 20:55 Geophysical Journal International gji3183
18 L. M. Wallace et al.
within the MFS, with the southeasternmost fault, the PPAFZ asthe newest fault in the system (Cowan et al. 1996). Additionally,there is an accompanying diversion of slip away from the AlpineFault onto the southward propagating MFS, effectively reducing thelength of the rapidly slipping central portion of the Alpine Fault (e.g.Berryman et al. 1992). Following Little & Roberts (1997) we as-sume that southward propagation of the MFS and Hikurangi sub-duction zone relative to the Australian Plate follows the migrationof the Chatham Rise along the New Zealand margin, and that theAlpine Fault/MFS intersection migrates southwest at a similar rate.Thus, the southernmost intersection of the Alpine Fault with theMarlborough faults 2 Myr from now will be approximately 56–74 km southwest of its current position. The average distance (mea-sured along the Alpine Fault) between the intersection of eachof the Marlborough faults with the Alpine Fault is ∼50 km. Ifthe southwest migration of the Alpine Fault/MFS intersection oc-curs at a rate of 28–37 km Myr−1, then a new fault within theMarlborough system should initiate roughly every 1.4–1.9 Myr. Thistiming is generally consistent with geological evidence for the initi-ation of Awatere Fault activity at 5.5–6.2 Ma (Little & Jones 1998),Clarence Fault initiation at 3 Ma (Browne 1992), and initiation ofthe Hope Fault at ∼1 Ma (Wood et al. 1994). The PPAFZ is cur-rently in the process of establishing itself as a through-going faultzone (Cowan et al. 1996), ∼1 Ma after the Hope Fault.
The southward migration of the Chatham Rise and HikurangiPlateau (relative to Australia) may also influence the tectonic evo-lution of the North Island. Wallace et al. (2004a) suggest that therapid clockwise rotation of the eastern North Island occurs due to thechange from collision of the buoyant Chatham Rise (a continentalfragment) to subduction of the Hikurangi Plateau (buoyant oceanicplateau), and eventually, subduction of normal oceanic crust northof 36◦S. This causes the eastern North Island tectonic blocks topivot relative to the Pacific Plate about the Chatham Rise ‘pinningpoint’, where convergence is significantly slowed. Wallace et al.(2004a) suggest that this collision/subduction-induced rotation isthe cause of backarc rifting in the TVZ. The locations of the polesof rotation for the eastern North Island blocks relative to Australiadictate the kinematics of rifting in the TVZ. Southward migrationof the Chatham Rise relative to the Australian Plate may cause thepoles of rotation of the North Island tectonic blocks (relative tothe Australian Plate) to migrate southwards, following the ChathamRise ‘pinning point’, leading to southward propagation of TVZ rift-ing (Fig. 12). Volcanological and geological evidence also suggestssouthward propagation of the TVZ (Gamble et al. 2003; Price et al.2005; Villamor & Berryman 2006).
Analogous to the Hikurangi subduction zone, the Fiordland sub-duction zone propagates northwards (relative to the Pacific Plate;e.g. Walcott 1998) as the Challenger Plateau migrates northeastalong the margin at a rate of ∼38 mm yr−1 (38 km Myr−1). It is clearthat the New Zealand plate boundary is continually evolving, andundergoing temporal changes largely driven by the presence and mi-gration of buoyant crustal fragments (the Chatham Rise, HikurangiPlateau and Challenger Plateau) along the plate boundary.
7 C O N C L U S I O N S
(1) We can fit the GPS velocity, geological slip rate and earthquakeslip vector data within their uncertainties using a rotating, elasticblock approach. Our kinematic model ‘balances’ the plate bound-ary velocity budget across the South Island of New Zealand, inthat it accounts for how much deformation is required to satisfyPacific/Australia relative plate motion.
(2) Most of the plate boundary deformation has been accountedfor in geological studies, although there are regions where previ-ous slip rate estimates may be too low. For example, in the Porter’sPass/Amberley fault zone, there may be 6–8 mm yr−1 of deforma-tion compared to 3–5 mm yr−1 from geological studies (Cowan et al.1996; Howard et al. 2005). Interpretation of GPS surface velocitiessuggests that slip rates on faults in the eastern foothills of the South-ern Alps may be two to three times higher than geological estimates,particularly in the strike-slip component.
(3) The elastic, rotating block approach has enabled us to assessthe interseismic slip rate deficits on some of the major faults inNew Zealand, which can be incorporated into future seismic hazardmodels. We detect a shallower interseismic coupling depth on thecentral portion of the Alpine Fault in comparison to other areas of thefault, consistent with the suggestions of previous studies (e.g. Koons1987; Stern et al. 2001).
(4) As an alternative to our ‘best-fitting’ model, we can also fitGPS velocities with ∼5 mm yr−1 of dextral deformation within theSouthern Alps block <100 km to the east of the Alpine Fault; thiscould occur on a series of shear zones within the Southern Alps suchas those described by Little (2004).
(5) The migration of buoyant continental masses (the CampbellPlateau and Chatham Rise) along the margin cause the plate bound-ary to continually evolve, and influence the development of theMarlborough fault system and the migration of the Fiordland andHikurangi subduction zones. The change in orientation of PAC/AUSrelative motion with respect to the orientation of the major plateboundary faults plays a secondary role in the variability of plateboundary environments observed in New Zealand.
A C K N O W L E D G M E N T S
This work was funded by the Foundation for Research, Scienceand Technology (FRST), New Zealand. GPS data were collected bynumerous individuals, principally from the Institute of Geologicaland Nuclear Sciences (now GNS Science), University of Otago,Dept. Of Survey and Land Information (now Land Information NewZealand), Oxford University, Victoria University of Wellington andoccasional volunteers. McCaffrey’s participation was supported byGNS Science and a sabbatical from Rensselaer Polytechnic Institute.This work benefited from discussions with Simon Cox, Susan Ellis,Nicola Litchfield, Tim Little, Andy Nicol, Martin Reyners, RussVan Dissen and Pilar Villamor. Reviews of an earlier version ofthis manuscript by Simon Cox, Susan Ellis and Russ Van Dissenimproved it. Detailed reviews by Tim Little and two anonymousreviewers improved the manuscript substantially. Many of the figuresin this paper were made using Generic Mapping Tools software(Wessel & Smith 1995).
R E F E R E N C E S
Abercrombie, R.E., Webb, T.H., Robinson, R., McGinty, P.J., Mori, J.J. &Beavan, R.J., 2000. The enigma of the Arthur’s Pass, New Zealand, earth-quake 1. Reconciling a variety of data for an unusual earthquake, J. geo-phys. Res., 105(B7), 16 119–16 137.
Allis, R.G., Henley, R.W. & Carman, A.F., 1979. The thermal regime be-neath the Southern Alps, in The origin of the Southern Alps, pp. 79–85,eds Walcott, R.I. & Cresswell, M.M., Wellington: Royal Society of NewZealand.
Anderson, H. & Webb, T., 1994. New Zealand seismicity: patterns revealedby the upgraded National Seismograph Network, N.Z. J. Geol. and Geo-phys., 37, 477–493.
C© 2006 The Authors, GJI
Journal compilation C© 2006 RAS

November 17, 2006 20:55 Geophysical Journal International gji3183
Balancing the plate motion budget, South Island, New Zealand 19
Anderson, H., Webb, T. & Jackson, J., 1993. Focal mechanisms of largeearthquakes in the South Island of New Zealand: implications for theaccommodation of Pacific-Australia Plate motion, Geophys. J. Int., 115,1032–1054.
Anderson, H. et al., 1994. The 1968 May 23 Inangahua, New Zealandearthquake: An integrated geological, geodetic and seismological sourcemodel, N.Z. J. Geol. and Geophys., 37, 59–86.
Arnadottir, T., Beavan, J. & Pearson, C., 1995. Deformation associated withthe 18 June 1994 Arthur’s Pass earthquake, New Zealand, N.Z. J. Geol.and Geophys., 38, 553–558.
Barnes, P.M., 1996. Active folding of Pleistocene unconformities on the edgeof the Australian-Pacific plate boundary zone, offshore North Canterbury,New Zealand, Tectonics, 17, 534–557.
Barnes, P.M. & Audru, J.-C., 1999. Recognition of active strike-slip faultingfrom high-resolution marine seismic reflection profiles: Eastern Marlbor-ough fault system, New Zealand, G.S.A. Bull., 111(4), 538–559.
Barnes, P.M., Davy, B., Sutherland, R. & Delteil, J., 2002. Frontal accre-tion and thrust wedge evolution under very oblique plate convergence,Fiordland Basin, New Zealand, Basin Res., 14, 439–466.
Barnes, P., Sutherland, R. & Delteil, J., 2005. Strike-slip structure and sed-imentary basins of the southern Alpine Fault, Fiordland, New Zealand,G.S.A. Bull., 117(3/4), 411–435.
Barrell, D.J.A., Forsyth, P.J. & McSaveney, M.J., 1996. Quaternary geol-ogy of the Rangitata Fan, Canterbury Plains, New Zealand. Institute ofGeological & Nuclear Sciences science report 96/23, Lower Hutt, NewZealand.
Beanland, S., 1995. The North Island dextral fault belt, Hikurangi subductionmargin, New Zealand, PhD thesis, Victoria University of Wellington, NewZealand.
Beanland, S. & Barrow-Hurlbert, S.A., 1988. The Nevis-Cardrona Fault Sys-tem, Central Otago, New Zealand: late Quaternary tectonics and structuraldevelopment, N.Z. J. Geol. and Geophys., 31(3), 337–352.
Beanland, S. & Berryman, K.R., 1989. Style and episodicity of late Qua-ternary activity on the Pisa-Grandview Fault Zone, Central Otago, NewZealand, N.Z. J. Geol. and Geophys., 32(4), 451–461.
Beaumont, C., Kamp, P.J.J., Hamilton, J. & Fullsack, P., 1996. The continentalcollision zone, South Island, New Zealand: comparison of geodynamicalmodels and observations, J. geophys. Res., 101(B2), 3333–3359.
Beavan, J. & Haines, J., 2001. Contemporary horizontal velocity and strain-rate fields of the Pacific-Australian plate boundary zone through NewZealand, J. geophys. Res., 106(B1), 741–770.
Beavan, J. et al., 1999. Crustal deformation during 1994–1998 due to obliquecontinental collision in the central Southern Alps, New Zealand, andimplications for seismic potential of the Alpine fault, J. geophys. Res.,104(B11), 25 233–25 255.
Beavan, J., Tregoning, P., Bevis, M., Kato, T. & Meertens, C., 2002. Mo-tion and rigidity of the Pacific Plate and implications for plate boundarydeformation, J. geophys. Res., 107(B10), doi: 10.1029/2001JB000282.
Benson, W.N., 1952. Meeting of the Geological Division of the Pacific Sci-ence Congress in New Zealand, February, 1949, Interim Proceedings ofthe Geological Society of America 1950, pp. 11–13.
Benson, A.M., Little, T.A., Van Dissen, R.J., Hill, N. & Townsend, D.B.,2001. Late Quaternary paleoseismic history and surface rupture charac-teristics of the eastern Awatere strike-slip fault, New Zealand, G.S.A. Bull.,113(8), 1079–1091.
Berryman, K., 1979. Active faulting and derived PHS directions in the SouthIsland, New Zealand, in The origin of the Southern Alps, pp. 29–34, edsWalcott, R.I. & Cresswell, M.M., Wellington: Royal Society of NZ.
Berryman, K.R., Beanland, S., Cooper, A.F., Cutten, H.N., Norris, R.J. &Wood, P.R., 1992. The Alpine Fault, New Zealand, variation in Quaternarystructural style and geomorphic express, Annales Tectonicae, 6, 126–163.
Berryman, K.R., Cooper, A., Norris, R.J., Sutherland, R. & Villamor, P.,1998. Paleoseismic investigation of the Alpine Fault at Haast and Okuru,Geological Society of NZ, Joint Annual Conference,: programme &ab-stracts. Geological Society of NZ miscellaneous publication 101A, 44.
Berryman, K.R., Stirling, M.W., Webb, T.H., Beavan, R.J. & Darby, D.J.,2002. Kinematics and strain at the Australia-Pacific plate boundary,South Island, New Zealand: integration of seismicity, earthquake geol-
ogy, geodesy and plate motions, Western Pacific AGU Meeting abstracts,Eos, 83(22:supplement), WP71.
Beutler, G. et al., 2001. Bernese GPS Software Version 4.2, eds Hugentobler,U., Schaer, S., Fridez, P., Astronomical Institute, University of Berne.
Browne, G.H., 1992. The northeastern portion of the Clarence Fault: tectonicimplications for late Neogene evolution of Marlborough, New Zealand,N.Z. J. Geol. and Geophys., 35, 437–445.
Cande, S. & Stock, J., 2004. Pacific-Antarctic-Australia motion and theformation of the Macquarie Plate, Geophys. J. Int., 157, 399–414.
Carter, R.M. & Norris, R.J., 1976. Cainozoic history of southern NewZealand: an accord between geological observations and plate tectonicpredictions, Earth planet. Sci. Lett., 31, 85–94.
Carter, L., Lewis, K.B. & Davey, F., 1988. Faults in Cook Strait and theirbearing on the structure of central New Zealand, N.Z. J. Geol. and Geo-phys., 31, 431–446.
Cashman, S.M., Kelsey, H.M., Erdman, C.F., Cutten, H.N.C. & Berryman,K.R., 1992. Strain partitioning between structural domains in the forearcof the Hikurangi subduction zone, New Zealand, Tectonics, 11, 242–257.
Cooper, A.F. & Norris, R.J., 1994. Anatomy, structural evolution, and slip rateof a plate-boundary thrust : The Alpine Fault at Gaunt Creek, Westland,New Zealand, G. S. A. Bull., 106(5), 627–633.
Cooper, A.F. & Norris, R.J., 1995. Displacement on the Alpine Fault at HaastRiver, South Westland, New Zealand, N.Z. J. Geol. and Geophys., 38(4),509–514.
Cooper, A.F., Barreiro, B.A., Kimbrough, D.L. & Mattinson, J.M., 1987.Lamprophyre dyke intrusion and the age of the Alpine fault, New Zealand,Geology, 15, 941–944.
Cowan, H.A., 1989. An evaluation of the Late Quaternary displacements andseismic hazard associated with the Hope and Kakapo Faults, Amuri Dis-trict, North Canterbury, PhD thesis, Canterbury University, New Zealand.
Cowan, H.A., 1990. Late Quaternary displacements on the Hope Fault atGlynn Wye, North Canterbury, N.Z. J. Geol. and Geophys., 33, 285–293.
Cowan, H., Nicol, A. & Tonkin, P., 1996. A comparison of historical andpaleoseismicity in a newly formed fault zone and a mature fault zone,North Canterbury, New Zealand, J. geophys. Res., 101, 6021–6036.
Cox, S.C. & Findlay, R.H., 1995. The Main Divide Fault Zone and its rolein formation of the Southern Alps, N.Z. J. Geol. and Geophys, 38, 489–499.
Darby, D.J. & Beavan, J., 2001. Evidence from GPS measurements for con-temporary plate coupling on the southern Hikurangi subduction thrustand partitioning of strain in the upper plate, J. geophys. Res., 106(B12),30 881–30 891.
Davey, F.J., Henyey, T., Kleffmann, S., Melhuish, A., Okaya, D., Stern, T.A.& Woodward, D.J., 1995. Crustal reflections from the Alpine Fault zone,South Island, New Zealand, N.Z. J. Geol. and Geophys., 38, 601–604.
DeMets, C., Gordon, R.G., Argus, D.F. & Stein, S., 1994. Effect of recentrevisions to the geomagnetic reversal time scale on estimates of currentplate motions, Geophys. Res. Lett., 21, 2191–2194.
Doser, D.I. & Webb, T., 2003. Source parameters of large historical (1917–1961) earthquakes, North Island, New Zealand, Geophys. J. Int., 152,795–832.
Doser, D.I., Webb, T.H. & Maunder, D.E., 1999. Source parameters of largehistoric (1918–1962) earthquakes, South Island, New Zealand, Geophys.J. Int., 139, 769–794.
Eberhart-Phillips, D. & Reyners, M., 2001. A complex, young subduc-tion zone imaged by three-dimensional seismic velocity, Fiordland, NewZealand, Geophys. J. Int., 146, 731–746.
Ellis, S., Beavan, J. & Eberhart-Phillips, D., 2006. Bounds on the widthof mantle lithosphere flow derived from surface geodetic measurements:Application to central Southern Alps, New Zealand, Geophys. J. Int., 166,403–417..
Fitch, T.J., 1972. Plate convergence, transcurrent faults, and internal defor-mation adjacent to Southeast Asia and the Western Pacific, J. geophys.Res., 77, 4432–4460.
Gamble, J.A., Price, R.C., Smith, I.E.M., McIntosh, W.C. & Dunbar, N.W.,2003. 40Ar/39Ar geochronology of magmatic activity, magma flux andhazards at Ruapehu volcano, Taupo Volcanic Zone, New Zealand, J. Volc.geotherm. Res., 120, 271–287.
C© 2006 The Authors, GJI
Journal compilation C© 2006 RAS

November 17, 2006 20:55 Geophysical Journal International gji3183
20 L. M. Wallace et al.
Hall, L.S., Lamb, S.H. & Niocaill, C.M., 2004. Cenozoic distributedrotational deformation, South Island, New Zealand, Tectonics, 23(2),doi:10.1029/2002TC001421.
Holt, W.E., Kreemer, C., Haines, A.J., Estey, L., Meertens, C., Blewitt, G.& Lavallee, D., 2005. Project helps constrain continental dynamics andseismic hazards, EOS, Trans. Am. geophys. Un., 86, 383–387.
Howard, M., Nicol, A., Campbell, J. & Pettinga, J.R., 2005. Holocene pa-leoearthquakes on the strike-slip Porters Pass Fault, Canterbury, NewZealand, N.Z. J. Geol. and Geophys., 48, 59–74.
Hull, A.G. & Berryman, K.R., 1986. Holocene tectonism in the region ofthe Alpine Fault at Lake McKerrow, Fiordland, New Zealand, in RecentCrustal Movements of the Pacific Region, pp. 317–331, eds. W.I. Reillyand B.E. Harford, Royal Soc. NZ Bulletin, 24, New Zealand.
Kleffmann, S., Davey, F.J., Melhuish, A., Okaya, D. & Stern, T., 1998. Crustalstructure in the central South Island, New Zealand, from the Lake Pukakiseismic experiment. N.Z. J. Geol. and Geophys., 41(1), 39–49.
Kneupfer, P.L.K., 1984. Tectonic geomorphology and present-day tectonicsof the Alpine shear system, South Island, New Zealand, PhD thesis, 509pp., University of Arizona, Tuscon.
Kneupfer, P.L.K., 1992. Temporal variations in latest Quaternary slip acrossthe Australian-Pacific plate boundary, northeastern South Island, NewZealand, Tectonics, 11(3), 449–464.
Kneupfer, P.L.K., 1988. Estimating ages of late Quaternary stream terracesfrom analysis of weathering rinds and soils, G. S. A. Bull., 100, 1224–1236.
Koons, P.O., 1987. Some thermal and mechanical consequences of rapiduplift: an example from the Southern Alps, New Zealand, Earth planet.Sci. Lett., 86, 307–319.
Lamb, S., 1987. A model for tectonic rotations about a vertical axis, Earthplanet. Sci. Lett., 84, 75–86.
Lamb, S., 1988. Tectonic rotations about vertical axes during the last 4 Main part of the New Zealand plate boundary zone, J. Structural Geology,10, 875–893.
Langridge, R. & Berryman, K.R., 2005. Morphology and slip rate of theHurunui section of the Hope Fault, South Island, New Zealand, N.Z. J.Geol. and Geophys., 48, 43–57.
Lay, T. & Schwartz, S.Y., 2004. comment on ‘Coupling semantics and sci-ence in earthquake research’, EOS, Trans. Am. geophys. Un., 85(36), 339–340.
Lebrun, J.-F., Lamarche, G. & Collot, J.-Y., 2000. Abrupt strike-slip fault tosubduciton transition: the Alpine Fault-Puysegur trench connection, NewZealand, Tectonics, 19, 688–706.
Leitner, B., Eberhart-Phillips, D., Anderson, H. & Nabelek, J.L., 2001. Afocused look at the Alpine fault, New Zealand: Seismicity, focal mecha-nisms, and stress observations, J. geophys. Res., 106(2), 2193–2220, doi:10.1029/2000JB900303.
Lensen, G.J., 1968. Analysis of progressive fault displacement during down-cutting at the Branch River terraces, South Island, New Zealand, G. S. A.Bull., 79, 545–556.
Litchfield, N.J. & Norris, R.J., 2000. Holocene motion on the Akatore Fault,south Otago coast, New Zealand, N.Z. J. Geol. and Geophys., 43(3), 405–418.
Little, T.A. & Roberts, A.P., 1997. Distribution and mechanism of Neogeneto present-day vertical axis rotations, Pacific-Australian plate boundaryzone, South Island, New Zealand, J. geophys. Res., 102(B9), 20 447–20 468.
Little, T.A., 2004. Transpressive ductile flow and oblique ramping oflower crust in a two-sided orogen: Insight from quartz grain-shapefabrics near the Alpine fault, New Zealand, Tectonics, 23, TC2013,doi:10.1029/2002TC001456.
Little, T.A. & Jones, A., 1998. Seven million years of strike-slip and relatedoff-fault deformation, northeastern Marlborough fault system, South Is-land, New Zealand, Tectonics, 17(2), 285–302.
Little, T.A., Grapes, R. & Berger, G.W., 1998. Late Quaternary strike slipon the eastern part of the Awatere fault, South Island, New Zealand, G. S.A. Bull., 110(2), 127–148.
Malservisi, R., Furlong, K.P. & Anderson, H., 2003. Dynamic uplift in atranspressional regime: numerical model of the subduction area of Fiord-land, New Zealand, Earth planet. Sci. Lett., 206, 349–364.
McCaffrey, R., 1992. Oblique plate convergence, slip vectors, and forearcdeformation, J. geophys. Res., 97(B6), 8905–8915.
McCaffrey, R., 1995. DEF-NODE users guide, Rensselaer Polytechnic In-stitute, Troy, New York, www.rpi.edu/∼mccafr/defnode.
McCaffrey, R., 2002. Crustal block rotations and plate coupling, in PlateBoundary Zones, Vol. 30, pp. 100–122, eds Stein, S. & Freymueller, J.,AGU Geodynamics Series.
McCaffrey, R., 2005. Block kinematics of the Pacific-North Amer-ica plate boundary in the southwestern United States from inver-sion of GPS, seismological and geologic data, J. geophys. Res., 110,doi:10.1029/2004JB003307.
McCaffrey, R., Long, M.D., Goldfinger, C., Zwick, P.C., Nabelek, J.L., John-son, C.K. & Smith, C., 2000a. Rotation and plate locking at the southernCascadia subduction zone, Geophys. Res. Lett., 27, 3117–3120.
McCaffrey, R., Zwick, P.C., Bock, Y., Prawirodirdjo, L., Genrich, J.F.,Stevens, C.W., Puntodewo, S.S.O. & Subaraya, C., 2000b. Strain parti-tioning during oblique plate convergence in northern Sumatra: Geodeticand seismologic constraints and numerical modeling, J. geophys. Res.,105(B12), 28 363–28 376.
McClusky, S., Bjornstad, S.C., Hager, B.H., King, R.W., Meade, B.J., Miller,M.M. & Monastero, F.C., 2001. Present day kinematics of the eastern Cal-ifornia Shear zone from a geodetically constrained block model, Geophys.Res. Lett., 28, 3369–3372.
McKenzie, D.P. & Jackson, J.A., 1983. The relationship between strain rates,crustal thickening, paleomagnetism, finite strain, and fault movementswithin a deforming zone, Earth planet. Sci. Lett., 65, 182–202.
Meade, B.J. & Hager, B.H., 2005. Block models of crustal motion in south-ern California constrained by GPS measurements, J. geophys. Res., 110,B03403, doi:10.1029/2004JB003209.
Melhuish, A., Van Dissen, R. & Berryman, K., 1996. Mount Stewart-Halcombe Anticline: a look inside a growing fold in the Manawatu region,New Zealand, N.Z. J. Geol. and Geophys., 39(1), 123–133.
Molnar, P. et al., 1999. Continuous deformation versus faulting through thecontinental lithosphere of New Zealand, Science, 286, 516–519.
Morgan, W.J., 1968. Rises, trenches, great faults, and crustal blocks, J. geo-phys. Res., 73, 1959–1982.
Mumme, T.C. & Walcott, R.I., 1985. Paleomagnetic studies at GeophysicsDivision, 1980–1983, Report/DSIR Geophysics Division 204, Lower Hutt,New Zealand.
Nicol, A. & Van Dissen, R., 2002. Up-dip partitioning of displacement com-ponents on the oblique-slip Clarence Fault, New Zealand, J. structuralGeol. 24, 1521–1536.
Nicol, A., Van Dissen, R., Vella, P., Alloway, B. & Melhuish, A., 2002.Growth of contractional structures during the last 10 m.y. at the southernend of the emergent Hikurangi forearc basin, New Zealand, N.Z. J. Geol.and Geophys., 45(3), 365–385.
Norris, R.J., Koons, P.O. & Cooper, A.F., 1990. The obliquely-convergentplate boundary in the South Island of New Zealand: implications for an-cient collision zones, J. structural Geol., 12(5–6), 715–725.
Norris, R.J. & Cooper, A.F., 1997. Erosional control on the structural evolu-tion of a transpressional thrust complex on the Alpine Fault, New Zealand,J. structural Geol., 19(10), 1323–1342.
Norris, R.J. & Cooper, A.F., 2001. Late Quaternary slip rates and slip par-titioning on the Alpine Fault, New Zealand, J. structural Geol., 23, 507–520.
Norris, R.J. & Carter, R.M., 1982. Fault-bounded blocks and their role inlocalising sedimentation and deformation adjacent to the Alpine Fault,Southern New Zealand, Tectonophysics, 87, 11–23.
Okada, Y., 1985. Surface deformation to shear and tensile faults in a half-space, Bull. seism. Soc. Am., 75, 1135–1154.
Pettinga, J.R., Yetton, M.D., Van Dissen, R.J. & Downes, G.L., 2001. Earth-quake source identification and characterisation for the Canterbury region,South Island, New Zealand. Bull. of the N.Z. Soc. for Earthquake Engi-neering, 34(4), 282–317.
Press, W.H., Flannery, B.P., Teukolsky, S.A. & Vetterling, W.T., 1989. Nu-merical Recipes, Cambridge University Press, Cambridge.
Price, R.C., Gamble, J.A., Smith, I.E.M., Stewart, R.B., Eggins, S. & Wright,I.C., 2005. An integrated model for the temporal evolution of andesites
C© 2006 The Authors, GJI
Journal compilation C© 2006 RAS

November 17, 2006 20:55 Geophysical Journal International gji3183
Balancing the plate motion budget, South Island, New Zealand 21
and rhyolites and crustal development in New Zealand’s North Island, J.Volc. geotherm. Res., 140, 1–24.
Rattenbury, M.S., 1986. Late low-angle thrusting and the Alpine Fault, cen-tral Westland, New Zealand. N.Z. J. Geol. and Geophys., 29(4), 437–446.
Reyners, M., Robinson, R. & McGinty, P., 1997. Plate coupling in the north-ern South Island and southernmost North Island, New Zealand, as il-luminated by earthquake focal mechanisms, J. geophys. Res., 102(B7),15 197–15 210.
Reyners, M. & Webb, T., 2002. Large earthquakes near Doubtful Sound,New Zealand, 1989–93, N.Z. J. Geol. and Geophys., 45, 109–120.
Reyners, M. & Robertson, E., 2004. Intermediate depth earthquakes beneathNelson, New Zealand and the southwestern termination of the subductedPacific plate, Geophys. Res. Lett., 31, doi: 10.1029/2003GL019201.
Reyners, M.E. et al., 2003. The M w 7.2 Fiordland earthquake of August21, 2003: background and preliminary results, Bull. of the N.Z. Soc. forEarthquake Engineering, 36(4), 233–248.
Roberts, A.P., 1992. Paleomagnetic constraints on the tectonic rotation of theSouthern Hikurangi margin, New Zealand, N.Z. J. Geol. and Geophys.,35, 311–323.
Rothacher, M. & Mervart, L. (eds.), 1996. Documentation of the BerneseGPS Software Version 4.0, 418 pp, Astron. Inst., Univ. of Bern, Bern,Switzerland.
Savage, J.C., 1983. A dislocation model of strain accumulation and releaseat a subduction zone, J. geophys. Res., 88, 4984–4996.
Savage, J.C., Gan, W. & Svarc, J.L., 2001. Strain accumulation and rotationin the eastern California shear zone, J. geophys. Res., 106, 21 995–22 007.
Scholz, C., 1990. The mechanics of earthquakes and faulting, CambridgeUniv. Press, 439 pp.
Schouten, H., Kiltgord, K.D. & Gallo, D.G., 1993. Edge-driven microplatekinematics, J. geophys. Res., 98, 6689–6701.
Sibson, R.H., White, S.H. & Atkinson, B.K., 1981. Structure and distributionof fault rocks in the Alpine Fault Zone, New Zealand, Geological Societyof London Special Publication, 9, 197–210.
Stern, T., Molnar, P., Okaya, D. & Eberhart-Phillips, D., 2000. TeleseismicP wave delays and modes of shortening the mantle lithosphere beneathSouth Island, New Zealand, J. geophys. Res., 105(B9), 21 615–21 631.
Stern, T., Kleffmann, S., Okaya, D., Scherwath, M. & Bannister, S., 2001.Lower seismic wave speeds and enhanced fluid pressures beneath theSouthern Alps, New Zealand, Geology, 29(8), 679–682.
Stirling, M.W., McVerry, G.H. & Berryman, K.R., 2002. A new seismichazard model for New Zealand, Bull. seism. Soc. Am., 92, 1878–1903.
Sutherland, R., 1995. The Australia-Pacific boundary and Cenozoic platemotions in the SW Pacific: Some constraints from Geosat data, Tectonics,14, 819–831.
Sutherland, R. & Norris, R.J., 1995. Late Quaternary displacement rate,paleoseismicity and geomorphic evolution of the Alpine fault: Evidencefrom near Hokuri Creek, south Westland, New Zealand, N.Z. J. Geol. andGeophys., 38(4), 431–450.
Sutherland, R., Berryman, K. & Norris, R., 2006. Quaternary slip rate andgeomorphology of the Alpine Fault: implications for kinematics and seis-mic hazard in southwest New Zealand, G.S.A. Bulletin, 118(3/4), 464–474.
Townsend, D.B. & Little, T.A., 1998. Pliocene-Quaternary deformation andnear-surface strain near the eastern tip of the Clarence Fault, north-east Marlborough, New Zealand, N.Z. J. Geol. and Geophys., 41, 401–417.
Upton, P., Craw, D., James, Z. & Koons, P.O., 2004. Structure and lateCenozoic tectonics of the Southern Two Thumb Range, mid Canterbury,New Zealand, N.Z. J. Geol. and Geophys., 47(1), 141–153.
Van Dissen, R. & Berryman, K.R., 1996. Surface rupture earthquakes overthe last ∼1000 years in the Wellington region, New Zealand, and implica-tions for ground shaking hazard, J. geophys. Res., 101(B3), 5999–6019.
Van Dissen, R. & Yeats, R.S., 1991. Hope fault, Jordan thrust, and uplift ofthe Seaward Kaikoura Range, New Zealand, Geology, 19, 393–396.
Van Dissen, R.J., Hull, A.G. & Read, S.A.L., 1994. Timing of some largeHolocene earthquakes on the Ostler Fault, New Zealand, in Proceedingsof the Eighth International Symposium on Recent Crustal Movements(CRCM ’93), Kobe, December 6–11, 1993, pp. 381–386, Japan: GeodeticSociety of Japan.
Vickery, S., 1994. Cenozoic deformation in a plate boundary zone, Marl-borough, New Zealand, D. Phil. Thesis, Univ. Oxford, Oxford, UK.
Vickery, S. & Lamb, S., 1995. Large tectonic rotations since the EarlyMiocene in a convergent plate-boundary zone, South Island, New Zealand,Earth planet. Sci. Lett., 136(4), 3–59.
Villamor, P. & Berryman, K.R., 2001. A late Quaternary extension rate inthe Taupo Volcanic Zone, New Zealand, derived from fault slip data, N.Z.J. Geol. and Geophys., 44, 243–269.
Villamor, P. & Berryman, K.R., 2006. Evolution of the southern terminationof the Taupo Rift, New Zealand, N.Z. J. Geol. and Geophys., 49, 23–37.
Walcott, R.I., 1984. The kinematics of the plate boundary zone through NewZealand: a comparison of short- and long-term deformations, Geophys. J.R. astr. Soc., 79, 613–633.
Walcott, R.I., 1998. Modes of oblique compression: Late Cenozoic tectonicsof the South Island of New Zealand, Rev. geophys., 36(1), 1–26.
Walcott, R.I., Christoffel, D.A. & Mumme, T.C., 1981. Bending within theaxial tectonic belt of New Zealand in the last 9 Myr from paleomagneticdata, Earth planet. Sci. Lett., 136, 43–59.
Wallace, L.M., Beavan, R.J., McCaffrey, R. & Darby, D.J., 2004a.Subduction zone coupling and tectonic block rotations in theNorth Island, New Zealand., J. geophy. Res., 109(B12), B12406,doi:10.1029/2004JB003241.
Wallace, L.M. et al., 2004b. GPS and seismological constraints on activetectonics and arc-continent collision in Papua New Guinea: Implicationsfor mechanics of microplate rotations in a plate boundary zone, J. geophys.Res., 109, B05404, doi:10.1029/2003JB002481.
Wallace, L.M., McCaffrey, R., Beavan, J. & Ellis, S., 2005. Rapid microplaterotations and back-arc rifting at the transition between collision and sub-duction, Geology, 33(11), 857–860, doi:10.1130/621834.1.
Wang, K. & Dixon, T., 2004. ‘Coupling’ semantics and science in earthquakeresearch, EOS, Trans. Am. geophys. Un., 85(18), 180.
Webb, T.H. & Anderson, H., 1998. Focal mechanisms of large earthquakesin the North Island of New Zealand: slip partitioning at an oblique activemargin, Geophys. J. Int., 134, 40–86.
Wellman, H.W., 1953. Data for the study of Recent and late Pleistocene fault-ing in the South Island of New Zealand, N.Z. J. of Science and Technology,34B, 270–288.
Wellman, H.W., 1979. An uplift map for the South Island of New Zealandand a model for uplift of the Southern Alps, in The origin of the SouthernAlps, pp. 13–20, eds Walcott, R.I. & Cresswell, M.M., Wellington: RoyalSociety of New Zealand.
Wessel, P. & Smith, W.H.F., 1995. New version of the Generic MappingTools released, EOS, Trans. Am. geophys. Un., 76, F329.
Wilson, G.S. & McGuire, D.M., 1995. Distributed deformation due to cou-pling across a subduction thrust: mechanism of young tectonic rotationwithin the south Wanganui basin, New Zealand, Geology, 23(7), 645–648.
Wood, R.A., Pettinga, J.R., Bannister, S., Lamarche, G. & McMorran, T.J.,1994. Structure of the Hanmer strike-slip basin, Hope fault, New Zealand,G.S.A. Bull., 106, 1459–1473.
Wright, C.A., 1998. Geology and paleoseismicity of the central Alpine Fault,New Zealand, MSc thesis, University of Otago, Dunedin, New Zealand.
Wright, I.C. & Walcott, R.I., 1986. Large tectonic rotation of part of NewZealand in the last 5 Ma, Earth planet. Sci. Lett., 80, 348–352.
Wright, C.A., Norris, R.J. & Cooper, A.F., 1997. Mapping of the centralAlpine Fault, stage 1: Mikonui to Waitaha rivers, Westland. in Geologi-cal Society of NZ 1997 Annual Conference: 25–27 November, Welling-ton: programme and abstracts, Vol. 95A, p. 172, ed. Skinner, D.N.B.,Geological Society of, N.Z. miscellaneous publication, Wellington,New Zealand.
Yeats, R.S. & Berryman, K.R., 1987. South Island, New Zealand and Trans-verse Ranges, California: a seismotectonic comparison, Tectonics, 6(3),363–376.
Yetton, M.D., Wells, A. & Traylen, N.J., 1998. The probabilities and conse-quences of the next Alpine Fault earthquake, NZ Earthquake Commission,Research Report, 95/193.
Zachariasen, J., Berryman, K., Langridge, R., Prentice, C., Rymer, M.,Stirling, M. & Villamor, P., 2006. Timing of late Holocene surface rup-ture of the Wairau Fault, Marlborough, New Zealand, N.Z. J. Geol. andGeophys., 49, 159–174.
C© 2006 The Authors, GJI
Journal compilation C© 2006 RAS