
Balancing Supply and Demand in an ETS...Supply and Demand Balance Features of the Quebec and...
11
Balancing Supply and Demand in an ETS November 29, 2019 Jean-Yves Benoit Director, Carbon Market Division Government of Quebec
Transcript of Balancing Supply and Demand in an ETS...Supply and Demand Balance Features of the Quebec and...

Balancing Supply and
Demand in an ETS
November 29, 2019
Jean-Yves Benoit
Director, Carbon Market Division
Government of Quebec

Why Balancing Supply and Demand ?
To assure short, medium and long term stability to the price of allowances in order to drive
investments from the private sector

Flexibility Mechanism
• Most ETS’s allow for “Banking” as a flexibility mechanism:
– PRO : Allows for actual/past vintages to keep a market value
– CON : If the ETS is over allocated (caps are too high due lack of
ambition or due to greater mitigation effort from covered sources
than expected), then Banking will drive the long term price of
allowance towards zero
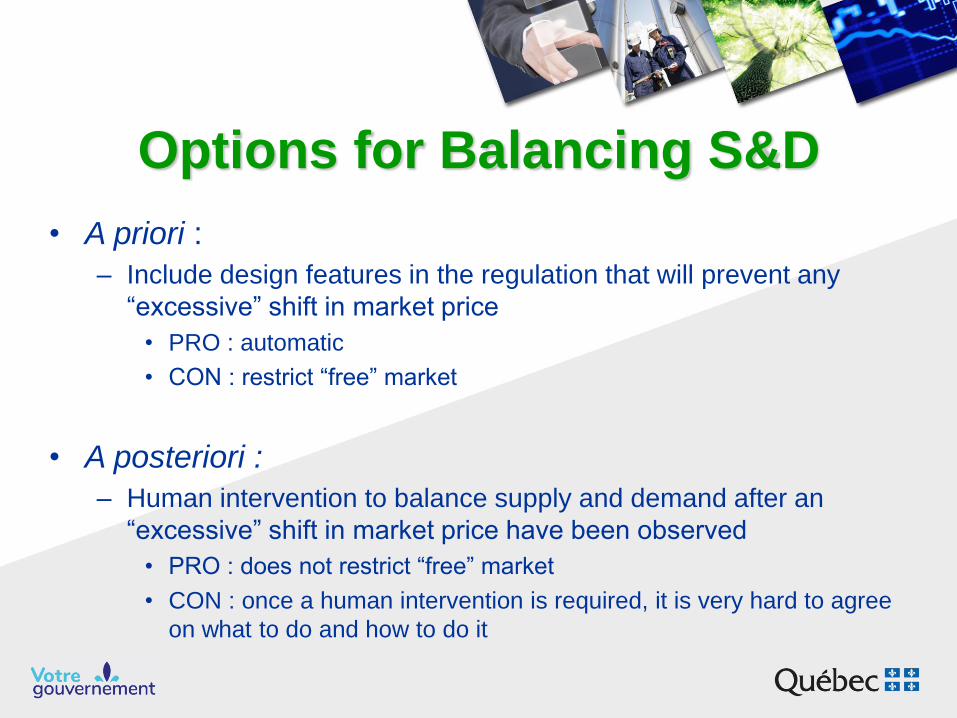
Options for Balancing S&D
• A priori :
– Include design features in the regulation that will prevent any
“excessive” shift in market price
• PRO : automatic
• CON : restrict “free” market
• A posteriori :
– Human intervention to balance supply and demand after an
“excessive” shift in market price have been observed
• PRO : does not restrict “free” market
• CON : once a human intervention is required, it is very hard to agree
on what to do and how to do it

Supply and Demand Balance Features of the
Quebec and California ETS
• Auction Reserve Price (market floor price) :
• Joint Auctions : Maximum of QC and CA reserve price based on the most
recent exchange rate
• Each jurisdictions’ regulation define an annual minimum price
• Annual minimum prices increase yearly by 5% plus inflation (inflation rates
differ)
– Unsold allowances are removed from the market (set aside)
– Unsold allowances can be put back at auction after two consecutive
auctions close above the Auction Reserve Price
– Option : unsold allowances could be definitely removed from the market if
they are not brought back to be sold at auctions after a certain period of
time
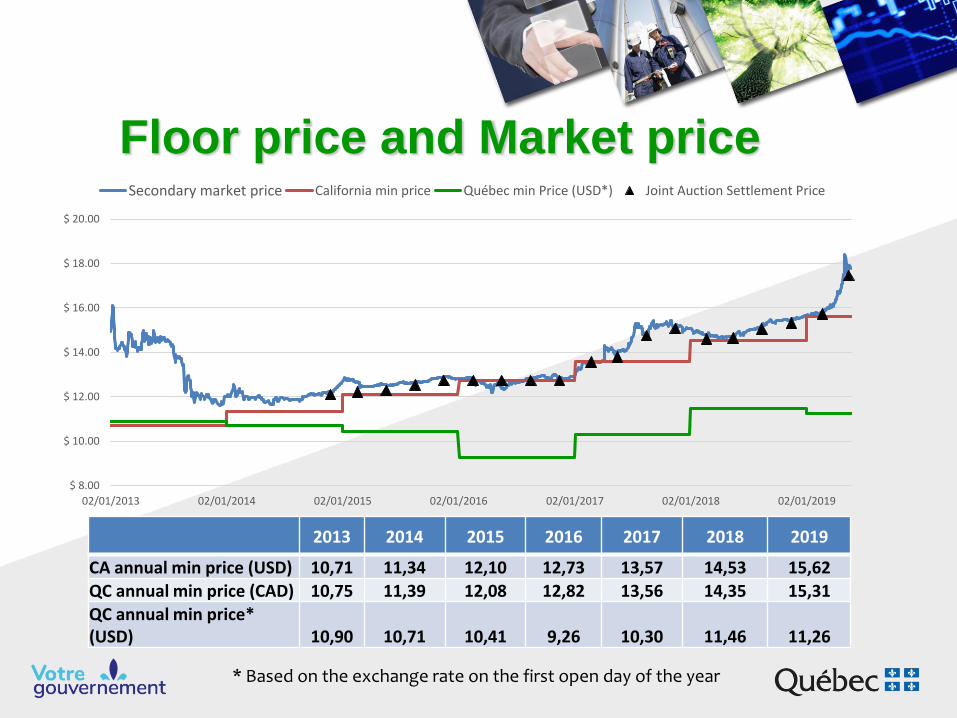
2013 2014 2015 2016 2017 2018 2019
CA annual min price (USD) 10,71 11,34 12,10 12,73 13,57 14,53 15,62QC annual min price (CAD) 10,75 11,39 12,08 12,82 13,56 14,35 15,31QC annual min price* (USD) 10,90 10,71 10,41 9,26 10,30 11,46 11,26
* Based on the exchange rate on the first open day of the year
$ 8.00
$ 10.00
$ 12.00
$ 14.00
$ 16.00
$ 18.00
$ 20.00
02/01/2013 02/01/2014 02/01/2015 02/01/2016 02/01/2017 02/01/2018 02/01/2019
Secondary market price California min price Québec min Price (USD*) Joint Auction Settlement Price
Floor price and Market price

USD – CAD Exchange rate
0.95
1.05
1.15
1.25
1.35
1.45
02
/01
/20
13
02
/03
/20
13
02
/05
/20
13
02
/07
/20
13
02
/09
/20
13
02
/11
/20
13
02
/01
/20
14
02
/03
/20
14
02
/05
/20
14
02
/07
/20
14
02
/09
/20
14
02
/11
/20
14
02
/01
/20
15
02
/03
/20
15
02
/05
/20
15
02
/07
/20
15
02
/09
/20
15
02
/11
/20
15
02
/01
/20
16
02
/03
/20
16
02
/05
/20
16
02
/07
/20
16
02
/09
/20
16
02
/11
/20
16
02
/01
/20
17
02
/03
/20
17
02
/05
/20
17
02
/07
/20
17
02
/09
/20
17
02
/11
/20
17
02
/01
/20
18
02
/03
/20
18
02
/05
/20
18
02
/07
/20
18
02
/09
/20
18
02
/11
/20
18
02
/01
/20
19
02
/03
/20
19
02
/05
/20
19
02
/07
/20
19
02
/09
/20
19
1,00

Supply and Demand Balance Features of the
Quebec and California ETS
• Cost Containment Reserve (market ceiling price) :
– Made of: 1% of 2013-2014 Caps, 4% of 2015-2017 Caps and 7% of 2018-2020 Caps
• About 20 million allowances for Québec and only available to Québec covered entities
• About 120 million allowances for California and only available to California covered entities
– Allowances divided in 3 equal tiers:
• Tier 1: available at $40 in 2013, price increasing at 5% plus inflation per year
• Tier 2: available at $45 in 2013, price increasing at 5% plus inflation per year
• Tier 3: available at $50 in 2013, price increasing at 5% plus inflation per year
– 4 quaterly Cost Containment Reserve Sales per year
• For Québec, up to 4 sales per year
• QC and CA : allowances are transferred in the entity’s compliance account (not tradeable on the market)

8
18
28
38
48
58
68
78
2013 2014 2015 2016 2017 2018 2019
Min Tier 1 Tier 2 Tier 3
Min (USD) A (USD) B (USD) C (USD)
Québec reserve prices in CAD California reserve prices in USD in
comparison of Québec reserve
prices affected by the USD/CAD
exchange rate
8
18
28
38
48
58
68
78
2013 2014 2015 2016 2017 2018 2019
Min A B C
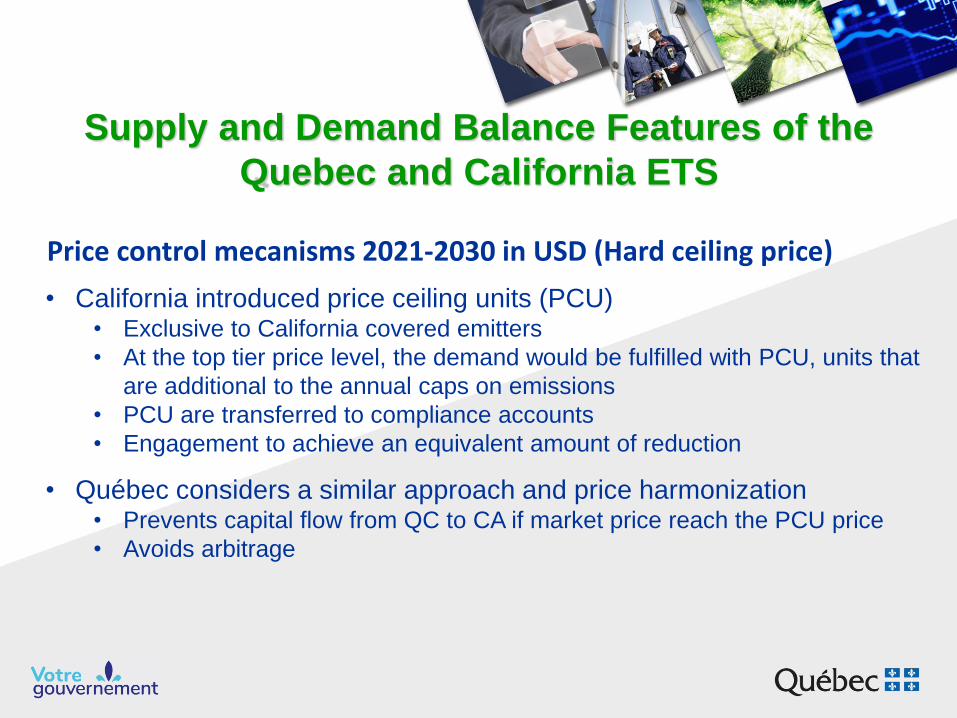
Supply and Demand Balance Features of the
Quebec and California ETS
Price control mecanisms 2021-2030 in USD (Hard ceiling price)
• California introduced price ceiling units (PCU) • Exclusive to California covered emitters
• At the top tier price level, the demand would be fulfilled with PCU, units that
are additional to the annual caps on emissions
• PCU are transferred to compliance accounts
• Engagement to achieve an equivalent amount of reduction
• Québec considers a similar approach and price harmonization• Prevents capital flow from QC to CA if market price reach the PCU price
• Avoids arbitrage

Thanks!


