Balanced Scorecard: el Mapa Estratégico en el Balanced Scorecard (BSC)

Balanced Scorecard
• Balanced Budget • Overtime /Agency Use
•Staff Engagement •Performance Appraisal
Completion •Staff Turnover Rate •Vacancy Rate •Absenteeism •Lost Time Claim Frequency •PIR Audit Results •Altercations in the Workplace
•Utilization Rates •New Capacity Occupancy Rate
•Client Satisfaction •Hand Hygiene •Rate of Seasonal Influenza
Immunization •Discharges to Acute Care •Continuing Care Health Services
Standards Audit Results •Accommodation Standards
Audit Results
Satisfied Clients
Targeted Service
Development
Cost Effective Organization
Progressive Work
Environment


Q3
Year End
2015-16 Q1 Q2 Q3 Q4 Target Page
Satisfied Clients F 13 G 13 H 13 I 13
Client Satisfaction - Rehabilitation & Recovery 95.60% 95.2% 95.0% 93.9% 0.0% >90% 1
Client Satisfaction - Community Services 91% 88.5% 99.4% 98.4% 0.0% >90% 3
Client Satisfaction - LTC Residents2 92.80%Reported
Q4
Reported
Q4
Reported
Q4 >85% -
Hand Hygiene Audits 97% 98.0% 98.0% 98.3% 0.0% >90% 5
Rates of Seasonal Influenza Immunization (LTC)2 87.80%Reported
Q3
Reported
Q387.0%
Reported
Q3>95% 7
Outbreak rate - Gastrointestinal 2 1.96%Reported
Q4
Reported
Q4
Reported
Q40.00% TBD -
Outbreak rate - Respiratory 2 0.62%Reported
Q4
Reported
Q4
Reported
Q40.00% TBD -
Discharges to Acute Care as Percentage of Beds 17.7% 14.3% 14.9% 16.9% 0% <13.5% 8
Continuing Care Standards Met2 94.20% 59% No Audit 74.0%Reported
Q1100% 11
Accommodations Standards Met2 76.70%Reported
Q3
Reported
Q3100.0%
Reported
Q3100% 13
Targeted Service Development
LTC/SL4 Utilization Rate1 98.50% 98.4% 98.6% 98.5% 0.0% >99% 14
Hospice Utilization Rate1 83.00% 91.1% 89.0% 89.4% 75.2% >85% 16
R&R Utilization Rate1 99.10% 97.0% 97.7% 98.2% 82.5% >97% 18
Community Services Utilization Rate1 92.50% 91.2% 89.1% 91.2% 0.0% >90% 20
Progressive Work Environment
Staff Overall Engagement2 92%Reported
Q4
Reported
Q4
Reported
Q4#DIV/0! >85% -
Annual Performance Appraisal Completion Rate1 86% 83% 83% 79% 0% >90% 22
Staff Commitment - Annualized Turnover Rate1 5.8% 5.2% 5.4% 5.3% 0.0 <8% 24
Vacancy1 2.30% 2.1% 2.0% 1.0% 0.0% <4% 26
Absenteeism - Sick Rate 41% 42% 44% 38% 0.00% TBD 27
Lost Time Claim Frequency 0.6% 0.4% 0.4% 0.7% 0 <0.5% 29
Aggression in the Workplace 1.80% 2.3% 2.0% 1.2% 0.0% 0% 31
PIR Annual Audit Results2 93%No Audit
This Year
No Audit
This Year
No Audit
This Year
Reported
Q1>95% -
Cost Effective Organization
Balanced Budget (Variance)1 0.05% 1.0% 2.6% 0.50% 0.00% >.8% 33
Overtime/Agency Costs as a Percentage of Cost of Total
Worked Hours1 1.00% 0.73% 0.86% 0.82% 0.00 <1% 34
1 Rolling average - Q4 is year end 2 Annual indicator
Balanced Scorecard 2016/17


Goal Area:
• Satisfied Clients ■ • Progressive Work Environment □
• Targeted Service Development □ • Cost Effective Organization □
2015/16 2016/17Q1 Q2 Q3 Q4 Q1 Q2 Q3 Q4
Satisfaction Rate (percentage) 97.90% 96.80% 96.50% 95.60% 95.24% 95.00% 93.88% 0.0Target (percentage) 90% 90% 90% 90% 90% 90% 90% 90%Sample Size 195 173 256 181 215 0 196 0
CAREWEST CORPORATE PERFORMANCE INDICATOR
Client Experience - Rehabilitation & Recovery Programs
Rehabilitation & Recovery Client Experience Rate
Accountability for Analysis and Action: Directors and Managers in Rehabilitation & Recovery Programs
Definition: Number of R&R clients responding positively to "Overall I am satisfied" to total number of responses .
Analysis: Q3
Plan for Improvement/Timelines: Units to review specific results and identify any key themes
Gradual downward trend continues - while some units may need to review client engagement processes, there is a consistent area of concern related to meal satisfaction.
Data Source: R&R Client Survey results collated quarterly by Quality & Service Improvement
Why it's important High performing teams value input from clients to provide insights as to where the team is working well
and where there are opportunities to improve. Surveys are one of several ways to collect this data.
Limitations: Values are based on those clients who choose to respond to the survey.
0.00%
20.00%
40.00%
60.00%
80.00%
100.00%
120.00%
Q1 Q2 Q3 Q4 Q1 Q2 Q3 Q4
2015/16 2016/17
Satisfaction Rate (percentage) Target (percentage)
1
Q1#
Responses
Discharge
#
Response
RateQ2
#
Responses
Discharge
#
Response
RateQ3 # Responses
Discharge
#
Response
RateQ4 # Responses
Discharge
#
Response
Rate
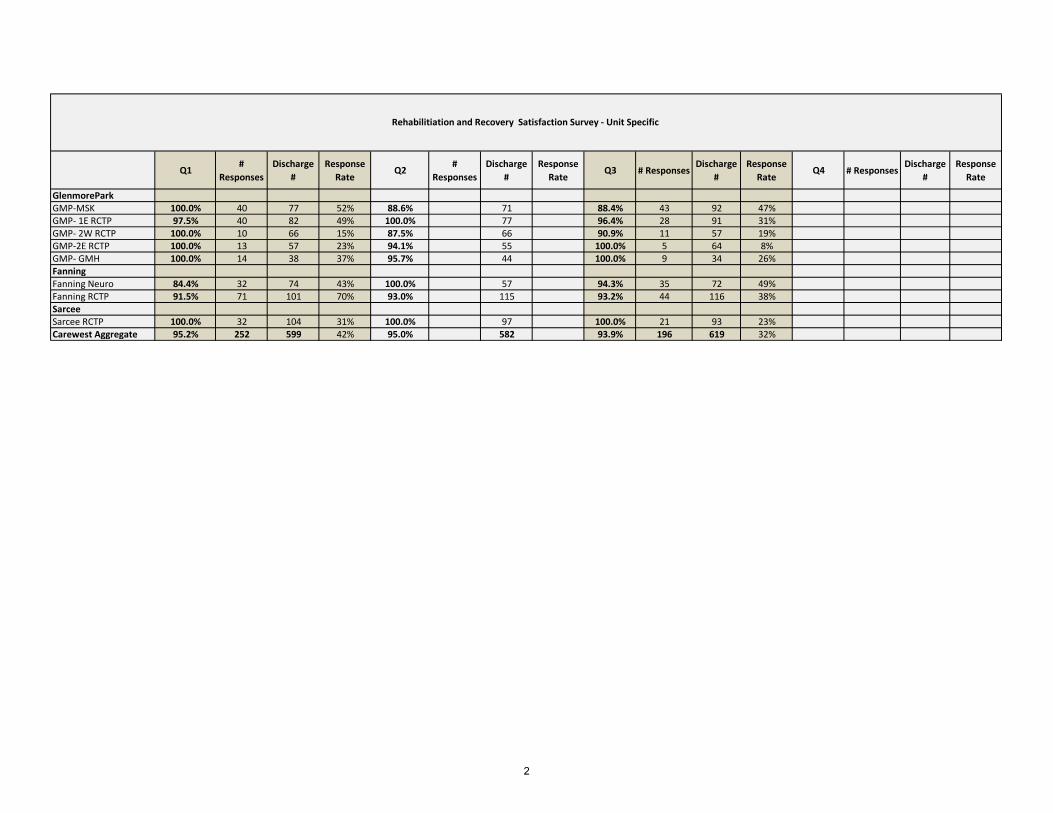
GlenmoreParkGMP-MSK 100.0% 40 77 52% 88.6% 71 88.4% 43 92 47%GMP- 1E RCTP 97.5% 40 82 49% 100.0% 77 96.4% 28 91 31%GMP- 2W RCTP 100.0% 10 66 15% 87.5% 66 90.9% 11 57 19%GMP-2E RCTP 100.0% 13 57 23% 94.1% 55 100.0% 5 64 8%GMP- GMH 100.0% 14 38 37% 95.7% 44 100.0% 9 34 26%FanningFanning Neuro 84.4% 32 74 43% 100.0% 57 94.3% 35 72 49%Fanning RCTP 91.5% 71 101 70% 93.0% 115 93.2% 44 116 38%SarceeSarcee RCTP 100.0% 32 104 31% 100.0% 97 100.0% 21 93 23%Carewest Aggregate 95.2% 252 599 42% 95.0% 582 93.9% 196 619 32%
Rehabilitiation and Recovery Satisfaction Survey - Unit Specific
2

Goal Area:
• Satisfied Clients ■ • Progressive Work Environment □
• Targeted Service Development □ • Cost Effective Organization □
2015/2016 2016/2017Q1 Q2 Q3 Q4 Q1 Q2 Q3 Q4
Satisfaction Rate % 100.0% 99% 0.0% 91.1% 88.5% 99.4% 98.4% 0.0%Target percentage 90.0% 90.0% 90.0% 90.0% 90.0% 90.0% 90.0% 90.0%Sample size 29 152 0 61 0 53 220 0
Note 1: No surveys administered in these quarters
Community Services Client Experience Rate
CAREWEST CORPORATE PERFORMANCE INDICATOR
Client Experience- Community Services
Definition: Average number of clients responding positively to overall satisfaction with service received.
sample sizes vary by program - refer to Community Client Experience details page
Why it's important High performing teams value input from clients to provide insights as to where the team is working well and
where there are opportunities to improve. Surveys are one of several ways to collect this data.
Limitations: Values are based on those clients who choose to respond to the survey.
Accountability for Analysis and Action: Directors and Managers in Community Programs
Analysis: Q3
Plan for Improvement/Timelines: (required where target is not achieved)
Data Source: Community Programs Client Experience Surveys collated quarterly by Inf. Management and Privacy
Strong results across the programs reporting this quarter. C3 is slightly lower but still reporting high levels of satisfaction.
0.0%
20.0%
40.0%
60.0%
80.0%
100.0%
120.0%
Q1 Q2 Q3 Q4 Q1 Q2 Q3 Q4
2015/2016 2016/2017
Satisfaction Rate % Target percentage
3

Q1 # ResponsesDischarge
#
Response
RateQ2
#
Responses
Discharge
#
Response
RateQ3
#
Responses
Discharge
#
Response
RateQ4
#
Responses
Discharge
#Seating Clinic 88.5% 28 100.0% 26 134 19% 96.3% 27 154 18%Day Hospital 100.0% 23 42 55% 100.0% 15 44 34%DH -Living with Dementia 100.0% 4 22 18% 100.0% 5 22 23%ASDP -SPASDP-CBYADSC3 SouthC3 NorthC3 total 97.4% 97.4%DAL NHDAL CBTotal 88.5% 28 0 99.4% 53 198 31% 98.4% 47 220 74%
Community Services Satisfaction Survey - Unit Specific
4

Goal Area:
• Satisfied Clients ■ • Progressive Work Environment □
• Targeted Service Development □ • Cost Effective Organization □
2015/16 2016/17Q1 Q2 Q3 Q4 Q1 Q2 Q3 Q4
Positve Observation Rate (%) 97% 95% 97% 97% 98.0% 98.0% 98.3%Target percentage) 85% 85% 85% 85% 85% 85% 85% 85%# Moments 857 773 542 790 980 848 663
Hand Hygiene Observations
CAREWEST CORPORATE PERFORMANCE INDICATOR
Hand Hygiene Observations
Definition: total number of correct moments observed over total number of moments observed.
Limitations: Standard measurement in Canada is to inform staff that they are being observed prior to the observation
Why it's important Hand hygiene by staff and physicians contributes to a safer environment for clients, with reduced transmission of
communicable diseases.
Accountability for Analysis and Action: Directors and Managers in all programs
Analysis: Q3
Plan for Improvement/Timelines: (required where target is not achieved)
Data Source: Hand Hygiene Audits completed at sites and coordinated by IPC Practitioner.
5 sites did not meet their quarterly target for number of observations.
3 units did not submit any observations for the quarter.
All sites combined reached 98% for correct hand hygiene moments observed.
Observers still require quarterly reminders from IP&C to complete hand hygiene observations.
75%
80%
85%
90%
95%
100%
Q1 Q2 Q3 Q4 Q1 Q2 Q3 Q4
2015/16 2016/17
Positve Observation Rate (%)
Target percentage)
5

Site # of Moments# of Correct
Moments
Correct
MomentsComments
Adult Day Program 29 29 100%
Target 12.5 85%
Colonel Belcher - ADP 6 6
Signal Pointe - ADP 23 23
YADS 0 0
Colonel Belcher 23 23 100%
Target 50 85%
Colonel Belcher - 1st Floor 8 8
Colonel Belcher - 2nd Floor 15 15
C3 23 23 100%
Target 12.5 85%
Beddington - C3 8 8
Sarcee - C3 15 15
DAL 7 6 86%
Target 12.5 85%
Colonel Belcher - DAL 4 3
Nickle House - DAL 3 3
Dr Fanning 187 185 99%
Target 87.5 85%
Dr. Fanning - 1 East 48 48
Dr. Fanning - 1 West 6 6
Dr. Fanning - 2 East 43 43
Dr. Fanning - 2 West 0 0
Dr. Fanning - 3 East 46 44
Dr. Fanning - 3 West 44 44
Garrison Green 51 50 98%
Target 50 85%
Garrison Green - Unit 1, 1st Floor 13 13
Garrison Green - Unit 1, 2nd Floor 14 13
Garrison Green - Unit 2, 3rd Floor 12 12
Garrison Green - Unit 2, 4th Floor 12 12
George Boyack 75 74 99%
Target 87.5 85%
George Boyack - 2nd Floor 29 29
George Boyack - 3rd Floor 15 14
George Boyack - 4th Floor 31 31
Glenmore Park 167 162 97%
Target 50 85%
Glenmore Park - 1 East 58 57
Glenmore Park - 1 West 41 38
Glenmore Park - 2 East 40 39
Glenmore Park - 2 West 18 18
Glenmore Park - 2 South 7 7
Glenmore Park - Day Hospital 3 3
Rouleau Manor 24 24 100%
Target 25 85%
Rouleau Manor 24 24
Sarcee 17 16 94%
Target 50 85%
Sarcee - Unit 1 13 12
Sarcee - Unit 2 0 0
Sarcee - Unit 3 4 4
Sarcee - Hospice 0 0
Signal Pointe 28 28 100%
Target 25 85%
Signal Pointe 28 28
Royal Park 32 32 100%
Target 12.5 85%
Royal Park 32 32
Total 663 652 98%
Q 3 October - December 2016
Hand Hygiene Observations Quarterly Report
6
Goal Area:
• Satisfied Clients ■ • Progressive Work Environment □
• Targeted Service Development □ • Cost Effective Organization □
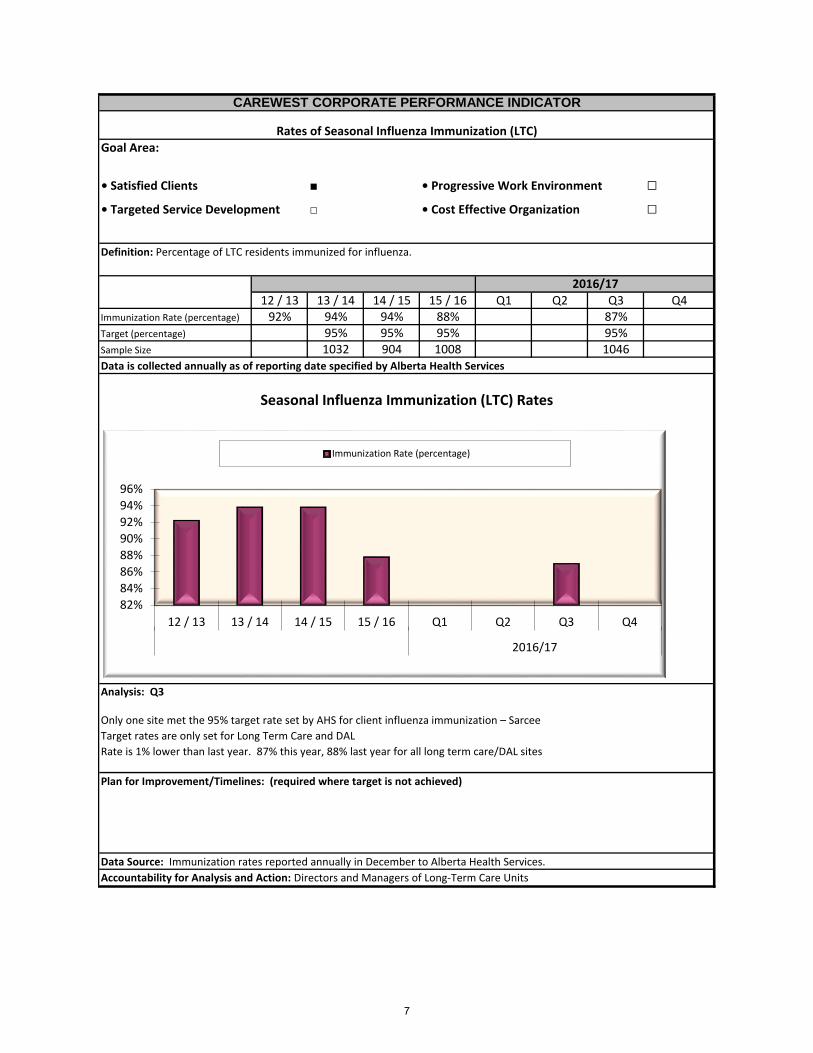
12 / 13 13 / 14 14 / 15 15 / 16 Q1 Q2 Q3 Q4Immunization Rate (percentage) 92% 94% 94% 88% 87%Target (percentage) 95% 95% 95% 95%Sample Size 1032 904 1008 1046
Seasonal Influenza Immunization (LTC) Rates
CAREWEST CORPORATE PERFORMANCE INDICATOR
Rates of Seasonal Influenza Immunization (LTC)
Definition: Percentage of LTC residents immunized for influenza.
Data is collected annually as of reporting date specified by Alberta Health Services
2016/17
Accountability for Analysis and Action: Directors and Managers of Long-Term Care Units
Analysis: Q3
Only one site met the 95% target rate set by AHS for client influenza immunization – Sarcee
Target rates are only set for Long Term Care and DAL
Rate is 1% lower than last year. 87% this year, 88% last year for all long term care/DAL sites
Plan for Improvement/Timelines: (required where target is not achieved)
Data Source: Immunization rates reported annually in December to Alberta Health Services.
82%
84%
86%
88%
90%
92%
94%
96%
12 / 13 13 / 14 14 / 15 15 / 16 Q1 Q2 Q3 Q4
2016/17
Immunization Rate (percentage)
7

Goal Area:
• Satisfied Clients ■ • Progressive Work Environment □
• Targeted Service Development □ • Cost Effective Organization □
Q1 Q2 Q3 Q4 Q1 Q2 Q3 Q4
Discharge percentage 17.0% 16.2% 17.7% 18.5% 14.3% 14.9% 16.9% 0.0%
Benchmark (percentage) 13.5% 13.5% 13.5% 13.5% 13.5% 13.5% 13.5% 13.5%
Discharges to Acute Care as Percentage of Beds
CAREWEST CORPORATE PERFORMANCE INDICATOR
Discharges and Transfers to Acute Care as Percentage of Beds
Definition: Number of discharges to acute care, as a percentage of beds. For LTC only, includes unscheduled
emergency visits to hospital
Why it's important: Carewest strives to minimize secondary complications that require additional resources.
Limitations A % of transfers to acute will be necessary to achieve optimal health for clients whose health may
be improved with additional resources. Some transfers may be scheduled (e.g. surgeries).
2015/16 2016/17
Accountability for Analysis and Action: Directors and Managers of Care Units across Carewest, supported by
Analysis: Note: Scheduled appts and surgeries not included in Fiscal 16/17. Top 5 reasons for transfer to
acute (TLOH) were: Pneumonia (13); Fall - Rule out fracture (12) Urosepsis (12) Cardiac conditions (6);
Respiratory conditions (6)
Plan for Improvement/Timelines: (required where target is not achieved)
Data Source: Goldcare data reported by Information Management.
0.0%2.0%4.0%6.0%8.0%
10.0%12.0%14.0%16.0%18.0%20.0%
Q1 Q2 Q3 Q4 Q1 Q2 Q3 Q4
2015/16 2016/17
Discharge percentage Benchmark (percentage)
8
Facility Unit Beds
QI Q2 Q3 Q4
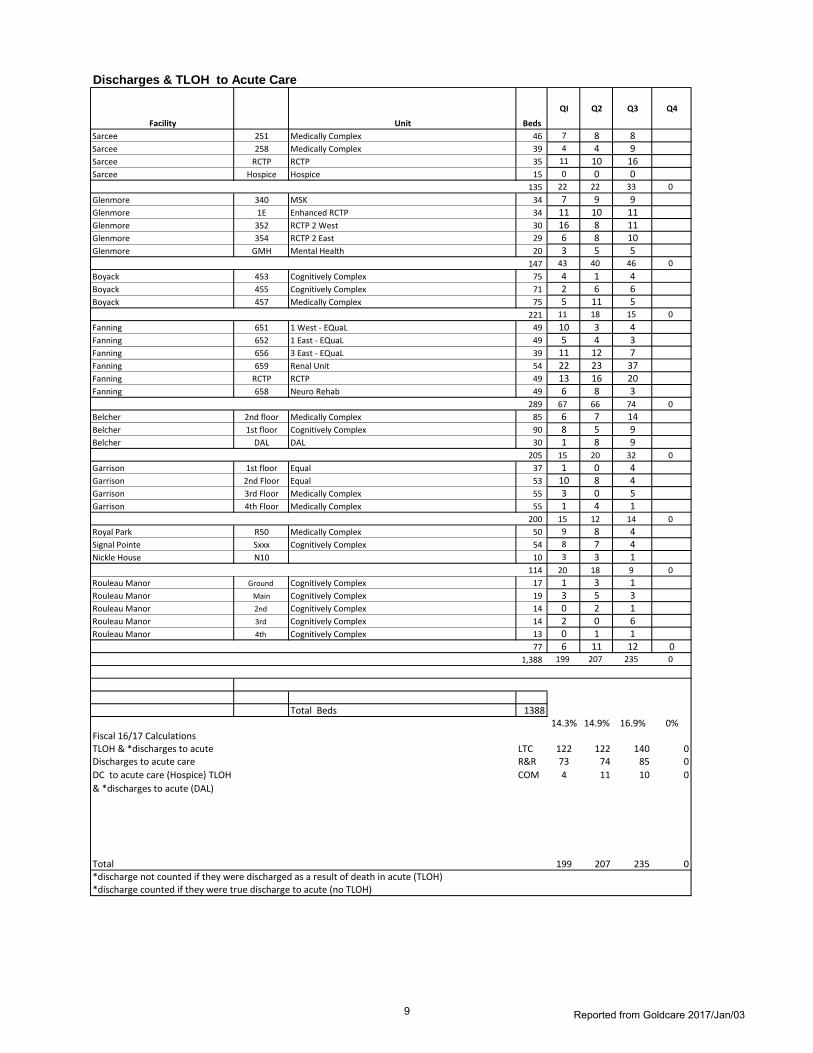
Sarcee 251 Medically Complex 46 7 8 8Sarcee 258 Medically Complex 39 4 4 9Sarcee RCTP RCTP 35 11 10 16Sarcee Hospice Hospice 15 0 0 0
135 22 22 33 0
Glenmore 340 MSK 34 7 9 9Glenmore 1E Enhanced RCTP 34 11 10 11Glenmore 352 RCTP 2 West 30 16 8 11Glenmore 354 RCTP 2 East 29 6 8 10Glenmore GMH Mental Health 20 3 5 5
147 43 40 46 0
Boyack 453 Cognitively Complex 75 4 1 4Boyack 455 Cognitively Complex 71 2 6 6Boyack 457 Medically Complex 75 5 11 5
221 11 18 15 0
Fanning 651 1 West - EQuaL 49 10 3 4Fanning 652 1 East - EQuaL 49 5 4 3Fanning 656 3 East - EQuaL 39 11 12 7Fanning 659 Renal Unit 54 22 23 37Fanning RCTP RCTP 49 13 16 20Fanning 658 Neuro Rehab 49 6 8 3
289 67 66 74 0
Belcher 2nd floor Medically Complex 85 6 7 14Belcher 1st floor Cognitively Complex 90 8 5 9Belcher DAL DAL 30 1 8 9
205 15 20 32 0
Garrison 1st floor Equal 37 1 0 4Garrison 2nd Floor Equal 53 10 8 4Garrison 3rd Floor Medically Complex 55 3 0 5Garrison 4th Floor Medically Complex 55 1 4 1
200 15 12 14 0
Royal Park R50 Medically Complex 50 9 8 4Signal Pointe Sxxx Cognitively Complex 54 8 7 4Nickle House N10 10 3 3 1
114 20 18 9 0
Rouleau Manor Ground Cognitively Complex 17 1 3 1Rouleau Manor Main Cognitively Complex 19 3 5 3Rouleau Manor 2nd Cognitively Complex 14 0 2 1Rouleau Manor 3rd Cognitively Complex 14 2 0 6Rouleau Manor 4th Cognitively Complex 13 0 1 1
77 6 11 12 01,388 199 207 235 0
Total Beds 138814.3% 14.9% 16.9% 0%
Fiscal 16/17 CalculationsTLOH & *discharges to acute LTC 122 122 140 0Discharges to acute care R&R 73 74 85 0
DC to acute care (Hospice) TLOH
& *discharges to acute (DAL)
COM 4 11 10 0
Total 199 207 235 0*discharge not counted if they were discharged as a result of death in acute (TLOH)*discharge counted if they were true discharge to acute (no TLOH)
Discharges & TLOH to Acute Care
Reported from Goldcare 2017/Jan/039

Q3 16/17 Reason for Hospital Leave
(As reported in Goldcare)
Boyack Col Bel (DAL)
Col Bel Fanning Garrison Nickle
House
Rouleau Royal
Park
Sarcee Signal
Pointe
Total
Pneumonia 2 1 5 1 4 13Fall - Rule out fracture 2 3 3 1 2 1 12Urosepsis 2 1 4 2 1 1 1 12Cardiac conditions 1 4 1 6Respiratory conditions 1 1 4 6Behaviour assessment 1 1 2 1 5Decreased level of consciousness 1 1 3 5Gastrointestinal bleed 1 1 2 1 5Abdominal pain 1 2 1 4Seizure 2 1 1 4Declining status 3 3Diarrhea 1 1 1 3Fall - Rule out intracranial bleed 2 1 3Fractures (not identified as related to fall) 2 1 3Hematuria 2 1 3Pain 1 2 3Reason not stated 2 1 3Urinary tract infection 1 1 1 3Cerebrovascular accident 1 1 2Deep vein thrombosis 1 1 2Emesis 1 1 2Fever 2 2Hypoglycemia 2 2Hypotensive 2 2Hypoxia 1 1 2Low O2 sats 1 1 2Sepsis 1 1 2Shortness of breath 2 2Unresponsive 1 1 2Abnormal labs 1 1Back pain 1 1Blood clot in neprostomy bag 1 1Bleeding from mouth 1 1Bleeding stoma 1 1Calciphylaxis 1 1Car accident with brain injury 1 1Choking 1 1Chronic obstructive pulmonary disease 1 1Client called 911 herself 1 1Congestive heart failure 1 1Dehydration 1 1Delirium 1 1Difficulty swallowing 1 1Edema 1 1Elevated sodium 1 1Elevated temperature 1 1Gangrene infection 1 1Gout 1 1Hip pain 1 1Hypercalcemia 1 1Influenza 1 1Intoxicated 1 1Ketoacidosis 1 1Laceration 1 1Mental distress 1 1Pancreatic lesions 1 1Pneumosepsis 1 1
Information Management Goldcare Export 2017/Jan/0310

Goal Area:
• Satisfied Clients ■ • Progressive Work Environment □
• Targeted Service Development □ • Cost Effective Organization □
2015/16 2016/17Q1 Q2 Q3 Q4 Q1 Q2 Q3 Q4
Achievement Rate (percentage) 94% 70% 59% 74%Target (percentage) 100% 100% 100% 100% 100% 100%
Continuing Care Health Service Standards Met
CAREWEST CORPORATE PERFORMANCE INDICATOR
Continuing Care Health Service Standards Met
Definition: Percentage of Standards met (aggregate for all Carewest sites).
Bi-Annual audit
Why it's important: Carewest strives to meet the high standards demonstrating quality of care.
Limitations The Standards are in transition and have changing auditors. Some standards are more applicable to residential
settings but are applied to day service areas.
Accountability for Analysis and Action: Directors and Managers for Continuing Care Units
CB SL4 and Nickle House were audited this quarter. Both sites were compliant for 14/19 standards but each site was
compliant with slightly different standards. Actions plans have been submitted and approved.
Plan for Improvement/Timelines:
All action plans for LTC and DAL have bee successfully submitted with no outstanding compliance issues.
The Clinical Standards Committee will broaden to include all areas audited, not just LTC and is facilitating attention to ongoing
sustainability as well as preparation and response to specific audits.
Data Source: Audit reports from Alberta Health Services
Analysis: Q3
0%20%40%60%80%
100%120%
Q1 Q2 Q3 Q4 Q1 Q2 Q3 Q4
2015/16 2016/17
Achievement Rate (percentage) Target (percentage)
11

Continuing Care Health Service Standards Met
DAL / SL
Site %
Nickle House 14 / 19 74%Colonel Belcher DAL 14 / 19 74%
CAREWEST 28 / 38 74%
Fully Met Standards Comment
12

Goal Area:
• Satisfied Clients ■ • Progressive Work Environment □
• Targeted Service Development □ • Cost Effective Organization □
Q1 Q2 Q3 Q4 Q1 Q2 Q3 Q4Achievement Rate (percentage) 76.7% 100%Target (percentage) 100% 100%
Accommodations Standards Met
CAREWEST CORPORATE PERFORMANCE INDICATOR
Accommodations Standards Met
Definition: Percentage of Standards met (aggregate for all Carewest sites).
Annual audit
Why it's important: Carewest strives to meet the high standards demonstrating quality of care environments
Limitations The audit is based on one day of observation for each site.
2015/16 2016/17
Accountability for Analysis and Action: Directors and Managers of Long-Term Care and Supportive Living Units
Analysis: Q3
Plan for Improvement/Timelines: (required where target is not achieved)
Data Source: Audit reports from Alberta Health
All Carewest sites successfully met all 30 standards under the 2016 Long Term Care Accommodation Audit. The Licensor was
impressed with the consistent effort from staff to keep the sites safe and pleasant for the residents. The Licensor commented
on the organization of the site evidence binders, that Carewest was prepared for this audit and that she appreciated the
preparation model as it helped the audit run smoothly.
00.20.40.60.8
11.2
Q1 Q2 Q3 Q4 Q1 Q2 Q3 Q4
2015/16 2016/17
Achievement Rate (percentage)
13

Goal Area:
• Satisfied Clients □ • Progressive Work Environment □
• Targeted Service Development ■ • Cost Effective Organization □
Q1 Q2 Q3 Q4 Q1 Q2 Q3 Q4Utilization Rate (percentage) 97.8% 98.1% 98.3% 98.5% 98.4% 98.6% 98.5% 0.0%Target (percentage) 99.0% 99.0% 99.0% 99.0% 99.0% 99.0% 99.0% 99.0%
2016/17
CAREWEST CORPORATE PERFORMANCE INDICATOR
Long-Term Care/SL4 Utilization Rate
Long-Term Care/SL4 Utilization Rate
Accountability for Analysis and Action: Directors and Managers of Long-Term Care and SL4 sites.
Definition: Total LTC,Respite and SL4 bed days occupied to total number of bed days per quarter.
Analysis: Utilization rate has had minimal overall change despite the number of outbreaks and perceived impact of changes
in FALO policy
Plan for Improvement/Timelines: (required where target is not achieved) Indicator should be reviewed for level of
sensitivity to real change on units and related causes
Data Source: Goldcare data reported by Information Management.
Why It's Important Carewest is required to achieve a target occupancy to support system capacity needs. Overall capacity
optimizes use of resources and impacts funding models in LTC.
Limitations: Carewest cannot fully impact referral matches with site resources. The FALO policy has some impact as well.
2015/16
0.0%
20.0%
40.0%
60.0%
80.0%
100.0%
120.0%
Q1 Q2 Q3 Q4 Q1 Q2 Q3 Q4
2015/16 2016/17
Utilization Rate (percentage) Target (percentage)
14

Q1 Q2 Q3 Q4 1st Q 16/17 2nd Q 16/17 3rd Q 16/17 4th Q 16/17LTC/SL4 Utilization
Fanning # Beds
Possible Bed
Days Occupied # Beds
Possible Bed
Days Occupied # Beds
Possible Bed
Days Occupied # Beds
Possible
Bed Days OccupiedFanning 1 East 98.0% 97.7% 98.6% 49 4,459 4,371 49 4,508 4,404 49 4,508 4,445 49 4,410 1,462Fanning 1 West 96.2% 98.5% 97.6% 49 4,459 4,290 49 4,508 4,441 49 4,508 4,398 49 4,410 1,490Fanning 3 East 99.6% 96.3% 97.3% 39 3,549 3,536 39 3,588 3,455 39 3,128 3,043 39 3,060 990Fanning CCC 99.5% 100.2% 98.6% 54 4,914 4,889 54 4,968 4,979 54 5,428 5,354 54 5,310 1,799
98.3% 98.3% 98.1% 33.4% 191 17381 17086 191 17572 17,279 191 17572 17240 191 17190 5741SarceeUnit 1 99.8% 99.4% 99.0% 46 4,186 4,176 46 4,232 4,208 46 4,232 4,190 46 4,140 1,401Unit 3 98.3% 99.4% 99.1% 39 3,549 3,489 39 3,588 3,565 39 3,588 3,554 39 3,510 1,189
99.1% 99.4% 99.0% 33.9% 85 7735 7665 85 7820 7,773 85 7820 7,744 85 7650 2590GarrisonGarrsion 1 100.0% 100.0% 98.9% 37 3,367 3,367 37 3,404 3,404 37 3,404 3,365 37 3,330 1,147Garrison 2 99.3% 99.7% 99.2% 53 4,823 4,787 53 4,876 4,859 53 4,876 4,837 53 4,770 1,610Garrison 3 98.9% 99.9% 98.0% 55 5,005 4,952 55 5,060 5,055 55 5,060 4,957 55 4,950 1,684Garrison 4 99.7% 99.2% 98.1% 55 5,005 4,992 55 5,060 5,021 55 5,060 4,963 55 4,950 1,674
99.4% 99.7% 98.5% 34.0% 200 18200 18098 200 18400 18339 200 18,400 18,122 200 18000 6115Rouleau ManorGround 96.6% 93.2% 98.1% 17 1,547 1,495 17 1,564 1,458 17 1,564 1,535 17 1,530 1,535Main 98.6% 96.6% 99.8% 19 1,729 1,704 19 1,748 1,689 19 1,748 1,744 19 1,710 1,7442nd Floor 100.0% 94.5% 99.0% 14 1,274 1,274 14 1,288 1,217 14 1,288 1,275 14 1,260 1,2753rd Floor 100.0% 95.7% 97.7% 14 1,274 1,274 14 1,288 1,232 14 1,288 1,258 14 1,260 1,2584th Floor 100.0% 100.0% 99.7% 13 1,183 1,183 13 1,196 1,196 13 1,196 1,193 13 1,170 1,193
98.9% 95.9% 98.9% 101.1% 77 7,007 6,930 77 7084 6792 77 7084 7005 77 6,930 7,005Royal Park 99.3% 99.6% 98.6% 34.2% 50 4,550 4,518 50 4,600 4,581 50 4,600 4,537 50 4,500 1,539
50 4,600 4,565 50Signal Pointe 99.7% 99.7% 99.8% 34.1% 54 4,914 4,898 54 4,968 4,953 54 4,968 4,958 54 4,860 1,659
` 4,968 4,407 `Boyack G Boyack 2 97.4% 99.4% 98.4% 75 6,825 6,648 75 6,900 6,862 75 6,900 6,790 75 6,750 2,281G Boyack 3 96.7% 98.6% 96.8% 71 6,461 6,249 71 6,532 6,441 71 6,532 6,322 71 6,390 2,126G Boyack 4 97.1% 99.2% 97.4% 75 6,825 6,625 75 6,900 6,845 75 6,900 6,722 75 6,750 2,302
97.1% 99.1% 97.6% 33.7% 221 20111 19522 221 20332 20148 221 20,332 19,834 221 19890 6709Colonel BelcherCol Belcher1 98.2% 98.9% 97.5% 90 8,190 8,044 90 8,280 8,185 90 8,280 8,071 90 8,100 2,700Col Belcher2 99.0% 98.7% 96.8% 85 7,735 7,661 85 7,820 7,719 85 7,820 7,571 85 7,650 2,584
98.6% 98.8% 97.2% 33.5% 175 15925 15705 175 16100 15904 175 16100 15642 175 15750 5284SL4Colonel Belcher DAL 94.1% 98.2% 98.7% 33.4% 30 2,730 2,568 30 2,760 2,711 30 2,760 2,725 30 2,700 902Nickle House 96.9% 100.0% 98.6% 10 910 882 10 920 920 10 920 907 10 900 310
Occupancy (by Quarter) 98.4% 98.9% 98.2% 38.8% 1093 99,463 97,872 1093 100,556 99,400 1093 100,556 98,714 1093 183780 71298Rolling Average (Current Fiscal Yr) n/a 98.6% 98.5%Rolling Average Calculations 97872/99463 200,019 197,272 300,575 295,986 484,355 367,284
2/16/2017 Carewest Balanced Scorecard 2016/17 Updated 2016/Aug/08
15

Goal Area:
• Satisfied Clients □ • Progressive Work Environment □
• Targeted Service Development ■ • Cost Effective Organization □
Q1 Q2 Q3 Q4 Q1 Q2 Q3 Q4Utilization Rate (percentage) 87.0% 83.6% 84.4% 83.0% 91.1% 89.0% 89.4% 75.2%Benchmark (percentage) 95% 95% 95% 95% 85% 85% 85% 85%
Accountability for Analysis and Action: Directors and Managers of Chronic Complex Care and Hospice Units, working with
AHS Transition Services.
Analysis: Slight increase in occupancy. New benchmark set by Hospice Network (85%)
Plan for Improvement/Timelines: (required where target is not achieved)
Data Source: Goldcare data reported by Information Management.
Hospice Utilization Rate
CAREWEST CORPORATE PERFORMANCE INDICATOR
Hospice Utilization Rate
Definition: Total Hospice bed days occupied to total number of bed days per quarter.
2015/16 2016/17
76.0%78.0%80.0%82.0%84.0%86.0%88.0%90.0%92.0%94.0%96.0%
Q1 Q2 Q3 Q4 Q1 Q2 Q3
2015/16 2016/17
Utilization Rate (percentage) Benchmark (percentage)
16

CCC & Hospice Utilization
Unit Specific 1st Q 16/17 2nd Q 16/17 3rd Q 16/17 4th Q 16/17
Q1 Q2 Q3 Q4 # Beds Bed Days Occupied Bed Days Occupied Bed Days Occupied Bed Days OccupiedSarcee Hospice 91.1% 87.0% 90.2% 31.9% 15 1,365 1,243 1,380 1,201 1,380 1,245 1,350 430
Rolling Average (Current Fiscal Yr) n/a 89.0% 89.4% 75.2% 2,745 2,444 4,125 3,689 5,475 4,119Occupancy Calculations 1243/1365
Updated 2016/May/0217

Goal Area:
• Satisfied Clients □ • Progressive Work Environment □
• Targeted Service Development ■ • Cost Effective Organization □
Q1 Q2 Q3 Q4 Q1 Q2 Q3 Q4Utilization Rate (percentage) 100.1% 99.8% 99.5% 99.1% 97.0% 97.7% 98.2% 82.5%Benchmark (percentage) 97% 97% 97% 97% 97% 97% 97% 97%
Accountability for Analysis and Action: Directors and Managers of the Rehabilitation & Recovery Programs.
Analysis: Slight increase in occupancy and returning to above target. Prinary driver of change is increased occupancy of Neuro
Rehabiltiation unit but this is balanced by a slight decrease in occupancy at GMP RCTP 2East & 2 West.
Plan for Improvement/Timelines: (required where target is not achieved)
Data Source: Goldcare data reported by Information Management.
Rehabilitation & Recovery Utilization Rate
CAREWEST CORPORATE PERFORMANCE INDICATOR
Rehabilitation & Recovery Utilization Rate
Definition: Total R&R bed days occupied to total number of bed days per quarter.
2015/16 2016/17
95.0%95.5%96.0%96.5%97.0%97.5%98.0%98.5%99.0%99.5%
100.0%100.5%
Q1 Q2 Q3 Q4 Q1 Q2 Q3 Q4
2015/16 2016/17
Utilization Rate (percentage) Benchmark (percentage)
18

Rehabilitation and Recovery Utilization Rate
Unit Specific 1st Q 16/17 2nd Q 16/17 3rd Q 16/17 4th Q 16/17
Q1 Q2 Q3 Q4 # Beds Bed Days Occupied Bed Days Occupied Bed Days Occupied Bed Days Occupied
GMP-MSK 99.3% 100.0% 101.0% 34.9% 34 3,094 3,071 3,128 3,128 3,128 3,159 3,060 1,069
GMP- 1E RCTP 104.1% 104.6% 105.2% 36.1% 34 3,094 3,222 3,128 3,271 3,128 3,290 3,060 1,106
GMP- 2W RCTP 97.8% 97.6% 95.8% 33.9% 30 2,730 2,670 2,760 2,695 2,760 2,643 2,700 915
GMP-2E RCTP 97.2% 97.3% 94.3% 33.7% 29 2,639 2,565 2,668 2,596 2,668 2,516 2,610 880
GMP- GMH 99.6% 98.6% 98.2% 34.0% 20 1,820 1,813 1,840 1,814 1,840 1,806 1,800 612
Sarcee RCTP 99.1% 99.6% 99.4% 34.9% 35 3,185 3,156 3,220 3,207 3,220 3,201 3,150 1,100
Fanning RCTP 97.5% 99.8% 98.0% 34.5% 49 4,459 4,347 4,508 4,500 4,508 4,420 4,410 1,521
Fanning Neuro 86.8% 92.0% 99.7% 33.9% 49 4,459 3,871 4,508 4,148 4,508 4,494 4,410 1,496
Occupancy (by Quarter) 97.0% 98.4% 99.1% 34.5% 280 25,480 24,715 25,760 25,359 25,760 25,529 25200 8699Rolling Average (Current Fiscal Yr) n/a 97.7% 98.2% 82.5% 51,240 50,074 77,000 75,603 102,200 84,302
Occupancy Calculations 97.0%
Updated 2016/May/03
19

Goal Area:
• Satisfied Clients □ • Progressive Work Environment □
• Targeted Service Development ■ • Cost Effective Organization □
Q1 Q2 Q3 Q4 Q1 Q2 Q3 Q4Utilization Rate (percentage) 95.4% 92.3% 92.4% 92.5% 91.2% 89.1% 91.2% 0.0%Target (percentage) 90% 90% 90% 90% 100% 100% 100% 100%
Accountability for Analysis and Action: Directors and Managers in Community Programs.
Analysis: Increase in occupancy across most programs with exception of ADP Belcher and YADS. Still awaiting revised
denominator for Seating Clinic that resulted from process efficiencies to schedule more clients per quarter.
Plan for Improvement/Timelines: (required where target is not achieved) ADP manager continues to review waitlist and
referral trends with AHS. Day Hospital increased occupancy has increased due to return in overbooking practices to ensure
spaces are filled.
Data Source: Goldcare data reported by Information Management.
Community Services Utilization Rate
CAREWEST CORPORATE PERFORMANCE INDICATOR
Community Services Utilization Rate
Definition: Average number of days filled to days available for community services.
2015/16 2016/17
0.0%
20.0%
40.0%
60.0%
80.0%
100.0%
120.0%
Q1 Q2 Q3 Q4 Q1 Q2 Q3 Q4
2015/16 2016/17
Utilization Rate (percentage) Target (percentage)
20

Community Services
Unit Specific
Fiscal 16/17 Q1 Q2 Q3 Q4Day Hospital (Regular Program) 83.3 82.6 91.3Day Hospital (Dementia) 83.2 84.0 96.7ASDP -SP 77.9 78.3 87.9ASDP-CB 91.0 91.4 88.7YADS 91.3 85.7 85.3Seating Clinic 130.3 95.9 126.2C3 Sarcee 90.3 90.8 96.3C3 Beddington 75.1 75.5 84.1OSI 98.5 98.5 101.0
Average (By Quarter) 91.2% 87.0% 95.3%Rolling Average (Current Fiscal Yr) n/a 89.1% 91.2%
Previous Fiscal Year
Fiscal 15/16 Q1 Q2 Q3 Q4Day Hospital (Regular Program) 75.0 85.6 86.0Day Hospital (Dementia) 87.0 77.0 93.2 93.2ASDP -SP 93.9 92.5 83.6 84.4ASDP-CB 96.7 97.4 95.4 94.6YADS 97.1 96.5 96.2 94.4Seating Clinic 117.2 104.8 124.1 130.3C3 Sarcee 101.1 98.9 95.6 95.6C3 Beddington 74.4 63.0 66.0 67.0OSI (Demoninator = 110) 107.6 96.9 93.9 90.9
Average (By Quarter) 95.4% 89.1% 92.6% 93.0%Rolling Average (Current Fiscal Yr) n/a 92.3% 92.4% 92.5%
21

Goal Area:
• Satisfied Clients □ • Progressive Work Environment ■
• Targeted Service Development □ • Cost Effective Organization □
2015/16 2016/17Q1 Q2 Q3 Q4 Q1 Q2 Q3 Q4
Completion Rate (percentage) 89% 86% 87% 86% 83% 83% 79%Target (percentage) 90% 90% 90% 90% 90% 90% 90% 90%
Annual Performance Appraisal Completion Rate
CAREWEST CORPORATE PERFORMANCE INDICATOR
Annual Performance Appraisal Completion Rate
Definition: Average number of Performance Appraisals (PA) (cumulative to date) completed to average number due
(cumulative year to date).
Accountability for Analysis and Action: Directors and Managers in all Programs and Service areas.
Plan for Improvement/Timelines: (required where target is not achieved)
Data Source: Human Resources
Analysis: Q3
A number of Managers moved into new roles this quarter, we should expect to see this number to increase as they become
familiar with their new reports. Continued support given to Directors and Managers by Human Resources to inform and
encourage performance appraisal (PA) completion to target completion level of 90%. Performance Management orientation
is given to all new Managers/Directors and is available as a refresher for any existing Managers/Directors.
Administrative networking group continues to provide support to Managers (CSM's & Food Services) in completing PA's.
Admin Support at the site will prepare PA packages at the beginning of every month, the package will include; The most
current PA form, Education history, Education deficiency lists, ESP and PeopleSoft attendance reports. The initative was put in
place to eliminate administration work required to allow Managers to focus on completing quality PA's for their employees.
72%74%76%78%80%82%84%86%88%90%92%
Q1 Q2 Q3 Q4 Q1 Q2 Q3 Q4
2015/16 2016/17
Completion Rate (percentage) Target (percentage)
22

MonthTotal # of PA's
completed
Total # of employees
requiring a PA
% of PA's completed
on time
Cumulative
Fiscal Yr
Number of
Appraisals
Complete Year to
Date
Number of
Appraisals Due
Year to Date
% Completed
As of May 1, 2015 1928 2138 90.18%
As of June 1, 2015 1886 2138 88.21%
As of July 1, 2015 1884 2151 87.59%
As of August 1, 2015 1842 2147 85.79%
As of September 1, 2015 1787 2131 83.86%
As of October 1, 2015 1880 2142 87.77%
As of November 1, 2015 1852 2139 86.58%
As of December 1, 2015 1849 2141 86.36%
As of January 1, 2016 1860 2119 87.78%
As of February 1, 2016 1854 2146 86.39%
As of March 1, 2016 1840 2145 85.78%
As of April 1, 2016 1833 2139 85.69%
As of May 1, 2016 1797 2142 83.89%
As of June 1, 2016 1783 2165 82.36%
As of July 1, 2016 1801 2176 82.77%
As of August 1, 2016 1803 2181 82.67%
As of September 1, 2016 1819 2191 83.02%
As of October 1, 2016 1786 2183 81.81%
As of November 1, 2016 1754 2181 80.42%
As of December 1, 2016 1744 2194 79.49%
As of January 1, 2017 1722 2197 78.38%
As of February 1, 2017As of March 1, 2017As of April 1, 2017As of May 1, 2017As of June 1, 2017As of July 1, 2017As of August 1, 2017As of September 1, 2017As of October 1, 2017As of November 1, 2017As of December 1, 2017As of January 1, 2018As of February 1, 2018As of March 1, 2018As of April 1, 2018As of May 1, 2018As of June 1, 2018As of July 1, 2018As of August 1, 2018As of September 1, 2018As of October 1, 2018As of November 1, 2018As of December 1, 2018As of January 1, 2019As of February 1, 2019As of March 1, 2019As of April 1, 2019
Q3 Cumulative 2016/2019 0 0 #DIV/0!
Year End2016/2019 0 0 #DIV/0!
Q1 2016/2019 0 0 #DIV/0!
Q2 - Cumulative 2016/2019
0 0 #DIV/0!
Q3 Cumulative 2016/2018 0 0 #DIV/0!
Year End2016/2018 0 0 #DIV/0!
Q1 2016/2018 0 0 #DIV/0!
Q2 - Cumulative 2016/2018
0 0 #DIV/0!
83%
1740 2191 79%
Monthly Personal Engagement & Development Plan Statistics
1794 2161 83%
1842 2143 86%
Q1 2016/2017
#DIV/0!
Q12015/2016 1900 2142 89%
Q2 Cumulative 2015/2016 1836 2140 86%
Q3 Cumulative 2015/2016 1854 2133 87%
Year End2015/2016
1803 2185
Year End2016/2017
Q2 - Cumulative 2016/2017
Q3 Cumulative 2016/2017
0 0
23

Goal Area:
• Satisfied Clients □ • Progressive Work Environment ■
• Targeted Service Development □ • Cost Effective Organization □
Q1 Q2 Q3 Q4 Q1 Q2 Q3 Q4Turnover Rate (percentage) 4.9% 5.2% 5.4% 5.8% 5.2% 5.4% 5.3%Benchmark (percentage) 8% 8% 8% 8% 8% 8% 8% 8%
Plan for
Improvement/Timelines:
Staff Commitment - Annualized Turnover Rate
CAREWEST CORPORATE PERFORMANCE INDICATOR
Staff Commitment - Annualized Turnover Rate
Definition: Total voluntary and involuntary terminations to total number of employees (Includes FT, PT and Temp).
2015/16 2016/17
Accountability for Analysis and Action: HR in consultation with Site Directors and Managers
Our turnover rate remains very good, well below the 8% target, with several sites showing improvement over this past quarter.
Two sites above the target (Sarcee and Beddington) had Management turnover this past year, accounting for the increase.
Data Source: Human Resources.
Analysis: Q3
0.0%1.0%2.0%3.0%4.0%5.0%6.0%7.0%8.0%9.0%
Q1 Q2 Q3 Q4 Q1 Q2 Q3 Q4
2015/16 2016/17
Turnover Rate (percentage) Benchmark (percentage)
24

Q3 Site Breakdown (Full time- Part time)
SiteTotal # Regular
Employees/Sites
Total # Regular Separations for the
12 month period ending/Site Percentages
Market Mall 20 3 15.00%
Beddington 46 5 10.87%
Colonel Belcher 240 2 0.83%
Fanning Centre 536 26 4.85%
Garrison Green 220 10 4.55%
George Boyack 211 7 3.32%
Glenmore Park 290 12 4.14%
Nickle House 23 2 8.70%
Rouleau Manor 92 9 9.78%
Royal Park 52 2 3.85%
Sarcee 221 22 9.95%
Signal Pointe 90 4 4.44%
Southport 71 7 9.86%
25

Goal Area:
• Satisfied Clients □ • Progressive Work Environment ■
• Targeted Service Development □ • Cost Effective Organization □
Q1 Q2 Q3 Q4 Q1 Q2 Q3 Q4Vacancy Rate (percentage) 2.20% 2.30% 2.40% 2.30% 2.10% 2.04% 0.96%Target (percentage) 4% 4% 4% 4% 4% 4% 4% 4%
Accountability for Analysis and Action: HR in consultation with Site Directors and Managers
Improved results can be attributed to more focused efforts with the recruitment team to shorten recruitment turnaround
time and achieve a heigher volume of successful new hires.
Plan for Improvement/Timelines: (required where target is not achieved)
Data Source: Human Resources Database
Analysis: Q3
Vacancy
CAREWEST CORPORATE PERFORMANCE INDICATOR
Vacancy
Definition: Total number regular vacant lines greater than .3 FTE to Total number of regular lines( vacant and filled ) greater
than .3 FTE.
2015/16 2016/17
0.00%0.50%1.00%1.50%2.00%2.50%3.00%3.50%4.00%4.50%
Q1 Q2 Q3 Q4 Q1 Q2 Q3 Q4
2015/16 2016/17
Vacancy Rate (percentage) Target (percentage)
26

Goal Area:
• Satisfied Clients □ • Progressive Work Environment ■
• Targeted Service Development □ • Cost Effective Organization □
Q1 Q2 Q3 Q4 Q1 Q2 Q3 Q4Absentieeism (percentage) 44% 38% 41% 40% 42% 44% 38%Target (percentage)
Analysis: Q3
2015/16 2016/17
Accountability for Analysis and Action: HR in consultation with Site Directors and Managers
Absenteeism - Sick Rate
Slight increase in total paid sick time is not unexpected. Carewest experienced a hard hitting early influenza season with 11
outbreaks across several sites. This started before immunization and affected large numbers of staff. Even after immunization, there
has been an influenza like virus making the rounds of all sites resulting in a higher than usual volume of sick calls.
Plan for Improvement/Timelines: (required where target is not achieved)
Data Source: Human Resources Database
CAREWEST CORPORATE PERFORMANCE INDICATOR
Absenteeism - Sick Rate
Definition: total # of sick hours for Carewest in the quarter/Total paid sick hours
Limitations affected by seasonal factors such a influenza so will not do as a rolling average. Also captures total number but not
length of incident nor multiple incidents by the same employee
Why it's important: Sick leave affects the ability to provide continuity of care for clients and has a significant financial
impact on the organization.
34%36%38%40%42%44%46%
Q1 Q2 Q3 Q4 Q1 Q2 Q3 Q4
2015/16 2016/17
Absenteeism (percentage)
27

T19 hours Paid Sick Hours % to Total Sick Hours
2016-2017
Q1 14,669 35,270 42%Q2 16,005 36,075 44%Q3 15,708 41,421 38%Q4
30,674 71,345 43%
FY 2015-2016
Q1 16,333 36,992 44%Q2 12,637 32,897 38%Q3 15,748 38,360 41%Q4 14,844 36,661 40%
59,562 144,910 41%
FY 2014-2015
Q1 13,108 34,135 38%Q2 11,714 31,679 37%Q3 16,670 40,359 41%Q4 14,139 39,155 36%
55,631 145,328 38%
28

Goal Area:
• Satisfied Clients □ • Progressive Work Environment ■
• Targeted Service Development □ • Cost Effective Organization □
2015/16 2016/17Q1 Q2 Q3 Q4 Q1 Q2 Q3 Q4
Injury Rate (percentage) 0.7% 0.6% 0.4% 0.6% 0.4% 0.4% 0.7%Target(percentage) 0.5% 0.5% 0.5% 0.5% 0.5% 0.5% 0.5% 0.5%
Accountability for Analysis and Action: Directors and Managers, in consultation with EH&S.
Analysis: Q3
Needlestick injuries decreased from 7 to zero this quarter as a likely result of the new safety engineered insulin pens that are now in
use. This is a fantastic improvement and speaks to the power of engineering controls as a powerful way to reduce injuries.
Investigation training took place on December 15th, for nine Managers, Team Leaders and Clinical Support Coordinators.
Safety Strategies Committee met on November 16th and discussed many client/staff safety related topics including: bariatric
equipment, safety inspections, client Transfer assessment and algorithm, sling inventory, Buddy Checklist, slider sheets, investigation
forms and the removal of ceiling lifts from education rooms. Many of these issues require multi-stakeholder involvement and have
complex implementation steps.
Data Source: Employee Health & Safety (from Risk Management Database) reported quarterly.
Lost time (LT) injuries increased in Q3 from 10 LT injuries (Q1 and Q2) to 19 LT injuries (0.7%). The increase can be attributed to a
greater number of client repositioning and transfer incidents. The injury breakdown for Q3: 8 lifting/transferring, 1 resident/client
care, 3 resident aggression, 3 slip/trip/fall/ 2 repetitive injuries, and 2 “other”.
No Time Loss claims decreased from to 26 in Q2 to 11 in Q3. Modified duties were required in 3 NTL claims. The breakdown is as
follows: 4 transfer/repositioning, 1 resident care, 1 repetitive injury, 1 aggression and 3 “other”.
Lost time injuries compared to the same quarter last year showed an increase from 10 to 19. Total WCB claims including NTL for the
same quarter in 2015 were 32 as compared to 2016 which were 30.
Plan for Improvement/Timelines:
Lost Time Claim Frequency
CAREWEST CORPORATE PERFORMANCE INDICATOR
Lost Time Claim Frequency
Definition: Total number of staff injuries (level 3 and 4) resulting in lost time to total number of staff (FT, PT and Casual)
0.0%0.1%0.2%0.3%0.4%0.5%0.6%0.7%0.8%
Q1 Q2 Q3 Q4 Q1 Q2 Q3 Q4
2015/16 2016/17
Injury Rate (percentage) Target(percentage)
29

Lost Times Claims
Fiscal Fiscal
16/17 16/171stQ 2728 10 0.4% 2nd Q 2735 10 0.4%
Lost Time Claim Frequency Detail Lost Time Claim Frequency Detail
Apr: LT Claims = 3 Jul: LT Claims = 1May: LT Claims = 3 Aug: LT Claims = 8Jun: LT Claims = 4 Sep: LT Claims = 1
1st Q Time Loss No Time
Loss
Total
Claims
2nd Q Time Loss No Time
Loss
Total
Claims
Beddington (C3) 0 0 0 Beddington
(C3)
1 1 2
Belcher 1 2 3 Belcher 2 1 3
Fanning 4 7 11 Fanning 2 11 13
Garrison Green 0 2 2 Garrison
Green
0 0 0
George Boyack 2 1 3 George
Boyack
2 4 6
Glenmore 1 4 5 Glenmore 1 2 3
Rouleau 0 3 3 Rouleau 0 2 2
Royal Park 0 0 0 Royal Park 0 0 0
Sarcee 2 1 3 Sarcee 1 2 3
Signal Pointe 0 0 0 Signal Pointe 1 3 4
Admin 0 0 0 Admin 0 0 0
Total 10 20 30 OSI 0 0 0
Total 10 26 36
Fiscal Fiscal
16/17 16/173rd Q 2736 19 0.7% 4th Q #DIV/0!
Lost Time Claim Frequency Detail Lost Time Claim Frequency Detail
Oct: LT claims = 8 Jan: LT claims =Nov: LT claims = 2 Feb: LT claims = Dec: LT claims = 9 Mar: LT claims =
Q4
3rd Q Time Loss No Time
Loss
Total
Claims
4th Q Time Loss No Time
Loss
Total
Claims
Beddington (C3) 0 0 0 Beddington
(C3)
Belcher 1 2 3 Belcher
Fanning 8 4 12 Fanning
Garrison Green 3 2 5
Garrison
Green
George Boyack 1 0 1 George
Boyack
Glenmore 0 2 2 Glenmore
Rouleau 1 0 1 Rouleau
Royal Park 1 0 1 Royal Park
Sarcee 3 0 3 Sarcee
Signal Pointe 1 1 2 Signal Pointe
Nickle House 0 0 0 Nickle House
OSI 0 0 0 OSI
Admin 0 0 0 Admin
Total 19 11 30 Total 0 0 0
#EMPLOYEES # Lost
Time
%
#EMPLOYEES # Lost
Time
%#EMPLOYEES # Lost
Time
%
#EMPLOYEES # Lost
Time
%
Risk Management DatabaseR/C with Employee H S
Updated 2016/Oct/2730

Goal Area:
• Satisfied Clients □ • Progressive Work Environment ■
• Targeted Service Development □ • Cost Effective Organization □
Llimitation: dependent on number of incidents reported - especially Type 4
2015/16 2016/17Q1 Q2 Q3 Q4 Q1 Q2 Q3 Q4
Aggressive incidents (percentage) 2.4% 3.2% 2.1% 1.8% 2.3% 2.0% 1.2%Benchmark (percentage) 0 0 0 0 0 0 0 0
Aggression in the Workplace
CAREWEST CORPORATE PERFORMANCE INDICATOR
Aggression in the Workplace
Definition: Number of reported incidents to to total number of staff (FT, PT and Casual)
Accountability for Analysis and Action: Site Directors and Managers.
Analysis: Q3Slight overall decrease in reported incidents, driven primarily by reduced reported incidents of aggression directed at staff by clients. Fanning, Belcher and Rouleau have the majority of reported incidents, related to the admitted population.
Plan for Improvement/Timelines: Recommend review of SCI training at these sites (Belcher has not been on the high priority list but should be included for more regular review). Work in progress to update Supportive Pathways training at this site as well. May need to review responsive behaviours component of EQuaL training to address Fanning results as well.
Data Source: Risk Management database, UOR -staff-staff, Human Resources reports
0.0%0.5%1.0%1.5%2.0%2.5%3.0%3.5%
Q1 Q2 Q3 Q4 Q1 Q2 Q3 Q4
2015/16 2016/17
31

Type 1 Property Damage
Type 2 Client/Family directed at
Staff
Type 3 Staff to Staff
Type 4 Domesti
c Violence
Total Type 1 Property Damage
Type 2 Client/Fa
mily directed at Staff
Type 3 Staff to Staff
Type 4 Domestic Violence
Total
Beddington 0 0 0 0 0 Beddington 0 0 0 0 0George Boyack 0 1 0 0 1 George Boyack 0 2 0 0 2Colonel Belcher 0 12 0 0 12 Colonel Belcher 0 10 0 0 10Fanning 0 18 0 0 18 Fanning 1 17 0 0 18Garrison Green 0 2 1 0 3 Garrison Green 0 2 0 0 2Glenmore Park 1 3 0 0 4 Glenmore Park 0 3 1 0 4Market Mall 0 0 0 0 0 Market Mall 0 0 0 0 0Nickle House 0 0 0 0 0 Nickle House 0 0 0 0 0Rouleau Manor 0 9 0 0 9 Rouleau Manor 0 4 0 0 4Royal Park 0 1 0 0 1 Royal Park 0 0 0 0 0Sarcee 0 6 1 0 7 Sarcee 0 8 1 0 9Signal Pointe 0 9 0 0 9 Signal Pointe 0 6 0 0 6Southport 0 0 0 0 0 Southport 0 0 0 0 0Carewest Total 1 61 2 0 64 Carewest Total 1 52 2 0 55Employees = 2728 Employees = 2735
Col Bel - Initiated by 7 different clients (1 client with 4 incidents, 1 client with 2 incidents) Col Bel - Initiated by 6 different clients (1 client with 3 incidents, 2 clients with 2 incidents each)
Fanning - Initiated by 11 different clients (1 client 5 incidents 3 East; 1 client 4 incidents 1 East) Fanning - Initiated by 12 different clients (1 client 4 incidents 1 East); 1 client 3 incidents 1 West)
Garrison Green - Initiated by 1 client Glenmore Park - 1 Client and 2 Family to Employee incidents
Glenmore Park - 2 incidents initiated by same family member (2 West RCTP) Sarcee - Initiated by 6 different clients. (2 clients with 2 incidents each (1st and 3rd Floors))
Rouleau Manor - Initiated by 7 different clients (1 client with 3 incidents 3rd Floor) Signal Pointe - Initiated by 2 different clients (1 client with 6 incidents)
Sarcee - Initiated by 5 different clients. 1 client with 2 incidents 1st Floor
Signal Pointe - Initiated by 6 different clients (1 client with 3 incidents, 1 client with 2 incidents)
Type 1 Property Damage
Type 2 Client/Family directed at Staff
Type 3 Staff to Staff
Type 4 Domestic Violence
Total Type 1 Property Damage
Type 2 Client/Family directed at Staff
Type 3 Staff to Staff
Type 4 Domestic Violence
Total
Beddington 0 0 0 0 0 Beddington 0George Boyack 0 4 0 0 4 George Boyack 0Colonel Belcher 0 6 0 0 6 Colonel Belcher 0Fanning 0 12 1 0 13 Fanning 0Garrison Green 0 1 0 0 1 Garrison Green 0Glenmore Park 0 1 0 0 1 Glenmore Park 0Market Mall 0 0 0 0 0 Market Mall 0Nickle House 0 0 0 0 0 Nickle House 0Rouleau Manor 0 6 0 0 6 Rouleau Manor 0Royal Park 0 0 0 0 0 Royal Park 0Sarcee 0 1 0 0 1 Sarcee 0Signal Pointe 0 2 0 0 2 Signal Pointe 0Southport 0 0 0 0 0 Southport 0Carewest Total 0 33 1 0 34 Carewest Total 0 0 0 0 0Employees = 2736 Employees =
Fanning - Initiated by 10 different clients (1 client 2 incidents 3 East); 1 West visitor incident
Garrison Green - Initiated by 3 clients + 1 visitor incident
Rouleau Manor - Initiated by 3 different clients (1 client with 4 incidents 2nd Floor)
Sarcee - Initiated by 4 different clients. 1 Hospice family incident
4th Q 15/16 - Aggression in the Workplace
Type 1 Property Damage
Type 2 Client/Family directed at
Staff
Type 3 Staff to Staff
Type 4 Domesti
c Violence Total
Beddington 0 0 0 0 0George Boyack 0 2 0 0 2Colonel Belcher 0 15 0 0 15Fanning 0 6 0 0 6Garrison Green 0 0 0 0 0Glenmore Park 0 0 0 0 0Market Mall 0 0 0 0 0Nickle House 0 0 0 0 0Rouleau Manor 0 15 0 0 15Royal Park 0 0 0 0 0Sarcee 0 1 0 0 1Signal Pointe 0 11 0 0 11Southport 0 0 0 0 0Carewest Total 0 50 0 0 50Employees = 2715Colonel Belcher - Initiated by 13 different clientsRouleau Manor - Initiated by 12 different clientsSignal Pointe - Initiated by 8 different clients
Aggression in the Workplace Detail
1st Q 16/17 - Aggression in the Workplace 2nd Q 16/17 - Aggression in the Workplace
3rd Q 16/17 - Aggression in the Workplace 4th Q 16/17 - Aggression in the Workplace
32

Goal Area:
• Satisfied Clients □ • Progressive Work Environment □
• Targeted Service Development □ • Cost Effective Organization ■
2015/16 2016/17Q1 Q2 Q3 Q4 Q1 Q2 Q3 Q4
Variance (percentage) 7.4% 4.5% 2.3% 0.1% 1.0% 2.6% 0.5%Target 0.8% 0.8% 0.8% 0.8% 0.8% 0.8% 0.8% 0.8%
CAREWEST CORPORATE PERFORMANCE INDICATOR
Operating Surplus (Variance)
Balanced Budget (Variance)
Accountability for Analysis and Action: Executive Leadership Committee
Definition:
Analysis: Q3
Plan for Improvement/Timelines: (required where target is not achieved)
Decrease in operating surplus was due to additional accrual for wage settlement and renovation. Unbudgeted
bad debt and cost related to the reductions in Health Benefits Trust Account net assets.
Data Source: Carewest Financial data
The Operating Surplus Indicator compares the actual net operating surplus (deficit) to the actual net revenues.
0.0%1.0%2.0%3.0%4.0%5.0%6.0%7.0%8.0%
Q1 Q2 Q3 Q4 Q1 Q2 Q3 Q4
2015/16 2016/17
Variance (percentage)
33
Goal Area:
• Satisfied Clients □ • Progressive Work Environment □
• Targeted Service Development □ • Cost Effective Organization ■
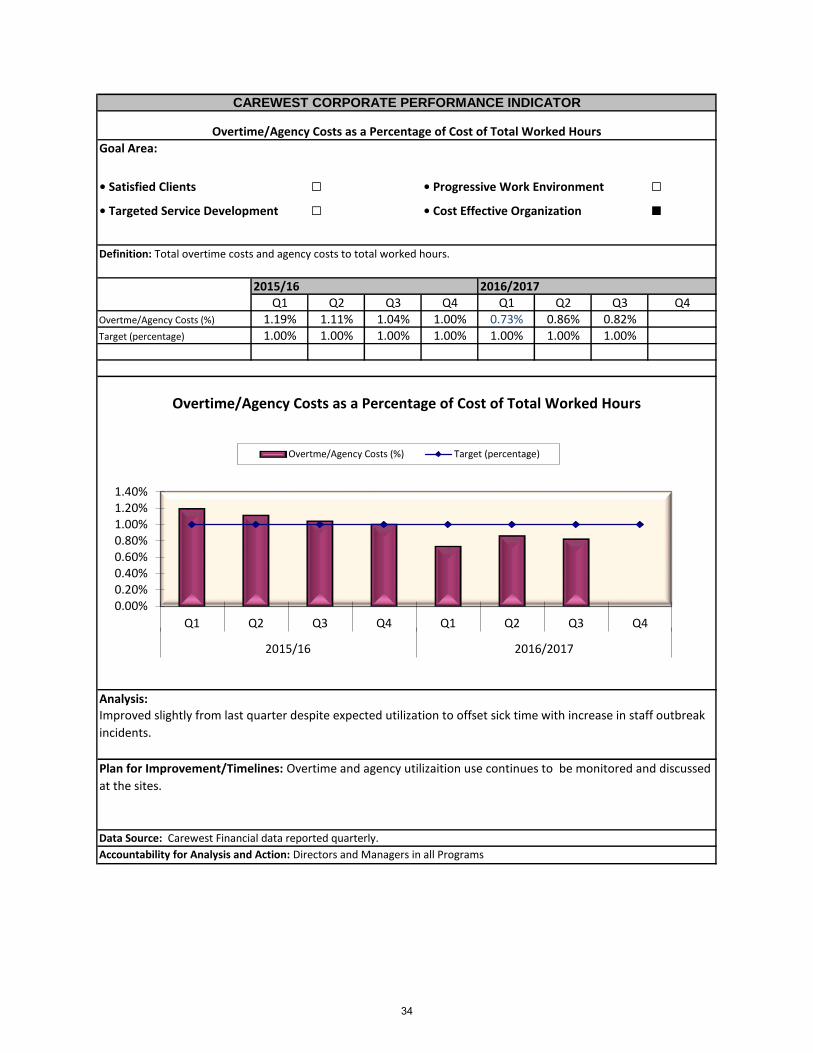
2015/16 2016/2017Q1 Q2 Q3 Q4 Q1 Q2 Q3 Q4
Overtme/Agency Costs (%) 1.19% 1.11% 1.04% 1.00% 0.73% 0.86% 0.82% 0.0%Target (percentage) 1.00% 1.00% 1.00% 1.00% 1.00% 1.00% 1.00% 1.00%
Overtime/Agency Costs as a Percentage of Cost of Total Worked Hours
CAREWEST CORPORATE PERFORMANCE INDICATOR
Overtime/Agency Costs as a Percentage of Cost of Total Worked Hours
Definition: Total overtime costs and agency costs to total worked hours.
Accountability for Analysis and Action: Directors and Managers in all Programs
Analysis:
Plan for Improvement/Timelines: Overtime and agency utilizaition use continues to be monitored and discussed
at the sites.
Data Source: Carewest Financial data reported quarterly.
Improved slightly from last quarter despite expected utilization to offset sick time with increase in staff outbreak
incidents.
0.00%0.20%0.40%0.60%0.80%1.00%1.20%1.40%
Q1 Q2 Q3 Q4 Q1 Q2 Q3 Q4
2015/16 2016/2017
Overtme/Agency Costs (%) Target (percentage)
34