Balance sheet interlinkages and macro-financial risk analysis in the
48
WORKING PAPER SERIES NO 1124 / DECEMBER 2009 BALANCE SHEET INTERLINKAGES AND MACRO-FINANCIAL RISK ANALYSIS IN THE EURO AREA by Olli Castrén and Ilja Kristian Kavonius
Transcript of Balance sheet interlinkages and macro-financial risk analysis in the

Work ing PaPer Ser i e Sno 1124 / december 2009
balance Sheet interlinkageS and macro-Financial riSk analySiS in the euro area
by Olli Castrén and Ilja Kristian Kavonius

WORKING PAPER SER IESNO 1124 / DECEMBER 2009
This paper can be downloaded without charge fromhttp://www.ecb.europa.eu or from the Social Science Research Network
electronic library at http://ssrn.com/abstract_id=1516167.
In 2009 all ECB publications
feature a motif taken from the
€200 banknote.
BALANCE SHEET INTERLINKAGES
AND MACRO-FINANCIAL RISK
ANALYSIS IN THE EURO AREA 1
by Olli Castrén and Ilja Kristian Kavonius 2
1 The views expressed in this paper are those of the authors and they do not necessarily reflect the views or policies of the European Central Bank
or the European System of Central Banks. The paper benefited from useful comments by Matthias Drehmann, Dale Gray, John Fell,
Philipp Hartmann, Steven Keuning, Goetz von Peter, Hung Shin, Matthias Sydow, Tuomas Takalo, Christian Upper, the members
of the ESCB Banking Supervision Committee, seminar participants and commentators at the ECB and the Bank of England,
and participants of the ECB workshop “Recent Advances in Modelling Systemic Risk Using Network Analysis”,
without implicating them in any remaining errors.
2 European Central Bank, Kaiserstrasse 29, D-60311 Frankfurt am Main, Germany;
e-mail: [email protected] and [email protected]

© European Central Bank, 2009
Address Kaiserstrasse 29 60311 Frankfurt am Main, Germany
Postal address Postfach 16 03 19 60066 Frankfurt am Main, Germany
Telephone +49 69 1344 0
Website http://www.ecb.europa.eu
Fax +49 69 1344 6000
All rights reserved.
Any reproduction, publication and reprint in the form of a different publication, whether printed or produced electronically, in whole or in part, is permitted only with the explicit written authorisation of the ECB or the author(s).
The views expressed in this paper do not necessarily refl ect those of the European Central Bank.
The statement of purpose for the ECB Working Paper Series is available from the ECB website, http://www.ecb.europa.eu/pub/scientific/wps/date/html/index.en.html
ISSN 1725-2806 (online)

3ECB
Working Paper Series No 1124December 2009
Abstract 4
Executive Summary 5
1 Introduction 7
2 Description of the balance sheet data 9
3 The network of balance sheet exposures for the euro area fi nancial system 12
4 Transmission of shocks in the network of balance sheet exposures 16
5 Measuring systemic risk using risk-based balance sheets 21
5.1 The sector-level contingent claims model 22
5.2 Estimation of sector-level risk indicators 27
5.3 Shocks in the risk-based network of bilateral exposures 33
6 Concluding remarks 37
References 39
Annexes 41
European Central Bank Working Paper Series 45
CONTENTS
Abstract The financial crisis has highlighted the need for models that can identify counterparty risk exposures and shock transmission processes at the systemic level. We use the euro area financial accounts (flow of funds) data to construct a sector-level network of bilateral balance sheet exposures and show how local shocks can propagate throughout the network and affect the balance sheets in other, even seemingly remote, parts of the financial system. We then use the contingent claims approach to extend this accounting-based network of interlinked exposures to risk-based balance sheets which are sensitive to changes in leverage and asset volatility. We conclude that the bilateral cross-sector exposures in the euro area financial system constitute important channels through which local risk exposures and balance sheet dislocations can be transmitted, with the financial intermediaries playing a key role in the processes. High financial leverage and high asset volatility are found to increase a sector’s vulnerability to shocks and contagion. Keywords: Balance sheet contagion, financial accounts, network models, contingent claims analysis, systemic risk, macro-prudential analysis. JEL Classification: C22, E01, E21, E44, F36, G01, G12, G14
4ECBWorking Paper Series No 1124December 2009

Executive Summary
The process of financial stability assessment typically involves identification of risks and
vulnerabilities in various parts of the financial system. It also calls for identification of
potential triggering events which, if crystallised, could flip the state of the financial system
from stability to instability. However, the events of the recent global financial turmoil have
demonstrated that financial stability analysis should also aim at identifying links between
sectors and channels through which local shocks may propagate wider in the financial system.
Seeing the financial system as a network of interlinked exposures can help to detect such
transmission mechanisms. Analysis of this network may then reveal that parts of the financial
system that might not be considered particularly vulnerable to a given adverse scenario could
still be affected due to their close interconnection with sectors that are directly confronted by
the unforeseen events.
This paper proposes a new framework that captures several types of interlinkages within the
financial system. The approach yields three main contributions to the existing work: first, by
using the data from the euro area financial accounts and thus focusing on sector-level bilateral
exposures, we aim at filling a gap in the literature that applies networks to financial stability
analysis. The existing studies mainly look at bilateral exposures at the firm-level, such as in
the inter-bank money markets, or at the country level, typically using cross-border banking
flows data. Second, in the latter part of the paper, we apply the contingent claims analysis to
extend the constructed accounting-based network of bilateral exposures to a risk-based
network where we can trace the propagation of volatility shocks and changes in risk
exposures. This extension provides particularly interesting results as regards the interactions
between leverage and volatility in an environment where measures of credit risk are
characterised by strong non-linearities. Third, we carry out simulation exercises which
illustrate the extent of balance sheet contagion (defined as the propagation of mark-to-market
losses along the bilateral exposures) and risk contagion (defined as an increase in correlation
among sector-level risk exposures in times of financial stress) in the euro area financial
system.
The data that is used to construct the sector-level balance sheets are from the euro area
accounts (EAA), published jointly by the ECB and Eurostat. This type of data is also known
as flow of funds statistics which are available in most developed economies – based on the
common definitions listed in the world-wide manual of System of National Accounts (SNA) –
5ECB
Working Paper Series No 1124December 2009

in varying instrument breakdowns, publication frequencies and lengths of time series. The
EAA form a closed system which means that each financial asset item of a sector has a
counterparty item on the liability side of some other sector. Due this internal consistency, the
EAA are well suitable for analysis that aims at identifying counterparty risk exposures and
shock propagation channels in various financial instrument categories at the sector level.
The main results can be summarised as follows. Over the first ten years of the EMU, the
bilateral financial accounts network linkages have grown markedly, with the banking sector
constituting a key part of the euro area financial system. In simulation exercises we analyse
the propagation of shocks and contagion in the network of sector-level balance sheets in a
multi-period context and find that under mark-to-market accounting, local cash-flow shocks
can spread around quickly along the bilateral exposures even when there are no defaults in the
process, with banks and non-financial firms playing key roles in the transmission. These
results provide interesting empirical support to the conceptual models of shock transmission
via balance sheet exposures as formalised, among others, by Kiyotaki and Moore (1997,
2002), Goodhart (2006) and Shin (2008). We then calculate the risk-based balance sheets for
individual sectors following the recent conceptual work by Gray, Merton and Bodie (2007)
and Gary and Malone (2008) and show how these evolved prior to and after the recent
financial turmoil broke out. Simulation exercises on the risk-based network illustrate how
correlations among sector-level risk indicators surged amid the outbreak of the financial
turmoil in mid-2007. We also show how sector-level credit risk indicators are affected by
shocks in other parts of the network and how the risk indicators of sectors with highest
leverage are the most vulnerable ones to shocks to volatility. In that sense, higher leverage
increases sensitivity to volatility shocks in the same way as in deeply out-of-the money
options.
In a recent paper, Borio and Drehmann (2009) argue that the desirable features of an
operational financial stability framework should include, inter alia, the following three
characteristics. First, it should focus on the financial system as a whole as opposed to
individual institutions. Second, the more interconnected areas of the system should deserve
more attention than others. Third, the analysis should capture common exposures, arising
either from claims to non-financial sectors or from exposures within the financial sector. Our
proposed framework captures these features and it thus provides one contribution to the work
towards such operational frameworks. It also opens up several avenues for further research in
financial stability and macro-prudential analysis using network models and risk-based balance
sheets.
6ECBWorking Paper Series No 1124December 2009
1. Introduction
The process of financial stability assessment typically involves identification of risks and
vulnerabilities in various parts of the financial system. It also calls for identification of
potential triggering events which, if crystallised, could flip the state of the financial system
from stability to instability. But the events of the recent global financial turmoil have
demonstrated that financial stability analysis should, perhaps first and foremost, also aim at
identifying links between sectors and channels through which local shocks may propagate
wider in the financial system.1 Seeing the financial system as a network of interlinked
exposures can help to detect such transmission mechanisms. Analysis of this network may
then reveal that parts of the financial system that might not be considered particularly
vulnerable to a given adverse scenario could still be affected due to their close interconnection
with sectors that are directly confronted by the unforeseen events.2
This paper proposes a new framework for analysing financial system stability that captures
several types of interlinkages within the financial system. The approach yields three main
contributions to the existing work: first, by using the flow of funds data from the euro area
financial accounts and thus focusing on sector-level bilateral exposures, we aim at filling a
gap in the literature that applies networks to financial stability analysis. The existing studies
mainly look at bilateral exposures at the firm-level, such as in the interbank money markets,
or at the country level, typically using cross-border banking flows data.3 Second, in the latter
part of the paper, we apply the contingent claims analysis to extend the constructed
accounting-based network of bilateral exposures to a risk-based network where we can trace
also the propagation of volatility shocks and changes in risk exposures. This extension
provides particularly interesting results as regards the interactions between leverage and
1 Indeed, the spreading of the financial turmoil from the external environment via the off-balance sheet vehicles to euro area banks and further to other financial and non-financial sectors as the financial crisis evolved in 2007-09 exposed unforeseen counterparty linkages and eroded confidence in the way which further amplified the effect of the initial shocks. 2 Reflecting growing awareness of such network externalities for financial stability analysis, recommendations issued by several committees for reforming the European financial supervision advised that more comprehensive systemic risk indicators, such as “financial stability maps” should be developed (see for example de Larosiere, 2009). In a normative dimension, understanding the structure and characteristics of the financial networks could also lead to recommendations for structural changes that may enhance the robustness and resilience of the system as recently suggested by Haldane (2009). 3 For European studies on interbank networks, see e.g. Becher, Millard and Soramaki (2008), van Lelyveld and Liedorp (2006), Upper and Worms (2004) and Wells (2004). On the country-level networks, see McGuire and Tarashev (2008) and Castrén, Fell and Valckx (2009). Important theoretical contributions to network analysis are Watts (2004) and Gallegati et al (2008) which also contain extensive surveys of related literature.
7ECB
Working Paper Series No 1124December 2009
volatility in an environment where measures of credit risk are characterised by strong non-
linearities. Third, we carry out simulation exercises which illustrate the extent of balance
sheet contagion (defined as propagation of mark-to-market losses along the bilateral
exposures) and risk contagion (defined as an increase in correlation among sector-level risk
exposures in times of financial stress) in the euro area financial system.
The main results of our work can be summarised as follows. Over the first ten years of the
EMU, the bilateral financial accounts network linkages have grown markedly, with the
banking sector constituting a key part of the euro area financial system. In simulation
exercises we analyse the propagation of shocks and contagion in the network of sector-level
balance sheets in a multi-period context and find that under mark-to-market accounting, local
cash-flow shocks can spread around quickly along the bilateral exposures even when there are
no defaults in the process, with banks and non-financial firms playing key roles in the
transmission. These results provide interesting empirical support to the conceptual models of
shock transmission via balance sheet exposures as formalised, among others, by Kiyotaki and
Moore (1997, 2002), Goodhart (2006) and Shin (2008). We then calculate the risk-based
balance sheets for individual sectors following the recent conceptual work by Gray, Merton
and Bodie (2007) and Gary and Malone (2008). Simulation exercises on the risk-based
network illustrate how correlations among sector-level risk indicators surged amid the
outbreak of the financial turmoil in mid-2007. We also show how sector-level credit risk
indicators are affected by shocks in other parts of the network and how the risk indicators of
sectors with highest leverage are the most vulnerable ones to shocks to volatility. In that
sense, higher leverage increases sensitivity to volatility shocks in the same way as in deeply
out-of-the money options.
In a recent paper, Borio and Drehmann (2009) argue that the desirable features of an
operational financial stability framework should include, inter alia, the following three
characteristics. First, it should focus on the financial system as a whole as opposed to
individual institutions. Second, the more interconnected areas of the system should deserve
more attention than others. Third, the analysis should capture common exposures, arising
either from claims to non-financial sectors or from exposures within the financial sector. Our
proposed framework captures these features and it thus provides one contribution to the work
towards such operational frameworks. It also opens up several avenues for further research in
financial stability and macro-prudential analysis using network models and risk-based balance
sheets.
The rest of this paper proceeds as follows. Section 2 describes the balance sheet data and
discusses the pros and cons of using financial accounts data in the context of financial
stability analysis. In section 3 we calculate the network of bilateral balance sheet exposures.
8ECBWorking Paper Series No 1124December 2009

Section 4 analyses the transmission of shocks in the accounting-based network. Section 5
contains the analysis of risk-based balance sheets. Section 6 concludes.
2. Description of the balance sheet data In this paper the euro area financial system is considered as a closely intertwined group of
seven distinct sectors: households including non-profit institutions serving households, non-
financial corporations (NFCs), banks (MFIs), insurance and pension fund companies, other
financial intermediaries (OFIs), general government, and the rest of the world (RoW).4 These
sectors cover the entire economy and including the RoW sector the system is closed, i.e. paid
transactions in the system have to equal received transactions. This means that each financial
asset item of a sector has a counterparty item on the liability side of some other sector.
The data that is used to construct the sector-level balance sheets are from the euro area
accounts (EAA), published jointly by the ECB and Eurostat. In the EAA, the analytical
grouping of economic agents into institutional sectors and transactions is based on the
methodological framework established in the European System of Accounts 1995 (ESA95).5
This type of data is often referred to as the flow of funds statistics which are available in most
developed economies in varying instrument breakdowns, publication frequencies and lengths
of time series. These data are broadly comparable between different countries as the overall
framework is defined in the System of National Accounts (SNA), a worldwide manual for the
compilation of national accounts. Importantly, the EAA data are non-consolidated which
means that they include financial linkages not only between the sectors but also within the
sectors in the system. This will have important implications to the analysis below.
Due to its internal consistency, the EAA are well suitable for analysis that aims at identifying
counterparty risk exposures and shock propagation channels at the sector level. At the same
time, this characteristic also gives raise to its main weakness as some economically important
non-financial stocks and instruments do not have counterparty items on the liability sides.
Therefore such items, most notably housing assets, have to be excluded from analyses which
4 Our definition of “financial system” is therefore relatively broad and based on accounting terms. Other definitions can be more nuanced. For example, in its Financial Stability Review the ECB defines the financial system as consisting of financial markets, institutions and infrastructures. 5 The sectoral breakdown adopted in this paper is identical to the sectoral detail in the EAA. For more details, see http://forum.europa.eu.int/irc/dsis/nfaccount/info/data/esa95/en/titelen.htm. The ESA95 stands for the “European System of Accounts 1995” and it is an application of “System of National Accounts 1993” (SNA93). According to the ESA95 principle all data are valued at market prices. However, the practical application of market prices is not always straightforward since all financial instruments, such as loans, do not have proper secondary markets. In such cases the data is estimated as close to the market price as possible. The euro area figures are aggregated from the individual country data and the specific estimation methods can vary from country to country. Currently, only some countries publish parts of their financial accounts data at quarterly frequency and therefore European institutions do not publish country level figures. At annual frequency these data are published by most of the European Union member states.
9ECB
Working Paper Series No 1124December 2009
use financial accounts data.6 Annex 1 discusses the link between financial and non-financial
wealth in more detail and illustrates how housing assets and housing wealth are recorded in
the integrated (i.e. financial and real) accounts.
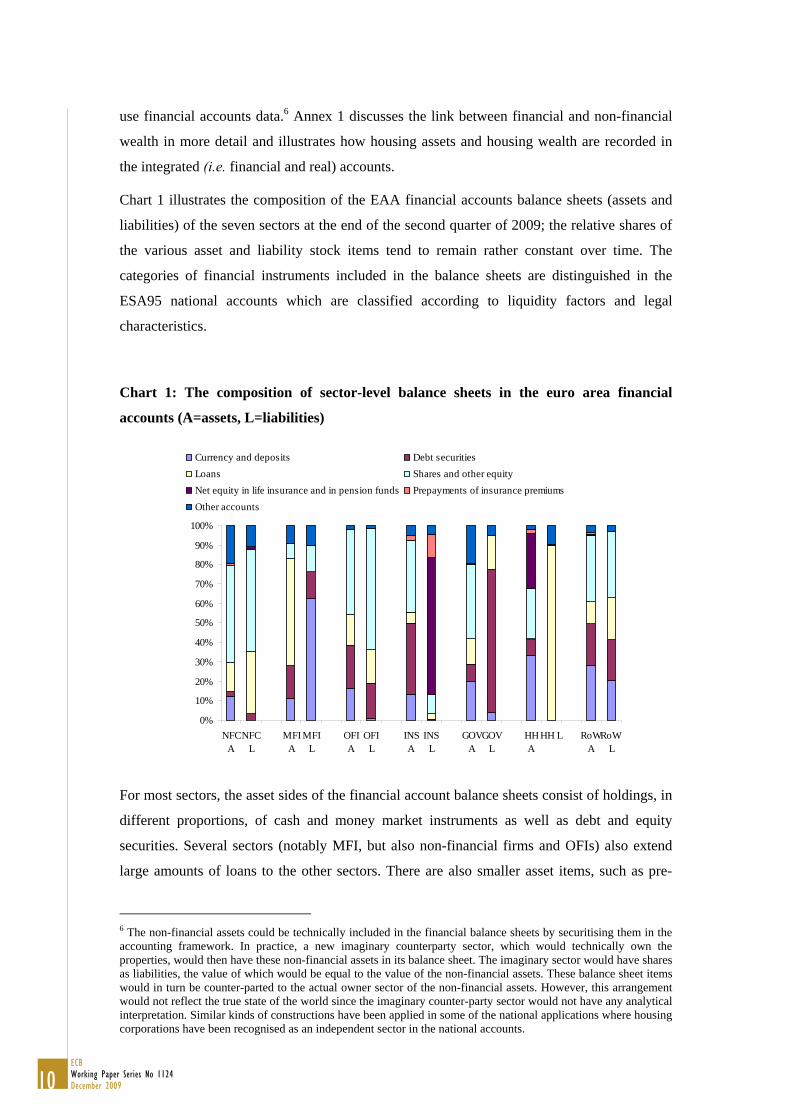
Chart 1 illustrates the composition of the EAA financial accounts balance sheets (assets and
liabilities) of the seven sectors at the end of the second quarter of 2009; the relative shares of
the various asset and liability stock items tend to remain rather constant over time. The
categories of financial instruments included in the balance sheets are distinguished in the
ESA95 national accounts which are classified according to liquidity factors and legal
characteristics.
Chart 1: The composition of sector-level balance sheets in the euro area financial
accounts (A=assets, L=liabilities)
0%
10%
20%
30%
40%
50%
60%
70%
80%
90%
100%
NFCA
NFCL
MFIA
MFIL
OFIA
OFIL
INSA
INSL
GOVA
GOVL
HHA
HH L RoWA
RoWL
Currency and deposits Debt securities Loans Shares and other equity Net equity in life insurance and in pension funds Prepayments of insurance premiums Other accounts
For most sectors, the asset sides of the financial account balance sheets consist of holdings, in
different proportions, of cash and money market instruments as well as debt and equity
securities. Several sectors (notably MFI, but also non-financial firms and OFIs) also extend
large amounts of loans to the other sectors. There are also smaller asset items, such as pre-
6 The non-financial assets could be technically included in the financial balance sheets by securitising them in the accounting framework. In practice, a new imaginary counterparty sector, which would technically own the properties, would then have these non-financial assets in its balance sheet. The imaginary sector would have shares as liabilities, the value of which would be equal to the value of the non-financial assets. These balance sheet items would in turn be counter-parted to the actual owner sector of the non-financial assets. However, this arrangement would not reflect the true state of the world since the imaginary counter-party sector would not have any analytical interpretation. Similar kinds of constructions have been applied in some of the national applications where housing corporations have been recognised as an independent sector in the national accounts.
10ECBWorking Paper Series No 1124December 2009

payments of insurance premia and net equity in life insurance and pension funds. Owing to
the inclusion of the rest of the world sector these asset holdings include instruments that are
originated by both domestic and foreign counterparties.
In contrast to the asset holdings, the sector-specific liability positions show more distinct
characteristics. The liabilities of the non-financial firm sector consist of loans, as well as
equity and debt securities issued to other firms and other sectors in the financial system. For
banks (MFI), the liabilities are deposits collected from other banks and from the private
sector, as well as currency, stocks and bonds issued to the other sectors.7 The bulk of the OFI
sector liabilities are mutual fund shares while the largest share of the insurance and pension
funds sector’s liabilities consist of net equity of households in life insurance premia and in
pension funds. For government, the largest share of liabilities is represented by government
bonds which in developed economies are mostly denominated in domestic currency.
Household sector liabilities consist almost entirely of MFI loans to finance housing and
consumption expenditures. Finally, for the rest of the world sector, both sides of the balance
sheet are rather evenly split between cash, loans and securities.
Despite that fact that in integrated financial accounts, like the EAA, the assets must equal
liabilities at the system level, this is not necessarily the case at the sector level. Indeed, some
sectors in the financial system may show systematic deficits in their financial accounts whilst
other sectors may report systematic surpluses. The non-financial corporations and government
sectors are typically (although not always) net debtors, while households form the main
creditor sector. In so far as the deficits run by the domestic borrowing sectors exceed the
surpluses recorded by the domestic lending sectors, the gap must be financed by borrowing
from the rest of the world. In fact, the financial position of the rest of the world sector mirrors,
by definition, the current account of the balance of payments of the domestic financial
system.8
The difference between a sector’s financial assets and its liabilities amounts to that sector’s
net financial wealth position which will become important in the later parts of this paper.
Chart 2 illustrates the evolution over time of the net financial wealth positions in the sectors
of the euro area financial system, with the positive net financial wealth of the surplus sectors
(mainly households and the rest of the world) matching the negative net financial wealth of
the deficit sectors (mainly government and non-financial firms). It is noteworthy that in
financial accounts, the net financial wealth of the financial sectors (i.e. the MFI, insurance and
OFI sectors) is close to zero. This reflects the fact that as financial intermediaries, the bulk of
7 Note that in EAA, the central bank is incorporated in the MFI sector. 8 Note that despite the fact that the rest of world sector “closes” the system, it is actually an independent sector and its balance sheet is calculated on the basis of own data sources.
11ECB
Working Paper Series No 1124December 2009

the assets and liabilities of these sectors consist of financial instruments while their holdings
of real assets such as real estate and production assets are relatively minor.9
Chart 2: Evolution of the sector-level financial net wealth components in the euro area
financial system
-10000000
-5000000
0
5000000
10000000
1999Q1 2000Q1 2001Q1 2002Q1 2003Q1 2004Q1 2005Q1 2006Q1 2007Q1 2008Q1 2009Q1
NFC MFI OFI INS GOVT HH ROW
3. The network of balance sheet exposures for the euro area financial
system Although the EAA form a closed system in the sense that all financial assets must have a
counterparty item in some other sector’s liability side, the financial accounts do not currently
provide detailed information about the specific counterparties of the instruments issued by a
given sector (the so called “who-to-whom” accounts). In the absence of this information, we
estimate the bilateral balance sheet linkages between sectors. When the aggregate asset
(liability) holdings of each sector are known on an instrument-by-instrument basis, the
allocation of these aggregate holdings across the liabilities (assets) of all other sectors can be
9 Net wealth and its role in allocating the sectors to borrowers and lenders in the financial system provide a link between the financial and the real accounts. Net wealth (a stock measure) can be defined as accumulated lending or borrowing (flow measures), including changes in prices and other components. Net lending/borrowing of a sector can be further decomposed to investment (gross capital formation) and saving. Therefore, shocks to savings and investment are conveyed to the financial accounts via their impact on the flows of net lending and, therefore, on the net wealth position. Conversely, shocks from the financial part of the economy are transmitted via the net lending/borrowing positions to the non-financial parts of the economy. This linkage is illustrated in Annex 1.
12ECBWorking Paper Series No 1124December 2009
approximated using maximum entropy techniques which exploit the relative shares of the
sector-specific total assets and liabilities. The applications of such methods are common in
statistical exercises, input-output analyses and in models of financial contagion and interbank
networks (see e.g. Allen and Gale, 2000, Upper and Worms, 2004, Wells, 2004 and van
Lelyveld and Liedorp, 2006).10
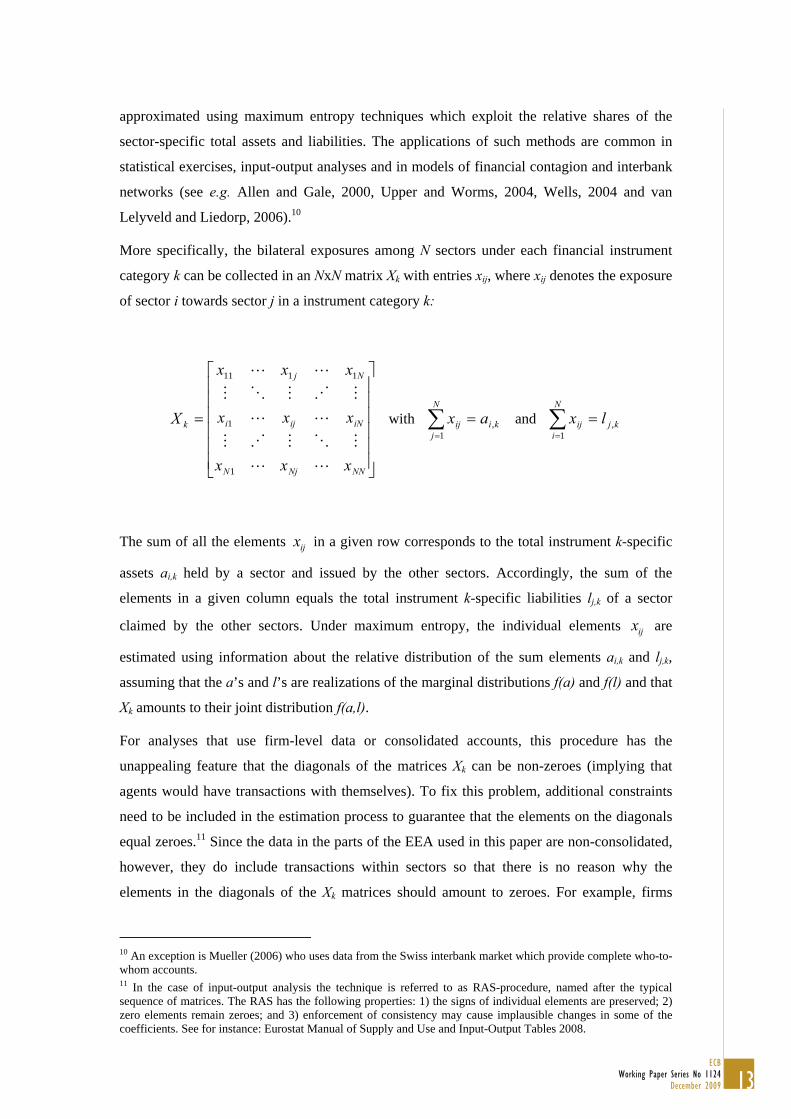
More specifically, the bilateral exposures among N sectors under each financial instrument
category k can be collected in an NxN matrix Xk with entries xij, where xij denotes the exposure
of sector i towards sector j in a instrument category k:
⎥⎥⎥⎥⎥⎥
⎦
⎤
⎢⎢⎢⎢⎢⎢
⎣
⎡
=
NNNjN
iNiji
Nj
k
xxx
xxx
xxx
X
LL
MOMNM
LL
MNMOM
LL
1
1
1111
with ∑=
=N
jkiij ax
1, and ∑
=
=N
ikjij lx
1,
The sum of all the elements ijx in a given row corresponds to the total instrument k-specific
assets ai,k held by a sector and issued by the other sectors. Accordingly, the sum of the
elements in a given column equals the total instrument k-specific liabilities lj,k of a sector
claimed by the other sectors. Under maximum entropy, the individual elements ijx are
estimated using information about the relative distribution of the sum elements ai,k and lj,k,
assuming that the a’s and l’s are realizations of the marginal distributions f(a) and f(l) and that
Xk amounts to their joint distribution f(a,l).
For analyses that use firm-level data or consolidated accounts, this procedure has the
unappealing feature that the diagonals of the matrices Xk can be non-zeroes (implying that
agents would have transactions with themselves). To fix this problem, additional constraints
need to be included in the estimation process to guarantee that the elements on the diagonals
equal zeroes.11 Since the data in the parts of the EEA used in this paper are non-consolidated,
however, they do include transactions within sectors so that there is no reason why the
elements in the diagonals of the Xk matrices should amount to zeroes. For example, firms
10 An exception is Mueller (2006) who uses data from the Swiss interbank market which provide complete who-to-whom accounts. 11 In the case of input-output analysis the technique is referred to as RAS-procedure, named after the typical sequence of matrices. The RAS has the following properties: 1) the signs of individual elements are preserved; 2) zero elements remain zeroes; and 3) enforcement of consistency may cause implausible changes in some of the coefficients. See for instance: Eurostat Manual of Supply and Use and Input-Output Tables 2008.
13ECB
Working Paper Series No 1124December 2009
within the NFC sector and banks within the MFI sector can lend to and borrow from each
other and own each others’ shares and debt instruments.12
Annex 2 shows the estimated who-to-whom exposures for each sector, instrument-by-
instrument, as of 2009 Q2. They suggest, among other things, that on the asset sides almost all
of the currency and deposits held by different sectors are originated by the MFI sector while
the bulk of the debt securities held by other sectors are issued by the government sector. Most
of the loans extended by the MFI and the OFI sectors are to the NFC and the household
sectors, while equity holdings of various sectors to a large extent consist of shares issued by
the NFC and the RoW sectors. On the liability sides, the estimated bilateral linkages indicate
that large parts of debt securities issued by various sectors are counter-partied by the MFI,
insurance and RoW sectors while by far the largest share of loans are owed to the MFI sector.
The NFC and the OFI sectors are the largest holders of the equity shares issued by most
sectors. These results are all intuitive and in the absence of detailed who-to-whom accounts
they provide useful approximations of the true bilateral exposures.
Once the bilateral exposures have been calculated for each instrument category, a network
connecting all sectors in the financial system can be constructed using the gross exposures,
i.e. assets plus liabilities connecting individual sectors in all instrument categories. Chart 3
illustrates this network of balance sheet gross exposures for the euro area financial system at
two distinct points in time, in the first quarter of 1999 and the second quarter of 2009. In
Chart 3, the sizes of the nodes describe the exposures within sectors. These include, among
other items, cross-shareholdings of firms and financial institutions and intercompany loans.
The links show the gross bilateral cross-sector exposures, summed up across all instrument
categories; the thickness of the link connecting two sectors is commensurate with the
magnitude of this gross exposure.
The degree of nodes (i.e. the number of links connecting each sector) is six in case of all
sectors. This means that the degree distribution of the network is symmetric, resembling a
“complete” structure of claims in the terminology by Allen and Gale (2000). This could be
expected in the case of a network of gross exposures which consists of a relatively small
number of nodes: at an aggregated level each sector has at least some asset or liability link to
all other sectors in the euro area financial system. Looking at the bilateral exposures at the
instrument level the picture changes as there are sectors which are not connected to some of
the other sectors in some instrument categories, while there are sectors that can be highly
interconnected in most instrument categories (see also Annex 2).
12 For the intra-rest of the world sector, the who-to-whom statistics are zeroes by definition also in non-consolidated data. This causes a discrepancy which we have corrected using RAS. Additionally, in the current version of the data the intra-MFI sector currency and deposits flows are consolidated.
14ECBWorking Paper Series No 1124December 2009

Chart 3: Cross-sector balance sheet gross exposures in the euro area financial system in
1999Q1 and in 2009Q2
2009 Q2HH ROW
OFI NFC
MFI GOVT
INS
1999 Q1HH ROW
OFI NFC
MFI GOVT
INS
Note: The size of the node illustrates the amount of gross exposures (assets plus liabilities) within sectors. The thickness of the links shows the size of the gross exposures between two sectors.
Three main observations can be drawn from Chart 3. The first is the overall increase in the
size of balance sheet exposures over the first decade of Economic and Monetary Union,
suggesting that interconnectiveness in the euro area financial system has expanded over this
time period. While this in “normal” times would indicate enhanced risk sharing in the
financial system, one can also imagine unanticipated events which may tip the network to a
state where it works as a shock amplifier rather than a shock absorber. We will return to this
point in detail in section 5 below.
The second is the crucial role played by the banking (MFI) sector in the euro area financial
system. As a financial intermediary, it holds liabilities in the form of deposits collected
mainly from the household, NFC and RoW sectors, while it holds assets in the form of loans
15ECB
Working Paper Series No 1124December 2009

mostly extended to these same sectors. In addition, the MFI sector also plays an important
role in securities markets, as it issues equity and debt securities mainly to the household,
insurance, OFI and RoW sectors and holds securities issued mainly by the NFC, OFI,
government and RoW sectors. Although the degree of nodes in the matrix of gross exposures
is the same for all sectors, the large volume of the links connecting the MFI sector to the rest
of the system provides it a role as a “hub” in the network. For that reason, it is evident that
stresses in the MFI sector would have substantial negative spill-over effects into practically
all other sectors in the network of euro area financial system while the MFI sector is directly
exposed to balance sheet shocks especially from the household, NFC, RoW and OFI sectors.
The third observation is the increasing role played by the OFI sector over the past ten years.
While in the euro area this sector mostly consists of investment funds (mostly bond funds), its
growth over time also reflects the expansion of lending to firms and households by non-bank
financial intermediaries as well as the growth of the special purpose vehicles for securitisation
purposes and other off-balance sheet structures which are included in the OFI sector.
Overall, the estimated network of bilateral exposures provides an important tool for systemic
risk analysis. Indeed, assessing financial claims in a network concept captures several features
that are missing in partial analyses that consider the individual sectors as separate and
disconnect from the rest of the system. Among the useful features are the possibilities to
model disruptions in credit chains, transmission of securities losses as well as liquidity
spillovers that result from local balance sheet expansions or contractions. In addition, the
framework captures counterparty risks that in normal times may be unknown or otherwise of
little concern for the various agents in the financial system but could give rise to adverse
surprises when an unanticipated shock hits a sector several steps away in the chain of mutual
exposures.
4. Transmission of shocks in the network of balance sheet exposures We can now take advantage of the network of financial exposures sketched out in Chart 3 to
analyse how shocks to some sectors may cause chain reactions in which the balance sheets of
other sectors are also adversely affected. The theoretical underpinnings for such shock
transmission processes are provided in the literature on credit chains and balance sheet
contagion that are illustrated in the papers by Shin (2008) and Kiyotaki and Moore (1997 and
2002).13 The basic intuition behind these models is that the mutual extension of credit or debt
by agents in the financial system creates balance sheet interlinkages which can act as channels
13 In addition, Haldane (2009) provides a recent review of analysis of network contagion in financial systems in relation to the models developed in other sciences.
16ECBWorking Paper Series No 1124December 2009

of contagion if some of the debtors become unable to service their obligations to their
creditors. In the network model introduced above, we include the entire balance sheets of
sectors. Therefore, we are not constrained to credit relationships but can analyse also
counterparty exposures that arise through all types of financial instrument cross-holdings,
including debt and equity securities and deposit instruments.14
Before proceeding, it is useful to clarify the definitions of “transmission”, “propagation” and
“contagion” in the current context. The literature has yet to reach a consensus on the precise
definitions, but Gallegati et al (2008) provide a detailed discussion of the differences between
these concepts and their relationships to risk sharing and diffusion processes. While these
terms are used somewhat interchangeably below, in our context they relate to the broad case
where a cash-flow shock is initially assigned on one sector which is linked to the other sectors
via the network of bilateral balance sheet exposures. As a result of these links, other sectors’
balance sheets (or risk exposures as introduced below in section 5) are then also affected.
To illustrate the propagation of shocks in the network, imagine a simplified three-sector
framework where a shock to sector A’s cash flow affects the balance sheet items of
counterparty sectors B and C and, on further rounds, the balance sheet of sector A itself. The
shock can be modelled as a sudden decline in net income which causes a deficit in A’s profit
and loss (P&L) account. Importantly, we impose the simple behavioural rule that A and all the
other sectors are subject to mark-to-market accounting, which implies that on every period
they have to deduct losses on P&L accounts or on available-for-sale assets from shareholder
equity (see also Shin, 2008). In such a set-up shocks are quickly transmitted from P&L
accounts to shareholder equity and further to the balance sheets of other sectors via cross-
holdings of shares, with no need to assume defaults in the process.15
In Chart 4 we show how the contagion from the shock to sector A’s balance sheet to B’s and
C’s balance sheets takes place through the loss of net financial wealth that occurs via the
14 Empirical applications of balance sheet contagion typically focus on cascades of bank failures which may propagate along the network of interbank credit exposures (see Cihak, 2007, for a recent review). Recently, Adrian and Shin (2008) have criticised models which use accounting-based valuations to study transmission of balance sheet shocks. Specifically, they argue that such “domino” models may provide an overly simplistic picture of the contagion mechanisms as they depend on shocks that have to be large enough to generate defaults in the system. In practice, as witnessed by the recent crisis that was triggered by losses in the US sub-prime mortgage exposures, even shocks which are relatively modest relative to the sizes of the balance sheets of the affected sectors may have severe consequences to the financial system via valuation losses in counterparty exposures. Below we will address this critique by adopting the rule of mark-to-market accounting which allows us to consider propagation of valuation losses without defaults. 15 Indeed, in the context of the recent financial sector crisis, mark-to-market accounting has been quoted as a factor that accelerated the valuation losses and their spill-over from one sector to another after the financial turmoil first broke out in the asset-backed commercial paper markets and paralysed the financing of banks’ off-balance sheet vehicles in August 2007. Similarly, of course, the large valuation gains over the years prior to the crisis in several asset categories, including housing, corporate stocks and commodities, had inflated the balance sheets of all sectors holding such assets or derivatives products written on these assets. These valuation gains increased borrowing capacity and allowed for higher balance sheet leverage which in turn exposed the investors to vulnerabilities when prices reversed and assets had to be marked to lower market values.
17ECB
Working Paper Series No 1124December 2009
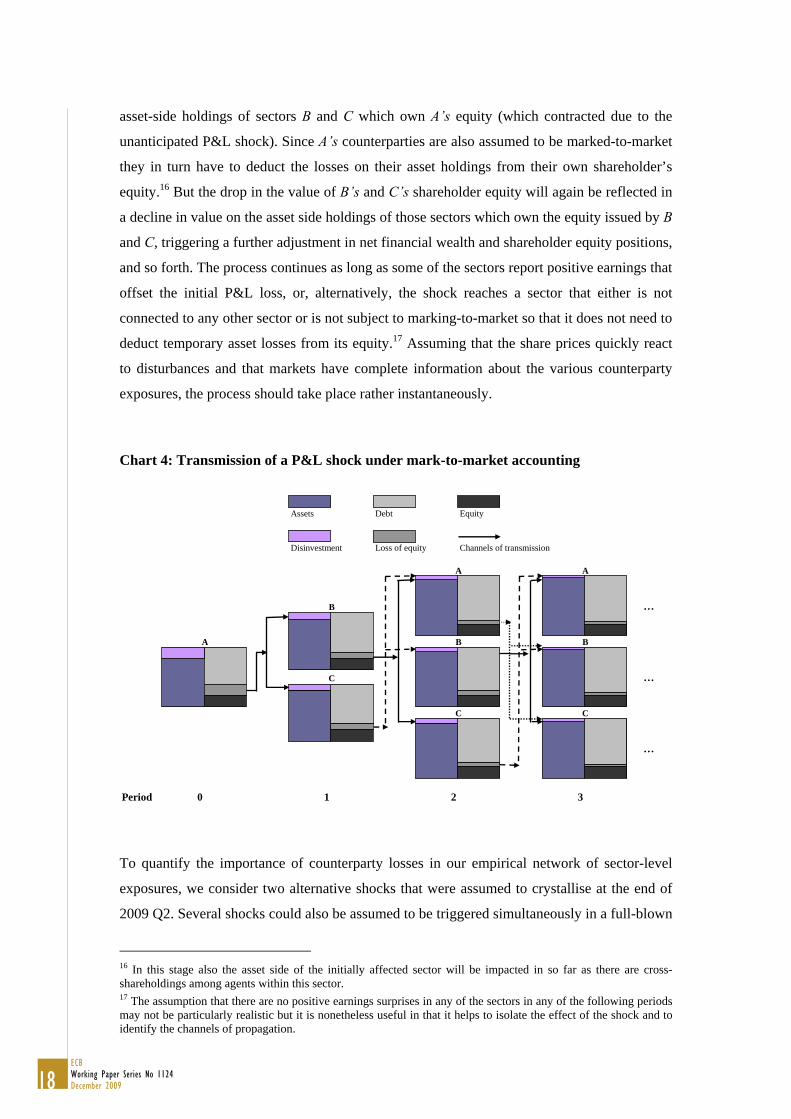
asset-side holdings of sectors B and C which own A’s equity (which contracted due to the
unanticipated P&L shock). Since A’s counterparties are also assumed to be marked-to-market
they in turn have to deduct the losses on their asset holdings from their own shareholder’s
equity.16 But the drop in the value of B’s and C’s shareholder equity will again be reflected in
a decline in value on the asset side holdings of those sectors which own the equity issued by B
and C, triggering a further adjustment in net financial wealth and shareholder equity positions,
and so forth. The process continues as long as some of the sectors report positive earnings that
offset the initial P&L loss, or, alternatively, the shock reaches a sector that either is not
connected to any other sector or is not subject to marking-to-market so that it does not need to
deduct temporary asset losses from its equity.17 Assuming that the share prices quickly react
to disturbances and that markets have complete information about the various counterparty
exposures, the process should take place rather instantaneously.
Chart 4: Transmission of a P&L shock under mark-to-market accounting
Assets Debt Equity
Disinvestment Loss of equity Channels of transmission
…
…
…
Period 0 1 2 3
C
A
B
C
A
B
C
A
B
To quantify the importance of counterparty losses in our empirical network of sector-level
exposures, we consider two alternative shocks that were assumed to crystallise at the end of
2009 Q2. Several shocks could also be assumed to be triggered simultaneously in a full-blown
16 In this stage also the asset side of the initially affected sector will be impacted in so far as there are cross-shareholdings among agents within this sector. 17 The assumption that there are no positive earnings surprises in any of the sectors in any of the following periods may not be particularly realistic but it is nonetheless useful in that it helps to isolate the effect of the shock and to identify the channels of propagation.
18ECBWorking Paper Series No 1124December 2009
scenario, but for the purpose of the exercise which is to identify the main channels of
propagation such simplified sensitivity tests provide the most transparent exposition. To
measure the impact of the shock over discrete periods of time, we apply a round-by-round
algorithm which calculates the distribution of the instrument-specific losses in each sector and
on each round according to the sizes of the balance sheet linkages to the sectors that were
affected in the previous round.
The first shock assumes a negative post-tax, post-dividend earnings growth in the non-
financial corporate sector that is large enough to cause a 20% mark-to-market drop in the
value of shareholder equity. The shock is transmitted to the rest of the system via the mark-to-
market losses in counterparty positions through equity holdings. The second case assumes a
permanent impairment of 15% of the loans extended to the household sector. This latter shock
shows first on the asset sides of the sectors that are the creditors of the household sector and
which have to deduct the loan impairments from their shareholder equity. In the subsequent
rounds the shock propagates via the mark-to-market losses on equity holdings like in the first
case.
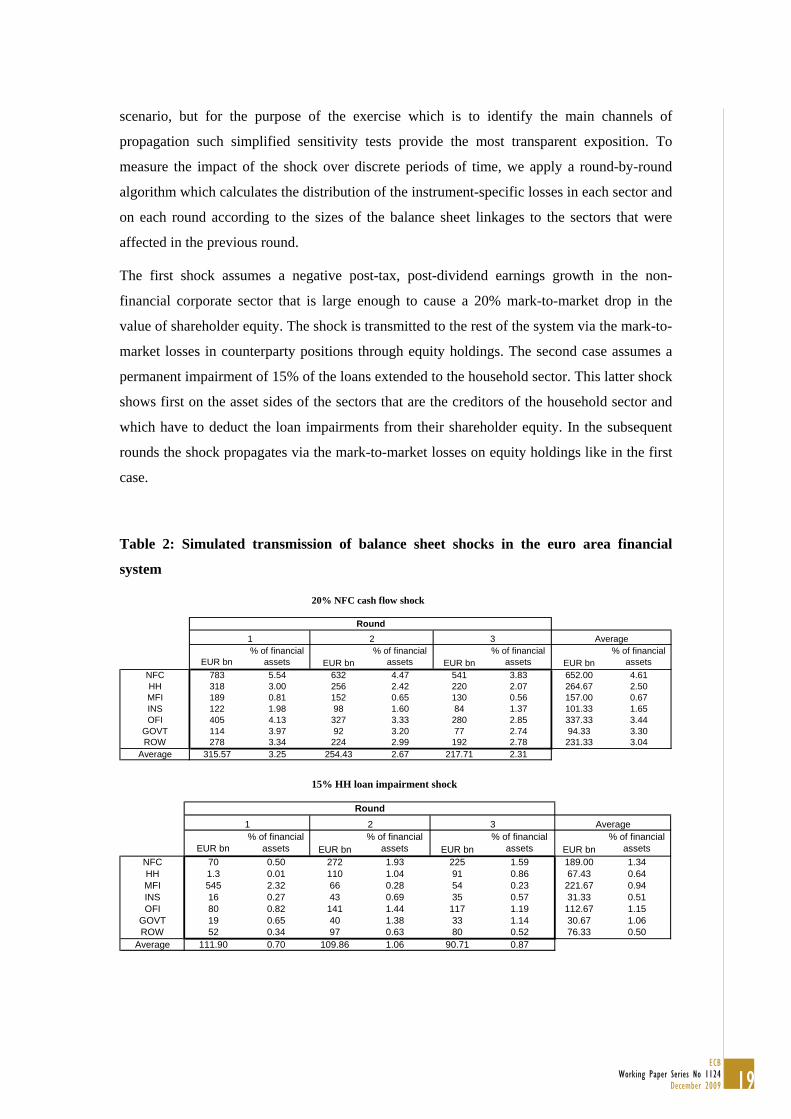
Table 2: Simulated transmission of balance sheet shocks in the euro area financial
system
20% NFC cash flow shock
EUR bn% of financial
assets EUR bn% of financial
assets EUR bn% of financial
assets EUR bn% of financial
assets NFC 783 5.54 632 4.47 541 3.83 652.00 4.61HH 318 3.00 256 2.42 220 2.07 264.67 2.50MFI 189 0.81 152 0.65 130 0.56 157.00 0.67INS 122 1.98 98 1.60 84 1.37 101.33 1.65OFI 405 4.13 327 3.33 280 2.85 337.33 3.44
GOVT 114 3.97 92 3.20 77 2.74 94.33 3.30ROW 278 3.34 224 2.99 192 2.78 231.33 3.04
Average 315.57 3.25 254.43 2.67 217.71 2.31
RoundAverage1 2 3
15% HH loan impairment shock
EUR bn% of financial
assets EUR bn% of financial
assets EUR bn% of financial
assets EUR bn% of financial
assets NFC 70 0.50 272 1.93 225 1.59 189.00 1.34HH 1.3 0.01 110 1.04 91 0.86 67.43 0.64MFI 545 2.32 66 0.28 54 0.23 221.67 0.94INS 16 0.27 43 0.69 35 0.57 31.33 0.51OFI 80 0.82 141 1.44 117 1.19 112.67 1.15
GOVT 19 0.65 40 1.38 33 1.14 30.67 1.06ROW 52 0.34 97 0.63 80 0.52 76.33 0.50
Average 111.90 0.70 109.86 1.06 90.71 0.87
Average
Round1 2 3
19ECB
Working Paper Series No 1124December 2009

The top panel of Table 2 shows the extent of balance-sheet contagion from the NFC sector
cash-flow shock, measured both in billions of euros and in terms of percentages of financial
assets. The sectors that are initially most affected by the contraction of the NFC sector equity
are the NFC sector itself, plus OFI and government sectors, reflecting the large holdings of
NFC sector’s equity shares by these sectors.18 Following this first-round impact which results
from a direct transmission from the NFC sector, in the subsequent rounds the sectors which
are large holders of equity of those sectors that were adversely affected in the first round will
suffer the largest losses. The sectors relatively more affected in these rounds are thus those
which hold large equity portfolios that are diversified across financial and non-financial
corporate sectors. For example, the fact that the losses suffered by the RoW sector decline
quite markedly on the subsequent rounds reflects the fact that its holdings of corporate equity
assets are mainly concentrated on the NFC sector and it is therefore relatively less affected by
the second and third round effects that originate from losses also on holdings of equity issued
by the financial firms in the MFI, OFI and insurance sectors.
Despite the fact that our network represents a “closed” system the size of the average loss in
relation to financial assets appears to diminish gradually over time. This is because the
household and government sectors do not issue equity and therefore within the financial
accounts they do not transmit the shock further (although they themselves keep suffering
additional losses every period due to their exposure to other sectors’ equity on their asset
sides). Instead, the mark-to-market loss of these sectors’ net financial wealth would be
reflected in the real accounts as a decline in their net lending positions. In other words, in the
integrated accounts the size of the shock remains constant over the different points in time
(see also Annex 1).
Regarding the propagation of the household loan shock, the initial impact that occurs on the
asset sides of the creditor sectors is by far the largest in the MFI sector which extends the bulk
of long-term loans to households (in the euro area, the role of the OFI sector is relatively more
prominent in short-term lending). Once the creditor sectors have deducted the impairments
from their shareholder equity the shock propagates to those sectors which have large holdings
of equity, particularly issued by the MFI sector, on their asset side. These further round
impacts are therefore primarily felt by the NFC, OFI and government sectors so that their
overall loss in relation to financial assets could exceed the loss that was faced by the MFI
sector as a result of the initial loan impairment.
Importantly, the analysis above abstracts from the fact that in a multi-period setting,
endogenous re-balancing of accounts might become necessary after asset or P&L shocks 18 Recall that the EEA data applied in this paper are non-consolidated and that in the euro area there are large scale cross-shareholdings among non-financial firms.
20ECBWorking Paper Series No 1124December 2009

caused a contraction of a sector’s equity. In terms of Chart 4, the loss of sector A’s
shareholder equity results in a drop of value in its liabilities which implies that A may choose
to de-leverage its balance sheet either by raising additional equity or debt or by dis-investing a
part of its asset holdings (as shown in the far left part of Chart 4). This dis-investment process
may follow different “rules”. For example, agents can sell their most liquid or riskiest assets
first, or they can reduce their asset holdings instrument-by-instrument in proportion to the
initial composition of their asset holdings. The dis-investment rules can also be state-
dependent in that assets shed in volatile market conditions are different than assets shed in
more tranquil circumstances. In addition, as illustrated by Adrian and Shin (2008), the
required asset shedding can be dis-proportionate to the initial equity loss if the sector targets a
constant leverage ratio. Independent of the rule, by dis-investing a share of its financial assets
in an effort to restore its balance sheet, A generates price and valuation losses on the debt side
of the balance sheets of B and C which issued the dis-invested assets. This means that B and C
in turn may have to dis-invest assets, which could set into motion a process which mirrors the
one described above. The overall impact of the initial P&L shocks is then likely to be
multiplied by these endogenous responses as argued by Adrian and Shin (2008).
In practice, asset dis-investment is complicated to model and at the sector level the algorithms
guiding such processes are still in their infancy. While the spillover of mark-to-market equity
losses provides a relatively clear channel of transmission to the relevant counterparties which
own the affected sector’s equity, in the case of asset shedding not only the instrument but also
the purchasing counterparty needs to be defined. In addition, it is not straightforward to
determine the price impact of such “distressed sales” in closed financial systems (see Duffie,
Garleanu and Pedersen, 2007, for a proposed conceptual framework). The latter is an
important factor as it will not only determine the net impact of asset sales on the balance sheet
of the asset-shedding sector but also the extent of spillover to other sectors which issued these
assets or hold related assets. Nevertheless, once the relevant rules are specified, our model can
be used to simulate the propagation of losses from asset shedding to other sectors’ balance
sheets.
5. Measuring systemic risk using risk-based balance sheets
A key limitation of the presentation above is that it builds on a purely deterministic,
accounting-based framework and therefore it is not possible to say anything about the
accumulation and transmission of risk exposures in the financial system. To incorporate such
characteristics, we need to move from accounting-based to risk-based balance sheets. This can
be done using models that capture also the volatility of the key balance sheet items, such as
21ECB
Working Paper Series No 1124December 2009

shareholder equity and assets. To this end, we draw on recent work by Gray, Merton and
Bodie (2007, henceforth GMB) and Gray and Malone (2008) who provide insights to the
measurement of sector-level risk exposures by applying contingent claims analysis (CCA),
originally developed for assessing firm-level default risk. A particular advantage of the CCA
approach is that the accounting value-based and internally consistent network model
developed in the earlier parts of this paper is fully nested in the risk-based framework that is
the result of the CCA. Indeed, as discussed in detail by GMB (2007), by assuming that
volatilities equal to zero in the CCA balance sheets, the stochastic elements cancel out and the
risk-based models collapse to the deterministic accounting framework. The inclusion of the
risk element opens up many additional insights and avenues for analysis. Most prominently,
the risk-based “CCA network” implies an additional contagion channel in that also risk
exposures can propagate across sectors. There are also important interactions between the
various elements of the model owing to the strong non-linearities that are present in the CCA
balance sheets.
5.1 The sector-level contingent claims model
Originating from the seminal papers by Black and Scholes (1973) and Merton (1974) and
further developed by Moody’s KMV (2002), the CCA approach is based on structural finance
models which use options pricing theory and include as inputs data on balance sheet
liabilities, interest rates, market value of assets, asset return and asset volatility. The output
consists of the optimal debt-equity structure of the firm, plus a number of risk indicators such
as distance-to-distress, expected loss, probability of distress, expected recovery rate and credit
spread over the risk-free interest rate. While some of these indicators are available for
selected financial and non-financial firms and corporate sectors from various private data
sources, for other sectors such as households, government and OFIs the availability is much
more limited, at least from a single, consistent data source.
The intuition behind the CCA is illustrated in Chart 5, where a firm’s assets and liabilities are
plotted on the vertical axis against time on the horizontal axis. The value of the firm’s
liabilities (the thin dotted line) is assumed to be fixed over the time horizon, i.e. all interest
and amortisation payments on debt are made at the maturity date h of the debt. In contrast, the
market value of the firm’s assets fluctuate stochastically over time, with the asset drift (the
bold dotted line) determined by the expected rate of return of the asset. At the end of the
period, the assets are expected to take a value that corresponds to the mean of the distribution
of all possible values. Should the value of the assets fall sufficiently far off the mean of the
distribution to end up below the book value of the firm’s liabilities (the distress point), the
22ECBWorking Paper Series No 1124December 2009
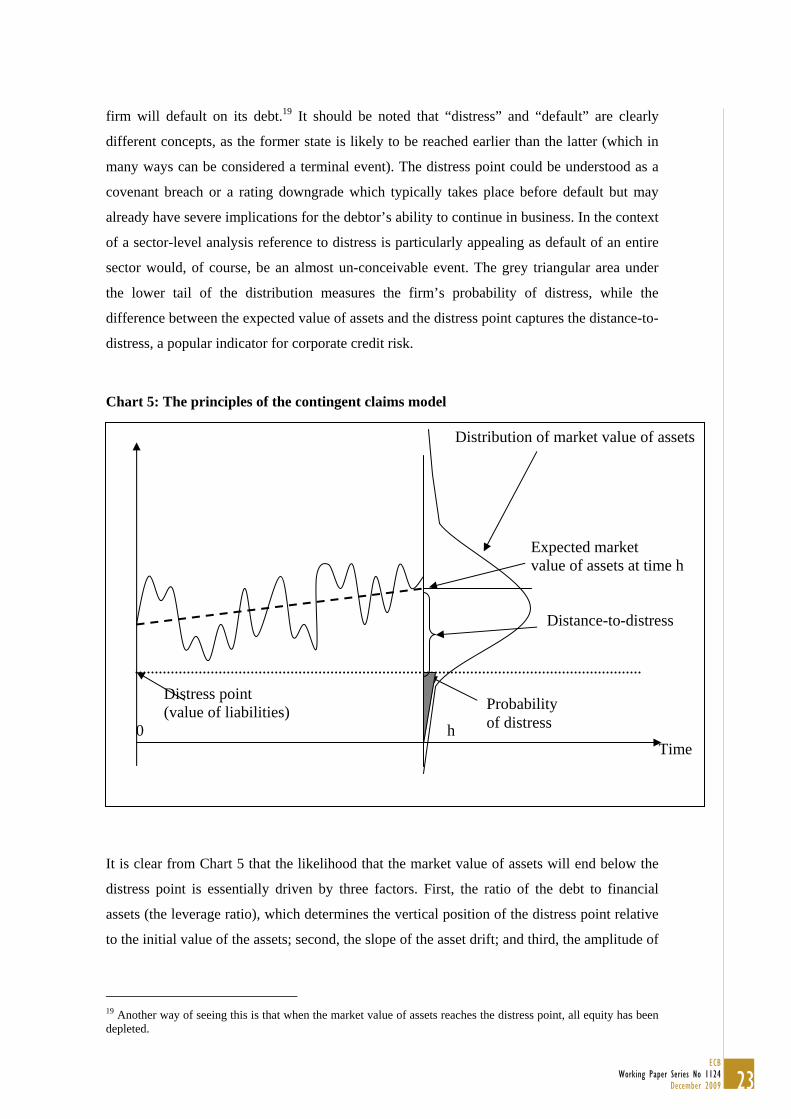
firm will default on its debt.19 It should be noted that “distress” and “default” are clearly
different concepts, as the former state is likely to be reached earlier than the latter (which in
many ways can be considered a terminal event). The distress point could be understood as a
covenant breach or a rating downgrade which typically takes place before default but may
already have severe implications for the debtor’s ability to continue in business. In the context
of a sector-level analysis reference to distress is particularly appealing as default of an entire
sector would, of course, be an almost un-conceivable event. The grey triangular area under
the lower tail of the distribution measures the firm’s probability of distress, while the
difference between the expected value of assets and the distress point captures the distance-to-
distress, a popular indicator for corporate credit risk.
Chart 5: The principles of the contingent claims model
It is clear from Chart 5 that the likelihood that the market value of assets will end below the
distress point is essentially driven by three factors. First, the ratio of the debt to financial
assets (the leverage ratio), which determines the vertical position of the distress point relative
to the initial value of the assets; second, the slope of the asset drift; and third, the amplitude of
19 Another way of seeing this is that when the market value of assets reaches the distress point, all equity has been depleted.
Distribution of market value of assets Expected market value of assets at time h
Distance-to-distress
Distress point (value of liabilities)
0 h Time
Probability of distress
23ECB
Working Paper Series No 1124December 2009

fluctuation of the market value of assets around the drift, which is measured by the expected
volatility of the asset.20
GMB (2007) take the firm-level CCA models to the financial system level by considering
interlinked market value balance sheets for the main sectors of the economy. Analytically, the
total market value of assets A of a sector equals the sum of the market values of its junior
claims J (mostly equity and net financial wealth) and debt D (other liability items):
PBJDJA −+=+= . (1)
In (1) the term P captures the expected loss that debt investors incorporate in the market value
of the sector’s debt and which draws a wedge between the book value (or accounting value)
of debt B and the market value of debt D. In CCA, the value of the junior claims J and the
expected loss on debt P are formulated in terms of implicit options whereby the value of a
sector’s junior claims resembles the value of a call option while the value of the expected loss
on its debt resembles the value of a put option. The market value of debt can then be written
to equal the default-free value, or book value, of debt minus the value of the put option.
The values of the implicit options can be solved under the assumptions that are required for
the Black and Scholes (1973) options pricing model, where the value of a sector’s assets over
time is modelled as a geometric Brownian motion process:
tttt dZAdtAdA σµ += (3)
The solution yields an expression for the implicit put option:
)()()(
))(())((
22
1
102
dNBeAdNdN
P
dNAdNBeP
rt
rt
−⎥⎦
⎤⎢⎣
⎡+
−−
−=⇒
−−−=
−
−
(4)
where
20 See e.g Crouhy, Galai and Mark (2001) who provide a generalised presentation of the original Merton (1974) analysis.
24ECBWorking Paper Series No 1124December 2009
t
tBA
dA
A
σ
σµ ⎟⎟
⎠
⎞⎜⎜⎝
⎛−+⎟
⎠⎞
⎜⎝⎛
=2
ln2
0
2 and tdd Aσ+= 21 . (5)
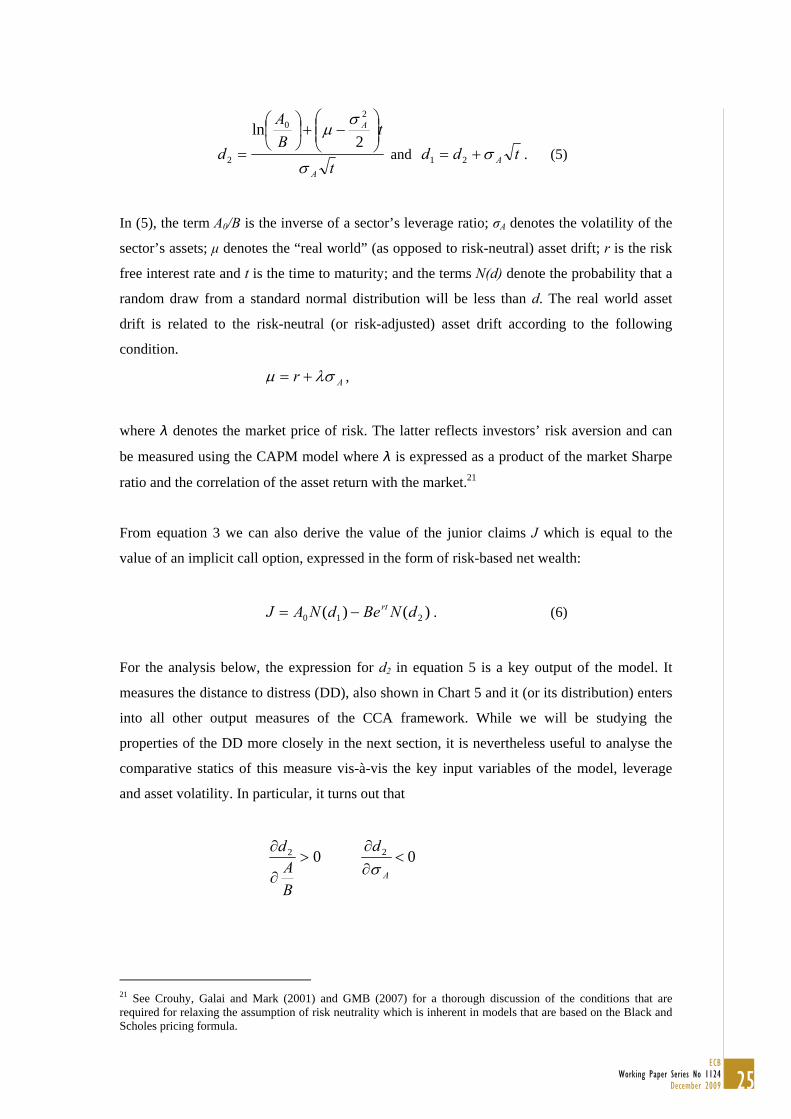
In (5), the term A0/B is the inverse of a sector’s leverage ratio; σA denotes the volatility of the
sector’s assets; µ denotes the “real world” (as opposed to risk-neutral) asset drift; r is the risk
free interest rate and t is the time to maturity; and the terms N(d) denote the probability that a
random draw from a standard normal distribution will be less than d. The real world asset
drift is related to the risk-neutral (or risk-adjusted) asset drift according to the following
condition.
Ar λσµ += ,
where λ denotes the market price of risk. The latter reflects investors’ risk aversion and can
be measured using the CAPM model where λ is expressed as a product of the market Sharpe
ratio and the correlation of the asset return with the market.21
From equation 3 we can also derive the value of the junior claims J which is equal to the
value of an implicit call option, expressed in the form of risk-based net wealth:
)()( 210 dNBedNAJ rt−= . (6)
For the analysis below, the expression for d2 in equation 5 is a key output of the model. It
measures the distance to distress (DD), also shown in Chart 5 and it (or its distribution) enters
into all other output measures of the CCA framework. While we will be studying the
properties of the DD more closely in the next section, it is nevertheless useful to analyse the
comparative statics of this measure vis-à-vis the key input variables of the model, leverage
and asset volatility. In particular, it turns out that
02 >∂
∂
BA
d 02 <
∂∂
A
dσ
21 See Crouhy, Galai and Mark (2001) and GMB (2007) for a thorough discussion of the conditions that are required for relaxing the assumption of risk neutrality which is inherent in models that are based on the Black and Scholes pricing formula.
25ECB
Working Paper Series No 1124December 2009
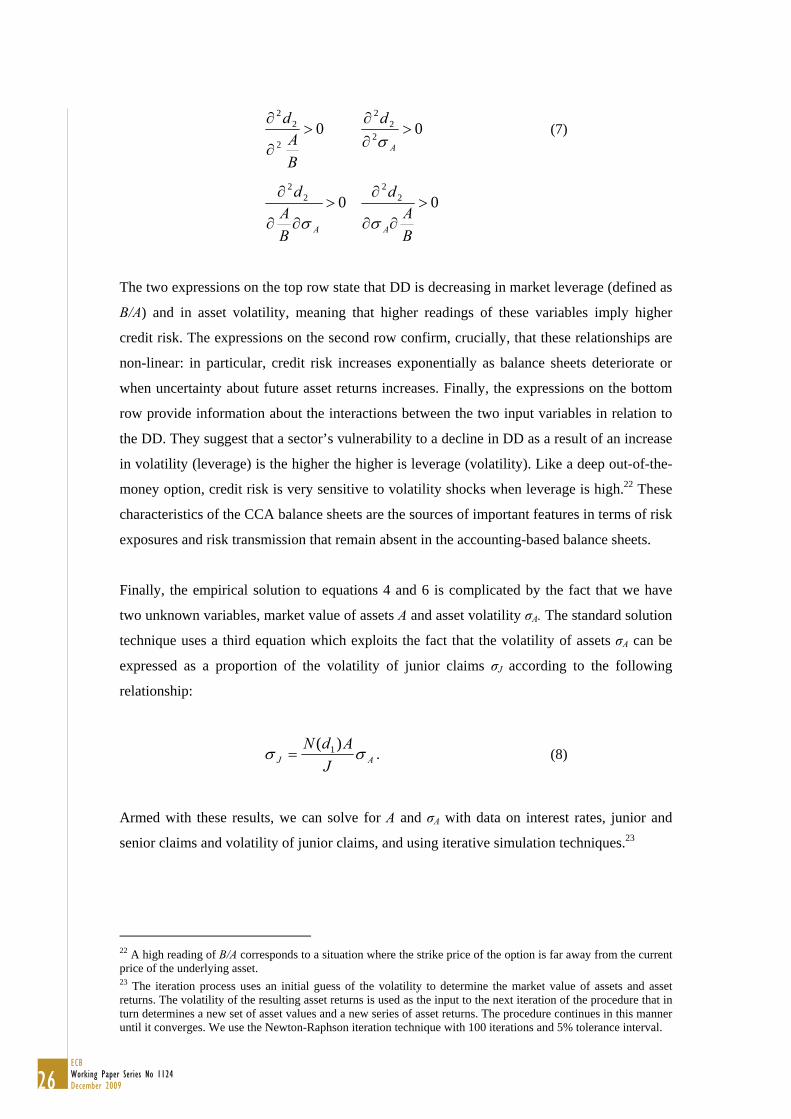
02
22
>∂
∂
BA
d 02
22
>∂∂
A
dσ
(7)
022
>∂∂
∂
ABA
d
σ 02
2
>∂∂
∂
BA
d
Aσ
The two expressions on the top row state that DD is decreasing in market leverage (defined as
B/A) and in asset volatility, meaning that higher readings of these variables imply higher
credit risk. The expressions on the second row confirm, crucially, that these relationships are
non-linear: in particular, credit risk increases exponentially as balance sheets deteriorate or
when uncertainty about future asset returns increases. Finally, the expressions on the bottom
row provide information about the interactions between the two input variables in relation to
the DD. They suggest that a sector’s vulnerability to a decline in DD as a result of an increase
in volatility (leverage) is the higher the higher is leverage (volatility). Like a deep out-of-the-
money option, credit risk is very sensitive to volatility shocks when leverage is high.22 These
characteristics of the CCA balance sheets are the sources of important features in terms of risk
exposures and risk transmission that remain absent in the accounting-based balance sheets.
Finally, the empirical solution to equations 4 and 6 is complicated by the fact that we have
two unknown variables, market value of assets A and asset volatility σA. The standard solution
technique uses a third equation which exploits the fact that the volatility of assets σA can be
expressed as a proportion of the volatility of junior claims σJ according to the following
relationship:
AJ JAdNσσ
)( 1= . (8)
Armed with these results, we can solve for A and σA with data on interest rates, junior and
senior claims and volatility of junior claims, and using iterative simulation techniques.23
22 A high reading of B/A corresponds to a situation where the strike price of the option is far away from the current price of the underlying asset. 23 The iteration process uses an initial guess of the volatility to determine the market value of assets and asset returns. The volatility of the resulting asset returns is used as the input to the next iteration of the procedure that in turn determines a new set of asset values and a new series of asset returns. The procedure continues in this manner until it converges. We use the Newton-Raphson iteration technique with 100 iterations and 5% tolerance interval.
26ECBWorking Paper Series No 1124December 2009
5.2. Estimation of sector-level risk indicators
When calculating the empirical sector-level indicators for risk exposures, two practical issues
needs to be considered. First, some sectors, notably households and government, do not issue
equity that would directly qualify as junior claims. For this reason we define the junior claims
as equity plus net financial wealth, both of which can be obtained from the EAA data and
which are illustrated in section 2 above. This means that for those sectors where net financial
wealth is negative, notably non-financial corporations, the junior claims are less than their
shareholder equity while for the household sector which issues no equity the junior claims are
solely represented by their net financial wealth. For the government sector, we follow GMB
(2007) who measure junior claims by government debt securities issued plus the (negative)
government net financial wealth position.24
Second, the value of the distress point B is not straightforward to define because debtors
typically re-organise the maturity structure of their debt when encountering credit problems.
The common solution in empirical CCA applications is to adopt the assumption that the
distress point amounts to short-term liabilities plus one half of long-term liabilities, which is
supported by empirical research based on large-scale statistical studies on historical defaults.
These issues are discussed in detail in Moody’s KMV (2002). In the current analysis, the
financial instruments that were classified as short-term liabilities are currency and deposits,
short-term loans and debt securities, derivatives instruments and other accounts and
receivables. Long-term liabilities include long-term debt securities and loans, mutual fund
shares, net equity of households in life insurance and pension fund reserves and pre-payments
of insurance premia.
Apart from the EEA balance sheet measures that are used to calculate the values of the junior
and senior claims, the data for volatility of junior claims, or σJ , for the different corporate
sectors (financial and non-financial) consists of 12-month implied volatilities of stock indices
obtained from Bloomberg. For the MFI and the insurance and pension funds sectors, the
implied volatilities of the relevant sector level stock indices were used while for the OFI
sector the implied volatility of the financial services sub-sector stock index was applied. For
the NFC sector, we calculated the average implied volatility using data from all individual
non-financial corporate sectors. For the government and the household sectors which issue no
equity we used the implied volatility of the German 10-year government bond yield and for
the RoW sector the implied volatility of the VIX stock index was adopted. Finally, following
GMB (2007) and Moody’s KMV (2002) we adopt the convention that λ, i.e. the market price 24 GMB (2007) argue that for emerging economies which often issue debt denominated both in domestic and in foreign currencies the foreign currency denominated part could be considered as the junior debt.
27ECB
Working Paper Series No 1124December 2009

of risk, is fixed at 0.45, which represents the global long-term average value as calculated by
Moody’s KMV.
The “intermediate” results from the CCA include the estimated market value of assets and
asset volatility. Chart 6 plots the sector-level market leverage for the euro area financial
system for the period 1999 Q1-2009 Q2, defined as book value of debt (the distress point)
divided by the estimated market value of assets. It can be seen that the market leverage of the
financial sectors (MFI, insurance and pension funds, and OFI sectors) is generally higher than
that of the other sectors which reflects the function of the former as financial intermediaries
and justifies the fact that they are supervised by government authorities. The leverage ratio of
the MFI sector is very stable over time. This is in line with the findings by Adrian and Shin
(2008) who show that banks tend to target constant levels of leverage.25 This implies that
banks are prone to expand their balance sheets by taking on more debt when the market value
of their assets goes up and quick to de-leverage when market value of their assets falls. For
the insurance and pension funds and the non-financial corporate sectors the leverage ratios are
clearly counter-cyclical as leverage increases “passively” with falls in market value of assets;
this was particularly pronounced in 2002-03 when the leverage of these sectors increased
sharply in the aftermath of the burst of the “new economy” stock market boom which had a
negative effect on the market value of their financial assets. The leverage of the household
sector is low as its financial liabilities are relatively minor compared to its financial assets (i.e.
its net financial wealth is high). For most sectors, market leverage picked up towards the end
of the period. The growth in leverage was first driven by increasing debt levels and later on by
falling market value of assets after the financial turmoil erupted in 2007 Q3. The increase in
leverage in the run-up to the crisis indicates that vulnerability to disturbances (i.e. future
volatility shocks) generally increased.
25 This can indeed be verified empirically for the euro area using our data and the results are available upon request.
28ECBWorking Paper Series No 1124December 2009
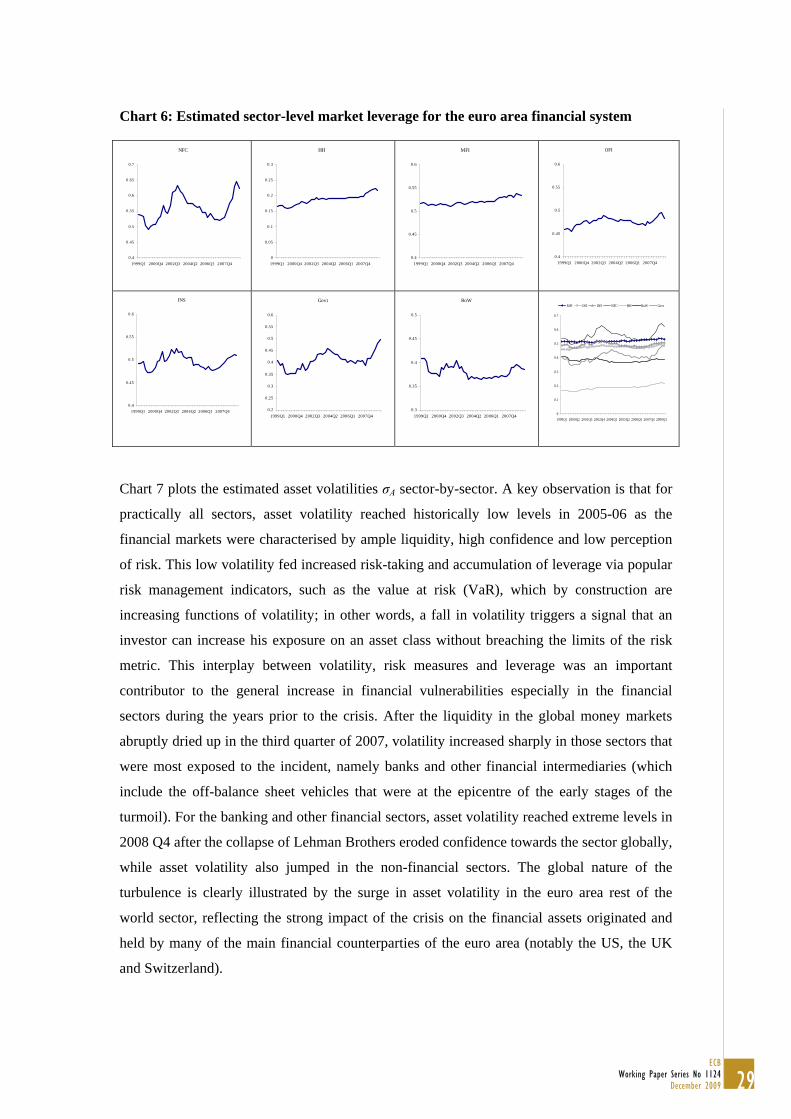
Chart 6: Estimated sector-level market leverage for the euro area financial system
NFC
0.4
0.45
0.5
0.55
0.6
0.65
0.7
1999Q1 2000Q4 2002Q3 2004Q2 2006Q1 2007Q4
HH
0
0.05
0.1
0.15
0.2
0.25
0.3
1999Q1 2000Q4 2002Q3 2004Q2 2006Q1 2007Q4
MFI
0.4
0.45
0.5
0.55
0.6
1999Q1 2000Q4 2002Q3 2004Q2 2006Q1 2007Q4
OFI
0.4
0.45
0.5
0.55
0.6
1999Q1 2000Q4 2002Q3 2004Q2 2006Q1 2007Q4
INS
0.4
0.45
0.5
0.55
0.6
1999Q1 2000Q4 2002Q3 2004Q2 2006Q1 2007Q4
Govt
0.2
0.25
0.3
0.35
0.4
0.45
0.5
0.55
0.6
1999Q1 2000Q4 2002Q3 2004Q2 2006Q1 2007Q4
RoW
0.3
0.35
0.4
0.45
0.5
1999Q1 2000Q4 2002Q3 2004Q2 2006Q1 2007Q4 0
0.1
0.2
0.3
0.4
0.5
0.6
0.7
1999Q1 2000Q2 2001Q3 2002Q4 2004Q1 2005Q2 2006Q3 2007Q4 2009Q1
MFI OFI INS NFC HH RoW Govt
Chart 7 plots the estimated asset volatilities σA sector-by-sector. A key observation is that for
practically all sectors, asset volatility reached historically low levels in 2005-06 as the
financial markets were characterised by ample liquidity, high confidence and low perception
of risk. This low volatility fed increased risk-taking and accumulation of leverage via popular
risk management indicators, such as the value at risk (VaR), which by construction are
increasing functions of volatility; in other words, a fall in volatility triggers a signal that an
investor can increase his exposure on an asset class without breaching the limits of the risk
metric. This interplay between volatility, risk measures and leverage was an important
contributor to the general increase in financial vulnerabilities especially in the financial
sectors during the years prior to the crisis. After the liquidity in the global money markets
abruptly dried up in the third quarter of 2007, volatility increased sharply in those sectors that
were most exposed to the incident, namely banks and other financial intermediaries (which
include the off-balance sheet vehicles that were at the epicentre of the early stages of the
turmoil). For the banking and other financial sectors, asset volatility reached extreme levels in
2008 Q4 after the collapse of Lehman Brothers eroded confidence towards the sector globally,
while asset volatility also jumped in the non-financial sectors. The global nature of the
turbulence is clearly illustrated by the surge in asset volatility in the euro area rest of the
world sector, reflecting the strong impact of the crisis on the financial assets originated and
held by many of the main financial counterparties of the euro area (notably the US, the UK
and Switzerland).
29ECB
Working Paper Series No 1124December 2009
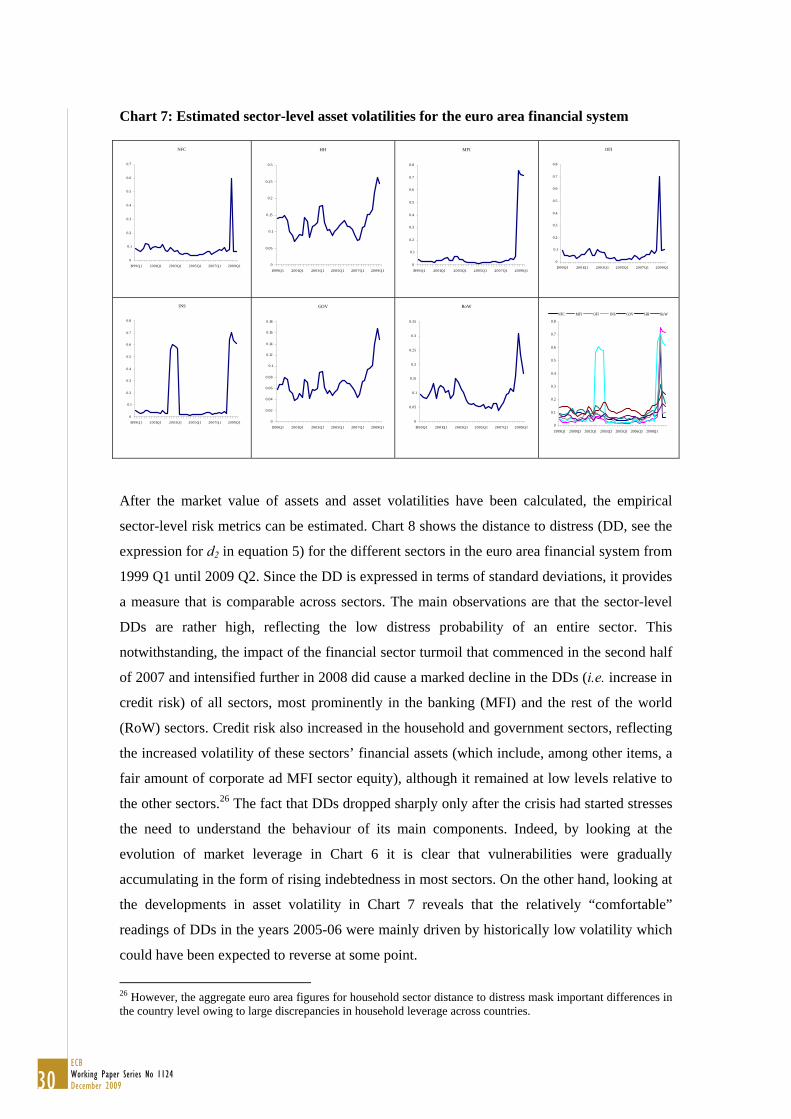
Chart 7: Estimated sector-level asset volatilities for the euro area financial system
NFC
0
0.1
0.2
0.3
0.4
0.5
0.6
0.7
1999Q1 2001Q1 2003Q1 2005Q1 2007Q1 2009Q1
HH
0
0.05
0.1
0.15
0.2
0.25
0.3
1999Q1 2001Q1 2003Q1 2005Q1 2007Q1 2009Q1
MFI
0
0.1
0.2
0.3
0.4
0.5
0.6
0.7
0.8
1999Q1 2001Q1 2003Q1 2005Q1 2007Q1 2009Q1
OFI
0
0.1
0.2
0.3
0.4
0.5
0.6
0.7
0.8
1999Q1 2001Q1 2003Q1 2005Q1 2007Q1 2009Q1
INS
0
0.1
0.2
0.3
0.4
0.5
0.6
0.7
0.8
1999Q1 2001Q1 2003Q1 2005Q1 2007Q1 2009Q1
GOV
0
0.02
0.04
0.06
0.08
0.1
0.12
0.14
0.16
0.18
1999Q1 2001Q1 2003Q1 2005Q1 2007Q1 2009Q1
RoW
0
0.05
0.1
0.15
0.2
0.25
0.3
0.35
1999Q1 2001Q1 2003Q1 2005Q1 2007Q1 2009Q1 0
0.1
0.2
0.3
0.4
0.5
0.6
0.7
0.8
1999Q1 2000Q3 2002Q1 2003Q3 2005Q1 2006Q3 2008Q1
NFC MFI OFI INS GOV HH RoW
After the market value of assets and asset volatilities have been calculated, the empirical
sector-level risk metrics can be estimated. Chart 8 shows the distance to distress (DD, see the
expression for d2 in equation 5) for the different sectors in the euro area financial system from
1999 Q1 until 2009 Q2. Since the DD is expressed in terms of standard deviations, it provides
a measure that is comparable across sectors. The main observations are that the sector-level
DDs are rather high, reflecting the low distress probability of an entire sector. This
notwithstanding, the impact of the financial sector turmoil that commenced in the second half
of 2007 and intensified further in 2008 did cause a marked decline in the DDs (i.e. increase in
credit risk) of all sectors, most prominently in the banking (MFI) and the rest of the world
(RoW) sectors. Credit risk also increased in the household and government sectors, reflecting
the increased volatility of these sectors’ financial assets (which include, among other items, a
fair amount of corporate ad MFI sector equity), although it remained at low levels relative to
the other sectors.26 The fact that DDs dropped sharply only after the crisis had started stresses
the need to understand the behaviour of its main components. Indeed, by looking at the
evolution of market leverage in Chart 6 it is clear that vulnerabilities were gradually
accumulating in the form of rising indebtedness in most sectors. On the other hand, looking at
the developments in asset volatility in Chart 7 reveals that the relatively “comfortable”
readings of DDs in the years 2005-06 were mainly driven by historically low volatility which
could have been expected to reverse at some point.
26 However, the aggregate euro area figures for household sector distance to distress mask important differences in the country level owing to large discrepancies in household leverage across countries.
30ECBWorking Paper Series No 1124December 2009
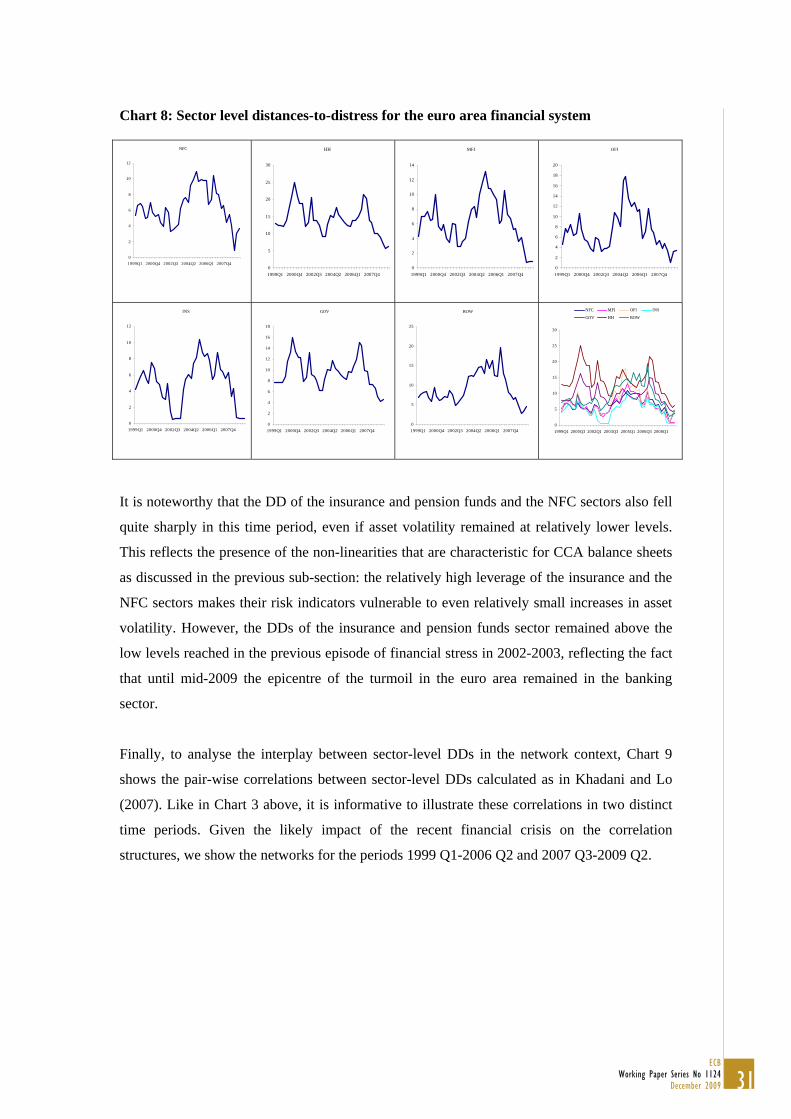
Chart 8: Sector level distances-to-distress for the euro area financial system
NFC
0
2
4
6
8
10
12
1999Q1 2000Q4 2002Q3 2004Q2 2006Q1 2007Q4
HH
0
5
10
15
20
25
30
1999Q1 2000Q4 2002Q3 2004Q2 2006Q1 2007Q4
MFI
0
2
4
6
8
10
12
14
1999Q1 2000Q4 2002Q3 2004Q2 2006Q1 2007Q4
OFI
0
2
4
6
8
10
12
14
16
18
20
1999Q1 2000Q4 2002Q3 2004Q2 2006Q1 2007Q4
INS
0
2
4
6
8
10
12
1999Q1 2000Q4 2002Q3 2004Q2 2006Q1 2007Q4
GOV
0
2
4
6
8
10
12
14
16
18
1999Q1 2000Q4 2002Q3 2004Q2 2006Q1 2007Q4
ROW
0
5
10
15
20
25
1999Q1 2000Q4 2002Q3 2004Q2 2006Q1 2007Q40
5
10
15
20
25
30
1999Q1 2000Q3 2002Q1 2003Q3 2005Q1 2006Q3 2008Q1
NFC MFI OFI INS
GOV HH ROW
It is noteworthy that the DD of the insurance and pension funds and the NFC sectors also fell
quite sharply in this time period, even if asset volatility remained at relatively lower levels.
This reflects the presence of the non-linearities that are characteristic for CCA balance sheets
as discussed in the previous sub-section: the relatively high leverage of the insurance and the
NFC sectors makes their risk indicators vulnerable to even relatively small increases in asset
volatility. However, the DDs of the insurance and pension funds sector remained above the
low levels reached in the previous episode of financial stress in 2002-2003, reflecting the fact
that until mid-2009 the epicentre of the turmoil in the euro area remained in the banking
sector.
Finally, to analyse the interplay between sector-level DDs in the network context, Chart 9
shows the pair-wise correlations between sector-level DDs calculated as in Khadani and Lo
(2007). Like in Chart 3 above, it is informative to illustrate these correlations in two distinct
time periods. Given the likely impact of the recent financial crisis on the correlation
structures, we show the networks for the periods 1999 Q1-2006 Q2 and 2007 Q3-2009 Q2.
31ECB
Working Paper Series No 1124December 2009

Chart 9: Pair-wise correlations among sector-level distance-to-distress measures in the
euro area financial system 1999-2006 and 2007-2008
2007-2008HH ROW
OFI NFC
MFI GOVT
INS
1999-2006HH ROW
OFI NFC
MFI GOVT
INS Note: The thickest line shows pair-wise correlations in excess of 0.75, the second thickest between 0.50
and 0.75, the thinnest between 0.25 and 0.50 and no line correlations less than 0.25 or negative.
The main finding is that the correlations between sector-level DDs increased dramatically
during the financial crisis, showing strong contagion of credit risk, where contagion is
understood as an increase in cross-sector correlations in crisis times relative to correlations
during tranquil times (see Gallegati et al, 2008). Prior to the crisis, the DDs were highly
correlated between the financial sectors and the NFC sector whilst the government, household
and the RoW sectors showed lower correlations. The fact that the pair-wise correlation
between the household and government sectors nevertheless was high is interesting given the
weak balance sheet linkage between the two sectors as shown in Chart 3. This confirms that
correlation in risk exposures does not necessary require the existence of direct bilateral links,
but exposures to similar types of assets (in this case mostly cash, corporate equity and debt
instruments) would also be sufficient. During the crisis period, correlations in credit risk
32ECBWorking Paper Series No 1124December 2009
among all sectors surged. The fact that credit risk became highly correlated across sectors
implies that additional shocks to any one sector would have had the potential to induce
instantaneous increases in credit risk in all other sectors.27
An additional feature of the CCA balance sheets is that they include contingent liabilities in
the form of implicit guarantees that may be extended by some sectors to others. GMB (2007)
look at the particular case where the government sector provides an implicit guarantee for the
financial sectors by underwriting a share of the expected losses (essentially, by taking a
fraction of the put option on its balance sheet). Given the large-scale commitments by euro
area governments to provide financial support for the banking sector that were announced in
2008 Q4, some of these implicit guarantees may in fact have become explicit. We leave the
exercise to assess the implications of these measures on the sector-level risk indicators for
future work once the data for the full year 2009 will have become available.
5.3. Shocks in the risk-based network of bilateral exposures
Once the sector-level risk measures have been derived, we bring back to the picture the
network of bilateral balance sheet exposures. To this end, we exploit the fact that the CCA
balance sheets fully encompass the accounting-based network. We will first use the
propagation from the NFC cash flow shock scenario that was illustrated in section 4 and see
how contagion across balance sheet items affects the risk exposures of sectors that were not
directly hit by the initial shock. In the second stage we compare the risk-based network of
bilateral exposures to the accounting-based network and see how the market values of the
bilateral links might change when the risk exposures change as a response to volatility shocks.
As regards the first point, since the sector-level accounting items that enter the CCA
calculations are exposed to disturbances which may originate from balance sheet counterparty
exposures to other sectors, also the risk indicators in the CCA balance sheets should change as
a result. In addition, when the financial system is confronted by a shock, it is typically the
case that asset volatility increases. Table 3 shows the changes in the sector-level distances of
distress – as derived above in Chart 8 – as a result of the non-financial corporate sector P&L
shock that was considered above in section 4. In addition to the equity shocks from Table 2
which affect the value of the junior claims in the CCA balance sheets we also assume that the
volatility of junior claims increases by 500 basis points across all sectors.
27 Adrian and Brunnermeier (2009) study the co-movements of firm-level value at risk measures during episodes of distress using common factor analysis and extreme value theory (EVT). While EVT would provide an obvious improvement to the correlation analysis above, given the relatively short time series and the quarterly frequency of the balance sheet data, at the current stage our data set does not contain enough observations for such an analysis.
33ECB
Working Paper Series No 1124December 2009

Table 3: Decline in distance-to-distress as a result of a combined balance sheet and
volatility shock, 2009 Q2
In standard deviations In %
NFC 0.58 16HH 1.7 20.11MFI 0.39 5.62OFI 0.19 3.4INS 1.46 39GOVT 4.04 12.99ROW 0.51 12.13
Decline in distance to distress
A shock that was assumed to crystallise in 2009 Q2 would have caused the sector-level DDs
to decrease between 3% and 40% in the financial sectors and between 12% and 20% in the
non-financial sectors from the true levels at 2009 Q2. The very large percentage decline in the
insurance and pension funds sector DD reflects the fact that its DD was among the lowest in
the baseline (i.e. a relatively minor absolute decline in DD causes a large % drop when the
decline takes place from a low level) and also the fact that, together with the NFC sector, its
market leverage was the highest, i.e. it was particularly vulnerable to additional shocks. This
again demonstrates the non-linear nature of the risk exposures in that the more vulnerable
sectors in terms of balance-sheet leverage tend to show the largest jumps in risk measures.
In terms of stability of the network of bilateral exposures, these non-linearities in risk
exposures provide an important link to a common feature in network models, the so called
“knife edge” property. This property states that beyond a certain tipping point, the
interconnections in the networks that in normal times work as shock absorbers may turn to
shock amplifiers, spreading rather than sharing the risk. In the context of financial networks
Allen and Gale (2000) and Gallegati et al (2008) argue that due to this characteristic, risk
sharing that is achieved in networks might be beneficial only when the overall economic
environment is favourable but can turn detrimental when the economic environment turns
bad. Haldane (2009) argues that in certain states, events that per se may be of relatively
modest economic importance – such as the US sub-prime mortgage crisis – may be sufficient
to take the system beyond its tipping point. Analysis of risk-based networks provide an
indication of how this might happen, as gradually accumulating leverage in some sectors
pushes the implicit options further out-of-the-money and increases these sectors’ vulnerability
34ECBWorking Paper Series No 1124December 2009

to shocks elsewhere in the system that manifest themselves in a general surge in volatility and
may cause large jumps in risk measures.
As regards the second point, to analyse in detail the transmission of risk along the network of
exposures would require calculation of indicators of bilateral risk exposures. However, this is
not feasible using the CCA approach because there is no reason why a sector (say, NFC)
would issue both equity and debt to another specific sector (say, MFI), which would be
required to calculate the market value of the “bilateral assets” between the two sectors.
However, we can approximate the risk-based bilateral exposures by using the “re-payment
probabilities”, or RPPs, defined as 1 minus probability of default (see Shin, 2008, who uses
the concept of “realised re-payment” which in his model is a fraction of the book value of
assets). Then, each accounting-based asset item held by sector i would be multiplied by the
RPP of sector j that issued the instrument.28 Since the RPPs are sensitive to changes in
volatility, the approximated risk-based values of the gross exposures that form the bilateral
links between the sectors can be subjected to scenarios that involve volatility shocks. As
discussed above, it is a feature of CCA models that the sensitivity of the PDs and the RPPs to
volatility changes is highly non-linear and large volatility shocks are thus likely to have
potentially even larger impacts on the risk-based values of the bilateral exposures.
Using data on 2008 Q2, table 4 illustrates the “heat map” of changes in RPP-weighed gross
bilateral exposures in a scenario where asset volatility of all sectors is assumed to jump to
30%. This volatility increase would cause an increase in PDs and a fall in RPPs, causing a
drop in the risk-based value of the bilateral exposures (shown in euro terms in panel (i) and in
terms of percentage losses relative to the sizes of the unconditional risk-based exposures in
panel (ii) of Table 4). The rows in Table 4 show the decline in other sectors’ risk-based assets
as a result of a fall in a given sector’s RPP while the columns illustrate the losses in value of
the various bilateral gross exposures of a given sector, as a result of the fall in RPP of each of
the counterparties to its financial assets. Note that even after the large jump in volatility, the
RPPs of the household and government sectors remain close to one; hence there is no change
(loss) in risk-based exposures in any other sector in the system from its exposure to these two
sectors.
28 Following Shin (2008), for simplicity, we assume that all debt is of equal seniority. In practice, the seniority structure should affect the RPPs on the various instruments on the liability side.
35ECB
Working Paper Series No 1124December 2009

Table 4: Losses in risk-based bilateral gross exposures after a volatility shock, 2008 Q2
(i) In millions of EUR
NFC HH MFI INS OFI GOV ROWNFC 1,504,160 520,027 1,758,058 249,124 738,606 235,923 647,099HH 2 0 11 0 2 0 1MFI 598,816 1,084,040 735,112 304,805 441,841 167,498 1,003,149INS 247,056 2,466,417 131,588 104,098 67,476 32,108 171,284OFI 136,622 182,620 264,830 160,088 141,697 17,820 331,530
GOV 5 6 26 10 10 2 16ROW 36,588 29,552 55,192 15,234 26,256 7,154 38,587Total 2,523,250 4,282,664 2,944,818 833,358 1,415,887 460,506 2,191,666
(ii) In % from original exposures
NFC HH MFI INS OFI GOV ROWNFC 14 22 21 20 23 21 15HH 0 0 0 0 0 0 0MFI 6 12 10 19 11 5 12INS 20 98 7 34 5 3 14OFI 4 10 6 13 7 2 8
GOV 0 0 0 0 0 0 0ROW 1 1 1 1 1 0 1
Average 6 20 6 13 7 4 7 Note: The rows show the impact on other sectors of a volatility shock assigned to the sector named on
the left cell. The columns measure the impact on the sector named on the top cell of a volatility shock
assigned on the other sectors. The darkest cells denote the highest impacts within the sample.
A key observation is that the results are rather asymmetric in the sense that the impact that a
shock on sector i has on its exposure to sector j is different in size than the impact that a shock
on sector j has on its exposure to sector i, reflecting the differences in sector-specific RPPs. In
absolute (EUR) terms, the largest losses appear in the risk-based exposures vis-à-vis the NFC
and MFI sectors (the first and third rows in panel (i)). The sectors that suffer the overall
largest monetary losses from the reduced RPPs of other sectors are the HH and the MFI
sectors, reflecting the large financial asset holdings by these sectors in the euro area financial
system (the second and third columns of panel (i)). However, the largest proportional drop in
risk-based values takes place in exposures vis-à-vis the insurance and pension funds and the
NFC sectors, as reported on rows 1 and 4 of Table 4 (ii), respectively. This reflects the above
observed fact that due to their high leverage and balance sheet vulnerability, the NFC and the
insurance and pension funds sectors’ RPPs are particularly sensitive to volatility shocks.
36ECBWorking Paper Series No 1124December 2009
Mainly owing to the large fall in value of its bilateral exposure to the insurance and pension
funds sector, the household sector suffers the largest average loss in risk-based exposures also
in relative terms, as shown in the second column of Table 4 (ii). However, this result would
almost certainly change if the exposures were weighted in terms of seniority, as a large share
of the household sector’s bilateral exposures to the insurance sector consists of senior debt
instruments, such as net equity in insurance and pension funds reserves and pre-payments of
insurance premia.
7. Concluding remarks The financial crisis that erupted in August 2007 has highlighted the need for tools that can
analyse risks and vulnerabilities in financial systems in a holistic way. While regular and
detailed analysis of the main sectors of the financial system is necessary for identification of
developments that may threaten financial stability, it is clearly not sufficient. Modelling the
interlinkages between the sectors is equally important as this aims at revealing the channels
through which local shocks can propagate wider in financial systems.
The network of bilateral sector-level financial exposures that is proposed in this paper takes a
step to that direction. By acknowledging the suitability of the sector-level flow of funds
accounts for the purposes of modelling financial networks, we highlighted the overall
expansion in volume of bilateral exposures over the first ten years of the Economic and
Monetary Union and the important role of the banking sector in the network of exposures. We
also showed how the transmission of shocks takes place under mark-to-market accounting via
the balance sheet cross-exposures that exist in the euro area financial system.
An important limitation of the analysis that uses such accounting-based data is that little can
be said about the accumulation and transmission of risk in the system. To address this issue,
we extended the model by applying the contingent claims approach to sector-level balance
sheets. By so doing we were able to unearth important interactions between volatility and
leverage, which form key ingredients of any financial stability analysis. In particular, in
simulation exercises we illustrated how risk exposures of sectors which show high balance
sheet leverage are particularly vulnerable to sudden increases in volatility. Moreover, the
strong non-linearities which are characteristic for options-based contingent claims models
turned out to play an important role in amplifying the interactions between the risks and
vulnerabilities in the risk-based network of exposures.
There are numerous avenues for future research applying network models in the area of
financial stability and macro-prudential analysis. Provided that more data on bilateral
exposures at different levels of granularity will become available in the future, the
37ECB
Working Paper Series No 1124December 2009
interlinkages and channels of risk transmission between agents in the financial system can be
better modelled and understood. In addition, further progress in modelling endogenous
responses to shocks and resulting balance sheet adjustments at the sector level is necessary.
Such work would also provide important inputs to modelling the feedback mechanisms
between the real and the financial sectors of the economy, an area of growing interest in
monetary policy and macroeconomic analysis. Above all, additional research efforts along the
lines proposed in this paper would enhance the tools and models for financial stability
analysis and improve the content and accuracy of macro-prudential policy recommendations.
38ECBWorking Paper Series No 1124December 2009

References
Acharaya, V. and L. Pedersen (2005): “Asset Pricing with Liquidity Risk”, Journal of
Financial Economics 77
Adrian, T. and H. S. Shin (2008): “Liquidity and Financial Contagion”, Banque de France
Financial Stability Review No 11
Adrian and Brunnermeier (2009): “CoVaR”, Mimeo, Federal Reserve Bank of New York and
Princeton University
Allen, F. and D. Gale (2000): “Financial Contagion”, Journal of Political Economy 108
Becher, C., S. Millard and K. Soramäki (2008): “The Network Topology of CHAPS
Sterling”, Bank of England Working Paper No 355
Black, S. and M. Scholes (1973): “The Pricing of Corporate Options and Liabilities”, Journal
of Political Economy 81
Borio, C. and M. Drehmann (2009): “Towards an Operational Framework for Financial
Stability: “Fuzzy” Measurement and its Consequences”, BIS Working Papers 284
Brunnermeier, M. and L. Pedersen (2009): “Market Liquidity and Funding Liquidity” Review
of Financial Studies 22
Castrén, O., J. Fell and N. Valckx (2009): “Cross-Border Macro Stress-Testing: Progress and
Future Challenges for the EU”, In: Quadriagiello, M: (ed.): “Stress-testing the Banking
System”, Cabridge University Press
Castrén, O., T. Fitzpatrick and M. Sydow (2009): “Assessing Portfolio Credit Risks Changes
in a Sample of EU Large and Complex Banking Groups in Reaction to Macroeconomic
Shocks”, ECB Working Paper 1002
Cihac, M. (2008): “Introduction to Applied Stress-Testing”, IMF Working Paper 07/59
Crouhy, M., D. Galai and R. Mark (2001): “Risk Management”, McGraw Hill, New York
De Larosiere, J. (2009): “Report”, The High-level Group of Financial Supervision In the EU.
Duffie, D., N. Garlenau and L. Pedersen (2007): “Valuation in Over-the-Counter Markets”,
Review of Financial Studies, 20
ECB (2009): “Balance Sheet Contagion and Transmission of Risk in the Euro Area Financial
System” Special Feature Article C in Financial Stability Review, June 2009
European System of Accounts 1995 (ESA95), Council (EC) Regulation No 2223/96 of 25
June 1996 on the European system of national and regional accounts in the Community,
Official Journal of the European Union L 310/1-469
Eurostat Manual of Supply, Use and Input-Output Tables, Eurostat methodologies and
working papers, European Communities 2008
Gallegati, M, B. Greenwald, M. Richiardi and J. Stiglitz (2008): The Asymmetric Effect of
Diffusion Processes: Risk Sharing and Contagion, Global Economy Journal 8
39ECB
Working Paper Series No 1124December 2009

Goodhart, C. (2006): “A Framework for Assessing Financial Stability?”, Journal of Banking
and Finance 30
Guideline of the European Central Bank on the Statistical Reporting Requirements of the
European Central Bank in the Field of Quarterly Financial Accounts, as amended
(ECB/2002/7), of 21 November 2002
Gray, D., R. Merton and Z. Bodie (2007): “New Framework for Measuring and Managing
Macrofinancial Risk and Financial Stability”, NBER Working Paper N0 13607
Gray, D. and S. Malone (2008): “Macrofinancial Risk Analysis”, Wiley Finance, UK
Haldane, A. (2009): “Rethinking the Financial Network”, Speech delivered at the Financial
Student Association, Amsterdam
Khandani, A. and A. Lo (2007): “What Happened to the Quants in August 2007?”, Journal of
Investment Management 5
Kiyotaki, N. and J. Moore, (1997): “Credit Cycles”, Journal of Political Economy 105
Kiyotaki, N. and J. Moore, (2002): “Balance Sheet Contagion”, American Economic Review
92
McGuire, P. and N. Tarashev (2008): “Global Monitoring with the BIS Banking Statistics”,
BIS Working Paper 244
Merton, R. (1974): “On the Pricing of Corporate Debt: the Term Structure of Interest Rates”
Journal of Finance 29
Moody’s KMV (2002): “Modelling Default Risk”, San Francisco, Ca. KMV LLC.
Mueller, J (2006): “Interbank Credit Lines as a Channel of Contagion”, Journal of Financial
Services Research 29
Shin, H. S. (2008): Risk and Liquidity in a Systemic Context, Journal of Financial
Intermediation
System of National Accounts 1993 (SNA93), Commission of the European Communities,
International Monetary Fund, United Nations, World Bank, Brussels/Luxembourg, New
York, Paris, Washington D.C., 1993.
Upper, C. and A. Worms (2004): “Estimating Bilateral Exposures in the German Interbank
Market: is There a Danger of Contagion?” European Economic Review
van Lelyveld, I. and F. Liedorp (2005): “Interbank Contagion in the Dutch Banking Sector: a
Sensitivity Analysis”, International Journal of Central Banking
Watts, D (2004): “The “New” Science of Networks”, Annual Review of Sociology 30.
Wells, S. (2004): “Financial Interlinkages in the UK Interbank Market and the Risk of
Contagion,” Bank of England Working Paper 230.
40ECBWorking Paper Series No 1124December 2009
Ann
ex 1
: The
tabl
e ill
ustra
tes
the
linka
ges
betw
een
finan
cial
(th
e fin
anci
al m
arke
ts)
and
non-
finan
cial
acc
ount
s (th
e re
al e
cono
my)
. Thu
s, th
e ta
ble
show
s ho
w d
iffer
ent
shoc
ks t
o an
eco
nom
y ar
e tra
nsm
itted
bet
wee
n an
d w
ithin
the
sec
tors
in
the
sect
or a
ccou
nts’
fra
mew
ork.
The
tab
le c
an b
e un
ders
tood
as
illus
tratin
g ei
ther
one
sec
tor o
r alte
rnat
ivel
y th
e w
hole
dom
estic
eco
nom
y. It
is, t
here
fore
, im
porta
nt to
not
ice
that
the
bala
nces
of i
ndiv
idua
l tra
nsac
tions
as
wel
l bal
anci
ng it
ems
like
savi
ng, n
et le
ndin
g/bo
rrow
ing
or a
s a
stoc
k ne
t wea
lth a
re z
ero
whe
n th
e to
tal d
omes
tic a
nd e
xter
nal e
cono
my
are
adde
d up
. Thi
s ru
le a
lso
clos
es th
e sy
stem
- to
put
it si
mpl
y: e
very
rece
ived
tran
sact
ion
has t
o be
pai
d by
som
ebod
y, i.
e. th
ere
has t
o be
a c
ount
er-p
art f
or e
ach
trans
actio
n.
Th
e da
shed
lin
e in
the
mid
dle
of t
he t
able
div
ides
fin
anci
al a
nd n
on-f
inan
cial
eco
nom
y. T
he l
inki
ng t
rans
actio
n be
twee
n th
ese
two
is n
et
lend
ing/
borr
owin
g. A
s m
entio
ned
abov
e, a
t the
sys
tem
leve
l net
lend
ing/
borr
owin
g is
by
defin
ition
zer
o bu
t ind
ivid
ual s
ecto
rs c
an h
ave
eith
er p
ositi
ve o
r ne
gativ
e ne
t len
ding
/bor
row
ing
posi
tions
. The
re a
re tw
o pe
rspe
ctiv
es to
inte
rpre
t thi
s ba
lanc
ing
item
: eith
er it
indi
cate
s ho
w m
uch
a se
ctor
has
mon
ey le
ft af
ter
inve
stin
g in
pro
duct
ion
from
sav
ing
to f
inan
ce t
he a
ctiv
ities
of
othe
r se
ctor
s or
, al
tern
ativ
ely,
wha
t th
e se
ctor
’s n
et f
inan
cial
flo
ws
are.
Bot
h in
terp
reta
tions
are
cor
rect
and
lead
to th
e sa
me
resu
lt.
Th
e ye
llow
box
es i
n th
e ta
ble
are
stoc
ks.
As
indi
cate
d al
read
y in
the
arti
cle,
thi
s an
alys
is i
nclu
des
only
fin
anci
al s
tock
s. T h
e ne
t w
ealth
is
the
diff
eren
ce b
etw
een
the
asse
t and
liab
ility
st o
ck, i
.e. i
t can
als
o be
see
n as
an
accu
mul
ated
net
lend
ing/
borr
owin
g, w
hich
has
bee
n af
fect
ed b
y th
e re
lativ
e pr
ice
chan
ges o
f sto
cks.
This
is a
lso
the
linka
ge to
the
real
eco
nom
y - v
ia n
et le
ndin
g/bo
rrow
ing
sect
ors e
ither
get
fina
ncin
g fo
r the
ir ow
n re
al e
cono
my
activ
ities
or
finan
ce o
ther
sect
ors.
The
net w
ealth
is a
lso
at th
e sy
stem
leve
l zer
o.
As c
an b
e se
en fr
om th
e ta
ble
ther
e ar
e al
so n
on-f
inan
cial
stoc
ks, i
.e. f
ixed
cap
ital s
tock
s. Th
ese
incl
ude
diff
eren
t kin
d of
bui
ldin
gs li
ke d
wel
lings
and
in
dust
rial b
uild
ings
but
als
o fo
r ins
tanc
e m
achi
nes,
whi
ch a
re u
sed
in a
pro
duct
ion
proc
ess.
Non
-fin
anci
al s
tock
s ar
e no
t inc
lude
d in
this
ana
lysi
s as
thes
e ar
e cu
rren
tly n
ot a
vaila
ble
at q
uarte
rly b
asis
. Thi
s na
tura
lly m
akes
a c
onsi
dera
ble
diff
eren
ce e
spec
ially
for
sec
tors
like
hou
seho
l ds,
whi
ch h
ave
a la
rge
part
of
thei
r pro
perty
in d
wel
lings
. How
ever
, it s
houl
d al
so b
e no
ted
that
the
natu
re o
f non
-fin
anci
al p
rope
rty is
con
side
rabl
y di
ffer
e nt t
o th
e fin
anci
al p
rope
rty. I
n th
e ca
se o
f fin
anci
al p
rope
rty a
sect
or e
ither
bor
row
s mon
ey fr
om o
ther
sect
or o
r len
ds m
oney
to o
ther
sect
or a
nd th
us, t
he tr
ansa
c tio
n al
way
s has
a c
ount
er-p
arty
. Fo
r the
bor
row
er, f
inan
cial
pro
perty
is a
lso
ofte
n a
pure
fina
ncia
l inv
estm
ent a
nd h
e/s h
e do
es n
ot e
xpec
t thi
s to
crea
te a
ny a
dditi
onal
serv
ice
flow
. N
on-f
inan
cial
wea
lth is
not
by
defin
ition
cou
nter
-par
tied
and
ther
efor
e, it
als
o do
es n
ot h
ave
any
dire
ct li
nkag
e to
oth
er s
ecto
rs. A
dditi
onal
ly, n
on-
finan
cial
wea
lth i
s ex
pect
ed t
o pr
ovid
e so
me
kind
of
serv
ice
fl ow
- e
ither
as
a co
mpo
nent
of
a pr
oduc
tion
proc
ess
or b
y pr
ovid
ing
hous
ing
serv
ices
for
ho
useh
olds
(whi
ch is
act
ually
als
o un
ders
tood
as
a pr
oduc
tion
proc
ess
in th
e na
tiona
l acc
ount
s). T
here
fore
, non
-fin
anci
a l w
ealt h
can
be
assu
med
to w
ork
as a
ce
rtain
kin
d bu
ffer
of t
he w
ealth
, and
sin
ce it
is a
ctua
lly n
eede
d fo
r pro
duct
ion
purp
oses
its
valu
e do
es n
ot n
eces
saril
y ch
ange
as
freq
uent
ly a
s th
e va
lue
of
finan
cial
inst
rum
ents
.
41ECB
Working Paper Series No 1124December 2009
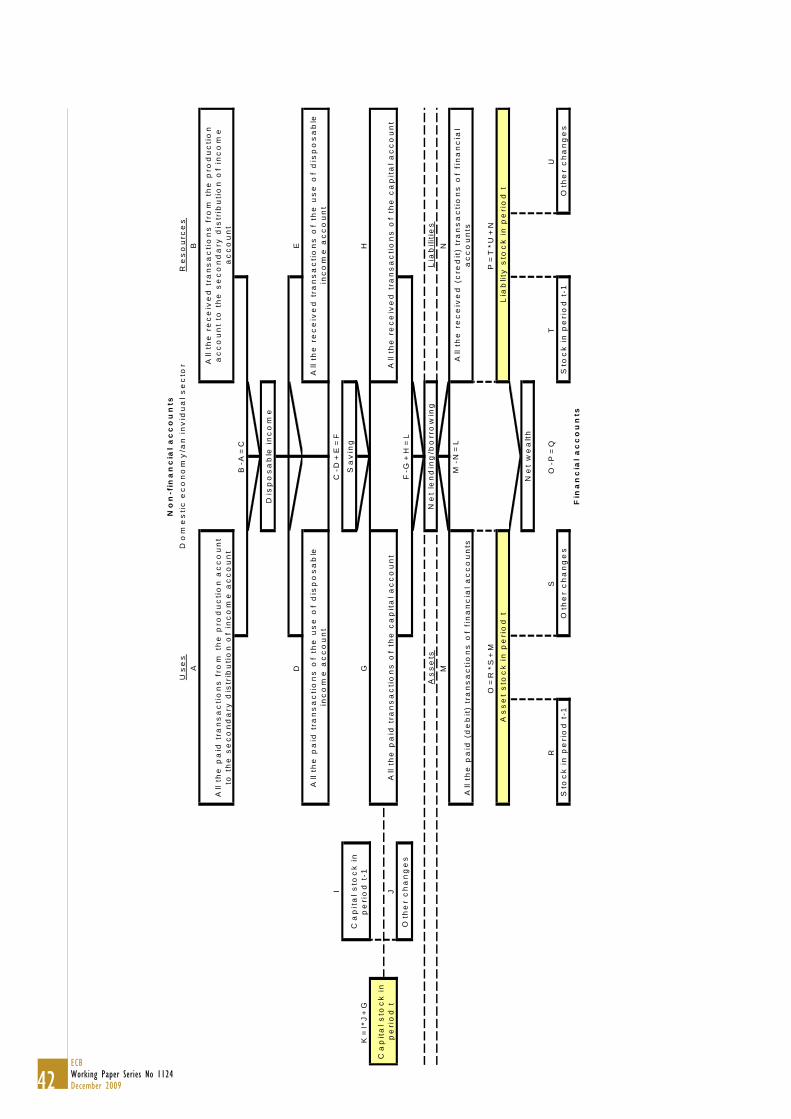
Us
es
Re
so
ur c
es
AB
DE
I
K=
I*J
+G
GH
J
Oth
er
ch
an
ge
s
As
se
tsL
iab
iliti
es
MN
O=
R*S
+M
P=
T*U
+N
RS
TU
Sto
ck
in
pe
rio
d t
-1O
the
r c
ha
ng
es
Sto
ck
in p
eri
od
t-1
Oth
er
ch
an
ge
s
All
the
re
ce
ive
d (
cre
dit
) tr
an
sa
cti
on
s o
f fi
na
nc
ial
ac
co
un
ts
Fin
an
cia
l a
cc
ou
nts
Ne
t w
ea
lth
O-P
=Q
No
n- f
i na
nc
i al
ac
co
un
t s
Al l
t he
pa
i d t
r an
sa
ct i
on
s o
f t h
e u
se
of
di s
po
sa
bl e
i n
co
me
ac
co
un
tA
l l t h
e r
ec
ei v
ed
tr a
ns
ac
t io
ns
of
t he
us
e o
f d
i sp
os
ab
l e
i nc
om
e a
cc
ou
nt
C- D
+E
=F
Ca
pit
al
sto
ck
in
p
eri
od
t
Ca
pit
al
sto
ck
in
p
eri
od
t-1
All
t he
pa
id t
r an
sa
ct i
on
s f
r om
th
e p
r od
uc
t io
n a
cc
ou
nt
t o t
he
se
co
nd
ar y
di s
t ri b
ut i
on
of
i nc
om
e a
cc
ou
nt
All
the
pa
id t
ran
sa
cti
on
s o
f th
e c
ap
ita
l a
cc
ou
nt
All
t he
re
ce
ive
d t
r an
sa
ct i
on
s f
r om
th
e p
r od
uc
t io
n
ac
co
un
t t o
th
e s
ec
on
da
r y d
ist r
ibu
t io
n o
f in
co
me
a
cc
ou
nt
B- A
=C
Di s
po
sa
bl e
in
co
me
Lia
blit
y s
toc
k i
n p
eri
od
t
M-N
=L
All
the
re
ce
ive
d t
ran
sa
cti
on
s o
f th
e c
ap
ita
l a
cc
ou
nt
Do
me
st i
c e
co
no
my
/ an
in
vi d
ua
l se
ct o
r
All
the
pa
id (
de
bit
) tr
an
sa
cti
on
s o
f fi
na
nc
ial
ac
co
un
ts
As
se
t s
toc
k i
n p
eri
od
t
Ne
t le
nd
ing
/bo
rro
win
g
F-G
+H
=L
Sa
vin
g
42ECBWorking Paper Series No 1124December 2009

Annex 2: Estimated instrument-specific bilateral exposures, 2009 Q2
NFC assets
0%
10%
20%
30%
40%
50%
60%
70%
80%
90%
100%
Currency andd ep os its
Sho rt-termdeb t
securit ies
Lo ng-termd eb t
securit ies
Short-termlo ans
Long -termlo ans
Quoted andunq uo ted
shares
Mutual fundshares
Otheracco unts
NFC HH MFI INS OFI GOV ROW
NFC liabilities
0%
10%
20%
30%
40%
50%
60%
70%
80%
90%
100%
Currency andd ep o sits
Sho rt-termd eb t s ecurit ies
Lo ng -termd eb t securit ies
Sho rt-termlo ans
Long-termlo ans
Quo ted andunq uo ted
shares
Net eq uity o fho useho ld s inlife insurance
reserves
Otheraccounts
NFC HH MFI INS OFI GOV ROW
Household assets
0%
20%
40%
60%
80%
100%
Currencyand
d epo s its
Short-termdeb t
securit ies
Lo ng-termd ebt
securit ies
Short-termlo ans
Lo ng-termloans
Quoted andunquo ted
shares
Mutual fundshares
Net equityof
ho useho ld sin life
insurancereserves
Prep aymentso f insurance
p remiums
Otheraccounts
NFC HH MFI INS OFI GOV ROW
Household l iabil ities
0%
10%
20%
30%
40%
50%
60%
70%
80%
90%
100%
S hort -t e rm loans Long-t e rm loans Net e quit y of house holds in lifeinsura nce re se rve s
Ot he r ac c ount s
NFC HH MFI INS OFI GOV ROW
MFI assets
0%
20%
40%
60%
80%
100%
Currency andd ep os its
Sho rt -termd eb t
securit ies
Lo ng -termdeb t
securit ies
Sho rt -termlo ans
Lo ng -termloans
Quo ted andunq uo ted
shares
Mutual fundshares
Otheraccounts
NFC HH MFI INS OFI GOV ROW
MFI liabilities
0%
10%
20%
30%
40%
50%
60%
70%
80%
90%
100%
Currency andd ep o s its
Short-term d ebtsecurit ies
Long -term d eb tsecurit ies
Quo ted andunq uo ted shares
Mutual fund shares Other acco unts
NFC HH MFI INS OFI GOV ROW
Insurance assets
0%
10%
20%
30%
40%
50%
60%
70%
80%
90%
100%
Currencyand
d ep os its
Short -termd ebt
securit ies
Lo ng-termd eb t
securities
Sho rt -termloans
Lo ng -termlo ans
Quo ted andunq uo ted
shares
Mutual fundshares
Prep aymentso f insurancep remiums
Otheracco unts
NFC HH MFI INS OFI GOV ROW
Insurance liabil ities
0%
10%
20%
30%
40%
50%
60%
70%
80%
90%
100%
Currency anddeposit s
S hort - t e rmdebt
se curit ie s
Long-t e rmde bt
sec urit ie s
Deriva t ive s S hort - t e rmloa ns
Long-t e rmloans
Quot ed andunquot e d
sha res
Mut ua l fundsha res
Ne t equit y ofhouseholds inlife insurance
re se rves
P repa yment sof insura nce
pre miums
Ot he raccount s
NFC HH MFI INS OFI GOV ROW
43ECB
Working Paper Series No 1124December 2009
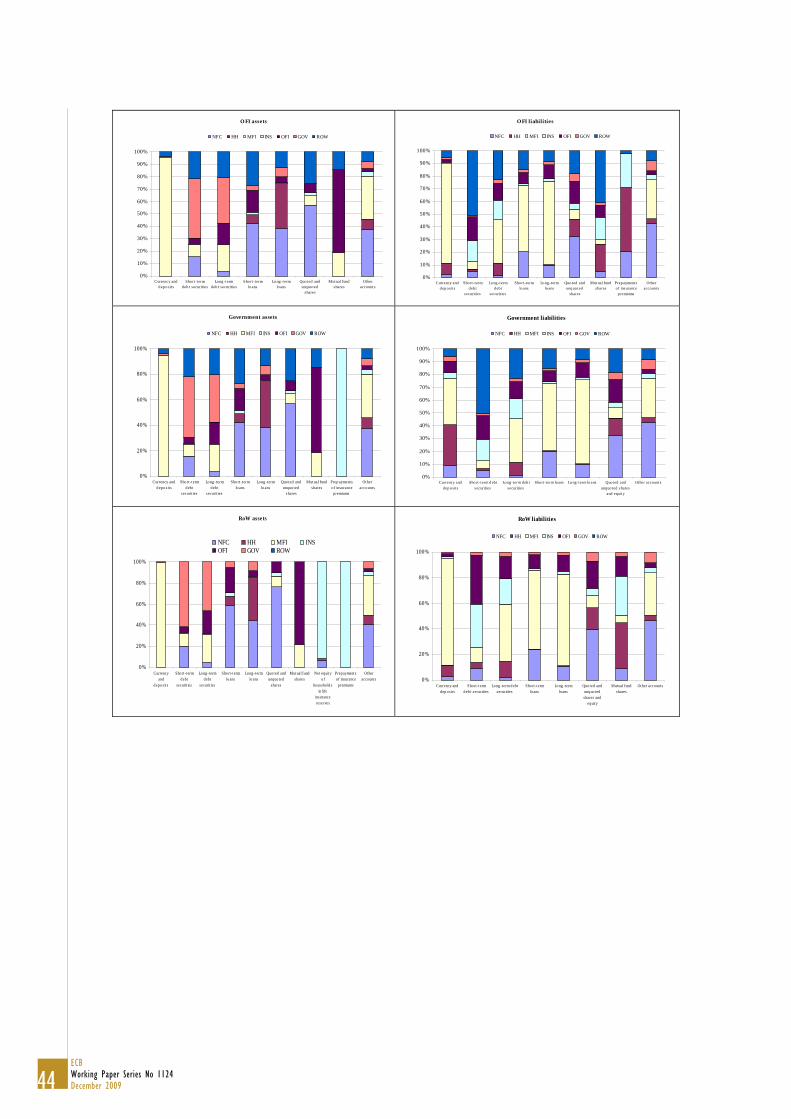
O FI assets
0%
10%
20%
30%
40%
50%
60%
70%
80%
90%
100%
Currency andd epos its
Short -termdeb t securit ies
Long-termdeb t securities
Short -termloans
Long -termloans
Quo ted andunquo ted
shares
Mutual fundshares
Otheraccounts
NFC HH MFI INS OFI GOV ROW
OFI liabilities
0%
10%
20%
30%
40%
50%
60%
70%
80%
90%
100%
Currency anddepos its
Sho rt -termdeb t
securit ies
Long -termdeb t
securities
Short -termloans
Long-termlo ans
Quo ted andunquo ted
shares
Mutual fundshares
Prepaymentso f insurance
premiums
Otheraccounts
NFC HH MFI INS OFI GOV ROW
Government assets
0%
20%
40%
60%
80%
100%
Currency andd epo s it s
Sho rt-termdeb t
securities
Lo ng -termd eb t
securities
Sho rt -termlo ans
Long -termlo ans
Quoted andunq uo ted
shares
M utual fundshares
Prep aymentso f insurancep remiums
Otheraccounts
NFC HH MFI INS OFI GOV ROW
Government liabilities
0%
10%
20%
30%
40%
50%
60%
70%
80%
90%
100%
Currency andd ep o sits
Sho rt-term d eb tsecurit ies
Lo ng-term d eb tsecurities
Sho rt-term lo ans Lo ng-term lo ans Quo ted andunq uo ted shares
and eq uity
Other acco unts
NFC HH MFI INS OFI GOV ROW
RoW assets
0%
20%
40%
60%
80%
100%
Currencyand
d epo s its
Sho rt -termdeb t
securit ies
Lo ng-termd eb t
securit ies
Sho rt-termlo ans
Long-termlo ans
Quoted andunq uoted
shares
Mutual fundshares
Net equityo f
ho useho ld sin life
insurancereserves
Prepaymentsof insurancep remiums
Otheracco unts
NFC HH MFI INSOFI GOV ROW
RoW liabilities
0%
20%
40%
60%
80%
100%
Currency anddepos its
Sho rt-termdeb t securit ies
Long -term d eb tsecurit ies
Sho rt-termloans
Lo ng-termloans
Quo ted andunquo tedshares and
equity
Mutual fundshares
Other accounts
NFC HH MFI INS OFI GOV ROW
44ECBWorking Paper Series No 1124December 2009
45ECB
Working Paper Series No 1124December 2009
European Central Bank Working Paper Series
For a complete list of Working Papers published by the ECB, please visit the ECB’s website
(http://www.ecb.europa.eu).
1086 “Euro area money demand: empirical evidence on the role of equity and labour markets” by G. J. de Bondt,
September 2009.
1087 “Modelling global trade flows: results from a GVAR model” by M. Bussière, A. Chudik and G. Sestieri,
September 2009.
1088 “Inflation perceptions and expectations in the euro area: the role of news” by C. Badarinza and M. Buchmann,
September 2009.
1089 “The effects of monetary policy on unemployment dynamics under model uncertainty: evidence from the US
and the euro area” by C. Altavilla and M. Ciccarelli, September 2009.
1090 “New Keynesian versus old Keynesian government spending multipliers” by J. F. Cogan, T. Cwik, J. B. Taylor
and V. Wieland, September 2009.
1091 “Money talks” by M. Hoerova, C. Monnet and T. Temzelides, September 2009.
1092 “Inflation and output volatility under asymmetric incomplete information” by G. Carboni and M. Ellison,
September 2009.
1093 “Determinants of government bond spreads in new EU countries” by I. Alexopoulou, I. Bunda and A. Ferrando,
September 2009.
1094 “Signals from housing and lending booms” by I. Bunda and M. Ca’Zorzi, September 2009.
1095 “Memories of high inflation” by M. Ehrmann and P. Tzamourani, September 2009.
1096 “The determinants of bank capital structure” by R. Gropp and F. Heider, September 2009.
1097 “Monetary and fiscal policy aspects of indirect tax changes in a monetary union” by A. Lipińska
and L. von Thadden, October 2009.
1098 “Gauging the effectiveness of quantitative forward guidance: evidence from three inflation targeters”
by M. Andersson and B. Hofmann, October 2009.
1099 “Public and private sector wages interactions in a general equilibrium model” by G. Fernàndez de Córdoba,
J.J. Pérez and J. L. Torres, October 2009.
1100 “Weak and strong cross section dependence and estimation of large panels” by A. Chudik, M. Hashem Pesaran
and E. Tosetti, October 2009.
1101 “Fiscal variables and bond spreads – evidence from eastern European countries and Turkey” by C. Nickel,
P. C. Rother and J. C. Rülke, October 2009.
1102 “Wage-setting behaviour in France: additional evidence from an ad-hoc survey” by J. Montornés and
J.-B. Sauner-Leroy, October 2009.
1103 “Inter-industry wage differentials: how much does rent sharing matter?” by P. Du Caju, F. Rycx and I. Tojerow,
October 2009.

46ECBWorking Paper Series No 1124December 2009
1104 “Pass-through of external shocks along the pricing chain: a panel estimation approach for the euro area”
by B. Landau and F. Skudelny, November 2009.
1105 “Downward nominal and real wage rigidity: survey evidence from European firms” by J. Babecký, P. Du Caju,
T. Kosma, M. Lawless, J. Messina and T. Rõõm, November 2009.
1106 “The margins of labour cost adjustment: survey evidence from European firms” by J. Babecký, P. Du Caju,
T. Kosma, M. Lawless, J. Messina and T. Rõõm, November 2009.
1107 “Interbank lending, credit risk premia and collateral” by F. Heider and M. Hoerova, November 2009.
1108 “The role of financial variables in predicting economic activity” by R. Espinoza, F. Fornari and M. J. Lombardi,
November 2009.
1109 “What triggers prolonged inflation regimes? A historical analysis.” by I. Vansteenkiste, November 2009.
1110 “Putting the New Keynesian DSGE model to the real-time forecasting test” by M. Kolasa, M. Rubaszek
and P. Skrzypczyński, November 2009.
1111 “A stable model for euro area money demand: revisiting the role of wealth” by A. Beyer, November 2009.
1112 “Risk spillover among hedge funds: the role of redemptions and fund failures” by B. Klaus and B. Rzepkowski,
November 2009.
1113 “Volatility spillovers and contagion from mature to emerging stock markets” by J. Beirne, G. M. Caporale,
M. Schulze-Ghattas and N. Spagnolo, November 2009.
1114 “Explaining government revenue windfalls and shortfalls: an analysis for selected EU countries” by R. Morris,
C. Rodrigues Braz, F. de Castro, S. Jonk, J. Kremer, S. Linehan, M. Rosaria Marino, C. Schalck and O. Tkacevs.
1115 “Estimation and forecasting in large datasets with conditionally heteroskedastic dynamic common factors”
by L. Alessi, M. Barigozzi and M. Capasso, November 2009.
1116 “Sectorial border effects in the European single market: an explanation through industrial concentration”
by G. Cafiso, November 2009.
1117 “What drives personal consumption? The role of housing and financial wealth” by J. Slacalek, November 2009.
1118 “Discretionary fiscal policies over the cycle: new evidence based on the ESCB disaggregated approach”
by L. Agnello and J. Cimadomo, November 2009.
1119 “Nonparametric hybrid Phillips curves based on subjective expectations: estimates for the euro area”
by M. Buchmann, December 2009.
1120 “Exchange rate pass-through in central and eastern European member states” by J. Beirne and M. Bijsterbosch,
December 2009.
1121 “Does finance bolster superstar companies? Banks, venture capital and firm size in local U.S. markets”
by A. Popov, December 2009.
1122 “Monetary policy shocks and portfolio choice” by M. Fratzscher, C. Saborowski and R. Straub, December 2009.
1123 “Monetary policy and the financing of firms” by F. De Fiore, P. Teles and O. Tristani, December 2009.
1124 “Balance sheet interlinkages and macro-financial risk analysis in the euro area” by O. Castrén and I. K. Kavonius,
December 2009.

Work ing PaPer Ser i e Sno 1118 / november 2009
DiScretionary FiScal PolicieS over the cycle
neW eviDence baSeD on the eScb DiSaggregateD aPProach
by Luca Agnello and Jacopo Cimadomo