BALANCE OF PAYMENTS DEVELOPMENTS 3/20/2015 … · BALANCE OF PAYMENTS DEVELOPMENTS 3/20/2015 3:00...
27
BALANCE OF PAYMENTS DEVELOPMENTS 3/20/2015 3:00 PM Department of Economic Statistics F o u r t h Q u a r t e r 2 0 1 4 D e v e l o p m e n t s Overall BOP Position Q4 2014 BOP position yields lower surplus. The country’s balance of payments position registered a surplus of US$574 million in Q4 2014, 54.5 percent lower than the US$1.3 billion surplus recorded in Q4 2013. Despite the gains in the current account, these were almost negated by the substantial net outflows (or net lending by residents to the rest of the world) in the financial account. The large outflows in the financial account were due largely to the notable growth in net placements of residents in other investments and direct investments abroad. As global growth prospects remain solid, particularly in the US, China and India, residents have explored investment opportunities abroad. Meanwhile, the narrowing of the trade-in-goods deficit contributed mainly to the higher current account surplus (Table 1). Balance of Payments ( in million US$) Q4 2014 2013 Current Account 4701 3286 Capital Account 28 32 Financial Account* 4480 1968 Net Unclassified Items 325 -90 Overall BOP 574 1260 *Positive balance in the financial account indicates net outflows while a negative balance indicates net inflows. The overall BOP position, therefore, is equal to the current account plus the capital account minus the financial account plus net unclassified items. Current Account Current account surplus expands. The current account yielded a surplus of US$4.7 billion (equivalent to 5.9 percent of GDP) in Q4 2014, 43.1 percent higher compared to US$3.3 billion (4.4 percent of GDP) recorded in same quarter a year ago. The expansion in the current account surplus was attributed to the narrowing of the trade-in-goods deficit combined with the increases recorded in net receipts from the primary and secondary income accounts. 1 Trade-in-Goods Trade-in-goods deficit narrows as price of crude oil falls. The trade-in-goods deficit narrowed to US$3.7 billion in Q4 2014 from US$4.8 billion in Q4 2013. This was largely on account of the 6.2 percent decline in goods imports, which was primarily due to the drop in petroleum crude imports brought about by the fall in the international 1 Primary Income account (formerly the Income account) shows the flows for the use of labor and financial resources between resident and non-resident institutional units. Secondary Income account (formerly the Current Transfers account) shows current transfers, in cash or in kind, for nothing in return, between residents and non-residents.
Transcript of BALANCE OF PAYMENTS DEVELOPMENTS 3/20/2015 … · BALANCE OF PAYMENTS DEVELOPMENTS 3/20/2015 3:00...

BALANCE OF PAYMENTS DEVELOPMENTS 3/20/2015 3:00 PM
Department of Economic Statistics
F o u r t h Q u a r t e r 2 0 1 4 D e v e l o p m e n t s
Overall BOP Position
Q4 2014 BOP position yields lower
surplus.
The country’s balance of payments position registered a surplus of US$574 million in Q4 2014, 54.5 percent lower than the US$1.3 billion surplus recorded in Q4 2013. Despite the gains in the current account, these were almost negated by the substantial net outflows (or net lending by residents to the rest of the world) in the financial account. The large outflows in the financial account were due largely to the notable growth in net placements of residents in other investments and direct investments abroad. As global growth prospects remain solid, particularly in the US, China and India, residents have explored investment opportunities abroad. Meanwhile, the narrowing of the trade-in-goods deficit contributed mainly to the higher current account surplus (Table 1).
Balance of Payments ( in million US$)
Q4
2014 2013
Current Account 4701 3286
Capital Account 28 32
Financial Account* 4480 1968
Net Unclassified Items 325 -90
Overall BOP 574 1260 *Positive balance in the financial account indicates net outflows while a negative balance indicates net inflows. The overall BOP position, therefore, is equal to the current account plus the capital account minus the financial account plus net unclassified items.
Current Account
Current account surplus expands.
The current account yielded a surplus of US$4.7 billion (equivalent to 5.9 percent of GDP) in Q4 2014, 43.1 percent higher compared to US$3.3 billion (4.4 percent of GDP) recorded in same quarter a year ago. The expansion in the current account surplus was attributed to the narrowing of the trade-in-goods deficit combined with the increases recorded in net receipts from the primary and secondary income accounts.1
Trade-in-Goods
Trade-in-goods deficit narrows as
price of crude oil falls.
The trade-in-goods deficit narrowed to US$3.7 billion in Q4 2014 from US$4.8 billion in Q4 2013. This was largely on account of the 6.2 percent decline in goods imports, which was primarily due to the drop in petroleum crude imports brought about by the fall in the international
1 Primary Income account (formerly the Income account) shows the flows for the use of labor and financial resources between resident and
non-resident institutional units. Secondary Income account (formerly the Current Transfers account) shows current transfers, in cash or in kind, for nothing in return, between residents and non-residents.

Balance of Payments F o u r t h Q u a r t e r 2 0 1 4
Department of Economic Statistics 2
price of crude oil.2 Capital goods imports were also lower as purchases of aircraft, ships & boats declined.
Exports of Goods3
Exports of goods post a slight
increase.
Exports of goods posted a slight increment of 1.2 percent to reach US$11.3 billion in Q4 2014 buoyed by sustained demand from major trading partners such as Japan, U.S., and Taiwan. In particular, exports of manufactures rose by 1.2 percent to reach US$9.3 billion due to higher shipments of machinery and transport equipment. Manufactured goods exports such as chemicals and garments also increased. Exports of coconut products totaling US$429 million grew by 40.8 percent following higher shipments of coconut oil (by 70.1 percent), as the world price of coconut oil increased during the period. Shipments of other agro-based products, aggregating US$278 million, increased by 14.3 percent on account of unmanufactured tobacco and other agro-based commodities. However, these increases were tempered by the decline in exports of non-consigned electronic products (including other electronics), sugar and products, mineral products, petroleum products, and fruits and vegetables (Table 2.1).
Coconut3.8%
Other agro-based2.5% Mineral products
6.7%
Electronics35.4%
Garments3.8%
Machinery11.0%
Fruits & vegs 3.2
others32.6%
Petroleum1.0%
Exports by Major Commodity Group Q4 2014
(Percent Share)
Source: Philipine Statistics Authority (PSA)
Imports of Goods2
Imports of goods decline.
Imports of goods amounted to US$15.1 billion in Q4 2014, lower by 6.2 percent compared to the US$16.1 billion posted in Q4 2013, due mainly to the decrease in importation of capital goods and mineral fuels & lubricants. Imports of these commodity groups contributed 5.7 and 3.5 percentage points, respectively, to the decline in total goods imports during the quarter.
2 Based on World Bank Commodities Price data, the average price of Dubai crude oil in Oct-Dec 2014 was US$74.6/barrel vs. US$106.7/barrel in
Oct-Dec 2013. 3 Based on BPM6 concept (excluding from the Philippine Statistics Authority (PSA) foreign trade statistics those goods that did not involve change
in ownership): consigned goods are deducted, in addition to the exclusion of returned/replacement goods, and temporarily imported/exported goods. For example, of the total electronics exports, 17 percent are on consignment basis. On 12 September 2013, Republic Act No. 10625 (RA 10625) mandated the reorganization of the Philippine Statistical System (PSS) and the creation of the Philippine Statistics Authority which merged the major statistical agencies engaged in primary data collection and compilation of secondary data, namely: National Statistics Office (NSO), National Statistical Coordination Board (NSCB), Bureau of Agricultural Statistics (BAS), and Bureau of Labor and Employment Statistics (BLES).

Balance of Payments F o u r t h Q u a r t e r 2 0 1 4
Department of Economic Statistics 3
Imports of capital goods, which aggregated US$3 billion during the quarter, dropped by 23.3 percent, due largely to lower procurement of aircraft, ships & boats (by 68.9 percent) and telecommunication equipment and electrical machines (by 8.7 percent).
Imports of mineral fuels and lubricants dropped by 18.1 percent, mainly on account of the 27.3 percent decline in the value of imported petroleum crude owing to the lower prices of crude oil in the world market. Conversely, the volume of imported petroleum crude increased by 3.7 percent on the back of sustained demand to support domestic production. Imports of coal and other mineral fuels and lubricant also declined due to lower prices.
Meanwhile, imports of raw materials and intermediate goods and consumer goods posted increases in Q4 2014. In particular, raw materials and intermediate goods imports rose by 25.9 percent to US$5.5 billion, buoyed by higher imports of semi-processed raw materials (34.4 percent) on account largely of materials and accessories for the manufacture of non-consigned electronics (by 93.3 percent), chemicals (by 24.3 percent) and manufactured goods (18.7 percent). Imports of consumer goods went up by 19.3 percent to US$2.6 billion in Q4 2014 as purchases of non-durable and durable goods increased by 29.7 percent and 9 percent, respectively.
CapitalGoods20.4%
Raw Mats.37.5%
Minerals17.4%
Consumer Goods17.6%
Others 7.1%
Imports by Major Commodity Group Q4 2014
(Percent Share)
Source: Philipine Statistics Authority (PSA)
Trade-in-Services
Trade-in-services balance post lower
net receipts.
The trade-in-services balance recorded lower net receipts of US$1.6 billion in Q4 2014, compared to the US$1.8 billion net receipts in Q4 2013. The 7.3 percent decline resulted largely from increased net payments for travel services (US$1.3 billion) and transport services (US$476 million). Increased net payments were also recorded in insurance and pension, charges for the use of intellectual property, and government goods and services. However, these were partially offset by higher net receipts in computer services (US$768 million) and technical, trade-related and other business services (US$3 billion).4,5
4 Include manufacturing services on physical inputs owned by others, mostly electronic products, and business process outsourcing (BPOs).

Balance of Payments F o u r t h Q u a r t e r 2 0 1 4
Department of Economic Statistics 4
Primary Income
Net receipts of primary income
account rise.
The primary income account posted net receipts of US$516 million in Q4 2014, an increase of 70.5 percent from the US$303 million net receipts in the comparable period last year. Growth was driven by the decline in net payments of investment income (by 10.7 percent) on account of lower dividends paid to foreign direct investors, and the sustained increase in compensation inflows from resident overseas Filipino (OF) workers which amounted to US$1.9 billion.
Secondary Income
Net receipts of secondary income
increase.
Net receipts in the secondary income account reached US$6.3 billion in Q4 2014 compared to US$6.1 billion in Q4 2013. The 3.2 percent expansion was accounted for mainly by the 5.4 percent increase in personal transfers totaling US$5.8 billion. The bulk of these personal transfers came from non-resident OF workers' remittances (about 98 percent) which increased by 5.6 percent to US$5.7 billion. Strong demand by host countries for skilled Filipinos manpower and the continuing enhancement of financial products and services offered in the remittance market contributed to the steady growth in remittance flows. (Table 5).
Capital Account
Net receipts in the capital account fall.
Net receipts in the capital account dropped to US$28 million in Q4 2014 from US$32 million in Q4 2013. This developed mainly on account of lower net receipts of other capital transfers to the general government.
Financial Account
Financial account posts higher net
outflows in Q4 2014
The financial account continued to register net outflows (or net lending by residents to the rest of the world) of US$4.5 billion in Q4 2014, more than twice the US$2 billion net outflows in the comparable quarter a year ago. This was due mainly to the substantial increase in net outflows in other investments which reached US$2.3 billion. Portfolio and direct investments also registered net outflows amounting to US$1.2 billion and US$977 million, respectively, during the quarter.
Direct Investments
Direct investments register higher net
outflows.
The direct investments account yielded higher net outflows of US$977 million in Q4 2014, more than double the net outflows of US$471 million in Q4 2013. Residents’ net acquisition of financial assets of US$2.4 billion exceeded their net incurrence of liabilities (foreign direct investments in the Philippines or FDI) of US$1.4 billion. This developed as equity capital placement abroad by resident non-banks
5 Based on BPM6, financial services consist of: a) explicitly charged and other financial services; and b) financial intermediation services indirectly
measured (FISIM). FISIM refers to margins between interest payable and reference rate on loans and deposits. Government goods and services n.i.e. cover goods and services: a) supplied by and to embassies, military bases and international organizations; b) acquired from the host economy by diplomats, consular staff, and military personnel located abroad and their dependents; and c) services supplied by and to governments and not included in other categories of services.

Balance of Payments F o u r t h Q u a r t e r 2 0 1 4
Department of Economic Statistics 5
surged to US$1.7 billion from US$226 million. Meanwhile, non-residents’ net equity capital investments in Q4 2014 rose to US$896 million from US$21 million. This was due to non-residents’ higher gross equity capital placements coupled with lower equity capital withdrawals indicating favorable investor sentiment on the Philippine economy. The bulk of equity capital placements was sourced mainly from the United States, Hong Kong, Singapore, the United Kingdom, and Singapore. These funds were channeled to the financial and insurance, mining and quarrying, manufacturing, real estate, and wholesale and retail trade sectors.
Portfolio Investments
Net outflows of portfolio
investments increase.
The portfolio investments account posted net outflows of US$1.2 billion in Q4 2014, 7.5 percent higher than the net outflows in Q4 2013. This development was reflective of the prevailing volatility in financial markets amid lingering uncertainty over the global growth prospects. Residents’ net acquisition of financial assets amounted to US$930 million, a reversal of the US$81 net disposal of financial assets in Q4 last year on account of net placements by domestic deposit-taking corporations (US$777 million) and the central bank (US$171 million) in debt securities issued by non-residents.
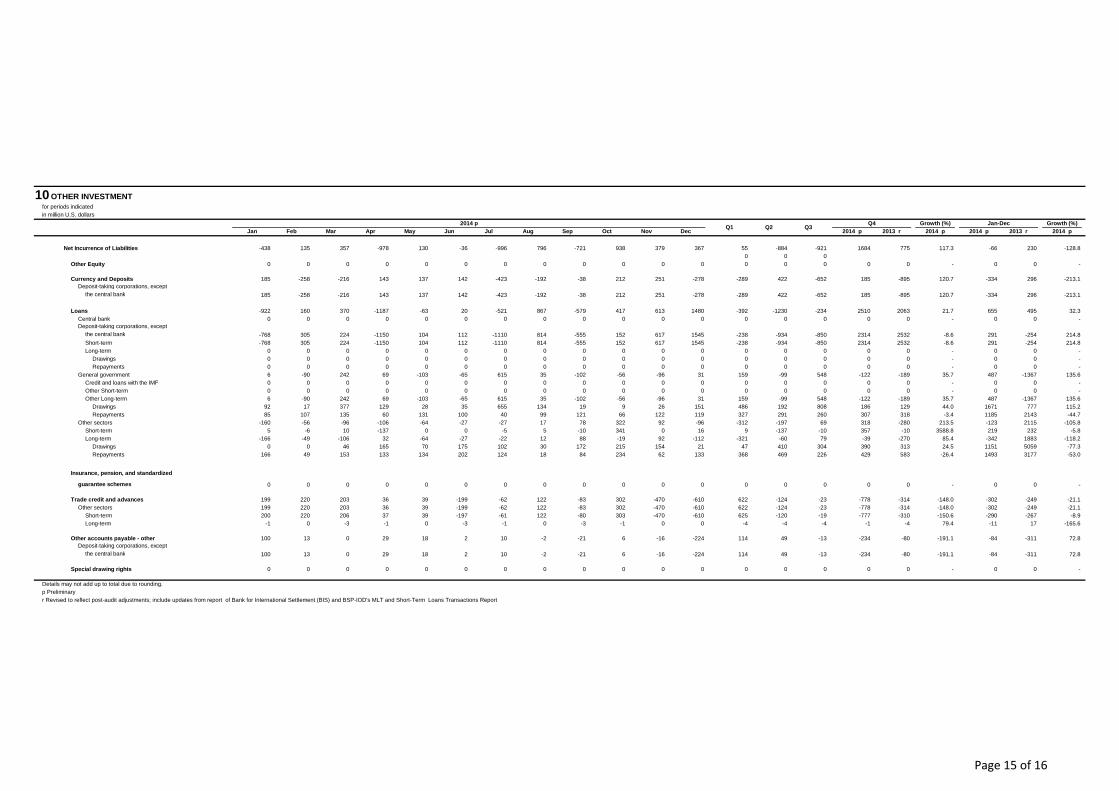
Other Investments
Net outflows of other investments
post substantial increase.
The other investment account recorded net outflows amounting to US$2.3 billion in Q4 2014, more than five times the US$426 million registered in the comparable quarter last year. Net outflows stemmed mainly from higher net acquisition of financial assets which reached US$4 billion from US$1.2 billion in Q4 2013, due largely to higher residents’ deposit placements (US$2.7 billion) and net lending (US$1.4 billion) abroad. Net repayment of short-term trade credit and advances (US$777 million) and other accounts payable to foreign creditors (US$234 million) also contributed to increased net outflows.
Financial Derivatives
Trading in financial derivatives results in
net gain.
The financial derivatives account recorded a lower net gain of US$31 million in Q4 2014 compared to US$47 million in Q4 2013. (Table 9).
J a n u a r y – D e c e m b e r 2 0 1 4 D e v e l o p m e n t s
Full-year 2014 BOP position reverses to
a deficit.
The BOP position for full-year 2014 recorded a deficit of US$2.9 billion, a reversal of the US$5.1 billion surplus recorded in 2013. The deficit resulted from the marked increase in net outflows in the financial account despite the continued improvement in the current account surplus. The net outflows in the financial account stemmed from the increased net outflows in other investments and the reversal of portfolio and direct investments from net inflows to net outflows. The current account continued to perform favorably on the back of the lower trade-in-goods deficit and higher net receipts in the primary and
Balance of Payments F o u r t h Q u a r t e r 2 0 1 4
Department of Economic Statistics 6
secondary income accounts (Table 1).
Balance of Payments ( in million US$)
2014 2013
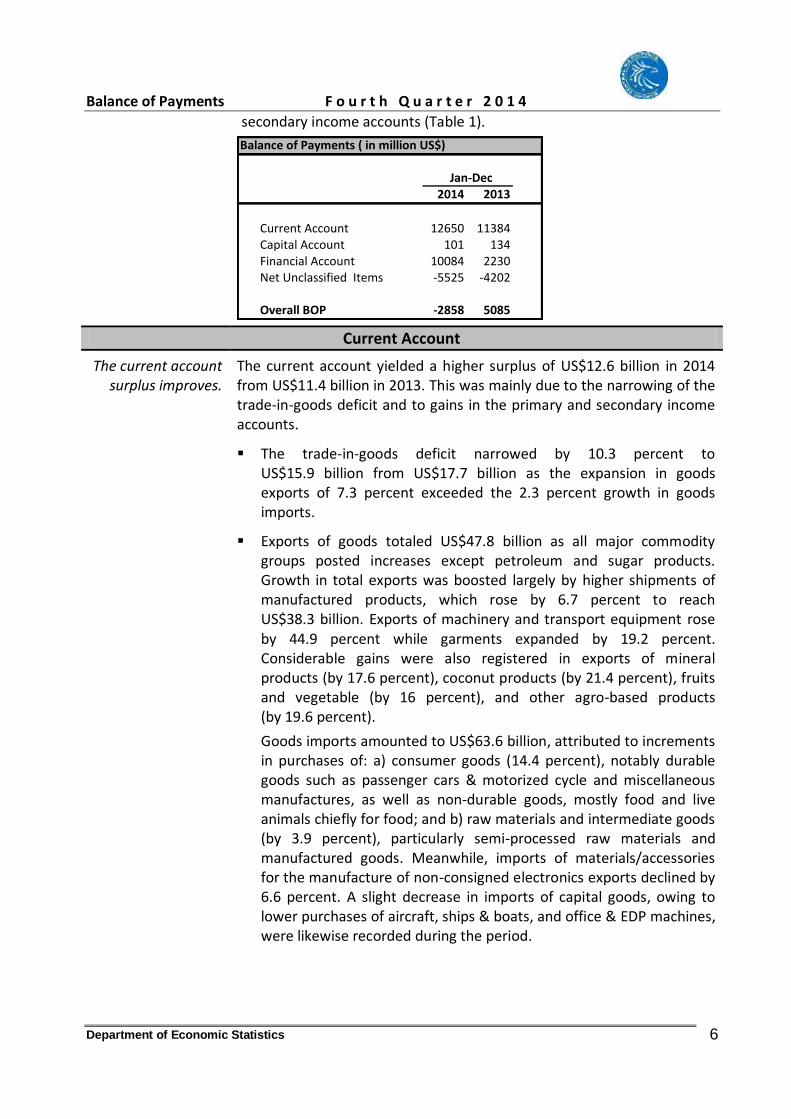
Current Account 12650 11384Capital Account 101 134Financial Account 10084 2230Net Unclassified Items -5525 -4202
Overall BOP -2858 5085
Jan-Dec
Current Account
The current account surplus improves.
The current account yielded a higher surplus of US$12.6 billion in 2014 from US$11.4 billion in 2013. This was mainly due to the narrowing of the trade-in-goods deficit and to gains in the primary and secondary income accounts.
The trade-in-goods deficit narrowed by 10.3 percent to US$15.9 billion from US$17.7 billion as the expansion in goods exports of 7.3 percent exceeded the 2.3 percent growth in goods imports.
Exports of goods totaled US$47.8 billion as all major commodity groups posted increases except petroleum and sugar products. Growth in total exports was boosted largely by higher shipments of manufactured products, which rose by 6.7 percent to reach US$38.3 billion. Exports of machinery and transport equipment rose by 44.9 percent while garments expanded by 19.2 percent. Considerable gains were also registered in exports of mineral products (by 17.6 percent), coconut products (by 21.4 percent), fruits and vegetable (by 16 percent), and other agro-based products (by 19.6 percent).
Goods imports amounted to US$63.6 billion, attributed to increments in purchases of: a) consumer goods (14.4 percent), notably durable goods such as passenger cars & motorized cycle and miscellaneous manufactures, as well as non-durable goods, mostly food and live animals chiefly for food; and b) raw materials and intermediate goods (by 3.9 percent), particularly semi-processed raw materials and manufactured goods. Meanwhile, imports of materials/accessories for the manufacture of non-consigned electronics exports declined by 6.6 percent. A slight decrease in imports of capital goods, owing to lower purchases of aircraft, ships & boats, and office & EDP machines, were likewise recorded during the period.

Balance of Payments F o u r t h Q u a r t e r 2 0 1 4
Department of Economic Statistics 7
Net receipts in trade-in-services dropped by 30.5 percent to US$4.9 billion in 2014 from US$7 billion in 2013. The decline resulted largely from increased net payments for travel and transport services by 63.9 percent and 8 percent, respectively, combined with decreased net receipts from technical, trade-related and other business services (by 2.1 percent). Meanwhile, net receipts from computer services increased by 12.3 percent to US$2.9 billion in 2014. Export revenues in business process outsourcing (BPO) services—which are lodged under technical, trade-related and other business, and computer services—totaled US$15.6 billion in 2014, reflecting a growth of 10.1 percent from the US$14.2 billion receipts in 2013.
Net receipts in the primary income account reached US$1.1 billion in 2014, higher by 11.9 percent than the US$957 million last year. This was attributable to the 7.4 percent expansion in receipts from compensation of resident OF workers to US$7.4 billion. However, the increase in net payments of investment income (by 6.7 percent), mostly for dividends to foreign direct and portfolio investors, partially negated these gains.
Net receipts in the secondary income account went up by 7 percent to US$22.6 billion, buoyed by non-resident workers' remittances which aggregated US$20.4 billion in 2014.
Capital Account
Capital account net receipts drop.
The capital account recorded net receipts of US$101 million in 2014, 24.1 percent lower than the US$134 million posted in the previous year, due to the decline in other capital transfers to the NG.
Financial Account
Net outflows in the financial account rise significantly.
The financial account registered net outflows amounting to US$10.1 billion in 2014, more than fourfold the USS$2.2 billion net outflows registered a year ago. This was on account of the substantial increase in the net outflows in other investments and the reversal to net outflows in portfolio and direct investments.
Direct investment account. The direct investment account reversed to net outflows of US$789 million from net inflows of US$90 million a year ago. This developed on account of the 91.7 percent rise in residents’ net acquisition of financial assets to US$7 billion from US$3.6 billion due to resident corporations’ net placements in both equity capital (US$2.9 billion) and debt instruments (US$4 billion) abroad. Meanwhile, residents’ net incurrence of liabilities (or FDI) rose by 65.9 percent from last year’s US$3.7 billion to US$6.2 billion. The increase was due to higher non-residents’ net placements in domestic equity capital (US$2 billion) and increased residents’ borrowings from their non-resident direct investors (US$3.3 billion). Equity capital investments

Balance of Payments F o u r t h Q u a r t e r 2 0 1 4
Department of Economic Statistics 8
came mostly from the United States, Hong Kong, Japan, Singapore, and the United Kingdom. These funds were channeled mainly to the financial and insurance; manufacturing; real estate; mining and quarrying; and wholesale and retail trade sectors.
Portfolio investment account. Portfolio investment account recorded net outflows of US$2.5 billion during the period, a reversal of last year’s net inflows of US$1 billion. This was due to residents’ net acquisition of financial assets of US$2.5 billion, from a net disposal of assets amounting to US$638 million combined with non-residents’ net withdrawal of investments amounting to US$3 million, a reversal from the net placements of US$363 million in 2013. Residents’ net acquisition of financial assets resulted mainly from net placements in foreign-issued debt securities by resident banks and the central bank. Meanwhile, the net repayment of liabilities in foreign portfolio investments was due largely to the redemption of NG-issued short-term debt securities held by non-residents.
Other investment account. The net outflows in the other investment account doubled to US$6.9 billion from US$3.4 billion in 2013 on account of increased net placements in currency and deposits abroad by resident banks and non-bank corporations, amounting to US$2.7 billion and US$1.4 billion, respectively), and to higher resident banks’ net lending of US$2.7 billion. Meanwhile, residents’ net repayment of liabilities amounting to US$66 million was attributed to non-residents’ net withdrawal of deposit placements in resident banks (US$334 million) and residents’ net repayment of trade credits and advances (US$302 million).
Reserve Assets
Gross international reserves remain
ample.
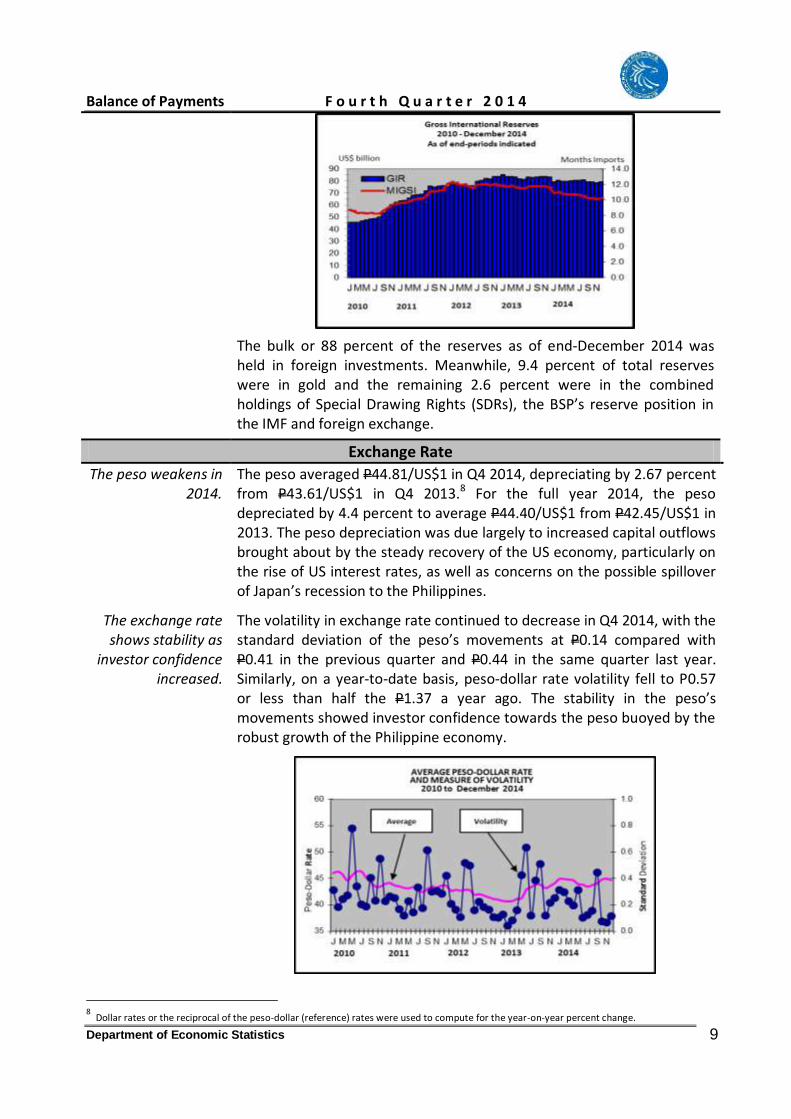
The country’s gross international reserves (GIR) reached US$79.5 billion as of end-December 2014, a decline of 4.4 percent (or US$3.6 billion) compared to the end-December 2013 GIR level of US$83.2 billion. At this level, reserves could sufficiently cover 10.4 months’ worth of imports of goods and payments of services and income. It was also equivalent to 4.9 times the country’s short-term external debt based on original maturity and 4 times based on residual maturity.6,7 The decline in reserves was due mainly to the NG’s payment of its maturing foreign exchange obligations, revaluation adjustments and the BSP’s foreign exchange operations. These outflows were partially offset by NG’s foreign currency deposits and the BSP’s income from investments.
6 Residual maturity refers to outstanding short-term debt based on original maturity plus principal payments on medium- and long-term loans of
the public and private sectors falling due in the next 12 months. 7 Outstanding short-term debt were revised to reflect the new reporting framework in line with international standards under the latest External
Debt Statistics Guide and International Monetary Fund’s Balance of Payments and International Investment Position Manual, 6th
Edition.
Balance of Payments F o u r t h Q u a r t e r 2 0 1 4
Department of Economic Statistics 9
The bulk or 88 percent of the reserves as of end-December 2014 was held in foreign investments. Meanwhile, 9.4 percent of total reserves were in gold and the remaining 2.6 percent were in the combined holdings of Special Drawing Rights (SDRs), the BSP’s reserve position in the IMF and foreign exchange.
Exchange Rate
The peso weakens in 2014.
The peso averaged P44.81/US$1 in Q4 2014, depreciating by 2.67 percent from P43.61/US$1 in Q4 2013.8 For the full year 2014, the peso depreciated by 4.4 percent to average P44.40/US$1 from P42.45/US$1 in 2013. The peso depreciation was due largely to increased capital outflows brought about by the steady recovery of the US economy, particularly on the rise of US interest rates, as well as concerns on the possible spillover of Japan’s recession to the Philippines.
The exchange rate shows stability as
investor confidence increased.
The volatility in exchange rate continued to decrease in Q4 2014, with the standard deviation of the peso’s movements at P0.14 compared with P0.41 in the previous quarter and P0.44 in the same quarter last year. Similarly, on a year-to-date basis, peso-dollar rate volatility fell to P0.57 or less than half the P1.37 a year ago. The stability in the peso’s movements showed investor confidence towards the peso buoyed by the robust growth of the Philippine economy.
8 Dollar rates or the reciprocal of the peso-dollar (reference) rates were used to compute for the year-on-year percent change.
Balance of Payments F o u r t h Q u a r t e r 2 0 1 4
Department of Economic Statistics 10
Peso loses its external
competitiveness in Q4 2014 due to both
peso appreciation and widening
inflation differential.
On a year-on-year basis, the peso’s average nominal effective exchange rate (NEER) index for Q4 2014 appreciated against the baskets of currencies of major trading partners (MTPs) and advanced (TPI-A) countries by 1.8 percent and 4.7 percent, respectively.9 Meanwhile, the NEER index depreciated against the basket of currencies of developing (TPI-D) countries by 0.4 percent. For the full year 2014, the peso depreciated against the MTPs and trading partners in both TPI-A and TPI-D by 2.3 percent, 1.3 percent, 3.0 percent, respectively.
On a real trade-weighted basis, relative to Q4 2013, the peso lost external price competitiveness against the basket of currencies of MTPs and TPI-A countries, due to the combined effects of the appreciation of the peso’s NEER and widening inflation differential. Similarly, the peso lost external price competitiveness against TPI-D countries as the widening inflation differential offset the peso depreciation. The real effective exchange rate (REER) indices against the MTPs and in both TPI-A and TPI-D countries appreciated by 3.6 percent, 6.9 percent, and 1.3 percent, respectively. However, for the full year 2014, the peso gained external competitiveness against the MTPs and TPI-D countries as nominal depreciation of the peso offset the widening inflation differential. The REER indices relative to full year 2013 depreciated against the MTPs and TPI-D countries by 0.3 percent and 1.3 percent; but appreciated against the trading partners in TPI-A countries by 1.0 percent.
9 The Trading Partners Index (TPI) measures the average nominal and real effective exchange rates of the peso across the currencies of the
14 major trading partners of the Philippines which includes Australia, Euro Area, U.S., Japan, Hong Kong, Taiwan, Thailand, Indonesia, Malaysia, Singapore, South Korea, China, Saudi Arabia, and the United Arab Emirates. The TPI-Advanced Countries measures the effective exchange rates of the peso across currencies of trading partners in advanced countries comprising of the United States, Japan, Euro Area and Australia. The TPI-Developing Countries measures the effective exchange rates of the peso across 10 currencies of partner developing economies which includes China, Singapore, South Korea, Hong Kong, Malaysia, Taiwan, Indonesia, Saudi Arabia, United Arab Emirates, and Thailand.

Balance of Payments F o u r t h Q u a r t e r 2 0 1 4
Department of Economic Statistics 11
NEW EFFECTIVE EXCHANGE RATE INDICES OF THE PESO For periods indicated; December 1980=100
NEER REER
Overall
1/
Trading Partners Overall
1/
Trading Partners
Advanced2/
Developing3/
Advanced2/
Developing3/
2013 Jan 15.53 12.43 25.14 91.17 84.88 120.98
Feb 15.72 12.65 25.35 90.71 84.77 120.01
Mar 15.82 12.82 25.37 90.76 84.87 120.03
Qtr 1 15.69 12.63 25.29 90.88 84.84 120.34
Apr 15.71 12.81 25.07 90.41 84.80 119.30
May 15.75 12.96 24.97 90.39 85.15 118.89
Jun 15.14 12.27 24.27 87.15 80.87 115.93
Qtr 2 15.53 12.68 24.77 89.32 83.61 118.04
Jul 15.08 12.29 24.09 85.75 80.37 113.22
Aug 14.88 12.02 23.92 84.33 78.11 112.32
Sep 14.89 12.07 23.89 84.35 78.23 112.25
Qtr 3 14.95 12.13 23.97 84.81 78.90 112.59
Oct 14.97 12.11 24.04 85.06 78.90 113.18
Nov 14.94 12.15 23.90 85.09 79.45 112.66
Dec 14.85 12.10 23.72 84.84 79.26 112.29
Qtr 4 14.92 12.12 23.88 85.00 79.20 112.71
Jan-Dec 15.26 12.38 24.45 87.44 81.57 115.85
2014 Jan 14.67 11.94 23.45 87.98 83.80 114.77
Feb 14.63 11.86 23.47 86.45 81.75 113.37
Mar 14.65 11.85 23.53 85.66 80.41 112.96
Qtr 1 14.65 11.88 23.48 86.70 81.99 113.70
Apr 14.67 11.89 23.52 85.87 80.20 113.67
May 14.88 12.07 23.85 87.05 81.03 115.51
Jun 14.94 12.14 23.92 87.71 81.68 116.36
Qtr 2 14.83 12.04 23.76 86.88 80.97 115.18
Jul 15.01 12.23 23.99 87.60 82.15 115.60
Aug 14.96 12.25 23.80 87.15 81.95 114.77
Sep 15.05 12.46 23.74 87.24 82.78 114.11
Qtr 3 15.01 12.31 23.84 87.33 82.29 114.83
Oct 14.93 12.37 23.55 86.86 82.55 113.47
Nov 15.17 12.73 23.71 88.17 85.11 113.85
Dec 15.44 12.98 24.11 89.26 86.27 115.15
Qtr 4 15.18 12.69 23.79 88.09 84.65 114.16
Jan-Dec 14.91 12.22 23.72 87.17 82.38 114.37
Memo Items: % Change, y-o-y
2013 Qtr 1 7.52 11.75 4.47 8.87 14.37 4.90
Qtr 2 4.94 10.27 1.11 5.99 12.26 1.55
Qtr 3 -0.90 3.55 -4.09 -0.45 4.77 -4.17
Qtr 4 -1.98 1.35 -4.46 -0.53 3.58 -3.56
Jan-Dec 2.28 6.62 -0.86 3.36 8.63 -0.43
2014 Qtr 1 -6.64 -5.98 -7.13 -4.60 -3.36 -5.52
Qtr2 -4.51 -5.10 -4.08 -2.74 -3.15 -2.42
Qtr3 0.37 1.55 -0.51 2.97 4.29 1.98
Qtr 4 1.75 4.70 -0.40 3.64 6.87 1.28
Jan-Dec -2.29 -1.31 -3.02 -0.31 0.99 -1.28
1/ Australia, Euro Area, U.S., Japan, Hong Kong, Taiwan, Thailand, Indonesia, Malaysia, Singapore, South Korea, China, Saudi Arabia, and U.A.E. 2/ U.S., Japan, Euro Area, and Australia 3/ Hong Kong, Taiwan, Thailand, Indonesia, Malaysia, Singapore, South Korea, China, Saudi Arabia, and U.A.E.

1 PHILIPPINES: BALANCE OF PAYMENTSfor periods indicatedin million U.S. dollars
Growth (%) Growth (%)
Jan Feb Mar Apr May Jun Jul Aug Sep Oct Nov Dec 2014 p 2013 r 2014 p 2014 p 2013 r 2014 p
Current Account -460 1585 370 29 1205 1855 1200 752 1414 1825 1493 1383 1495 3088 3366 4701 3286 43.1 12650 11384 11.1(Totals as percent of GNI) 1.9 3.6 4.0 5.0 3.7 3.7 3.5(Totals as percent of GDP) 2.3 4.4 4.8 5.9 4.4 4.4 4.2Export 7448 8107 8090 8526 9123 9433 9118 8648 9583 9385 8851 8566 23645 27082 27349 26802 25558 4.9 104879 97886 7.1Import 7908 6522 7720 8497 7919 7579 7918 7897 8169 7559 7359 7183 22150 23994 23983 22101 22272 -0.8 92228 86502 6.6
Goods, Services, and Primary Income -2093 -69 -1360 -1736 -612 -62 -699 -1158 -546 -240 -515 -815 -3522 -2410 -2403 -1570 -2791 43.7 -9906 -9690 -2.2Export 5750 6408 6296 6707 7251 7483 7161 6669 7568 7268 6785 6295 18453 21442 21398 20348 19345 5.2 81641 76206 7.1Import 7843 6477 7656 8443 7863 7545 7860 7827 8114 7509 7300 7110 21975 23852 23800 21919 22135 -1.0 91546 85896 6.6
Goods and Services -2160 -351 -1077 -1833 -755 -42 -811 -1330 -532 -499 -764 -823 -3588 -2630 -2673 -2086 -3093 32.6 -10977 -10647 -3.1(Totals as percent of GNI) -4.6 -3.1 -3.2 -2.2 -3.5 -3.2 -3.3(Totals as percent of GDP) -5.6 -3.7 -3.8 -2.6 -4.1 -3.9 -3.9Export 5041 5647 5588 5927 6506 6759 6388 5925 6768 6453 6055 5538 16276 19193 19080 18046 17188 5.0 72595 67848 7.0Import 7202 5997 6665 7760 7261 6801 7198 7255 7300 6952 6819 6361 19864 21822 21753 20132 20281 -0.7 83572 78495 6.5
Goods -2913 -1132 -1369 -1959 -689 -456 -1226 -1319 -1076 -1273 -1342 -1096 -5414 -3104 -3621 -3711 -4847 23.4 -15851 -17662 10.3(Totals as percent of GNI) -7.0 -3.6 -4.3 -3.9 -5.5 -4.6 -5.4(Totals as percent of GDP) -8.5 -4.4 -5.2 -4.6 -6.5 -5.6 -6.5Credit: Exports 2842 3416 3896 4050 4915 4704 4101 4099 4395 3866 3873 3600 10154 13669 12595 11340 11203 1.2 47758 44512 7.3Debit: Imports 5755 4548 5265 6009 5604 5161 5327 5419 5471 5139 5215 4697 15568 16773 16216 15051 16051 -6.2 63609 62174 2.3
Services 753 782 291 126 -65 414 415 -11 544 774 578 274 1826 475 948 1625 1754 -7.3 4874 7015 -30.5Credit: Exports 2199 2231 1692 1877 1591 2055 2286 1825 2373 2586 2181 1938 6122 5524 6485 6706 5985 12.0 24837 23335 6.4Debit: Imports 1447 1450 1400 1752 1657 1641 1871 1836 1829 1813 1604 1664 4296 5049 5537 5080 4231 20.1 19963 16320 22.3
Primary Income 67 281 -283 97 143 -20 112 172 -14 259 250 7 66 220 270 516 303 70.5 1071 957 11.9Credit: Receipts 708 761 708 780 745 724 773 744 800 815 730 757 2177 2249 2317 2303 2157 6.8 9046 8358 8.2Debit: Payments 641 479 991 683 603 744 661 572 814 557 480 750 2111 2029 2047 1787 1854 -3.6 7974 7401 7.7
Secondary Income 1634 1654 1730 1765 1817 1917 1899 1910 1960 2066 2008 2198 5017 5498 5769 6271 6077 3.2 22556 21073 7.0Credit: Receipts 1699 1699 1794 1819 1872 1950 1958 1979 2015 2116 2067 2271 5192 5641 5951 6454 6213 3.9 23238 21680 7.2Debit: Payments 65 46 64 54 55 33 58 70 55 51 59 73 175 142 183 183 136 33.8 682 606 12.5
Capital Account 8 9 9 8 8 9 9 8 5 8 9 10 26 26 22 28 32 -13.7 101 134 -24.1Credit: Receipts 9 9 9 9 9 10 10 9 9 9 10 11 28 28 28 30 38 -19.3 114 151 -24.6Debit: Payments 1 1 0 1 1 1 1 0 5 1 1 1 2 2 6 3 6 -51.3 13 18 -28.0
Financial Account 3710 -533 921 -647 -99 1442 -436 332 914 1387 1057 2037 4098 696 810 4480 1968 127.6 10084 2230 352.2Net Acquisition of Financial Assets 2439 12 1792 -637 610 2634 -260 1849 304 1722 2350 3170 4243 2607 1893 7242 2105 244.1 15986 6337 152.3Net Incurrence of Liabilities -1271 545 871 10 708 1192 176 1517 -610 336 1294 1133 145 1911 1083 2762 137 1918.7 5901 4106 43.7
Direct Investment -553 121 -54 -356 -85 -102 29 586 226 1072 273 -367 -487 -543 842 977 471 107.5 789 -90 973.1Net Acquisition of Financial Assets 351 425 452 315 347 452 479 885 906 1516 672 189 1229 1114 2270 2377 1071 121.9 6990 3647 91.7Net Incurrence of Liabilities 905 305 506 671 433 554 449 299 680 444 399 557 1715 1657 1428 1400 600 133.2 6201 3737 65.9
Jan-Dec2014 pQ1 Q2 Q3
Q4
Page 1 of 16

1 PHILIPPINES: BALANCE OF PAYMENTSfor periods indicatedin million U.S. dollars
Growth (%) Growth (%)
Jan Feb Mar Apr May Jun Jul Aug Sep Oct Nov Dec 2014 p 2013 r 2014 p 2014 p 2013 r 2014 p
Jan-Dec2014 pQ1 Q2 Q3
Q4
Portfolio Investment 2516 -72 367 -684 162 -127 -1037 -31 164 1276 101 -175 2811 -649 -903 1202 1118 7.5 2460 -1001 345.7Net Acquisition of Financial Assets 795 59 384 -358 332 558 -301 418 -361 253 632 46 1239 532 -245 930 -81 1246.8 2456 -638 485.2Net Incurrence of Liabilities -1720 132 17 326 170 684 735 449 -525 -1023 531 221 -1572 1181 659 -271 -1199 77.4 -3 363 -100.9
Financial Derivatives -20 10 -9 -13 12 -5 3 -3 10 -14 -11 -6 -19 -7 9 -31 -47 32.6 -48 -88 45.8Net Acquisition of Financial Assets -38 -16 -18 -22 -13 -15 -10 -29 -35 -37 -26 -18 -72 -50 -74 -81 -85 5.0 -277 -312 11.3Net Incurrence of Liabilities -18 -26 -9 -9 -25 -10 -13 -26 -44 -23 -15 -12 -53 -44 -83 -50 -39 -28.1 -229 -224 -2.2
Other Investment 1768 -591 617 406 -187 1675 568 -220 514 -947 694 2585 1793 1895 863 2332 426 448.0 6883 3410 101.9Net Acquisition of Financial Assets 1330 -456 974 -572 -56 1640 -428 576 -207 -9 1072 2952 1848 1011 -59 4016 1200 234.6 6817 3640 87.3Net Incurrence of Liabilities -438 135 357 -978 130 -36 -996 796 -721 938 379 367 55 -884 -921 1684 775 117.3 -66 230 -128.8
NET UNCLASSIFIED ITEMS -319 -1781 203 -703 -939 -446 -1145 -314 -406 -423 -759 1508 -1897 -2087 -1866 325 -90 463.0 -5525 -4202 -31.5
OVERALL BOP POSITION -4480 345 -340 -19 373 -24 501 114 98 24 -314 864 -4475 330 712 574 1260 -54.5 -2858 5085 -156.2(Totals as percent of GNI) -5.8 0.4 0.8 0.6 1.4 -0.8 1.6(Totals as percent of GDP) -7.0 0.5 1.0 0.7 1.7 -1.0 1.9
Debit: Change in Reserve Assets -4476 349 -336 -15 376 -42 504 117 102 28 -311 846 -4464 320 723 563 1250 -55.0 -2858 5085 -156.2
Credit: Change in Reserve Liabilities 4 3 4 4 3 -18 4 3 4 4 3 -18 11 -11 11 -11 -11 -0.9 0 0 -104.0
Use of Fund Credits 0 0 0 0 0 0 0 0 0 0 0 0 0 0 0 0 0 - 0 0 -
Short-term 4 3 4 4 3 -18 4 3 4 4 3 -18 11 -11 11 -11 -11 -0.9 0 0 -104.0
Memo Items:Change in Net Foreign Assets (NFA) of Deposit-taking
corporations, except the central bank 1902 -588 1081 85 -12 998 1445 436 -257 -549 46 1423 2394 1071 1625 921 -1083 185.0 6010 2040 194.6Change in Commercial Banks' (KBs) NFA 1877 -559 1072 84 6 1014 1414 407 -261 -523 78 1473 2390 1104 1560 1028 -1027 200.1 6082 2186 178.3Change in Thrift Banks' (TBs) NFA 25 -30 9 0 -27 -20 30 -7 14 -19 -28 -23 5 -48 37 -69 -26 -172.0 -75 -67 -12.4Change in Offshore Banking Units' (OBUs) NFA 0 0 -1 2 9 4 2 37 -10 -7 -4 -27 0 14 28 -38 -30 -27.7 4 -79 105.0
Personal Remittances 2007 1998 2095 2128 2199 2274 2288 2278 2334 2462 2346 2559 6100 6601 6900 7366 7028 4.8 26968 25369 6.3of which: OF Cash Remittances channeled thru the
banking system 1804 1800 1888 1918 1984 2054 2068 2057 2110 2228 2122 2317 5492 5956 6235 6666 6347 5.0 24348 22984 5.9
Details may not add up to total due to rounding.p Preliminaryr Revised to reflect data updates from official data sources and post-audit adjustments
Technical Notes:1. Balance of Payments Statistics from 2005 onwards are based on the IMF's Balance of Payments and International Investment Position Manual, 6th Edition.
2. Financial Account, including Reserve Assets, is calculated as the sum of net acquisitions of financial assets less net incurrence of liabilities.3. Balances in the current and capital accounts are derived by deducting debit entries from credit entries.4. Balances in the financial account are derived by deducting net incurrence of liabilities from net acquisition of financial assets.5. Negative values of Net Acquisition of Financial Assets indicate withdrawal/disposal of financial assets; negative values of Net
Incurrence of Liabilities indicate repayment of liabilities.6. Overall BOP position is calculated as the change in the country's net international reserves (NIR), less non-economic transactions
(revaluation and gold monetization/demonetization). Alternatively, it can be derived by adding the current and capital account balances less financial account plus net unclassified items.
7. Net unclassified items is an offsetting account to the overstatement or understatement in either receipts or payments of the recorded BOP components vis-à-vis the overall BOP position.
8. Data on Deposit-taking corporations, except the central bank, consist of transactions of commercial and thrift banks and offshore banking units (OBUs).
Page 2 of 16

2 GOODSfor periods indicatedin million U.S. dollars
Growth (%) Growth (%)Jan Feb Mar Apr May Jun Jul Aug Sep Oct Nov Dec 2014 p 2013 r 2014 p 2014 p 2013 r 2014 p
Goods -2913 -1132 -1369 -1959 -689 -456 -1226 -1319 -1076 -1273 -1342 -1096 -5414 -3104 -3621 -3711 -4847 23.4 -15851 -17662 10.3Exports 2842 3416 3896 4050 4915 4704 4101 4099 4395 3866 3873 3600 10154 13669 12595 11340 11203 1.2 47758 44512 7.3Imports 5755 4548 5265 6009 5604 5161 5327 5419 5471 5139 5215 4697 15568 16773 16216 15051 16051 -6.2 63609 62174 2.3 General Merchandise on a BOP basis -2953 -1166 -1410 -1987 -718 -463 -1252 -1333 -1086 -1289 -1350 -1111 -5529 -3167 -3672 -3750 -4945 24.2 -16117 -18016 10.5
General Merchandise Exports, fob 2802 3382 3855 4022 4886 4698 4075 4085 4384 3851 3866 3586 10039 13607 12544 11302 11106 1.8 47492 44158 7.5
Of which: Re-exports 15 16 9 6 19 97 8 17 8 10 75 4 39 122 33 88 31 186.9 282 194 45.0
General Merchandise Imports, fob 5755 4548 5265 6009 5604 5161 5327 5419 5471 5139 5215 4697 15568 16773 16216 15051 16051 -6.2 63609 62174 2.3
Net exports of goods under merchanting 5 2 6 4 5 4 4 3 4 3 2 2 13 13 11 8 15 -48.0 45 42 5.8Goods acquired under
merchanting (negative credits) 2 1 1 1 0 0 1 0 2 1 1 1 3 1 3 3 2 42.9 11 8 36.2Goods sold under merchanting 7 3 6 5 5 4 5 4 6 4 3 4 16 14 14 11 18 -36.6 56 50 10.8
Nonmonetary Gold 35 31 36 24 23 3 22 11 7 13 5 12 102 50 39 30 82 -63.2 222 312 -29.0Exports 35 31 36 24 23 3 22 11 7 13 5 12 102 50 39 30 82 -63.2 222 312 -29.0Imports 0 0 0 0 0 0 0 0 0 0 0 0 0 0 0 0 0 - 0 0 -
Details may not add up to total due to rounding.p Preliminaryr Revised to reflect post-audit adjustments
Jan-Dec2014 pQ1 Q2 Q3
Q4
Page 3 of 16

3 SERVICESfor periods indicatedin million U.S. dollars
Growth (%) Growth (%)Jan Feb Mar Apr May Jun Jul Aug Sep Oct Nov Dec 2014 p 2013 r 2014 p 2014 p 2013 r 2014 p
Services 753 782 291 126 -65 414 415 -11 544 774 578 274 1826 475 948 1625 1754 -7.3 4874 7015 -30.5Exports 2199 2231 1692 1877 1591 2055 2286 1825 2373 2586 2181 1938 6122 5524 6485 6706 5985 12.0 24837 23335 6.4Imports 1447 1450 1400 1752 1657 1641 1871 1836 1829 1813 1604 1664 4296 5049 5537 5080 4231 20.1 19963 16320 22.3
Maintenance and repair services n.i.e. 0 -14 -3 -3 -1 -1 1 -1 0 -1 -1 -2 -17 -5 0 -5 -61 91.3 -27 -189 85.8Exports 7 7 8 5 6 5 5 6 7 7 8 8 22 16 18 23 16 47.1 79 68 16.9Imports 7 22 11 8 7 6 4 6 7 9 9 10 39 21 17 28 76 -63.0 106 256 -58.8
Transport -166 -130 -139 -164 -133 -141 -187 -174 -215 -216 -145 -115 -435 -438 -575 -476 -410 -16.0 -1924 -1782 -8.0Exports 140 139 135 141 145 145 168 171 136 139 139 147 414 431 475 425 392 8.3 1744 1637 6.6Imports 306 269 273 305 278 286 355 345 351 356 284 262 849 869 1051 901 803 12.2 3669 3419 7.3
of which: Passenger 48 45 37 19 20 33 16 25 32 41 49 50 131 73 74 140 108 29.8 417 342 22.0Exports 92 89 78 79 74 76 60 68 72 78 80 85 260 230 200 244 222 9.5 934 909 2.8Imports 44 44 41 60 54 44 44 43 40 37 31 35 129 157 127 103 114 -9.6 517 567 -8.8
of which: Freight -180 -143 -147 -152 -128 -134 -162 -165 -209 -222 -171 -126 -470 -415 -536 -519 -414 -25.5 -1940 -1779 -9.1Exports 28 34 39 40 49 47 82 82 44 39 39 36 102 137 208 113 120 -5.4 560 521 7.4Imports 208 177 185 193 177 181 244 247 253 261 209 162 571 552 744 633 534 18.6 2500 2300 8.7
of which: Other -34 -32 -30 -31 -25 -40 -41 -33 -38 -35 -23 -39 -96 -96 -112 -97 -105 7.3 -402 -345 -16.3Exports 19 16 18 21 21 21 26 21 20 22 20 26 52 64 67 68 50 35.6 251 207 21.2Imports 53 48 47 52 47 61 66 55 59 58 43 64 148 160 180 165 155 6.6 653 552 18.1
Travel -156 -250 -211 -589 -502 -283 -653 -598 -658 -497 -380 -376 -616 -1375 -1909 -1253 -880 -42.5 -5153 -3143 -63.9Exports 536 433 422 413 401 448 363 383 267 361 361 379 1392 1262 1014 1101 1156 -4.8 4767 4690 1.7Imports 692 683 633 1002 903 731 1016 981 924 858 741 755 2008 2636 2922 2354 2035 15.7 9920 7833 26.6
Construction -5 -2 1 -4 -4 2 -1 -9 -3 2 0 -1 -6 -5 -13 0 -2 116.4 -24 11 -314.7Exports 2 1 6 4 2 7 6 4 4 5 3 3 8 13 14 11 14 -18.7 46 89 -48.4Imports 7 3 5 8 5 5 6 13 8 3 3 5 15 18 27 11 16 -31.7 70 77 -9.3
Insurance and pension services -56 -49 -50 -52 -50 -47 -62 -54 -60 -68 -74 -73 -156 -149 -176 -215 -161 -33.6 -696 -704 1.2Exports 6 6 12 6 7 7 13 20 13 12 13 13 25 20 45 37 28 32.8 127 101 26.5Imports 62 55 62 58 58 54 74 74 73 80 87 86 180 170 221 253 189 33.5 823 805 2.2
Financial Services -20 -19 -38 -16 -14 -21 -2 2 -9 -9 5 -6 -77 -51 -9 -11 -39 72.2 -147 -217 32.1Exports 5 6 4 10 8 8 17 17 30 20 26 23 14 26 64 69 36 89.7 172 85 103.5Imports 24 25 42 26 22 29 19 15 39 29 21 30 91 77 72 80 75 5.8 320 302 6.0
Explicitly charged and other financial services -9 -5 -2 -2 -5 -3 0 -1 11 -1 6 -10 -16 -10 9 -6 -2 -213.6 -23 -45 49.2Exports 2 4 3 3 2 2 3 3 18 7 14 2 9 7 24 23 12 87.9 63 38 65.7Imports 11 9 4 5 7 5 4 4 7 8 8 12 24 17 15 28 14 104.0 86 83 3.5
Financial intermediation services indirectly measured (FISIM) -11 -14 -36 -15 -9 -18 -1 3 -19 -8 -1 4 -61 -41 -17 -5 -37 85.9 -125 -172 27.6Exports 3 2 1 6 6 6 13 14 12 13 12 21 6 18 40 46 24 90.6 110 47 134.1Imports 14 15 37 21 15 24 15 11 31 21 13 17 66 60 57 51 61 -16.4 234 219 6.9
Jan-Dec2014 pQ1 Q2 Q3
Q4
Page 4 of 16

3 SERVICESfor periods indicatedin million U.S. dollars
Growth (%) Growth (%)Jan Feb Mar Apr May Jun Jul Aug Sep Oct Nov Dec 2014 p 2013 r 2014 p 2014 p 2013 r 2014 p
Jan-Dec2014 pQ1 Q2 Q3
Q4
Charges for the use of intellectual property n.i.e -38 -42 -34 -30 -30 -47 -47 -49 -60 -60 -48 -52 -114 -107 -156 -160 -130 -23.5 -537 -526 -2.1Exports 1 1 0 1 1 1 1 1 1 0 1 0 2 3 2 2 1 346.6 10 3 228.0Imports 38 43 34 31 31 48 47 50 61 60 50 53 116 110 158 163 130 24.8 547 529 3.3
Telecommunications, computer, andinformation services 257 415 188 136 48 214 255 130 442 351 88 315 859 397 827 754 594 27.1 2838 2809 1.0Exports 325 485 247 193 107 253 285 171 505 395 138 369 1057 553 961 902 733 23.0 3472 3336 4.1Imports 68 70 59 58 59 40 31 40 62 44 50 54 197 156 134 147 139 5.6 634 527 20.5
Telecommunication services 19 7 -21 -20 -20 0 10 1 12 -12 -4 3 5 -40 22 -12 64 -119.3 -25 259 -109.8Exports 65 57 19 16 20 23 22 15 37 13 25 36 141 59 74 75 115 -35.0 349 500 -30.2Imports 46 50 40 37 41 22 12 14 26 25 29 33 136 100 52 87 51 71.6 374 241 55.3
Computer services 238 408 210 156 68 213 246 130 431 363 93 312 855 437 807 768 530 44.9 2868 2553 12.3Exports 260 428 228 177 86 230 263 156 467 381 112 333 915 493 886 827 618 33.7 3121 2835 10.1Imports 22 20 18 21 18 17 18 26 36 18 20 20 60 56 80 58 88 -33.9 254 282 -10.1
Information services 0 0 0 0 0 0 -1 -1 0 -1 0 -1 -1 0 -2 -2 -1 -198.4 -4 -2 -87.0Exports 0 0 0 0 0 0 0 0 0 0 0 0 0 1 1 1 0 86.9 2 1 84.8Imports 0 1 0 0 0 0 1 1 1 1 1 1 1 1 2 2 1 161.8 7 4 86.3
Other business services 952 891 592 869 634 754 1130 760 1122 1285 1145 602 2435 2256 3012 3033 2881 5.3 10736 10941 -1.9Exports 1168 1144 845 1095 900 1169 1419 1043 1399 1632 1478 984 3157 3164 3861 4094 3576 14.5 14276 13208 8.1Imports 216 253 253 227 266 415 289 283 277 346 332 382 722 908 850 1061 695 52.7 3540 2267 56.2
Research and development services 0 0 0 -1 3 0 2 -2 5 -2 4 6 0 2 5 7 -6 222.5 14 -32 143.4Exports 2 4 3 6 5 3 5 3 9 5 6 9 9 14 17 20 5 275.6 59 15 296.3Imports 2 4 3 7 2 3 3 5 4 8 2 3 9 12 12 12 11 9.0 45 47 -2.5
Professional and managementconsulting services -6 -1 -4 -10 -8 -7 -7 -5 -3 -5 -2 -1 -12 -25 -15 -7 -11 34.7 -59 -42 -39.7Exports 3 3 2 3 2 2 3 4 4 4 4 9 8 7 11 17 14 21.5 44 41 6.1Imports 10 4 7 12 10 9 10 9 8 9 5 10 20 32 27 24 25 -3.7 102 83 23.0
Technical, trade-related, and other business services 1/
958 892 597 879 638 761 1135 767 1120 1293 1143 597 2446 2279 3022 3033 2899 4.6 10781 11014 -2.1Exports 1162 1138 840 1087 892 1164 1412 1036 1386 1623 1468 967 3140 3143 3833 4057 3557 14.1 14173 13151 7.8Imports 204 246 243 207 254 402 276 269 266 330 325 370 693 864 811 1024 658 55.6 3392 2137 58.7
Personal, cultural, and recreational services 7 4 7 3 9 6 2 4 6 10 10 5 18 18 13 25 18 38.7 74 63 16.4Exports 10 8 11 8 13 11 8 10 10 15 15 9 28 33 28 39 30 27.9 128 107 19.9Imports 3 3 4 6 4 5 6 6 4 5 4 4 10 15 16 14 12 11.7 54 44 25.0
Audiovisual and related services 3 3 3 3 5 4 2 2 2 5 3 2 8 12 6 10 7 41.5 36 44 -17.7Exports 4 4 4 4 5 6 4 4 4 8 5 3 11 15 11 16 13 19.1 54 66 -19.0Imports 1 1 1 1 1 1 1 2 2 2 2 2 3 3 5 6 7 -4.6 17 22 -21.6
Other personal, cultural, and recreational services 4 2 4 -1 5 2 0 2 4 5 7 3 10 6 6 15 11 37.0 37 19 94.9
Exports 5 4 7 4 8 6 5 7 6 8 9 6 17 18 17 23 17 34.9 75 41 83.0Imports 2 2 3 5 3 4 5 4 2 3 2 2 7 12 11 7 6 30.7 37 22 72.5
Government goods and services n.i.e. -22 -22 -22 -22 -22 -22 -22 -22 -22 -22 -22 -22 -66 -66 -66 -66 -56 -18.1 -265 -248 -6.7Exports 1 1 1 1 1 1 1 1 1 1 1 1 3 3 3 3 3 -0.2 14 14 0.5Imports 23 23 23 23 23 23 23 23 23 23 23 23 70 70 70 70 60 17.1 279 262 6.4
1/ Includes manufacturing services on physical inputs owned by othersDetails may not add up to total due to rounding.p Preliminaryr Revised to reflect post-audit adjustments and revised data from official sources
Page 5 of 16

4 PRIMARY INCOMEfor periods indicatedin million U.S. dollars
Growth (%) Growth (%)Jan Feb Mar Apr May Jun Jul Aug Sep Oct Nov Dec 2014 p 2013 r 2014 p 2014 p 2013 r 2014 p
Primary Income 67 281 -283 97 143 -20 112 172 -14 259 250 7 66 220 270 516 303 70.5 1071 957 11.9Receipts 708 761 708 780 745 724 773 744 800 815 730 757 2177 2249 2317 2303 2157 6.8 9046 8358 8.2Payments 641 479 991 683 603 744 661 572 814 557 480 750 2111 2029 2047 1787 1854 -3.6 7974 7401 7.7
Compensation of employees 596 599 593 609 631 604 645 617 638 657 582 612 1788 1843 1900 1851 1797 3.0 7382 6874 7.4Receipts 606 611 603 623 644 613 656 625 648 665 599 623 1821 1880 1929 1886 1831 3.0 7516 7039 6.8Payments 9 13 11 14 12 10 10 8 10 9 17 11 33 37 28 36 34 5.5 133 165 -19.0
Investment income -529 -318 -876 -512 -489 -623 -533 -445 -652 -398 -332 -605 -1722 -1624 -1630 -1335 -1494 10.7 -6311 -5917 -6.7Receipts 103 149 104 157 102 111 117 119 152 150 132 134 356 369 389 416 326 27.7 1530 1320 16.0Payments 631 467 980 668 590 734 651 564 803 548 464 739 2078 1993 2019 1751 1820 -3.8 7841 7236 8.4
Direct investment -175 -253 -366 -331 -185 -483 -196 -261 -414 -198 -242 -449 -793 -998 -871 -889 -1040 14.5 -3552 -2962 -19.9Receipts 41 44 40 91 42 46 45 52 83 62 55 57 126 179 180 174 132 32.3 659 556 18.6Payments 216 297 406 422 227 529 241 313 497 260 297 506 919 1178 1051 1064 1171 -9.2 4211 3518 19.7
Income on equity and investment fund shares -201 -279 -390 -349 -200 -508 -220 -294 -445 -227 -281 -487 -870 -1058 -959 -995 -1096 9.2 -3882 -3279 -18.4Receipts 13 16 11 61 12 15 12 16 46 21 12 13 40 88 74 47 51 -8.7 249 182 36.7Payments 214 295 401 411 212 523 232 310 491 248 294 500 910 1146 1033 1042 1148 -9.2 4130 3460 19.4
Dividends and withdrawals fromincome of quasi-corporations -90 -221 -331 -281 -149 -440 -171 -245 -392 -173 -242 -439 -643 -870 -809 -854 -995 14.1 -3176 -2972 -6.9Receipts 3 6 3 51 2 7 2 6 37 12 2 5 11 60 46 19 22 -12.0 136 69 98.5Payments 93 227 334 332 151 447 173 251 430 185 244 444 654 930 854 873 1016 -14.1 3312 3040 8.9
Direct investor in direct investmententerprises -90 -221 -331 -281 -149 -440 -171 -245 -392 -173 -242 -439 -643 -870 -809 -854 -995 14.1 -3176 -2972 -6.9Receipts 3 6 3 51 2 7 2 6 37 12 2 5 11 60 46 19 22 -12.0 136 69 98.5Payments 93 227 334 332 151 447 173 251 430 185 244 444 654 930 854 873 1016 -14.1 3312 3040 8.9
Reinvested earnings -110 -59 -58 -68 -52 -68 -48 -49 -53 -53 -40 -48 -227 -188 -151 -141 -102 -38.4 -706.19 -307 -130.1Receipts 10 10 9 10 10 8 10 10 8 10 10 8 28 28 28 28 30 -6.2 112.42 113 -0.7Payments 120 69 67 78 62 76 58 59 61 63 50 56 256 215 179 169 131 28.2 818.61 420 94.8
Interest 26 27 24 19 15 25 24 33 31 29 40 37 77 59 88 106 56 87.4 330 316 4.3Receipts 28 29 29 30 30 31 33 36 37 41 43 44 86 91 106 127 80 58.5 411 374 9.8Payments 3 2 5 11 15 6 9 3 6 12 3 7 9 32 18 22 24 -9.5 81 57 40.3
Direct investor in direct investment enterprises 26 27 24 19 15 25 24 33 31 29 40 37 77 59 88 106 56 87.4 330 316 4.3Receipts 28 29 29 30 30 31 33 36 37 41 43 44 86 91 106 127 80 58.5 411 374 9.8Payments 3 2 5 11 15 6 9 3 6 12 3 7 9 32 18 22 24 -9.5 81 57 40.3
Memorandum: Interest before FISIM 24 26 20 10 15 22 18 33 27 20 39 34 69 46 78 93 41 124.5 286 283 1.0Receipts 28 29 29 30 30 31 33 36 37 41 43 44 86 91 106 127 80 58.5 411 374 9.8Payments 5 3 9 20 16 9 16 4 9 21 4 10 17 45 29 35 39 -11.4 125 91 37.6
Jan-Dec2014 pQ1 Q2 Q3
Q4
Page 6 of 16

4 PRIMARY INCOMEfor periods indicatedin million U.S. dollars
Growth (%) Growth (%)Jan Feb Mar Apr May Jun Jul Aug Sep Oct Nov Dec 2014 p 2013 r 2014 p 2014 p 2013 r 2014 p
Jan-Dec2014 pQ1 Q2 Q3
Q4
Portfolio investment -383 -145 -527 -198 -322 -151 -371 -226 -254 -231 -119 -170 -1055 -671 -850 -520 -495 -5.1 -3096 -3102 0.2Receipts 9 6 7 12 6 7 10 7 8 22 11 12 21 25 25 45 22 101.1 117 99 17.4Payments 392 151 534 210 329 157 381 233 262 253 130 182 1076 696 875 565 517 9.3 3213 3202 0.3
Income on equity and investment fund shares -1 -86 -345 -55 -186 -79 -57 -117 -90 -38 -32 -20 -433 -320 -264 -90 -82 -10.2 -1108 -982 -12.8Receipts 0 0 0 0 0 0 0 0 0 0 0 0 0 0 0 0 0 -73.1 0 1 -76.7Payments 1 86 345 55 186 79 57 117 90 38 32 20 433 320 264 90 82 10.0 1108 982 12.8
Dividends on equity excludinginvestment fund shares -1 -86 -345 -55 -186 -79 -57 -117 -90 -38 -32 -20 -433 -320 -264 -90 -82 -10.2 -1108 -982 -12.8Receipts 0 0 0 0 0 0 0 0 0 0 0 0 0 0 0 0 0 -73.1 0 1 -76.7Payments 1 86 345 55 186 79 57 117 90 38 32 20 433 320 264 90 82 10.0 1108 982 12.8
Central Bank 0 0 0 0 0 0 0 0 0 0 0 0 0 0 0 0 0 - 0 0 -Receipts 0 0 0 0 0 0 0 0 0 0 0 0 0 0 0 0 0 - 0 0 -Payments 0 0 0 0 0 0 0 0 0 0 0 0 0 0 0 0 0 - 0 0 -
Deposit-taking corporations, except the central bank 0 -7 -2 0 -27 -40 -28 0 -18 -5 0 -8 -9 -67 -46 -13 -37 65.8 -135 -92 -47.0Receipts 0 0 0 0 0 0 0 0 0 0 0 0 0 0 0 0 0 - 0 0 -Payments 0 7 2 0 27 40 28 0 18 5 0 8 9 67 46 13 37 -65.8 135 92 47.0
General Government 0 0 0 0 0 0 0 0 0 0 0 0 0 0 0 0 0 - 0 0 -Receipts 0 0 0 0 0 0 0 0 0 0 0 0 0 0 0 0 0 - 0 0 -Payments 0 0 0 0 0 0 0 0 0 0 0 0 0 0 0 0 0 - 0 0 -
Other Sectors -1 -79 -344 -55 -159 -39 -29 -117 -72 -33 -32 -12 -423 -253 -218 -78 -45 -73.3 -973 -890 -9.3Receipts 0 0 0 0 0 0 0 0 0 0 0 0 0 0 0 0 0 -73.1 0 1 -76.7Payments 1 79 344 55 159 39 29 117 72 33 32 12 424 253 219 78 45 72.9 973 891 9.2
Interest -382 -59 -181 -143 -136 -72 -313 -109 -164 -193 -87 -150 -622 -350 -586 -430 -413 -4.1 -1988 -2121 6.2Receipts 9 6 7 12 6 6 10 7 8 22 11 12 21 25 25 45 22 102.0 116 99 18.1Payments 391 65 188 155 143 78 323 116 172 214 98 162 644 375 611 475 435 9.1 2105 2219 -5.2
Short-term -35 -16 -21 -11 -19 -17 -31 -17 -20 -16 -14 -19 -72 -47 -68 -49 -84 40.9 -237 -392 39.5Receipts 0 0 0 0 0 0 0 0 0 0 0 0 0 0 0 0 0 -99.4 0 1 -98.1Payments 35 16 21 11 19 17 31 17 20 16 14 19 72 47 68 49 84 -40.9 237 393 -39.6
Central Bank 0 0 0 0 0 0 0 0 0 0 0 0 0 0 0 0 0 - 0 0 -Receipts 0 0 0 0 0 0 0 0 0 0 0 0 0 0 0 0 0 - 0 0 -Payments 0 0 0 0 0 0 0 0 0 0 0 0 0 0 0 0 0 - 0 0 -
Deposit-taking corporations, except the central bank 0 0 0 0 0 0 0 0 0 0 0 0 0 0 0 0 0 - 0 0 -Receipts 0 0 0 0 0 0 0 0 0 0 0 0 0 0 0 0 0 - 0 0 -Payments 0 0 0 0 0 0 0 0 0 0 0 0 0 0 0 0 0 - 0 0 -
General Government -35 -16 -21 -11 -19 -17 -31 -17 -20 -9 -14 -19 -72 -47 -68 -42 -84 49.2 -230 -392 41.4Receipts 0 0 0 0 0 0 0 0 0 0 0 0 0 0 0 0 0 - 0 0 -Payments 35 16 21 11 19 17 31 17 20 9 14 19 72 47 68 42 84 -49.2 230 392 -41.4
Other Sectors 0 0 0 0 0 0 0 0 0 -7 0 0 0 0 0 -7 0 -6254.4 -7 0 -1679.0Receipts 0 0 0 0 0 0 0 0 0 0 0 0 0 0 0 0 0 -99.4 0 1 -98.1Payments 0 0 0 0 0 0 0 0 0 7 0 0 0 0 0 7 0 4014.4 7 0 4014.4
Page 7 of 16

4 PRIMARY INCOMEfor periods indicatedin million U.S. dollars
Growth (%) Growth (%)Jan Feb Mar Apr May Jun Jul Aug Sep Oct Nov Dec 2014 p 2013 r 2014 p 2014 p 2013 r 2014 p
Jan-Dec2014 pQ1 Q2 Q3
Q4
Long-term -348 -42 -160 -131 -117 -55 -282 -92 -144 -176 -73 -131 -550 -303 -518 -380 -329 -15.6 -1751 -1729 -1.3Receipts 9 6 7 12 6 6 10 7 8 22 11 12 21 25 25 45 22 102.6 116 98 18.8Payments 356 48 167 143 124 61 292 99 152 198 84 143 571 328 543 425 351 21.1 1868 1827 2.2
Central Bank 0 0 0 0 0 -7 0 0 0 0 0 -13 0 -7 0 -13 -13 -2.2 -20 -20 -1.4Receipts 0 0 0 0 0 0 0 0 0 0 0 0 0 0 0 0 0 - 0 0 -Payments 0 0 0 0 0 7 0 0 0 0 0 13 0 7 0 13 13 2.2 20 20 1.4
Deposit-taking corporations, except the central bank -5 -13 -10 -7 0 0 -5 -13 -10 -6 0 0 -27 -7 -28 -6 -7 6.3 -68 -60 -13.4Receipts 0 0 0 0 0 0 0 0 0 0 0 0 0 0 0 0 0 - 0 0 -Payments 5 13 10 7 0 0 5 13 10 6 0 0 27 7 28 6 7 -6.3 68 60 13.4
General Government -335 -11 -128 -76 -13 -34 -270 -61 -113 -131 -19 -61 -474 -123 -444 -211 -157 -34.3 -1251 -1247 -0.3Receipts 0 0 0 0 0 0 0 0 0 0 0 0 0 0 0 0 0 - 0 0 -Payments 335 11 128 76 13 34 270 61 113 131 19 61 474 123 444 211 157 34.3 1251 1247 0.3
Other Sectors -9 -19 -22 -48 -104 -13 -7 -18 -21 -39 -55 -56 -49 -166 -46 -150 -152 1.6 -411 -401 -2.5Receipts 9 6 7 12 6 6 10 7 8 22 11 12 21 25 25 45 22 102.6 116 98 18.8Payments 17 24 29 61 110 20 17 25 29 61 65 69 71 191 71 195 175 11.6 528 499 5.7
Other investment -16 38 -31 -26 -24 -37 -16 -6 -31 -21 -22 -35 -10 -88 -53 -79 -102 22.6 -230 -424 45.8Receipts 8 56 9 11 10 11 13 13 14 14 14 15 73 32 39 44 30 46.4 188 93 102.2Payments 24 19 41 37 35 48 29 18 45 36 36 51 83 120 92 123 132 -6.9 417 517 -19.2
Interest -16 38 -31 -26 -24 -37 -16 -6 -31 -21 -22 -35 -10 -88 -53 -79 -102 22.6 -230 -424 45.8Receipts 8 56 9 11 10 11 13 13 14 14 14 15 73 32 39 44 30 46.4 188 93 102.2Payments 24 19 41 37 35 48 29 18 45 36 36 51 83 120 92 123 132 -6.9 417 517 -19.2
Central Bank 0 0 0 0 0 0 0 0 0 0 0 0 0 0 0 0 0 33.5 -1 -1 -27.3Receipts 0 0 0 0 0 0 0 0 0 0 0 0 0 0 0 0 0 - 0 0 -Payments 0 0 0 0 0 0 0 0 0 0 0 0 0 0 0 0 0 -33.5 1 1 27.3
Deposit-taking corporations, except the central bank 2 51 2 5 6 -3 7 6 5 6 8 1 55 7 18 15 5 219.1 95 6 1372.8Receipts 6 54 7 8 8 9 10 10 11 11 11 13 67 25 32 35 22 57.4 160 65 145.0Payments 3 4 6 4 2 12 3 4 6 5 4 12 13 18 14 20 18 13.0 64 59 9.8
General Government -9 -9 -16 -16 -20 -20 -9 -9 -17 -15 -21 -27 -35 -56 -35 -63 -62 -2.0 -189 -234 19.3Receipts 0 0 0 0 0 0 0 0 0 0 0 0 0 0 0 0 0 - 0 0 -Payments 9 9 16 16 20 20 9 9 17 15 21 27 35 56 35 63 62 2.0 189 234 -19.3
Other Sectors -9 -4 -17 -15 -9 -14 -14 -2 -19 -13 -9 -9 -30 -38 -36 -31 -45 30.5 -134 -195 31.1Receipts 2 2 2 2 2 2 2 2 2 3 3 3 6 7 7 8 7 13.2 28 28 1.8Payments 11 6 19 17 12 16 16 5 22 16 11 12 35 45 43 39 52 -24.3 162 223 -27.0
Memorandum: Interest before FISIM -23 27 -60 -29 -29 -48 -8 1 -44 -18 -20 -25 -56 -106 -52 -63 -117 46.2 -277 -547 49.4Receipts 10 57 10 17 17 17 26 26 26 27 26 37 77 51 78 89 54 66.7 296 136 117.6Payments 32 30 70 46 46 66 35 25 70 44 46 62 133 158 130 152 170 -10.6 572 682 -16.1
Investment income attributable to policyholdersin insurance, pension schemes, and standardized guarentee schemes 0 0 0 0 0 0 0 0 0 0 0 0 0 0 0 0 0 - 0 0 -
Reserve assets 45 43 48 43 43 47 49 48 47 52 51 50 136 133 144 153 142 7.9 567 572 -0.9Receipts 45 43 48 43 43 47 49 48 47 52 51 50 136 133 144 153 142 7.9 567 572 -0.9
Interest 45 43 48 43 43 47 49 48 47 52 51 50 136 133 144 153 142 7.9 567 572 -0.9Receipts 45 43 48 43 43 47 49 48 47 52 51 50 136 133 144 153 142 7.9 567 572 -0.9
Memorandum: Interest before FISIM 45 43 48 43 43 47 49 48 47 52 51 50 136 133 144 153 142 7.9 567 572 -0.9Receipts 45 43 48 43 43 47 49 48 47 52 51 50 136 133 144 153 142 7.9 567 572 -0.9
Other primary income 0 0 0 0 0 0 0 0 0 0 0 0 0 0 0 0 0 - 0 0 -
Details may not add up to total due to rounding.p Preliminaryr Revised to reflect post-audit adjustments, additional data from the results of the Coordinated Direct Investment Survey particularly on reinvested earnings, and updates from BSP-IOD's MLT Loans Transactions Report
Page 8 of 16

5 SECONDARY INCOMEfor periods indicatedin million U.S. dollars
Growth (%) Growth (%)Jan Feb Mar Apr May Jun Jul Aug Sep Oct Nov Dec 2014 p 2013 r 2014 p 2014 p 2013 r 2014 p
Secondary Income 1634 1654 1730 1765 1817 1917 1899 1910 1960 2066 2008 2198 5017 5498 5769 6271 6077 3.2 22556 21073 7.0Receipts 1699 1699 1794 1819 1872 1950 1958 1979 2015 2116 2067 2271 5192 5641 5951 6454 6213 3.9 23238 21680 7.2Payments 65 46 64 54 55 33 58 70 55 51 59 73 175 142 183 183 136 33.8 682 606 12.5
General government 61 65 63 68 61 67 66 66 72 65 69 73 188 197 204 207 318 -34.9 796 859 -7.3Receipts 68 70 70 76 66 71 70 69 75 69 71 76 207 212 214 216 326 -33.8 849 908 -6.5Payments 7 5 7 7 5 3 4 3 3 3 3 3 19 16 10 9 9 6.1 54 50 8.3
Financial corporations, nonfinancial corporations,households, and NPISHs 1572 1589 1667 1697 1756 1849 1833 1844 1888 2000 1939 2125 4829 5302 5565 6065 5759 5.3 21760 20215 7.6Receipts 1631 1630 1724 1743 1806 1879 1888 1910 1940 2048 1995 2195 4985 5428 5738 6238 5887 6.0 22389 20771 7.8Payments 58 40 57 46 50 30 55 66 52 47 56 70 156 127 173 173 128 35.6 628 557 12.9
Personal Transfers 1513 1500 1602 1619 1671 1774 1754 1769 1805 1921 1859 2051 4615 5064 5328 5830 5530 5.4 20838 19633 6.1Receipts 1517 1504 1606 1624 1679 1778 1758 1773 1809 1924 1861 2055 4627 5081 5340 5841 5546 5.3 20888 19678 6.1Payments 4 3 4 4 8 4 4 3 4 3 3 4 12 17 12 10 16 -37.3 50 46 10.5
Of which: Workers' remittances 1470 1461 1563 1580 1636 1736 1717 1730 1769 1883 1822 2014 4495 4952 5215 5719 5417 5.6 20380 19289 5.7Receipts 1470 1461 1563 1580 1636 1736 1717 1730 1769 1883 1822 2014 4495 4952 5215 5719 5417 5.6 20380 19289 5.7Payments 0 0 0 0 0 0 0 0 0 0 0 0 0 0 0 0 0 - 0 0 -
Other current transfers 59 89 65 77 85 75 80 74 83 79 80 75 214 238 237 234 230 2.1 923 582 58.5Receipts 114 126 118 119 127 101 130 137 130 123 134 140 358 348 398 398 341 16.5 1501 1093 37.3Payments 55 37 53 42 42 26 50 63 48 44 54 65 144 110 161 163 112 46.3 578 511 13.1
Details may not add up to total due to rounding.p Preliminaryr Revised to reflect data updates from Organization for Economic Cooperation and Development's (OECD) Report on Grants to the Philippines
Jan-Dec2014 pQ1 Q2 Q3
Q4
Page 9 of 16

6 CAPITAL ACCOUNTfor periods indicatedin million U.S. dollars
Growth (%) Growth (%)Jan Feb Mar Apr May Jun Jul Aug Sep Oct Nov Dec 2014 p 2013 r 2014 p 2014 p 2013 r 2014 p
Capital Account 8 9 9 8 8 9 9 8 5 8 9 10 26 26 22 28 32 -13.7 101 134 -24.1Receipts 9 9 9 9 9 10 10 9 9 9 10 11 28 28 28 30 38 -19.3 114 151 -24.6Payments 1 1 0 1 1 1 1 0 5 1 1 1 2 2 6 3 6 -51.3 13 18 -28.0
Gross acquisitions /disposals of nonproducednonfinancial assets 0 0 0 0 0 0 1 0 -4 -1 0 1 0 0 -4 1 -1 223.7 -4 -6 39.0Receipts 0 0 0 0 0 1 1 0 0 0 1 2 1 1 1 3 2 79.5 7 4 88.4Payments 1 1 0 1 0 0 1 0 5 1 1 1 2 1 5 3 3 -6.5 11 10 8.4
Capital transfers 8 9 9 9 8 9 9 9 9 9 9 9 26 26 27 27 33 -18.6 105 140 -24.8Receipts 9 9 9 9 9 9 9 9 9 9 9 9 27 27 27 27 36 -24.6 107 148 -27.4Payments 0 0 0 0 1 0 0 0 0 0 0 0 0 1 0 0 3 -91.6 2 8 -76.2
General government 9 9 9 9 9 9 9 9 9 9 9 9 26 26 26 27 34 -21.2 105 133 -20.8Receipts 9 9 9 9 9 9 9 9 9 9 9 9 26 26 26 27 34 -21.2 105 133 -20.8Payments 0 0 0 0 0 0 0 0 0 0 0 0 0 0 0 0 0 - 0 0 -
Debt forgiveness 0 0 0 0 0 0 0 0 0 0 0 0 0 0 0 0 0 - 0 0 -Receipts 0 0 0 0 0 0 0 0 0 0 0 0 0 0 0 0 0 - 0 0 -Payments 0 0 0 0 0 0 0 0 0 0 0 0 0 0 0 0 0 - 0 0 -
Other capital transfers 9 9 9 9 9 9 9 9 9 9 9 9 26 26 26 27 34 -21.2 105 133 -20.8Receipts 9 9 9 9 9 9 9 9 9 9 9 9 26 26 26 27 34 -21.2 105 133 -20.8Payments 0 0 0 0 0 0 0 0 0 0 0 0 0 0 0 0 0 - 0 0 -
Financial corporations, nonfinancial corporations, households, and NPISHs 0 0 0 0 0 0 0 0 0 0 0 0 0 0 0 0 -1 104.3 0 7 -96.0Receipts 0 0 0 0 0 1 0 0 0 0 0 0 1 1 0 0 2 -84.8 2 15 -86.0Payments 0 0 0 0 1 0 0 0 0 0 0 0 0 1 0 0 3 -91.6 2 8 -76.2
Debt forgiveness 0 0 0 0 0 0 0 0 0 0 0 0 0 0 0 0 0 - 0 0 -Receipts 0 0 0 0 0 0 0 0 0 0 0 0 0 0 0 0 0 - 0 0 -Payments 0 0 0 0 0 0 0 0 0 0 0 0 0 0 0 0 0 - 0 0 -
Other capital transfers 0 0 0 0 0 0 0 0 0 0 0 0 0 0 0 0 -1 104.3 0 7 -96.0Receipts 0 0 0 0 0 1 0 0 0 0 0 0 1 1 0 0 2 -84.8 2 15 -86.0Payments 0 0 0 0 1 0 0 0 0 0 0 0 0 1 0 0 3 -91.6 2 8 -76.2
Details may not add up to total due to rounding.p Preliminaryr Reflect data updates from OECD's Report on Grants to the Philippines
Jan-Dec2014 pQ1 Q2 Q3
Q4
Page 10 of 16

7 DIRECT INVESTMENTfor periods indicatedin million U.S. dollars
Growth (%) Growth (%)Jan Feb Mar Apr May Jun Jul Aug Sep Oct Nov Dec 2014 p 2013 r 2014 p 2014 p 2013 r 2014 p
Direct Investment -553 121 -54 -356 -85 -102 29 586 226 1072 273 -367 -487 -543 842 977 471 107.5 789 -90 973.1
Net Acquisition of Financial Assets 351 425 452 315 347 452 479 885 906 1516 672 189 1229 1114 2270 2377 1071 121.9 6990 3647 91.7
Equity and investment fund shares 35 126 58 92 48 27 246 564 176 999 539 91 219 167 986 1629 245 564.8 3001 978 206.8
Equity other than reinvestment of earnings 25 116 49 82 38 19 237 554 167 989 530 83 190 139 958 1601 215 644.1 2888 865 233.9Direct investor in direct investment
enterprises 25 116 49 82 38 19 237 554 167 989 530 83 190 139 958 1601 215 644.1 2888 865 233.9Placements 26 122 53 84 45 23 277 658 245 1047 547 95 201 153 1179 1689 226 648.2 3222 921 249.7Withdrawals 2 6 4 2 8 4 40 104 77 58 17 12 11 14 221 88 11 732.0 334 57 490.3
Reinvestment of earnings 10 10 9 10 10 8 10 10 8 10 10 8 28 28 28 28 30 -6.2 112 113 -0.7
Debt instruments 317 299 394 223 300 425 232 321 731 517 133 99 1010 947 1284 748 826 -9.4 3989 2669 49.5
Direct investor in direct investment enterprises 290 239 291 200 246 427 224 238 664 490 57 169 819 873 1126 717 610 17.5 3535 1911 84.9
Direct investment enterprises in direct investor 27 60 104 23 54 -2 8 83 66 27 75 -70 191 75 158 32 216 -85.4 455 757 -40.0
Net Incurrence of Liabilities 905 305 506 671 433 554 449 299 680 444 399 557 1715 1657 1428 1400 600 133.2 6201 3737 65.9
Equity and investment fund shares 321 132 356 90 136 130 163 240 222 277 251 537 809 355 625 1065 153 597.8 2854 1084 163.3
Equity other than reinvestment of earnings 201 63 289 11 75 54 105 180 161 213 201 482 553 140 446 896 21 4144.5 2035 664 206.7Direct investor in direct investment
enterprises 201 63 289 11 75 54 105 180 161 213 201 482 553 140 446 896 21 4144.5 2035 664 206.7Placements 368 94 409 90 86 78 121 188 178 217 216 567 871 255 488 1000 250 299.6 2613 2461 6.2Withdrawals 167 31 120 79 12 24 16 8 17 4 14 86 318 115 41 104 229 -54.7 578 1797 -67.8
Reinvestment of earnings 120 69 67 78 62 76 58 59 61 63 50 56 256 215 179 169 131 28.2 819 420 94.8
Debt instruments 584 173 150 582 296 424 286 59 458 168 148 19 907 1302 803 335 448 -25.2 3347 2654 26.1
Direct investor in direct investment enterprises 584 173 150 507 296 424 286 59 458 168 148 19 907 1227 803 335 448 -25.2 3272 1954 67.5
Direct investment enterprises in direct investor 0 0 0 75 0 0 0 0 0 0 0 0 0 75 0 0 0 - 75 700 -89.3
Details may not add up to total due to rounding.p Preliminaryr Post-audit adjustments; include updates from BSP-IOD's MLT Loans Transactions Report; and additional data from the results of the CDIS
Jan-Dec2014 pQ1 Q2 Q3
Q4
Page 11 of 16

8 PORTFOLIO INVESTMENTfor periods indicatedin million U.S. dollars
Growth (%) Growth (%)Jan Feb Mar Apr May Jun Jul Aug Sep Oct Nov Dec 2014 p 2013 2014 p 2014 p 2013 2014 p
Portfolio Investment 2516 -72 367 -684 162 -127 -1037 -31 164 1276 101 -175 2811 -649 -903 1202 1118 7.5 2460 -1001 345.7
Net Acquisition of Financial Assets 795 59 384 -358 332 558 -301 418 -361 253 632 46 1239 532 -245 930 -81 1246.8 2456 -638 485.2
Equity and investment fund shares 19 24 66 27 22 26 16 6 3 6 7 3 110 75 25 16 10 56.0 225 68 229.7
Central Bank 0 0 50 0 0 0 0 0 0 0 0 0 50 0 0 0 0 - 50 0 -Deposit-taking corporations, except
the central bank 0 0 -4 4 0 0 0 0 -3 0 0 0 -4 4 -3 0 0 -1215.6 -3 0 -1729.1Other sectors 19 24 20 23 22 26 16 6 5 6 7 3 64 71 27 17 10 58.2 178 69 160.0
Debt Securities 776 35 318 -384 310 531 -318 412 -364 247 625 43 1129 457 -270 914 -92 1098.5 2231 -706 415.9
Central bank 0 0 0 0 305 0 0 0 0 0 171 0 0 305 0 171 4 3750.6 476 4 10618.2Deposit-taking corporations, except
the central bank 505 -243 430 -356 216 329 -331 470 -426 242 466 69 692 190 -288 777 -251 409.9 1371 -1252 209.5Short-term 172 -252 338 -355 189 219 13 459 -438 246 463 -282 258 53 35 427 -223 291.4 773 -723 206.9Long-term 333 9 92 0 27 110 -344 11 11 -4 2 351 434 137 -322 350 -27 1373.3 598 -530 212.9
Other sectors 271 278 -112 -29 -211 202 13 -58 63 5 -12 -27 437 -37 18 -34 155 -121.8 384 542 -29.0Short-term 248 215 -123 -117 -275 134 19 -12 82 28 -31 -25 340 -258 89 -28 20 -238.9 143 291 -50.8Long-term 24 63 11 88 64 68 -5 -46 -19 -23 19 -2 97 220 -70 -6 135 -104.5 241 250 -3.7
Net Incurrence of Liabilities -1720 132 17 326 170 684 735 449 -525 -1023 531 221 -1572 1181 659 -271 -1199 77.4 -3 363 -100.9
Equity and investment fund shares -109 130 329 381 350 50 13 301 -1 -539 594 -304 351 781 312 -249 -464 46.3 1196 -34 3611.0
Deposit-taking corporations, exceptthe central bank 31 61 54 84 77 8 -44 4 14 -7 44 -71 146 169 -26 -34 -54 37.3 255 -287 188.9Placements 359 321 344 347 476 329 297 287 377 283 306 191 1024 1152 961 780 777 0.4 3917 4286 -8.6Withdrawals 328 261 290 263 398 321 341 283 364 289 262 263 879 983 988 814 831 -2.0 3662 4573 -19.9
Other sectors -139 70 275 297 272 43 57 296 -15 -532 550 -233 205 612 339 -215 -410 47.5 941 253 272.3Placements 1229 1456 1997 1589 1902 1460 1458 2313 1725 1545 2172 1273 4682 4951 5495 4991 5608 -11.0 20120 25326 -20.6Withdrawals 1368 1387 1722 1292 1630 1417 1401 2016 1740 2077 1622 1506 4477 4340 5157 5206 6017 -13.5 19179 25074 -23.5
Debt Securities -1612 1 -312 -54 -179 634 722 148 -524 -485 -63 525 -1923 400 346 -22 -736 97.0 -1199 397 -401.7
Central bank 0 -1 0 0 0 3 1 3 -1 -1 0 2 -1 3 3 1 0 - 6 9 -33.3Short-term 0 0 0 0 0 0 0 0 0 0 0 0 0 0 0 0 0 - 0 0 -Long-term 0 -1 0 0 0 3 1 3 -1 -1 0 2 -1 3 3 1 0 - 6 9 -33.3
Deposit-taking corporations, exceptthe central bank 15 11 -14 11 11 10 1 0 -97 -23 10 15 12 32 -96 2 11 -84.0 -50 -42 -18.0Short-term 0 0 0 0 0 0 0 0 0 0 0 0 0 0 0 0 0 - 0 0 -Long-term 15 11 -14 11 11 10 1 0 -97 -23 10 15 12 32 -96 2 11 -84.0 -50 -42 -18.0
General government -1901 -118 -294 -167 83 304 612 142 -201 -386 -111 504 -2313 220 554 6 -774 100.8 -1533 193 -894.8Short-term -1740 -160 -207 -27 34 -16 220 -143 -187 -320 -106 194 -2106 -9 -109 -232 -169 -37.2 -2457 717 -442.5Long-term -161 42 -88 -140 50 320 392 285 -14 -66 -5 309 -207 230 663 238 -605 139.3 923 -524 276.1
Other sectors 274 109 -4 101 -274 317 108 3 -225 -75 38 5 379 144 -114 -31 27 -216.3 378 238 59.1
Short-term 0 6 0 1 0 0 1 1 0 0 36 0 6 1 2 36 0 364400.0 46 -1 3488.9Long-term 274 103 -4 100 -274 317 107 2 -225 -75 2 5 373 143 -116 -68 27 -351.4 332 239 39.0
Details may not add up to total due to rounding.p Preliminary
Jan-Dec2014 pQ1 Q2 Q3
Q4
Page 12 of 16

9 FINANCIAL DERIVATIVES (OTHER THAN RESERVES) AND EMP LOYEE STOCK OPTIONSfor periods indicatedin million U.S. dollars
Growth (%) Growth (%)Jan Feb Mar Apr May Jun Jul Aug Sep Oct Nov Dec 2014 p 2013 2014 p 2014 p 2013 2014 p
Financial derivatives (other than reserves) andemployee stock options -20 10 -9 -13 12 -5 3 -3 10 -14 -11 -6 -19 -7 9 -31 -47 32.6 -48 -88 45.8
Central bank 0 0 0 0 0 0 0 0 0 0 0 0 0 0 0 0 0 - 0 0 -Deposit-taking corporations,
except the central bank -20 10 -9 -13 12 -5 3 -3 10 -14 -11 -6 -18 -7 9 -31 -45 30.6 -47 -85 44.7General government 0 0 0 0 0 0 0 0 0 0 0 0 0 0 0 0 0 - 0 0 -Other sectors 0 0 0 0 0 0 0 0 0 0 0 0 -1 0 0 0 -1 100.0 -1 -3 78.8
Net Acquisition of Financial Assets -38 -16 -18 -22 -13 -15 -10 -29 -35 -37 -26 -18 -72 -50 -74 -81 -85 5.0 -277 -312 11.3
Central bank 0 0 0 0 0 0 0 0 0 0 0 0 0 0 0 0 0 - 0 0 -Deposit-taking corporations,
except the central bank -37 -16 -18 -22 -13 -15 -10 -29 -35 -37 -26 -18 -71 -50 -74 -81 -83 2.3 -276 -291 5.2General government 0 0 0 0 0 0 0 0 0 0 0 0 0 0 0 0 0 - 0 0 -Other sectors 0 0 0 0 0 0 0 0 0 0 0 0 -1 0 0 0 -2 100.0 -1 -21 95.3
Net Incurrence of Liabilities -18 -26 -9 -9 -25 -10 -13 -26 -44 -23 -15 -12 -53 -44 -83 -50 -39 -28.1 -229 -224 -2.2
Central bank 0 0 0 0 0 0 0 0 0 0 0 0 0 0 0 0 0 - 0 0 -Deposit-taking corporations,
except the central bank -17 -26 -9 -9 -25 -10 -13 -26 -44 -23 -15 -12 -53 -44 -83 -50 -38 -31.5 -229 -206 -11.1General government 0 0 0 0 0 0 0 0 0 0 0 0 0 0 0 0 0 - 0 0 -Other sectors 0 0 0 0 0 0 0 0 0 0 0 0 0 0 0 0 -1 100.0 0 -18 97.8
Note: Data on employee stock options are not availableDetails may not add up to total due to rounding.p Preliminary
Jan-Dec2014 pQ1 Q2 Q3
Q4
Page 13 of 16

10 OTHER INVESTMENTfor periods indicatedin million U.S. dollars
Growth (%) Growth (%)Jan Feb Mar Apr May Jun Jul Aug Sep Oct Nov Dec 2014 p 2013 r 2014 p 2014 p 2013 r 2014 p
Other Investment 1768 -591 617 406 -187 1675 568 -220 514 -947 694 2585 1793 1895 863 2332 426 448.0 6883 3410 101.9
Other equity 0 0 0 0 0 0 0 0 0 0 0 0 0 0 0 0 0 - 0 0 -Currency and deposits 1083 -625 631 -409 -413 1130 247 183 125 -91 140 2451 1088 307 555 2500 1263 97.9 4451 1410 215.7Loans 972 277 168 899 269 349 245 -400 406 -543 46 -659 1416 1516 250 -1155 -1209 4.5 2028 1447 40.1Insurance, pension, and standardized
guarantee schemes 0 0 0 0 0 0 0 0 0 0 0 0 0 0 0 0 0 - 0 0 -Trade credit and advances -199 -220 -202 -36 -41 200 61 -122 83 -303 470 608 -622 124 21 775 313 147.9 299 249 19.9Other accounts receivable/payable -87 -23 21 -48 -2 -3 15 120 -100 -10 38 185 -90 -53 35 213 59 260.3 106 303 -65.1
Net Acquisition of Financial Assets 1330 -456 974 -572 -56 1640 -428 576 -207 -9 1072 2952 1848 1011 -59 4016 1200 234.6 6817 3640 87.3
Other Equity 0 0 0 0 0 0 0 0 0 0 0 0 0 0 0 0 0 - 0 0 -
Currency and Deposits 1267 -883 415 -266 -276 1272 -176 -9 88 121 391 2173 799 729 -97 2685 369 628.4 4116 1706 141.3Central bank 0 0 0 0 0 0 0 0 0 0 0 0 0 0 0 0 0 - 0 0 -Deposit-taking corporations, except
the central bank 890 -620 291 -122 -127 583 486 24 -242 -155 -126 1853 561 334 268 1572 -95 1747.8 2735 866 215.9General government 0 0 0 0 0 0 0 0 0 0 0 0 0 0 0 0 0 - 0 0 -Other sectors 377 -263 124 -144 -150 689 -663 -33 330 276 517 320 238 395 -365 1113 464 140.0 1381 840 64.5
Loans 50 437 538 -288 205 368 -276 467 -173 -126 659 821 1025 286 17 1355 854 58.6 2682 1942 38.1Central bank 0 0 0 0 0 0 0 0 0 0 0 0 0 0 0 0 0 - 0 0 -Deposit-taking corporations, except
the central bank 50 437 538 -288 205 368 -276 467 -173 -126 659 821 1025 286 17 1355 854 58.6 2682 1942 38.1Short-term 50 437 528 -288 205 370 -276 467 -173 -126 649 801 1015 288 17 1325 885 49.7 2644 1960 34.9Long-term 0 0 10 0 0 -2 0 0 0 0 10 20 10 -2 0 30 -31 195.7 38 -18 316.0
General government 0 0 0 0 0 0 0 0 0 0 0 0 0 0 0 0 0 - 0 0 -Other sectors 0 0 0 0 0 0 0 0 0 0 0 0 0 0 0 0 0 - 0 0 -
Insurance, pension, and standardizedguarantee schemes 0 0 0 0 0 0 0 0 0 0 0 0 0 0 0 0 0 - 0 0 -
Trade credit and advances 0 0 0 1 -1 1 -1 0 0 0 0 -3 0 0 -1 -3 -1 -171.4 -3 0 -2077.0Other sectors 0 0 0 1 -1 1 -1 0 0 0 0 -3 0 0 -1 -3 -1 -171.4 -3 0 -2077.0
Short-term 0 0 0 1 -1 1 -1 0 0 0 0 -3 0 0 -1 -3 -1 -171.4 -3 0 -2077.0Long-term 0 0 0 0 0 0 0 0 0 0 0 0 0 0 0 0 0 - 0 0 -
Other accounts receivable - other 12 -10 21 -19 16 -1 26 118 -121 -4 22 -39 24 -4 23 -21 -21 0.8 21 -8 375.7Deposit-taking corporations, except
the central bank 12 -10 21 -19 16 -1 26 118 -121 -4 22 -39 24 -4 23 -21 -21 0.8 21 -8 375.7
Jan-Dec2014 pQ1 Q2 Q3
Q4
Page 14 of 16
10 OTHER INVESTMENTfor periods indicatedin million U.S. dollars
Growth (%) Growth (%)Jan Feb Mar Apr May Jun Jul Aug Sep Oct Nov Dec 2014 p 2013 r 2014 p 2014 p 2013 r 2014 p
Jan-Dec2014 pQ1 Q2 Q3
Q4
Net Incurrence of Liabilities -438 135 357 -978 130 -36 -996 796 -721 938 379 367 55 -884 -921 1684 775 117.3 -66 230 -128.80 0 0
Other Equity 0 0 0 0 0 0 0 0 0 0 0 0 0 0 0 0 0 - 0 0 -
Currency and Deposits 185 -258 -216 143 137 142 -423 -192 -38 212 251 -278 -289 422 -652 185 -895 120.7 -334 296 -213.1Deposit-taking corporations, except
the central bank 185 -258 -216 143 137 142 -423 -192 -38 212 251 -278 -289 422 -652 185 -895 120.7 -334 296 -213.1
Loans -922 160 370 -1187 -63 20 -521 867 -579 417 613 1480 -392 -1230 -234 2510 2063 21.7 655 495 32.3Central bank 0 0 0 0 0 0 0 0 0 0 0 0 0 0 0 0 0 - 0 0 -Deposit-taking corporations, except
the central bank -768 305 224 -1150 104 112 -1110 814 -555 152 617 1545 -238 -934 -850 2314 2532 -8.6 291 -254 214.8Short-term -768 305 224 -1150 104 112 -1110 814 -555 152 617 1545 -238 -934 -850 2314 2532 -8.6 291 -254 214.8Long-term 0 0 0 0 0 0 0 0 0 0 0 0 0 0 0 0 0 - 0 0 -
Drawings 0 0 0 0 0 0 0 0 0 0 0 0 0 0 0 0 0 - 0 0 -Repayments 0 0 0 0 0 0 0 0 0 0 0 0 0 0 0 0 0 - 0 0 -
General government 6 -90 242 69 -103 -65 615 35 -102 -56 -96 31 159 -99 548 -122 -189 35.7 487 -1367 135.6Credit and loans with the IMF 0 0 0 0 0 0 0 0 0 0 0 0 0 0 0 0 0 - 0 0 -Other Short-term 0 0 0 0 0 0 0 0 0 0 0 0 0 0 0 0 0 - 0 0 -Other Long-term 6 -90 242 69 -103 -65 615 35 -102 -56 -96 31 159 -99 548 -122 -189 35.7 487 -1367 135.6
Drawings 92 17 377 129 28 35 655 134 19 9 26 151 486 192 808 186 129 44.0 1671 777 115.2Repayments 85 107 135 60 131 100 40 99 121 66 122 119 327 291 260 307 318 -3.4 1185 2143 -44.7
Other sectors -160 -56 -96 -106 -64 -27 -27 17 78 322 92 -96 -312 -197 69 318 -280 213.5 -123 2115 -105.8Short-term 5 -6 10 -137 0 0 -5 5 -10 341 0 16 9 -137 -10 357 -10 3588.8 219 232 -5.8Long-term -166 -49 -106 32 -64 -27 -22 12 88 -19 92 -112 -321 -60 79 -39 -270 85.4 -342 1883 -118.2
Drawings 0 0 46 165 70 175 102 30 172 215 154 21 47 410 304 390 313 24.5 1151 5059 -77.3Repayments 166 49 153 133 134 202 124 18 84 234 62 133 368 469 226 429 583 -26.4 1493 3177 -53.0
Insurance, pension, and standardized
guarantee schemes 0 0 0 0 0 0 0 0 0 0 0 0 0 0 0 0 0 - 0 0 -
Trade credit and advances 199 220 203 36 39 -199 -62 122 -83 302 -470 -610 622 -124 -23 -778 -314 -148.0 -302 -249 -21.1Other sectors 199 220 203 36 39 -199 -62 122 -83 302 -470 -610 622 -124 -23 -778 -314 -148.0 -302 -249 -21.1
Short-term 200 220 206 37 39 -197 -61 122 -80 303 -470 -610 625 -120 -19 -777 -310 -150.6 -290 -267 -8.9Long-term -1 0 -3 -1 0 -3 -1 0 -3 -1 0 0 -4 -4 -4 -1 -4 79.4 -11 17 -165.6
Other accounts payable - other 100 13 0 29 18 2 10 -2 -21 6 -16 -224 114 49 -13 -234 -80 -191.1 -84 -311 72.8Deposit-taking corporations, except
the central bank 100 13 0 29 18 2 10 -2 -21 6 -16 -224 114 49 -13 -234 -80 -191.1 -84 -311 72.8
Special drawing rights 0 0 0 0 0 0 0 0 0 0 0 0 0 0 0 0 0 - 0 0 -
Details may not add up to total due to rounding.p Preliminaryr Revised to reflect post-audit adjustments; include updates from report of Bank for International Settlement (BIS) and BSP-IOD's MLT and Short-Term Loans Transactions Report
Page 15 of 16
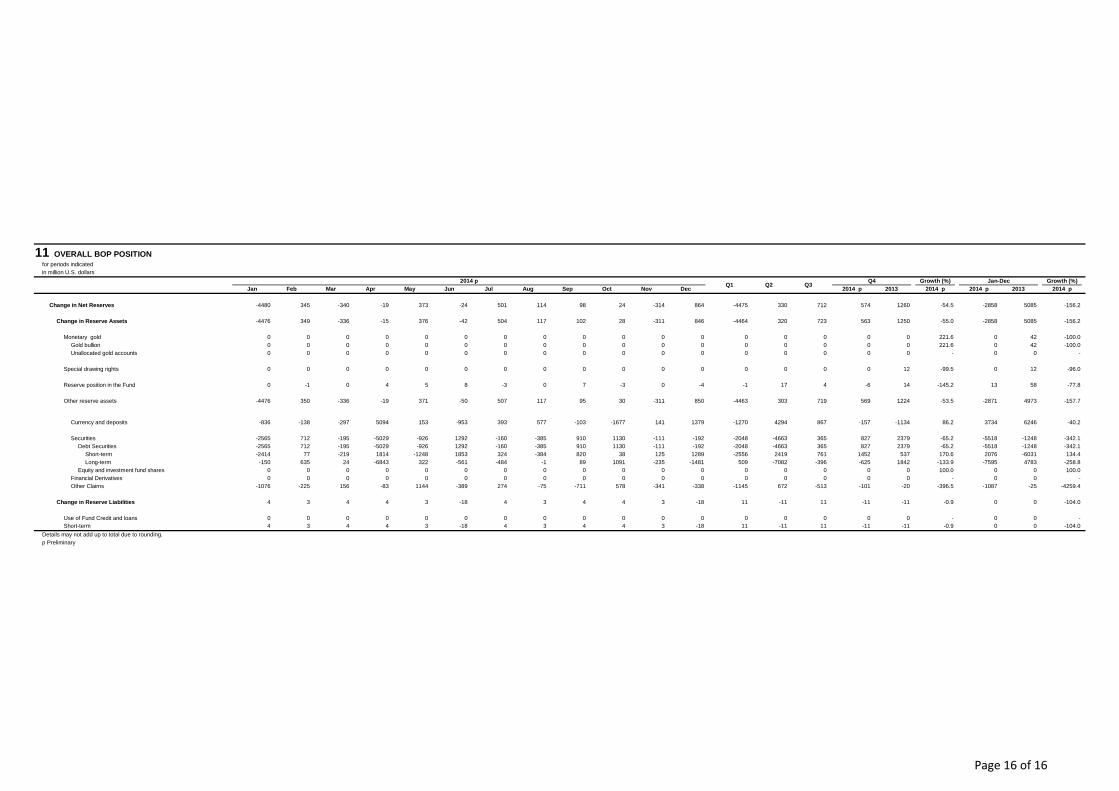
11 OVERALL BOP POSITIONfor periods indicatedin million U.S. dollars
Growth (%) Growth (%)Jan Feb Mar Apr May Jun Jul Aug Sep Oct Nov Dec 2014 p 2013 2014 p 2014 p 2013 2014 p
Change in Net Reserves -4480 345 -340 -19 373 -24 501 114 98 24 -314 864 -4475 330 712 574 1260 -54.5 -2858 5085 -156.2
Change in Reserve Assets -4476 349 -336 -15 376 -42 504 117 102 28 -311 846 -4464 320 723 563 1250 -55.0 -2858 5085 -156.2
Monetary gold 0 0 0 0 0 0 0 0 0 0 0 0 0 0 0 0 0 221.6 0 42 -100.0Gold bullion 0 0 0 0 0 0 0 0 0 0 0 0 0 0 0 0 0 221.6 0 42 -100.0Unallocated gold accounts 0 0 0 0 0 0 0 0 0 0 0 0 0 0 0 0 0 - 0 0 -
Special drawing rights 0 0 0 0 0 0 0 0 0 0 0 0 0 0 0 0 12 -99.5 0 12 -96.0
Reserve position in the Fund 0 -1 0 4 5 8 -3 0 7 -3 0 -4 -1 17 4 -6 14 -145.2 13 58 -77.8
Other reserve assets -4476 350 -336 -19 371 -50 507 117 95 30 -311 850 -4463 303 719 569 1224 -53.5 -2871 4973 -157.7
Currency and deposits -836 -138 -297 5094 153 -953 393 577 -103 -1677 141 1379 -1270 4294 867 -157 -1134 86.2 3734 6246 -40.2
Securities -2565 712 -195 -5029 -926 1292 -160 -385 910 1130 -111 -192 -2048 -4663 365 827 2379 -65.2 -5518 -1248 -342.1Debt Securities -2565 712 -195 -5029 -926 1292 -160 -385 910 1130 -111 -192 -2048 -4663 365 827 2379 -65.2 -5518 -1248 -342.1
Short-term -2414 77 -219 1814 -1248 1853 324 -384 820 38 125 1289 -2556 2419 761 1452 537 170.6 2076 -6031 134.4Long-term -150 635 24 -6843 322 -561 -484 -1 89 1091 -235 -1481 509 -7082 -396 -625 1842 -133.9 -7595 4783 -258.8
Equity and investment fund shares 0 0 0 0 0 0 0 0 0 0 0 0 0 0 0 0 0 100.0 0 0 100.0Financial Derivatives 0 0 0 0 0 0 0 0 0 0 0 0 0 0 0 0 0 - 0 0 -Other Claims -1076 -225 156 -83 1144 -389 274 -75 -711 578 -341 -338 -1145 672 -513 -101 -20 -396.5 -1087 -25 -4259.4
Change in Reserve Liabilities 4 3 4 4 3 -18 4 3 4 4 3 -18 11 -11 11 -11 -11 -0.9 0 0 -104.0
Use of Fund Credit and loans 0 0 0 0 0 0 0 0 0 0 0 0 0 0 0 0 0 - 0 0 -Short-term 4 3 4 4 3 -18 4 3 4 4 3 -18 11 -11 11 -11 -11 -0.9 0 0 -104.0
Details may not add up to total due to rounding.p Preliminary
Jan-Dec2014 pQ1 Q2 Q3
Q4
Page 16 of 16