Balance between Control and Freedom in the …705488/FULLTEXT01.pdfBalance between Control and...
119
Balance between Control and Freedom in the Management of Innovation EDUARD MUNKHART Master of Science Thesis Stockholm, Sweden 2013
Transcript of Balance between Control and Freedom in the …705488/FULLTEXT01.pdfBalance between Control and...
Balance between Control and Freedom in the Management of Innovation
EDUARD MUNKHART
Master of Science Thesis Stockholm, Sweden 2013

Balance between Control and Freedom in the Management of Innovation
Eduard Munkhart
Examensarbete MMK 2013:01 MCE 282
KTH Industriell teknik och management
Maskinkonstruktion
SE-100 44 STOCKHOLM


Master of Science Thesis MMK 2013:01 MCE282
Balance between Control and Freedom in the Management of Innovation
Eduard Munkhart
Approved
2013-01-10
Examiner
Lars Hagman
Supervisor
Susanne Nilsson
Commissioner
KTH/IPU
Contact person
Susanne Nilsson
Abstract Active management and promotion of innovation has become a more and more important aspect of strategic management of most companies. Crucially important for increasing innovation is the creation of an environment that supports and fosters innovation within the organization. Previous research particularly points out that the appropriate enabling of freedom in different aspects of work conduction while implementing suitable control mechanisms is the most challenging part. Since it is believed that previous attempts to identify promising practices to handle this dualism failed to result in consistent conclusions due to the highly contextual dependence of the findings, the aim of this thesis is to elaborate a framework and therefrom a tool to allow different work environments to be depicted and compared with regards to control and freedom. The work is based on a study of twelve distinct innovative cases in eight different organizations. The final outcome is a tool allowing the description and comparison of the degree of freedom and control in a work environment in a simple and intuitive way. The first application within this study disclosed that cultural control seems not to be perceived as a method of control by individuals. Furthermore, a qualitative inverse proportionality seems to delineate between means of cultural control and formal control across environments such as the control of working time and location.. Apart from the established tool and underlying framework, examined practices of innovation management are reflected in the investigated literature, confirming certain findings which is also disclosed within this thesis.


Diploma-Thesis Nr. 1356
Balance between Control and Freedom in the Management of Innovation
Eduard Munkhart
Ich versichere, dass ich die Arbeit selbständig verfasst und keine anderen als die angegebenen Quellen und Hilfsmittel benutzt habe.
2
BALANCE BETWEEN CONTROL AND FREEDOM IN THE
MANAGEMENT OF INNOVATION
1 Introduction ........................................................................................................................ 5
1.1 Outline and goal of the thesis ...................................................................................... 6
1.2 Structure of work ......................................................................................................... 7
2 Innovation in organizations ................................................................................................ 8
2.1 Definition of innovation .............................................................................................. 8
2.2 Forms of innovation ..................................................................................................... 9
2.3 Innovative work environments .................................................................................. 10
2.3.1 Freedom .............................................................................................................. 13
2.3.2 Control ................................................................................................................ 15
2.3.3 Balance between control and freedom ............................................................... 17
2.3.4 Seeking for best practice in innovation management......................................... 18
2.4 Research question and thesis objectives .................................................................... 19
3 Research approach and methods ...................................................................................... 20
3.1 Constraints and boundary conditions for data investigation ..................................... 20
3.1.1 Focus on research and development ................................................................... 21
3.1.2 Focus on individual freedom and control ........................................................... 21
3.1.3 Assessment of manager and employee point of view ........................................ 22
3.2 Company selection and presentation ......................................................................... 22
3.2.1 Selection criteria ................................................................................................. 23
3.2.2 Case descriptions ................................................................................................ 24
3.3 Interview conduction ................................................................................................. 26
3.3.1 Interview questionnaire ...................................................................................... 26
4 Results and analysis ......................................................................................................... 29
4.1 Overall goal, considerations and underlying assumptions ........................................ 29
4.1.1 Overarching aim for simplicity .......................................................................... 29
4.1.2 Decision making as the central element ............................................................. 30
4.2 Determination of dimensions of control and freedom ............................................... 31
4.2.1 Time ................................................................................................................... 33
4.2.2 Objectives ........................................................................................................... 33

3
4.2.3 Processes ............................................................................................................ 34
4.2.4 Budget ................................................................................................................ 35
4.2.5 Communication .................................................................................................. 35
4.2.6 Information ......................................................................................................... 36
4.2.7 Culture ................................................................................................................ 36
4.2.8 Non-independent aspects and dimensions of work environments ..................... 37
4.3 Determination of dimension scales and assessment methods ................................... 38
4.3.1 Time ................................................................................................................... 40
4.3.2 Objectives ........................................................................................................... 43
4.3.3 Processes ............................................................................................................ 45
4.3.4 Budget ................................................................................................................ 47
4.3.5 Communication .................................................................................................. 50
4.3.6 Information ......................................................................................................... 53
4.3.7 Culture ................................................................................................................ 57
4.4 Way of presentation and its interpretation ................................................................. 60
4.4.1 Scale and area interpretation .............................................................................. 60
4.4.2 Higher level of detail differentiation within the diagram area ........................... 63
4.4.3 Additional information on the work environment.............................................. 66
4.5 Information not contributing to the environment’s depiction ................................... 68
5 Tool application and resulting pictures ............................................................................ 69
5.1 Procedure of work environment examination ........................................................... 69
5.2 Pictures resulting from investigated data ................................................................... 71
5.2.1 Optical similarities of identical environments ................................................... 74
5.2.2 Business specific depiction peculiarities ............................................................ 75
5.2.3 Overall conclusions ............................................................................................ 76
6 Additionally investigated information ............................................................................. 79
6.1 Best practice for innovation and individual motivation ............................................ 80
7 Discussion ........................................................................................................................ 83
7.1 Method of investigation ............................................................................................. 83
7.2 Elaborated model and framework .............................................................................. 84
7.3 Validity of the tool ..................................................................................................... 85
8 Summary and outlook ...................................................................................................... 87

4
9 List of references .............................................................................................................. 88
10 List of figures and tables .................................................................................................. 97
11 Appendices ....................................................................................................................... 99
11.1 Interview questionnaire ............................................................................................. 99
11.2 Reevaluation questionnaire ...................................................................................... 101
11.3 Enhanced reevaluation questionnaire ...................................................................... 104
11.4 Comprehensive environmental pictures .................................................................. 108

5
1 Introduction
Until recently, a company could simply stay competitive by optimizing its performance regarding costs, time and quality of their products and services. Nowadays you need to invent and innovate to compete on the market. (CRAWFORD & DI BENEDETTO 2010)
Advancements in technology, intensified competition caused by globalization and changing customer needs and business environments demand a constant adaption of the organization to new circumstances (GOFFIN & MITCHELL 2010). This continuous pressure creates the need for companies to innovate their products and services in order to strengthen their competitiveness (ANDRIOPOULOS & LOWE 2000, PURANAM ET AL. 2006, PLESCHAK & SABISCH 1996). In doing so, according to TUSHMAN & O’REILLY (1996) firms that are capable of simultaneously creating and exploring as well as applying and exploiting it, will outperform other firms that emphasize one at the expense of the other.
In fact innovation is not only one of the most important components of a firm’s strategy (HITT
ET AL. 2001), innovation is even crucial for the survival of modern enterprises (MAKRI ET AL. 2006, LEWRICK ET AL. 2012, TROTT 2005). To portray it more extremely, COOPER (1999) and
BELLON (1994) state that companies that do not innovate, or fail to develop new products, disappear immediately.
The key question is: How can an organization increase its innovativity and its innovation capability to remain competitive and assure the company’s survival on the market? In order to address this question, this study focuses in particular on the conditions of the organizational work environment where innovation takes place.
The study of innovation-facilitating work environment of companies, as one facet of the larger work environment literature, has been the subject of studies and theory construction for several decades (JOHNS 2006) and has become a compelling and vibrant area of scholarship and application (KUENZI & SCHMINKE 2009).
RASULZADA & DACKERT (2009) point out that creating appropriate conditions for creativity and innovation lead to higher levels of organizational creativity and innovation, as well as better individual psychological well-being. HARTER ET AL. (2002) as well as VINCENT ET AL. (2004) state that higher levels of innovation emerge, when employees who feel a deeper sense of engagement experience a climate conductive to creativity. The management of this supportive climate is a key challenge for leaders and managers of organizations (ISAKSEN &
EKVALL 2010).
Then what are the essential elements that make an innovative environment? According to ZIEN & BUCKLER (1997), enabling employees to link their ‘work life’ to their longer term ‘life work’ is a crucial aspect of generating an environment where innovation and high productivity flourish together. In other words: to support the linkage between individual purpose, which is the driver for intrinsic motivation, and organizational purpose, which leads to extrinsic motivation (AMABILE 1993), to name one of the many. Furthermore a
6
considerable amount of freedom in work conduction is believed to be vital for innovation. (EKVALL 1983). In short, there is a great body of additional literature on essential elements for successful innovative climates which report a confusing multitude of key factors (SCHEWE
1994).
In order to be able to provide an environment with the demanded characteristics, it is crucially important to choose an appropriate managerial control system according to SIMONS (1994). Given that managerial control systems consist of different forms of control and control mechanisms that are applied in different ways to different extents, there is, as reality proves, also a multitude of possible practices for creating and managing the work environment for innovation.
The reason therefore is that best practice for innovation strongly depends on the context of the organization where it takes place (GOFFIN & MITCHELL 2010). This creates the need to, first of all, enable comparability of results when investigating innovative environments in the future by depicting the environment’s characteristics, in particular the present applied balance of control and freedom provided by the managerial control system. Therefore, this thesis is devoted to taking the first steps towards providing a solution to this emerging problem.
1.1 Outline and goal of the thesis
The objective of this thesis is to lay the groundwork for establishing a tool for displaying and comparing intra-organizational work environments. Particular focus is therefore directed upon displaying the environmental characteristics by disclosing the degree of freedom that is granted and the degree of control that is exerted in specific, yet to be determined, aspects of work environments. The goal is to create an easy to utilize instrument, which is able to depict the current environmental situation covering a preferably high variety of distinct cases in an intuitive manner of representation.
To produce this, an empirical approach shall be followed, guided by and reflected in the insights of corresponding literature to first, determine the relevant dimensions in which work environments can be described and distinguished and second, establish models for each dimension capable of describing the different existing situations. Measurement methods shall be elaborated enabling to assess environments in the determined dimensions along with an appropriate assessment method for every dimension. This way a tool shall be elaborated, that enables the easy assessment of future companies’ yet to be investigated environments.
For gathering the initial data, in-depth interviews shall be conducted with employees of eight distinct organizations covering a range of industries, either providing innovative products or services, or cultivating an innovative or unusual work environment.
Besides the visualization of the present work environment, the purpose of this tool is to provide a basis of comparability at assessing different organizations’ internal situations. Researchers would benefit from this by gaining the ability to link the specific findings of future studies on innovation to the background and context of the individual work environment. This provides additional data which can be used for case classifications and for

7
distinction between differing case circumstances within the study. Furthermore, this tool would also enable a better comparability of independently conducted research by providing a common assessment method for identifying the cases’ work environment characteristics, particularly the degree of allowed freedom and implemented control. Within studies as well as study-comprehensive this can among others, promote the identification of commonalities and patterns that can arise from the investigation of certain forms of innovation or the analysis of innovation in particular business areas.
From a company perspective, displaying the current situation at the firm by using this tool might induce reflection on one’s own practice and help with setting, implementing and controlling new business strategies. Furthermore, on the topic of assessment of several different but still comparable organizations, it might even be used for benchmarking-like purposes if combined with tools of performance measurement, by displaying their intra-organizational environments in relation to their performance. This might inspire organizations to adapt desirable features and, as a result, actively form their own internal environment.
1.2 Structure of work
The following chapter presents the theoretical framework by which the area of contribution, the research problem and the research objective are defined. In chapter 3, the research approach and research methods used for data collection as well as the analysis approach are described together with the criteria chosen to assess the quality of the research study. Furthermore, chapter 4 discloses the analysis of investigated data and the derivation of the tool’s framework as well as its measurement and assessment methods from the results supported by insights from research literature. Then, chapter 5 presents the application of the tool together with the elaborated environment pictures and insights resulting from the data. Furthermore, chapter 6 shows examined information that did not contribute to the framework and tool development, describing the insights which were collected. Chapter 7 particularly discusses the resulting framework for work environment examination as well as the tool and its inquiry method. Finally, chapter 8 provides a summary and outlook for the work and its possible future. Ultimately the last chapters, 9, 10, and 11 list the thesis’ references and illustrations and comprise the assessment questionnaires in the appendix.
8
2 Innovation in organizations
This thesis aims to contribute to the research area of innovation management, particularly focusing on the environments supporting innovation and on ways of examining these. Therefore, an overview of the research literature in organizational innovation is given in this section. Thus, this chapter presents an overview of the principal concepts, assumptions and prescriptions stated in innovation and management literature, deriving the challenge of determining the appropriate balance between control and freedom in the management of innovation. Finally, research needs are identified through a critical analysis of the relevant literature and yet conducted research.
2.1 Definition of innovation
Since the long-term ambitions of this endeavor are to contribute to innovation research as well as facilitating the creation of innovative work environments in organizations, it is exceedingly important to specify the meaning of the word ‘innovation’ and to establish a common comprehension.
Despite the comparatively short history of innovation research, there are numerous opinions and suggestions for the definition of innovation. In order to understand and evaluate the existing definitions as well as to prevent confusion, particularly the relationships between creativity, idea, invention and innovation have to be clarified.
AMABILE (1996) defines creativity as ‘…the production of novel and useful ideas in any domain.’ which makes creativity part of the process of idea generation. The invention is defined as ‘a thing or an idea that has been invented’ by HORNBY ET AL. (2010) making the invention the embodiment of the idea. Summarizing the work of several studies on innovation, MEDINA ET AL. (2005) repeat that ‘innovation is widely understood to be related to the implementation of new ideas or original solutions’, which makes the idea part of the innovation as well. AHUJA & LAMPERT (2001) finally clarify how invention and innovation are correlated by saying: ‘While innovation refers to the development and commercialization of an invention, invention refers to the act of creating something new.’ Consequently, the invention is part of the innovation. To sum it up, creativity is the process of generating an idea, whose implementation is an invention that may become an innovation.
With this clarified, how is innovation then defined? According to AMABILE (1996), ‘innovation is the successful implementation of creative ideas within an organization’. The oldest definition for innovation was provided by SCHUMPETER (2005) defining technological innovation as a new combination of means of production, that is, as a change in the factors of production to procedure products. BAUMOL (1994) approaches the topic from an entrepreneurial point of view stating that entrepreneurship is ‘…the process whereby invention is put into practice, transforming a disembodied idea into a workable and economically viable operation.’, while MAKRI & SCANDURA (2010) appreciate the

9
Organization for Economic Co-operation and Development's definition of innovation as: ‘an iterative process initiated by the perception of a new market and/or service opportunity for a technology-based invention which leads to development, production and marketing tasks striving for the commercial success of the invention’.
What are the commonalities of these definitions? ORTEGA (2009) boils it down to following plain conclusion, described in a minimalistic manner:
Innovation = Good Idea + Implementation + Measurement
The statement is that innovation consists of three important elements, namely the idea, its implementation and success as a result, which manifests itself as a measurable improvement. This mindset will be the view that underlies the following work.
2.2 Forms of innovation
KOEN ET AL. (2001) defining innovation as an invention brought to the market, explicitly point out that ‘…market and innovation are used in the general sense of general use inside or outside an organization. Invention can occur in business methods, marketing, product design, organization design, etc.’ Hence, there are various forms in which innovation can manifest, due to the universality of its definition. SCHUMPETER (1912) attempted to categorize innovation into five domains, namely 1) introduction of a new good, 2) introduction of a new method, 3) opening of a new market, 4) conquest of a new source of supply of raw materials or half-manufactured goods; and 5) implementation of a new form of organization. This is quite similar to FRANCIS & BESSANT‘s (2005) classification of innovation into four categories:
Innovation to introduce or improve products, which is identical with Schumpeter’s first category comprises the implementation of new ideas into products or services that succeed on the market, for instance the invention of the automobile, personal computers and mobile phones as well as the service innovation such as cashless payment, electronic mail and social networks.
Processes innovation, representing the equivalent to Schumpeter’s second category, describes the improvement of task execution like for instance enhancing the manufacturing of a product by implementation of the assembly line principle. Improvement here could, for example, ultimately be measured as the saving of time or money.
Innovation to define or re-define the positioning of the firm or products covers Schumpeter’s third point. A popular example for this innovation type is Coca Cola which was first invented in front of a pharmaceutical background and was later remarketed to the broad public (THE
COCA-COLA COMPANY 2010).
Innovation Good Idea Implementation Measurement
Figure 2-1: Definition of innovation

10
Defining or re-defining an organization’s dominant paradigm, which corresponds to Schumpeter’s fifth category, describes the reevaluation and reframing of the organization’s self-understanding and collective mindset, which ultimately manifests itself in the alteration of management practices in what is referred to as management innovation in literature. Often the new practices depart distinctly from traditional principles and management processes. A famous example is the idea of relentless improvement that is extensively used by Toyota. Empowering the own employees to implement suggestions for improvement directly without having to ask for permission, enables the company to harness the intellect of every single employee, which provides the company with a significant competitive advantage. (HAMEL
2006)
Another important classification of innovation is made in regard of its degree of novelty involved, respectively the extent of the change on the product, process or practice (MEDINA ET
AL. 2005). Taking product innovation as an example, making only minor modification without changing the basic technology or product configuration is recognized as incremental innovation, while a product whose technology is considerably different from the earlier product represents a radical innovation, to exemplify it on product innovation (BALACHANDRA & FRIAR 1997).
Researchers recognized that radical innovation within organizations is very different from incremental innovation requiring distinct management approaches. It also is vital for the long-term success of the company. Knowledge about this differentiation and its significance is considered useful for the future classification of the cases. (MCDERMOTT & O’CONNOR
2002)
2.3 Innovative work environments
The importance of the organization's climate for a company’s innovative performance is acknowledged by several studies (BAIN ET AL. 2001, JUNG ET AL. 2003, SCOTT & BRUCE
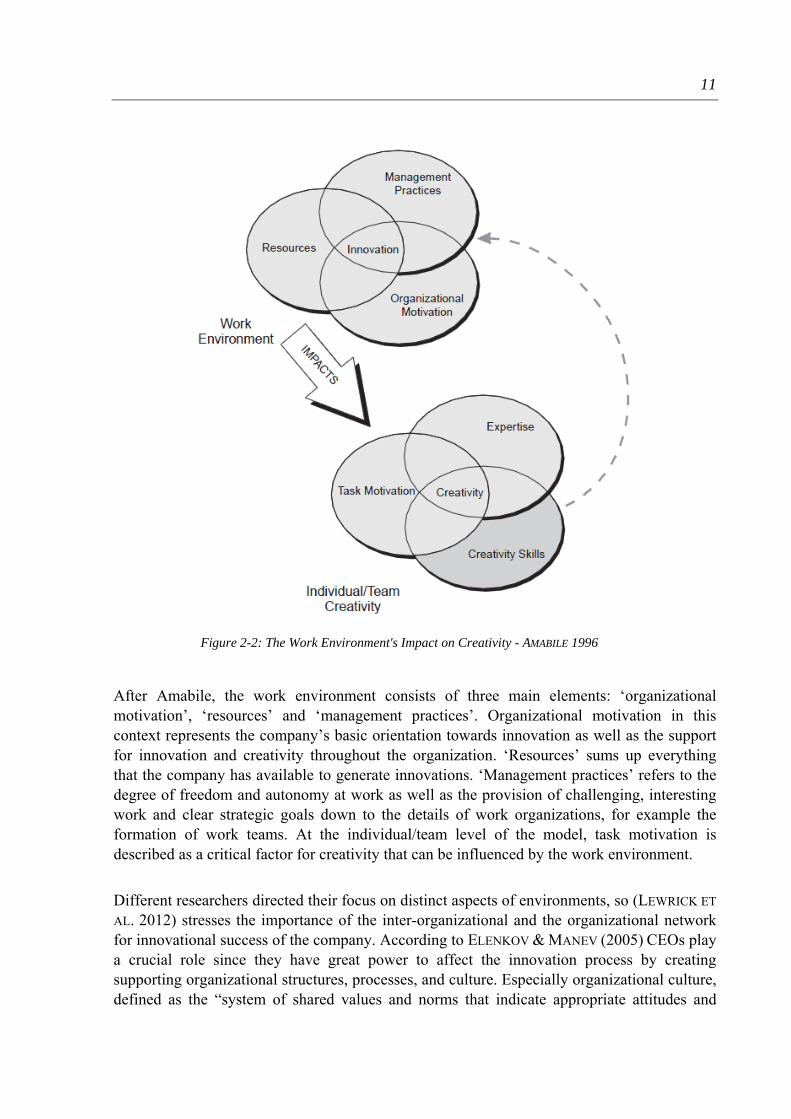
1994). The following model established by AMABILE (1996), see figure 2-1, visualizes the work environment’s impact on individual and team performance and creativity, which in turn is a determinant of the organization’s innovativeness, since creativity is the first step to innovation.
11
After Amabile, the work environment consists of three main elements: ‘organizational motivation’, ‘resources’ and ‘management practices’. Organizational motivation in this context represents the company’s basic orientation towards innovation as well as the support for innovation and creativity throughout the organization. ‘Resources’ sums up everything that the company has available to generate innovations. ‘Management practices’ refers to the degree of freedom and autonomy at work as well as the provision of challenging, interesting work and clear strategic goals down to the details of work organizations, for example the formation of work teams. At the individual/team level of the model, task motivation is described as a critical factor for creativity that can be influenced by the work environment.
Different researchers directed their focus on distinct aspects of environments, so (LEWRICK ET
AL. 2012) stresses the importance of the inter-organizational and the organizational network for innovational success of the company. According to ELENKOV & MANEV (2005) CEOs play a crucial role since they have great power to affect the innovation process by creating supporting organizational structures, processes, and culture. Especially organizational culture, defined as the “system of shared values and norms that indicate appropriate attitudes and
Figure 2-2: The Work Environment's Impact on Creativity - AMABILE 1996
12
behaviors for organizational members” by (O’REILLY ET AL. 1991) is seen as a significant variable by several researchers (MUMFORD & GUSTAFSON 1998, TUSHMAN & ANDERSON
1997), since this environmental aspect is present at in any situation.
Furthermore, GOFFIN & MITCHELL (2010) derived a set of seven key principles that characterize innovative companies that from a guideline for increasing success in innovation, namely: self-identification as an innovative company, being experimental, strong marketing to technical people relationships, creating customer intimacy, organization wide engagement, importance of the individual and foster powerful and purposeful stories. Notice that from the perspective of a company, some of these factors are internal, while some are external.
It is important to be aware, that a significant part of factors of identified by literature are elements concerning the outer-organizational environment for innovation, like for example market or competitive pressure, which sees the company as a black box with relationships to other instances. In contrast to that, others focus on the intra-organizational relationships, for example company culture, internal communication and the individual’s motivation. Since the aim of this study is to contribute to the depiction and the inter-organizational comparability of elements forming the environment where innovation takes place, the focus of this thesis will be directed on the examination of factors that are under the company’s influence and control, namely the internal ones.
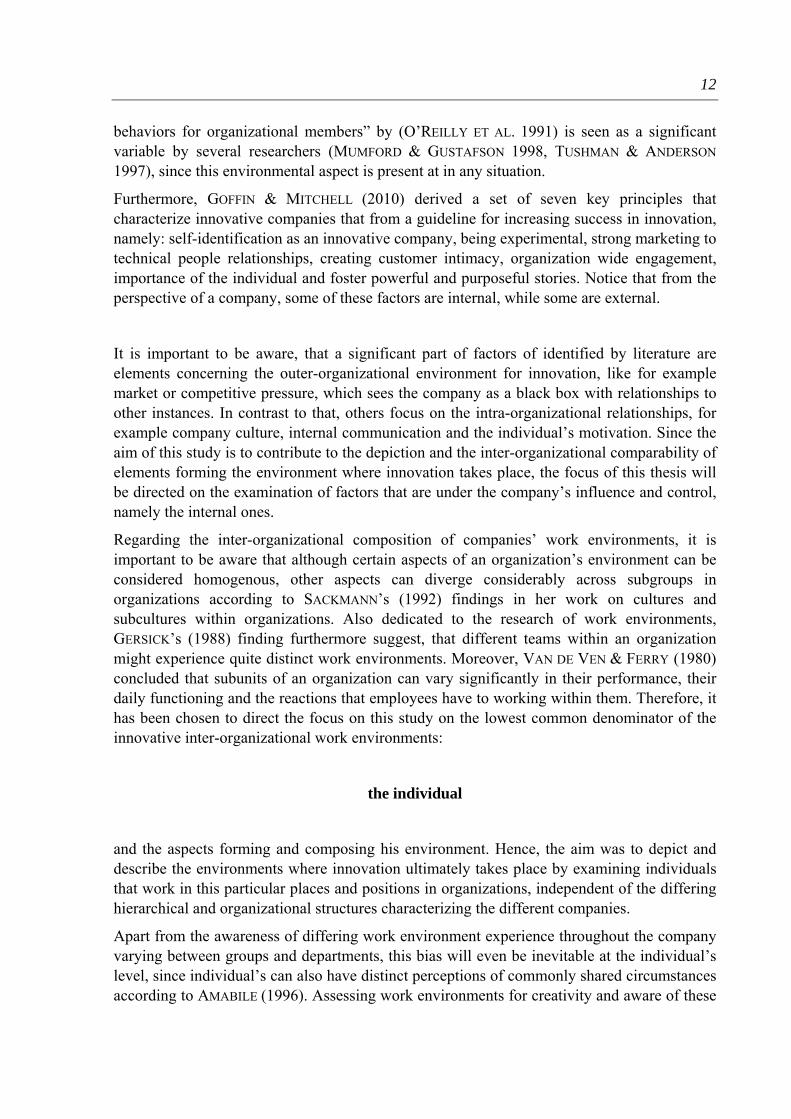
Regarding the inter-organizational composition of companies’ work environments, it is important to be aware that although certain aspects of an organization’s environment can be considered homogenous, other aspects can diverge considerably across subgroups in organizations according to SACKMANN’s (1992) findings in her work on cultures and subcultures within organizations. Also dedicated to the research of work environments, GERSICK’s (1988) finding furthermore suggest, that different teams within an organization might experience quite distinct work environments. Moreover, VAN DE VEN & FERRY (1980) concluded that subunits of an organization can vary significantly in their performance, their daily functioning and the reactions that employees have to working within them. Therefore, it has been chosen to direct the focus on this study on the lowest common denominator of the innovative inter-organizational work environments:
the individual
and the aspects forming and composing his environment. Hence, the aim was to depict and describe the environments where innovation ultimately takes place by examining individuals that work in this particular places and positions in organizations, independent of the differing hierarchical and organizational structures characterizing the different companies.
Apart from the awareness of differing work environment experience throughout the company varying between groups and departments, this bias will even be inevitable at the individual’s level, since individual’s can also have distinct perceptions of commonly shared circumstances according to AMABILE (1996). Assessing work environments for creativity and aware of these

13
biases, Amabile argues that ‘the level at which the source of influence operates is less important than the perceptions themselves and their relation to creativity.’ The underlying principle is known as the ‘total-work-environment level of analysis’ approach outlined by PIERCE ET AL. (1989). Exemplified, if an employee feels that the strong and present company values prevent him from violating them, what is important is the fact that he perceives this restriction. Thus perceptional influences from different organizational levels are consciously going to be regarded in the further conduct of the study but are not considered to threaten the outcome of elaborating the aimed for tool in a radical way. Rather, according to AMABILE (1996), it is the psychological impact of an environment that influences creativity and thus innovation. The link might not be direct, but there must be some correspondence between work environment perception and organizational reality.
Regarding internal organizational environments, there is one particular paradox that puzzles managers and organization research (KASPER 1987): the dualism of control and freedom.
According to KANTER (1983) innovation in companies calls for open communication systems, decentralized resources and flexible networking across the organization. Innovation requires a certain degree of freedom or autonomy (AMABILE 1996). On the other hand, there’s the need for guidance and control that provides process structure and enables the collaboration of people (OUCHI 1979). AMABILE (1996) states additionally that task motivation, which is crucial for innovation, can be strongly influenced by constraints and enablers in the work environment.
2.3.1 Freedom
Organization research gathered evidence that a considerable amount of freedom in the conduct of one’s work is vital for innovation (EKVALL 1983).
For instance ZHOU (2003) found in his studies that individuals generated the most creative ideas working in a high task autonomy environment. This finding is consistent with JELINEK
& SCHOONHOVEN’s ones (1993), striving to derive a best practice for innovation management by investigating innovative firms, finding that many have institutionalized groups or divisions responsible for breakthrough innovation, arguing that major innovations cannot be expected in an organic environment, where flexibility, consensus building, and fluidity are the primary managerial mechanisms for accomplishing objectives. Instead, according to them, breakthrough innovation requires structure and clear reporting relationships to ensure the opportunity for both discipline and creativity.
Several researchers confirmed this need for a deliberate degree of freedom and autonomy adding that, apart from having the choice in how to go about accomplishing their tasks, innovativity is fostered when individuals feel a sense of ownership and control over their own work and ideas. (AMABILE ET AL. 1996, MUMFORD ET AL. 2002, QUINN 1985). O’REILLY &
TUSHMAN (1997) found that best practice include recognition for risk taking and tolerance of mistakes as essential elements. As mentioned already, KANTER (1983) as well as BURNS &
STALKER (1966) point out the importance of open communication systems, free information flow and cross organizational networking for an innovation-facilitating environment.

14
However, the freedom-advocating stream of innovation research literature argues, that command and control management, which is still in use at a considerable deal of companies, was invented in a time when people were valued for completing mechanic tasks instead of creative thinking (HAMEL 2006) and in short, does not work very well (SEDDON 2003). Formalization can impede organizational innovation (DAMANPOUR 1991) by causing bureaucracy, which limits flexibility and thus undermines the capability to harness employees’ creative potential as well as the fluidity of work processes (DOUGHERTY &
HARDY 1996)
In order to unleash individuals’ creativity organizations are advised to use decidedly unbureaucratic management approaches and trade monarchy-like leadership for more democracy-like management practices. (HAMEL 2006)
Indeed there can be noticed a shift in management practice in about the last 20 years, which could almost be considered as a trend but has no unitary name yet, where companies abandon traditional management methods and reinvent their management culture in order to adapt to the changes of time. So does Google, which is a multimillion-dollar company by now, by creating a very open and informal work environment using its internal IT-infrastructure to every possible extent. (IYER & DAVENPORT 2008). Another example is Whole Foods, a US American company selling groceries to health-conscious customers granting the individual stores high degree of autonomy by letting the teams choose what to stock and whom to hire as well as providing extreme transparency of financial data including the compensations of every co-worker (HAMEL 2006). Best Buy recently reorganized its way of working drastically implementing the self-titled results-only work environment abandoning control mechanisms as fixed working hours including meetings being mandatory and fixed workstations. Instead they created an environment with a high output orientation where it is controlled that the work is getting done instead of controlling the when and where it takes place (RESSLER &
THOMPSON 2010).
The probably most popular example of this change of mind in leadership attitude is the Brazilian company Semco which as a group consist of several businesses and gradually transformed from a traditional family owned industrial pump manufacturer to a diversified provider of high technology of multiple company size over the last 30 years. Ricardo Semler, the company owner published three books by now, describing the process that the organization went through, starting with introducing flextime for manufacturing workers, which was fairly uncommon back at that time, over implementing a high result orientation and full business transparency to every employee to finally completely abandoning formal working controls like time recording, introducing regular upwards feedback and constantly looking for additional opportunities to enable the employees and abandon control. (SEMLER
1995, SEMLER 2003)
Several further organizations inspired by these pioneers followed their examples emphasizing self-organizations trusting in common sense of the individuals, but also developed this attitude independently. It is hard to identify the interrelations of these examples since information is missing about the initiator’s inspirational sources. But there are further examples of distinct business fields like the Federale Overheidsdienst Sociale Zekerheid which is the governmental social security department of Belgium, Royal Hospitals in

15
Australia, schools in Finland, the Amsterdam police department and also Atlassian, a relatively small Australian software developing company which is well known for its ship-it-days, where the employees work form project teams for 24 hours and compete for the most innovative idea, which often resulted in successful company products. (SEMLER 1995, SEMLER 2003, PINK 2009)
2.3.2 Control
Then again, completely letting go of managerial control might not be the philosopher’s stone of management’s best practice regarding innovativity. KAMM (1980) concludes that ‘researchers do not necessarily exhibit more innovative behavior when they perceive relatively loose administrative control than when they perceive tight control’. Quite the contrary, since innovation is a risky business, innovation management is needed to benefit from the opportunities of innovation without dealing with the consequences of the risks (TOMALA & SÉNÉCHAL 2004). Furthermore, management control systems facilitate the coordination and cooperation among teams and individuals by directing their efforts towards a specified set of the organization’s goals (LANGFIELD-SMITH 1997) and play an essential role in creating competitive pressures within the company to innovate and adapt according to SIMONS (1994).
In this sense, control is defined as ‘any process (mechanism, instrument) applied by the organization to assure the execution of organizational goals and plans’ (AMBOS &
SCHLEGELMILCH 2007) by monitoring activities and correcting significant deviations (MERCHANT 1985). Hence a management control system is the ‘formal, information-based routines and procedures managers use to maintain or alter patterns in organizational activities’, after SIMMONS (1994)
Apart from the fact that organizational control, by definition, is a strategically important mechanism to assure achievement of the desired organizational outcomes (CANGARLI &
DELEN 2012), the managerial control system also has a significant impact on the company’s innovation capability (LEWRICK ET AL. 2012). AMABILE ET AL. (1996) point out that particularly the perception of control is important. Experiencing external control may lead to increased extrinsic motivation but on the other hand undermine intrinsic one that is necessary for creativity. Confirming this, (BONNER ET AL. 2002) suggest based on their findings that teams should determine their own processes and procedural controls within a broad strategic framework. Furthermore PORTER (1980) identified the differentiation strategy to rely on control through coordination as an alternative to formal controls to encourage creativity and innovation.
It makes sense to further differentiate between control mechanisms since certain tasks require distinct control mechanisms and companies should aspire to for an appropriate fit (AMBOS &
SCHLEGELMILCH 2007). The degree of task uncertainty for instance is assumed to be an influential predictor for the adequate type of control that should be used (POSKELA &
MARTINSUO 2009).
16
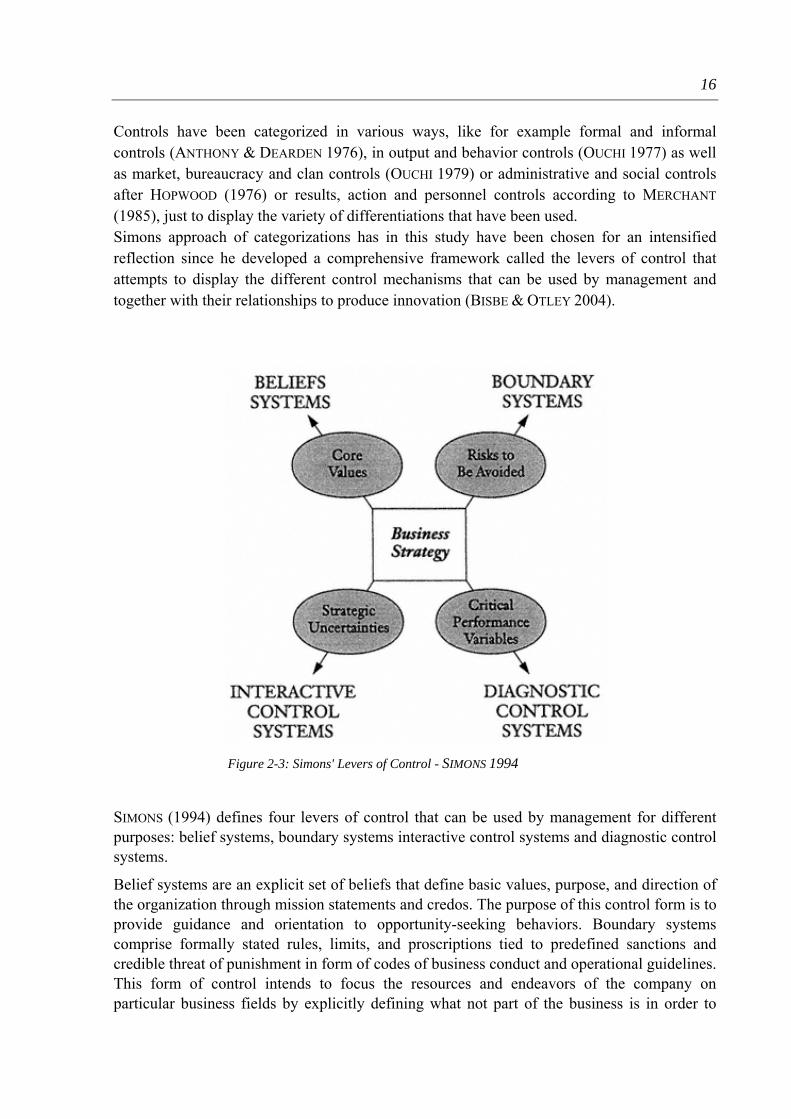
Controls have been categorized in various ways, like for example formal and informal controls (ANTHONY & DEARDEN 1976), in output and behavior controls (OUCHI 1977) as well as market, bureaucracy and clan controls (OUCHI 1979) or administrative and social controls after HOPWOOD (1976) or results, action and personnel controls according to MERCHANT (1985), just to display the variety of differentiations that have been used. Simons approach of categorizations has in this study have been chosen for an intensified reflection since he developed a comprehensive framework called the levers of control that attempts to display the different control mechanisms that can be used by management and together with their relationships to produce innovation (BISBE & OTLEY 2004).
SIMONS (1994) defines four levers of control that can be used by management for different purposes: belief systems, boundary systems interactive control systems and diagnostic control systems.
Belief systems are an explicit set of beliefs that define basic values, purpose, and direction of the organization through mission statements and credos. The purpose of this control form is to provide guidance and orientation to opportunity-seeking behaviors. Boundary systems comprise formally stated rules, limits, and proscriptions tied to predefined sanctions and credible threat of punishment in form of codes of business conduct and operational guidelines. This form of control intends to focus the resources and endeavors of the company on particular business fields by explicitly defining what not part of the business is in order to
Figure 2-3: Simons' Levers of Control - SIMONS 1994

17
save the company from making unavailing efforts. The third lever of control, diagnostic control systems represents feedback systems that monitor organizational outcomes and correct deviations from preset standards of performance, by setting company standards, measuring output and linking incentives to goal achievement. They also play an important role in motivation and rewarding employees. Interactive control systems are means for managers for involving themselves regularly and personally in the decision activities of subordinates, by constant feedback of information, for example by meetings. Its aim is to detect opportunities, stimulate organizational learning and the emergence of new ideas and strategies. (SIMONS
1994)
Simmon adds that these four levers create the forces of effective strategy management. Two of these control mechanisms, belief systems and interactive control systems represent positive, inspirational forces while the other two, boundary conditions and diagnostic control systems create constraints and ensure compliance with orders. Applied together they create the dynamic tension that allows effective control of business strategy.
Furthermore, the mix of these forms of control is what creates the organizational culture. It is important to keep in mind that this relationship is reciprocal. While organizational control can be used to manipulate the internal environment, organizational culture emerges as a contingency factor, which in turn affects the composition of the appropriate control mix (CANGARLI & DELEN 2012). Understanding how companies can utilize their formal control systems to support and promote innovation has become an important research question (SHIELDS 1997).
2.3.3 Balance between control and freedom
As stated before, on the one hand you need high freedom and independence for an innovation-promoting environment (POSKELA & MARTINSUO 2009), on the other hand, you also need control mechanisms to guide the employees’ efforts in the right strategic direction, ensure the effective use of resources, monitor progress and allow for adjustment if necessary. But too much or the wrong type of control might constraint the individual’s and team’s creativity and have negative effects on progress and their ultimate performance (BONNER ET AL. 2002).
The impact of management control systems upon innovation performance is difficult to predict (DAVILA 2000). The findings of studies on management control’s influence on innovativity in general are conflicting. While many scholars argue that behavioral control eliminates creativity and thus decreases innovativeness, other emphasizes advantages of improved communication, coordination and learning which come along with process formalization. The importance of setting specific and challenging strategic goals is highlighted by some while others state that this again inhibits creativity and organizational learning (POSKELA & MARTINSUO 2009). Even management control systems that provide information relevant for coordination and learning are said to affect new product development positively while there also exists contradictory evidence stating that no relationship exists or is negative.
18
Hence, the challenge to determine the appropriate forms of control to the appropriate intensity and apply them to the appropriate situation. Or to put it in other words: ‘The challenge for executives is to also set the boundaries that help direct those creative individuals towards achieving innovation. In an R&D organization, … establishing guidelines and boundaries is important, and then giving people freedom to operate within those boundaries is important’ (SOSIK ET AL. 2004).
Therefore, research literature made the rising call to balance these opposed urges for control and freedom in the management of innovation. SIMONS (1994) stresses that this is not resolved by choosing empowerment over accountability for example. Both are needed and both should exist in organizations. The challenge is to equilibrate these tensions and accomplish the effective control mix and it is recognized to not being easy (CANGARLI &
DELEN 2012). It is all about balancing control and creativity (POSKELA & MARTINSUO 2009), creativity and discipline (KHURANA & ROSENTHAL 1998) precision and flexibility, individualism and teamwork (CLARK & FUJIMOTO 1991), conservation and change, development and security, order and freedom (KASPER 1987), empowering the people and providing structure (MUMFORD ET AL. 2002), summed up:
control and freedom
2.3.4 Seeking for best practice in innovation management
Attempting to determine the most suitable composition and implementation of the balance between control and freedom for innovativity, innovation research failed to come up with one innovation management best practice yet (AMBOS & SCHLEGELMILCH 2007).
Also many attempts have been made to identify critical factors for innovation to unravel the principles of successful innovation. Thereby, a wide variety of concepts and types of innovation has been linked to multitude of organizational variables like the allocation of resources, the skills of key staff, the generation of ideas or the organization of development teams (MEDINA ET AL. 2005). Given that innovation is a process, research was not able to come to a consistent conception of the key aspects of innovation yet, nor to a common set of suggestions for improving companies’ innovation performance.
A review of research literature on factors for success or failure in new product development conducted by BALACHANDRA & FRIAR (1997) concluded, that a huge variety of factors have been identified that vary in magnitude, importance and even direction of influence.
There are many possible explanations for these deviations. Different perceptions of terminology when provided without definition for instance, like DAVILA (2000) encountered it when assessing the effects of because of management control systems in research and development environments concluding that R&D employees thought about control as a reducing goal divergence mechanism rather than as an information tool. BALACHANDRA &

19
FRIAR (1997) argue that even apart from the well-known methodological weaknesses in the conducted studies and applied models one of the main issues is, that several factors identified to be critical for innovation are contextual. This is undermined by GOFFIN & MITCHELL
(2010) highlighting explicitly that innovation strongly depends on context.
2.4 Research question and thesis objectives
The circumstance that innovation research could not derive consistent conclusions of important factors, defining crucial elements of exemplary practice, because of the strong contextually of the research insights, emphasizes the demand for linking these and future findings to their correspondent organizational situations. This raises the following questions that represent the research question of this study:
How can the present balance between control and freedom of different work environments be depicted in a comparable manner?
Certainly, some researchers already addressed the challenge to establish a tool for quantitatively investigating work environments like Van de Ven & Ferry, developing the Organizational Assessment Instrument that measures an organization’s design, its structures and its functions. Insel and Moos equally dedicated their work to establishing an assessment tool for work environments called the Work Environment Scale, examining the daily work environment comprehensively by investigating several broad dimensions. As already mentioned several times before, Amabile also elaborated a framework called the KEYS model for the assessment of work environments in regard of creativity which plays an important role in innovation, by focusing on twelve important factors for creativity, which is closely correlated to innovation that have been identified by prior research. (AMABILE ET AL. 1996)
These models have, as a matter of course, also been taken into consideration at evaluating the necessity and benefit of creating an additional framework to assess work environments. However, the critical factor endorsing this effort was to create a model which in particular examines the balance between the aspects of freedom and control that are applied in the companies. In contrast to other models freedom and control will not only be one single facet of the described environment, like control in the Work Environment Scale or freedom in Amabile’s model, rather it will be the core dualism that shall enable to visualize and explain the encountered situations.
Recapitulating other scholars, MCDERMOTT & O’CONNOR (2002) note that most established cross-disciplinary frameworks assessing innovation either fit the unique circumstances of certain nations or the ones of individual industries, but are not easily applicable beyond their original contexts. To avoid contributing to this this circumstance, it is deliberately intended to create a tool that is not constrained to specific industries or forms of innovation and capable of assessing a preferably broad spectrum of different intra-organizational work environments.

20
3 Research approach and methods
The objective of this work is to establish a tool that allows researchers as well as organizations to display and compare intra-organizational work environments. The special focus of its framework shall be the tension depicted as the present balance of freedom and control in the investigated work environment. To achieve this goal, a three stage approach will be followed. The first step comprises assessing the work environment of eight distinct organizations by conducting in-depth interviews. Data evaluation, supported by existing research literature in the fields of innovation management, managerial control systems and work environment investigation, as well as establishing the intended tool based on the findings and insights represents the second stage. The third and final stage includes its subsequent application by a second round of specific data investigation and evaluation in the interviewed companies.
Though its importance has been stressed by several scholars, prior research does not provide any model or theory for describing and depicting the particular balance and interdependence between control and freedom regarding work environments yet. Therefore, the first steps of this undertaking shall be made here by developing a framework and tool on the basis of empirical data investigated in different existing work environments.
Since existing research literature is discordant on important organizational factors for innovation, which could found the basis of the examination of work environments, a theoretical approach does not appear favorable here. Hence, the research strategy chosen is building theory from cases, moreover, because its closeness to rich empirical data ‘is likely to produce theory that is accurate, …and testable’ (EISENHARDT & GRAEBNER 2007). Altogether it appears to be best suited approach for constructing theoretical framework while still being able to reveal and incorporate possibly unknown aspects of the matter. Anyway it is considered very beneficial to reflect the empirical insights against the background of existing research literature as well as to accompany the entire process of data investigation, evaluation and final result depiction with existing findings to acquire more valuable input and eventually providing more empirical support for certain stated opinions.
3.1 Constraints and boundary conditions for data investigation
Offering a tool which allows the assessment of a multitude of different situations seems very desirable. For providing this capability, it is intended to select cases throughout different fields of business like for instance mechanical engineering, software development and service, as well as companies being from different size and countries in order to gather a certain diversity of data upon which the framework can be built. To still assure comparability of the survey data on the other hand, some boundary conditions have to be set for the investigation procedure as well as for the selection of the companies.

21
3.1.1 Focus on research and development
The first constraint that has been made concerns the level of investigation. Up to today innovation has been researched at different levels. There is for example the macro level examining the topic within the context of the whole industry and economy, which could also be described as the extra organizational field. Analogously also micro or company level studies have been conducted that analyzed innovation in an intra-organizational realm. Lastly surveys have also been made regarding the topic on a project level particularly focusing on new product development. (GOFFIN & MITCHELL 2010)
Given that the model’s focus is work environments where innovation occurs, it has to be examined in an intra-organizational context. Since furthermore the attention is more directed on the environment rather than the particular item of innovation, data shall be collected from where ’innovation takes place’, namely at the research and development (R&D) department, instead of following a project approach.
Here it is important to stress that, as mentioned before, there is a variety of different forms of innovation like for instance process or management innovation and hence a lot of places in the company where innovation takes place. So, successful ideas are not necessarily born in the labs of a R&D facility, but rather emerge at different places throughout the company. Then again, to provide comparability between the investigated cases, it is necessary to focus on certain elements that the chosen organizations have in common. Besides the fact that it is the R&D department’s purpose to develop and create new products and services and this way actively contribute to the company’s innovativeness, the R&D department was chosen, because even non-industrial organizations like service companies possess equivalent divisions, entitled as for example ’service innovation group’ (time:matters, Germany) or ’innovation development team’ (Bank of America) (GOFFIN & MITCHELL 2010).
If the organization distinguished between research and development by implementing these functions in distinct departments, the research department was chosen over the development since the day to day tasks in research are usually characterized by a higher degree of uncertainty, while development activities tend to be more structured, formalized and guided by processes. In case the companies differentiated between radical and incremental innovation by assigning specific project teams or designing special processes handling radical innovation, that one was chosen over incremental innovation business since radical innovation is much less common as incremental innovation in the organizational routines of conducting work (GOFFIN & MITCHELL 2010). The distinction between radical and incremental was furthermore considered of possible importance since researchers found that managing these two types of innovation requires practices that differ substantially from one another, according to MCDERMOTT & O’CONNOR (2002).
3.1.2 Focus on individual freedom and control
Ultimately every organization is composed of individuals that interact in various ways. Belonging to diverse hierarchical groupings, even just considering the company’s R&D department, some will be working on new development projects led by project managers while others work in teams reporting to the lab manager. How can the work environment of

22
this setup be described? What will a survey of in-depth interviews with employees of R&D departments really measure?
Being aware of these anticipated differences between distinct organizations’ practices, occurring in characteristics like department and team size as well as organizational structure, which already could occur within one single organization, it was decided to focus on a basic common element of assessment that is comparable throughout every examined company, namely the individual. For this reason it is aimed to assess the present degrees of freedom and control in the work environment on the individual’s level within this study.
Though it could be argued that it should be possible to assess the department’s work environment reality by simply investigating a considerable quantity of employees and determining their agreement or averaging the findings, the risk here is that the average could describe a setting that does not exist within any fraction of the examined department on the one hand, and overriding possibly important perceptional information on the other. Moreover, as a matter of limited resources, it is preferred to conduct a limited amount of in-depth interviews at several different companies over conducting a multiplicity of minor interviews or constraining the study to fewer companies, which enforced the decision for assessing the individual’s capacity of freedom and experience of control in his work environment.
3.1.3 Assessment of manager and employee point of view
Considering the aforementioned perception biases and deviations between different units such as departments and teams, disclosed in detail in chapter 2.3, which ultimately led to the decision of depicting work environments on the individual’s level instead of generalizing empirical findings over whole departments or companies, it was intended to get an impression of the perception differs depending on different hierarchical positions within the organization. Therefore, it was attempted to conduct in-depth interviews with two R&D-persons per company, particularly one with a project staff member and another one with a person in an executive position, ideally being directly correlated as manager and employee, to capture both perspectives on the same situation.
Diverging findings on individual’s perception regarding elements that would be assumed to be evaluated the same way could lead to valuable insights into individual perception of work environments as well as disclose possible shortcomings in the assessment method.
3.2 Company selection and presentation
As already mentioned, the case study approach enables the construction of a theoretical framework on the basis of sincere empirical data and that way being close to reality. The second decisive reason is that it allows discovering simultaneously yet unknown aspects which could determine or be important for the description of work environments that support innovativity.
In order to harness this potential, a ‘learn from the best’ or rather a ‘learn from the extraordinary’ approach is followed to push the boundaries for data collection. Hence, it was

23
deliberately intended to investigate organizations representing innovation leaders as well as other extremes that differ from the average to form the empirical basis upon which the tool’s theory shall be constructed. The goal was, to enable the tool to also assess and display the same kind uncommon and extreme cases in the future as well as more familiar and traditional ones, spanning a possible big area of investigation by expanding the spectrum of initial data collection to a high variety of innovative companies of intentionally different kinds.
In particular three specific criteria have been defined by which companies will be selected to contribute to the fundamental data investigation. Eligible companies must offer innovative products, be the technological lead in their area of business or provide an unconventional work environment, which will be disclosed in detail in the following. Subjects featuring more than one or all of these characteristics have of course also been considered.
3.2.1 Selection criteria
Given that the measurement of innovativity per se is difficult (TIDD 2001) it is hard to draw the line between innovative organizations and non-innovative ones as well as between innovative products and not innovative ones. The estimation of a company’s innovativity has therefore been made regarding the interplay of reference points like diversity of the products and new product development pace against the background of the product’s degree of novelty. Since startups by definition introduce a new product into a market or even create yet not existing markets, they have also been considered a valuable source of input for gathering the underlying data. Startup companies, moreover, tend to utilize very unique methods of business conduct as they act in the very first stages of business development, which could also be interesting in regard of unconventional work environments. Therefore, startups as well as other companies have been selected for the data investigations that were considered innovative in their industry by a combination of the aforementioned aspects or because of its general reputation.
The second criteria chosen for the selection of organizations is being the technological leader in the area of business. Keeping up with the changes of technology and setting new standards beyond that requires a considerable innovation capability (TROTT 2005). Therefore, assessing the work environment of an organization developing cutting-edge technology could disclose, which balance is implemented to provide enough freedom for innovation on the one hand and apply control to assure efficient implementation under the tremendous pressure of competition on the other hand. Companies matching these criteria are often the ones acting on a global scale, which frequently entails the distribution of research and development activities over several locations. This would also contribute to the diversity of the assessed environments, since it would presumably lead to distinct patterns of interaction and communication between the individuals due to national and cultural differences.
The third factor considered for the company selection was the existence of an unconventional work environment when the day to day tasks are being conducted. HAMEL (2006) states that ’ If your goal is to escape the straitjacket of conventional management thinking, it helps to study the practices of organizations that are decidedly unconventional.‘ For being able to
24
describe more extraordinary work environments for innovation than the ones assessed by studies up to today, also companies with deliberately uncommon management practices have been chosen for the survey. Apart from that, the assessment of non-compliant environments could disclose yet unexamined approaches to manage innovation in an organizational context.
3.2.2 Case descriptions
According to the aforementioned criteria, several companies have been selected for the primary investigation in order to form the empirical foundation on which the future work will build upon.
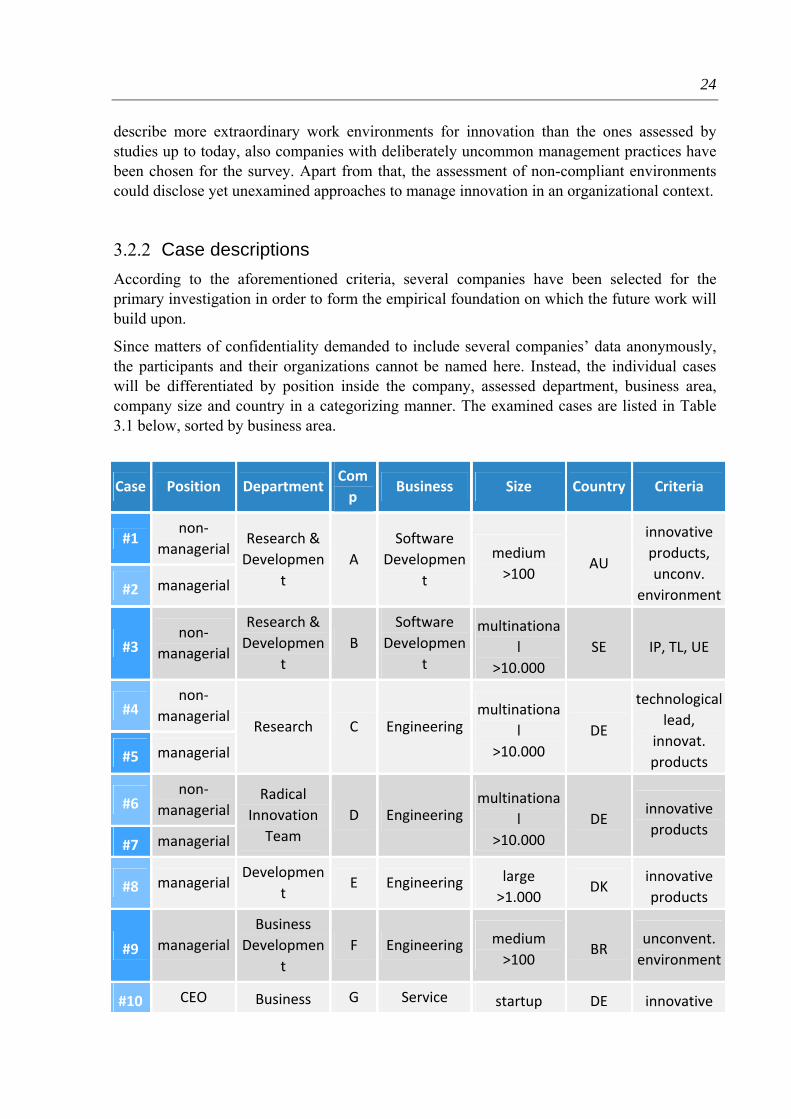
Since matters of confidentiality demanded to include several companies’ data anonymously, the participants and their organizations cannot be named here. Instead, the individual cases will be differentiated by position inside the company, assessed department, business area, company size and country in a categorizing manner. The examined cases are listed in Table 3.1 below, sorted by business area.
Case Position Department Com
p Business Size Country Criteria
#1 non‐
managerial Research &
Developmen
t
A
Software
Developmen
t
medium
>100 AU
innovative
products,
unconv.
environment#2 managerial
#3 non‐
managerial
Research &
Developmen
t
B
Software
Developmen
t
multinationa
l
>10.000
SE IP, TL, UE
#4 non‐
managerial Research C Engineering
multinationa
l
>10.000
DE
technological
lead,
innovat.
products #5 managerial
#6 non‐
managerial Radical
Innovation
Team
D Engineeringmultinationa
l
>10.000
DE innovative
products #7 managerial
#8 managerial Developmen
t E Engineering large
>1.000 DK
innovative
products
#9 managerial
Business
Developmen
t
F Engineering medium
>100 BR
unconvent.
environment
#10 CEO Business G Service startup DE innovative

25
Developmen
t
<100 product
#11 CEO
Business
Developmen
t
H Service startup
<100 DE
unconvent.
environment
Table 3-1: Casebook
Ultimately, eleven individual interviews could be conducted comprising eight different companies. Regarding the availability of the organizations and individuals to contribute to the survey, sadly it was not possible to interview two employees per company every time.
By position the individuals are distinguished between individual contributors in non-managerial positions and people with direct subordinates. In the startup-like companies assessed in this study with up to 100 employees, it was even possible to investigate the CEO’s work environments.
In the category department it is disclosed where exactly the individuals contribute to innovation in the organizations. Besides, this category visualizes which organizational unit is dedicated to create innovation and furthermore if the company divides research from development. As mentioned before, examining work environments of departments where radical innovation takes place was chosen over the ones concerned with incremental innovation. This attempt succeeded in next to every case except within company E and F, where the most radical innovations were handled in special processes of the assessed department, which could not be investigated because of confidentiality issues.
Furthermore the criteria business area distinguishes whether organizations develop software products, manufacture physically tangible products or provide services.
Size distinguishes organizations by the number of employees and also reveals whether the company acts internationally or exists since less than twelve months.
The attribute country specifies where the investigated company’s branch is located, which does not necessarily comprise the main part of the R&D division in case it is distributed over different locations.
Although the organizations’ names are not disclosed here it is particularly important to stress, that the examined individual’s work environments cannot be generalized over the whole organization, because of possible subgroup differences and perceptional deviations on different levels. Although the distinct cases might be referred to, sorted and compared by companies in the following, it is crucial to always be aware of the individuality of the described situation.

26
3.3 Interview conduction
In order to investigate different work environments for the groundwork of this enterprise, a questionnaire has been established inspired by an extensive research of innovation management literature including additional elements particularly important for describing existing balances of control and freedom. The questionnaire establishment will be disclosed below, explaining the choice of topics and questions as well as their prioritization.
The interviews were conducted scheduled to take 30 to 60 minutes each, adapting to what time the individuals could offer to contribute. Every case was assessed separately, without possible influences of other persons’ presence. If there was the possibility to conduct the interview face to face this was chosen over video chat, but since some of the cases’ examination would have exceeded the time and budget constraints of this study, some have been surveyed by video communication means. In order to maintain a continuous communication and not waste the people’s time, the dialogue was first recorded to a recording device and transcribed later for better handling regarding the evaluation.
After an initial briefing introducing the purpose of the study to the participants to guide their collaboration capacity towards the aim of the study, the different sections of the interview, disclosed below, were passed through one at a time. In doing so, the intensity of specific topics was varied dynamically by the interrogator to adapt to the relevance for particular organization forms. Moreover the dynamic variation allowed the interview focus on data, which might provide particularly valuable insights into the respective case. Furthermore the sections where a grouped in topics which were run through in a favored manner. In cases the conversation touched certain aspects deviating from the preferred order, the sequence was adapted respectively to ensure the assessment of every issue.
3.3.1 Interview questionnaire
In order to enable a comparable examination of different individual’s environments, a questionnaire was established that should lead the conversation through different fields of importance leaving enough flexibility to individually adapt the conversation to emerging interesting and relevant subjects. Therefore, a multitude of elements was gathered in the first place, which could have a possible significance regarding innovative work environments, form a multiplicity of different sources such as literature on innovation management, organizational control and creativity and motivation as well as speeches and lectures on these topics. Furthermore, valuable supervisorial input and personal reasoning also contributed to the established question set. After grouping the individual elements by topics into fields of interest open questions were phrased for every non-redundant element. Next, high priority has been assigned to particular questions of every topic, marked by a red exclamation mark !, see appendix 11.1, in order to provide a conversational guideline ensuring the assessment of certain subjects in every interview enabling their comparability in the end.
27
To open the interview a first set of questions was chosen aiming for quantifiable and neutral information summarized under the point ‘company facts/hierarchy’, see appendix 11.1. These questions should investigate the hierarchical embedding of the assessed department, by asking the individuals to visualize it, drawing the organizational chart as a core question, and thus provide a basis for further conversation. Several follow-up questions have been chosen to examine the structure in detail and disclosed the net of interrelations inside the company.
The second set of questions, grouped under the headline ‘communication’, influenced by research literature to a great extent, were chosen to examine the means of communication in detail by generally asking how communication takes place as a core question and specifying that later regarding different communication partners. Especially assessing the internal degree of formality was considered a high possible significance since it has been declared to play an important role in forming an innovation supporting environment (MEDINA ET AL. 2005). Asking about the existence of no accessible information should disclose the degree of information accessibility, which is considered a particular important element of companies that follow the trend of abandoning control within the organization (KEIL 2011, SEMLER 1995, SEMLER 1993).
The following section, ‘innovation/innovativeness’, see appendix 11.1, served to assess innovation management in general by asking how the innovation process is handled as a core question and following up with questions, that examine the organization’s particular differentiations regarding innovation management and investigating the exemplified types of innovation processes, highlighted by the use of italics in the questionnaire. These questions were chosen to enable to determine the companies’ different approaches to create and foster innovation and to derive what influences innovation processes by examining the cases. Furthermore questions have been included to estimate the frequency and type of innovation that is present in the department and the organization to get an impression of the company’s actual innovativity without aiming for measuring the companies’ innovation, since the common present approaches are relatively limited and in general not very satisfactory (GOFFIN & MITCHELL 2010).
Having clarified the subject of innovation, the questionnaire’s core section defining control and freedom was discussed, addressed under the point ‘decision making’. As an introduction employees have been asked to describe the decision making process and been guided through the conversation by several follow up questions regarding specific domains of decision making, like people being involved and characteristics of the process. Furthermore, another high priority question has been included to assess the overall company strategy and its influence on making decisions.
The following interview section, ‘control’ intended to examine specific forms of control exertion, asking for example for time recording, process rules and guidelines as well as to ultimately describe the personal perception of the resulting situation on scales from one to ten, as core questions. Another core topic of this section was work evaluation since the manner of evaluation was said to play an important role for organizational and supervisory encouragement for innovation and strongly impacting motivation (AMABILE ET AL. 1996). Along with that additional questions were asked about the modalities of the reward system, also assessing additional bonuses and benefits.

28
‘Culture’, which is the last questionnaire section was chosen to examine no quantifiable, highly company- and employee-specific issues by asking for company values and philosophy as a high priority question, since organizational culture and control have a very close and reciprocal relationship (CANGARLI & DELEN 2012). Moreover questions were asked about idealistic purposes and motivational drivers, to finalize the conversation in a positive and exhilarating way.
The entire interview questionnaire is attached in the appendices numbered 11.1.
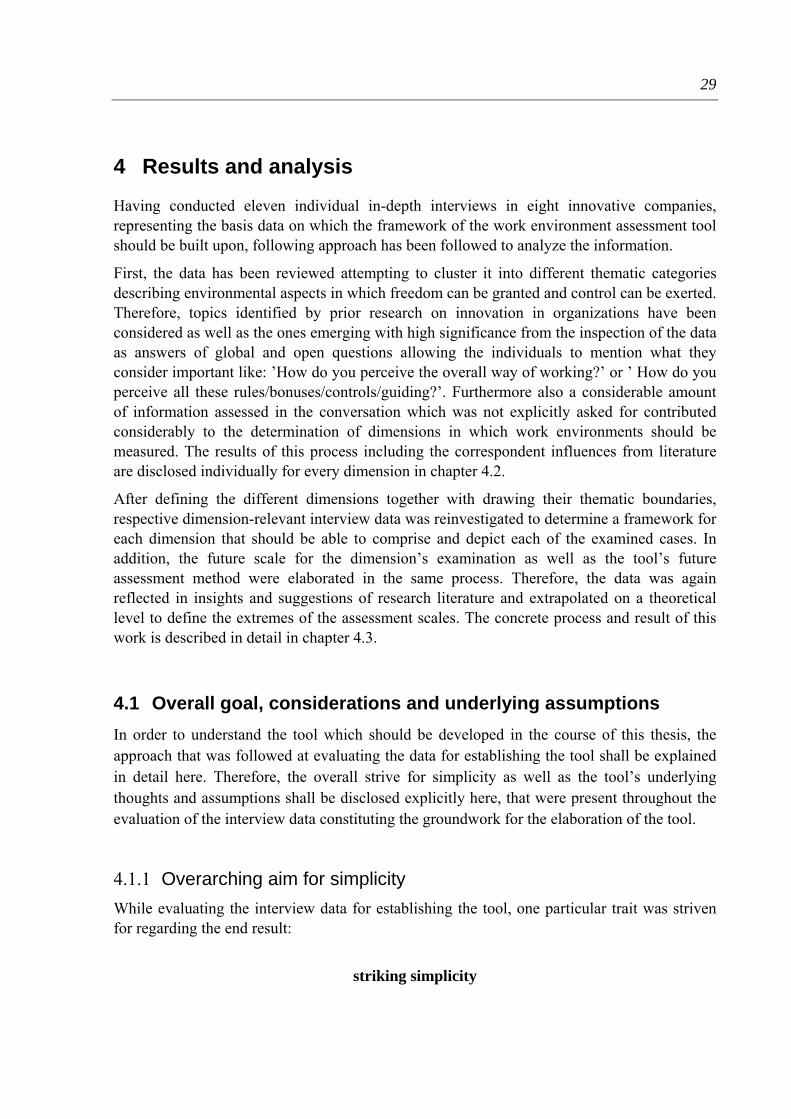
29
4 Results and analysis
Having conducted eleven individual in-depth interviews in eight innovative companies, representing the basis data on which the framework of the work environment assessment tool should be built upon, following approach has been followed to analyze the information.
First, the data has been reviewed attempting to cluster it into different thematic categories describing environmental aspects in which freedom can be granted and control can be exerted. Therefore, topics identified by prior research on innovation in organizations have been considered as well as the ones emerging with high significance from the inspection of the data as answers of global and open questions allowing the individuals to mention what they consider important like: ’How do you perceive the overall way of working?’ or ’ How do you perceive all these rules/bonuses/controls/guiding?’. Furthermore also a considerable amount of information assessed in the conversation which was not explicitly asked for contributed considerably to the determination of dimensions in which work environments should be measured. The results of this process including the correspondent influences from literature are disclosed individually for every dimension in chapter 4.2.
After defining the different dimensions together with drawing their thematic boundaries, respective dimension-relevant interview data was reinvestigated to determine a framework for each dimension that should be able to comprise and depict each of the examined cases. In addition, the future scale for the dimension’s examination as well as the tool’s future assessment method were elaborated in the same process. Therefore, the data was again reflected in insights and suggestions of research literature and extrapolated on a theoretical level to define the extremes of the assessment scales. The concrete process and result of this work is described in detail in chapter 4.3.
4.1 Overall goal, considerations and underlying assumptions
In order to understand the tool which should be developed in the course of this thesis, the approach that was followed at evaluating the data for establishing the tool shall be explained in detail here. Therefore, the overall strive for simplicity as well as the tool’s underlying thoughts and assumptions shall be disclosed explicitly here, that were present throughout the evaluation of the interview data constituting the groundwork for the elaboration of the tool.
4.1.1 Overarching aim for simplicity
While evaluating the interview data for establishing the tool, one particular trait was striven for regarding the end result:
striking simplicity
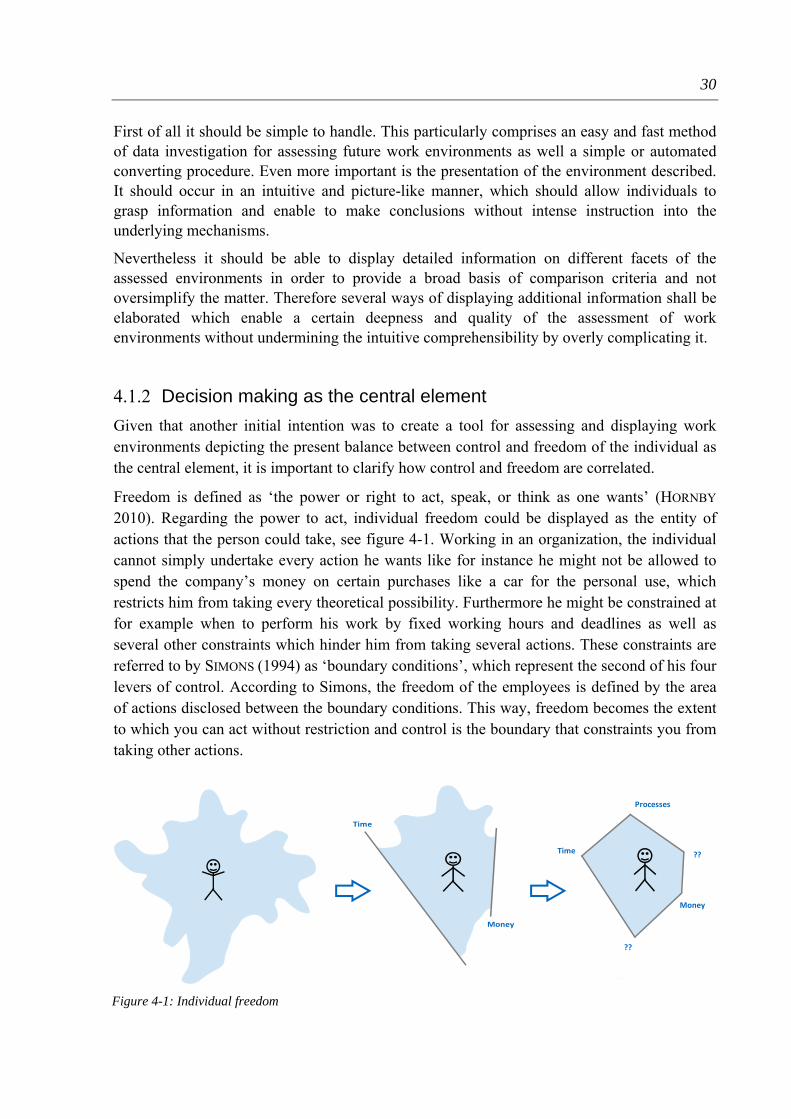
30
First of all it should be simple to handle. This particularly comprises an easy and fast method of data investigation for assessing future work environments as well a simple or automated converting procedure. Even more important is the presentation of the environment described. It should occur in an intuitive and picture-like manner, which should allow individuals to grasp information and enable to make conclusions without intense instruction into the underlying mechanisms.
Nevertheless it should be able to display detailed information on different facets of the assessed environments in order to provide a broad basis of comparison criteria and not oversimplify the matter. Therefore several ways of displaying additional information shall be elaborated which enable a certain deepness and quality of the assessment of work environments without undermining the intuitive comprehensibility by overly complicating it.
4.1.2 Decision making as the central element
Given that another initial intention was to create a tool for assessing and displaying work environments depicting the present balance between control and freedom of the individual as the central element, it is important to clarify how control and freedom are correlated.
Freedom is defined as ‘the power or right to act, speak, or think as one wants’ (HORNBY
2010). Regarding the power to act, individual freedom could be displayed as the entity of actions that the person could take, see figure 4-1. Working in an organization, the individual cannot simply undertake every action he wants like for instance he might not be allowed to spend the company’s money on certain purchases like a car for the personal use, which restricts him from taking every theoretical possibility. Furthermore he might be constrained at for example when to perform his work by fixed working hours and deadlines as well as several other constraints which hinder him from taking several actions. These constraints are referred to by SIMONS (1994) as ‘boundary conditions’, which represent the second of his four levers of control. According to Simons, the freedom of the employees is defined by the area of actions disclosed between the boundary conditions. This way, freedom becomes the extent to which you can act without restriction and control is the boundary that constraints you from taking other actions.
Figure 4-1: Individual freedom
Money
Time
Money
Time ??
??
Processes

31
Carrying this thought on, the central element defining the extent of freedom and the beginning of control arises as decision making. Since freedom comprises the power to act which includes having the choice of what to do, the elementary question becomes:
What can I decide and what not?
Furthermore ‘What are the boundary conditions regarding decisions?’, or a bit softer as ‘What influences me at taking decisions and do I consider regarding decisions?’
4.2 Determination of dimensions of control and freedom
Given that different organizations set their boundary conditions differently regarding different topics (SIMONS 1994), the present situation of control and freedom in the work environment could be assessed and displayed by investigating the distinct, preferably independent dimensions in which control can be exerted.
This approach was chosen over conventional ones distinguishing between different forms of control like for example input-, process-, output-, and value control, differentiation control by the point of its exertion, where value control comprises a meta-form of control continuously influencing the planning, implementation and evaluation of work activities. This approach used by POSKELA & MARTINSUO (2009) also distinguishes between further criteria like level of formality and level of interaction, apart from the chronological order of the control forms. Furthermore, Ouchi’s approach defining three basic forms of control has also been considered. His first category, market control, comprises external factors like price competition and relative market share that establish standards of the control system on an
Figure 4-2: Identification of control dimensions
PROCESSES
??
PROCESSES??
TIME
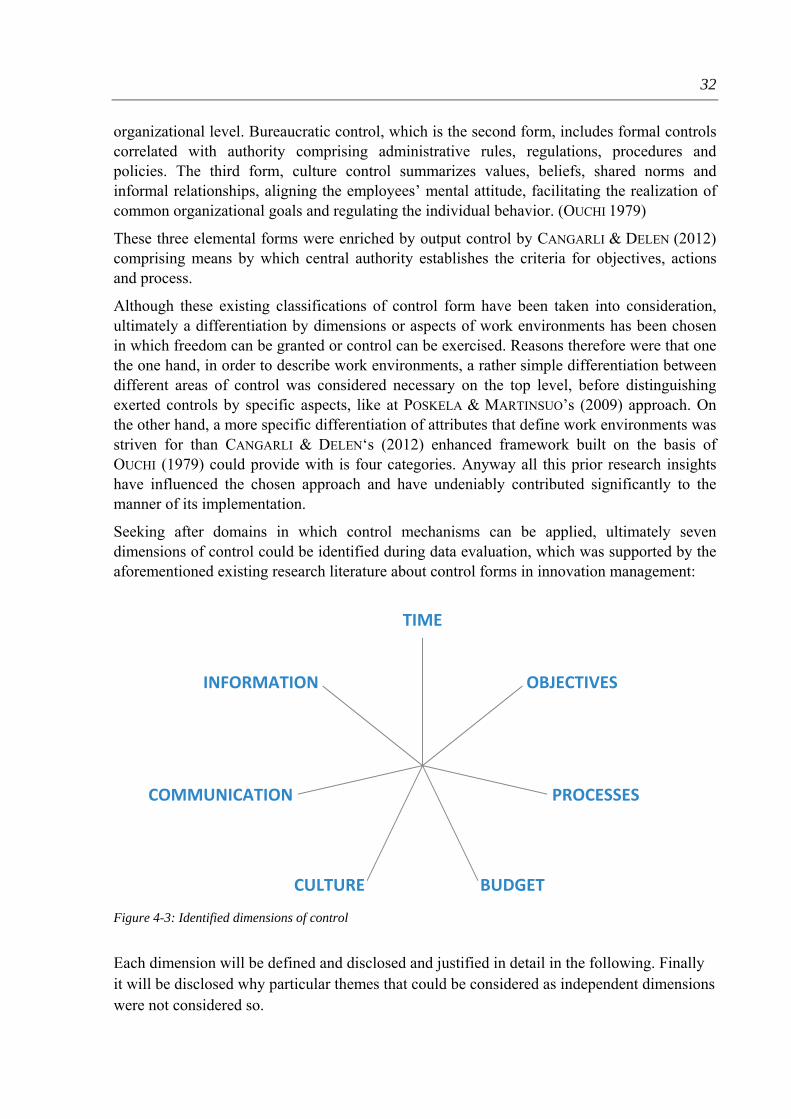
32
organizational level. Bureaucratic control, which is the second form, includes formal controls correlated with authority comprising administrative rules, regulations, procedures and policies. The third form, culture control summarizes values, beliefs, shared norms and informal relationships, aligning the employees’ mental attitude, facilitating the realization of common organizational goals and regulating the individual behavior. (OUCHI 1979)
These three elemental forms were enriched by output control by CANGARLI & DELEN (2012) comprising means by which central authority establishes the criteria for objectives, actions and process.
Although these existing classifications of control form have been taken into consideration, ultimately a differentiation by dimensions or aspects of work environments has been chosen in which freedom can be granted or control can be exercised. Reasons therefore were that one the one hand, in order to describe work environments, a rather simple differentiation between different areas of control was considered necessary on the top level, before distinguishing exerted controls by specific aspects, like at POSKELA & MARTINSUO’s (2009) approach. On the other hand, a more specific differentiation of attributes that define work environments was striven for than CANGARLI & DELEN‘s (2012) enhanced framework built on the basis of OUCHI (1979) could provide with is four categories. Anyway all this prior research insights have influenced the chosen approach and have undeniably contributed significantly to the manner of its implementation.
Seeking after domains in which control mechanisms can be applied, ultimately seven dimensions of control could be identified during data evaluation, which was supported by the aforementioned existing research literature about control forms in innovation management:
Each dimension will be defined and disclosed and justified in detail in the following. Finally it will be disclosed why particular themes that could be considered as independent dimensions were not considered so.
Figure 4-3: Identified dimensions of control
TIME
OBJECTIVES
PROCESSES
BUDGETCULTURE
COMMUNICATION
INFORMATION

33
4.2.1 Time
The first dimension comprises elements of formal control that define the circumstances of when and where work is conducted. These are the applied measurement of work time, the possibility to do remote work and interrelated topics like the modalities of taking vacation and the necessity to attend meetings since this influences the freedom of time and location of the employee as well, indirectly.
Further concluded, this category ultimately represents the degree of goal orientation in performance measurement that is present in the work environment. If performance is measured by means of hours an employee works at his desk or works on a given task, it entails the required time measurement control form to assure, that every employee contributes to a comparable extent to the company’s objectives. If performance in contrast is assessed by defining tasks and controlling their completion these formal controls gets implemented in the organization. (RESSLER & THOMPSON 2010)
This category emerged for the fact that formal controls are particularly easy to name and control of time and location forms the work environment in a significant way, since remote work requires a high degree of responsibility and trust from both the employee and the supervisor. Furthermore these forms of control are usually the first ones that have been abolished by organizations following the trend of enabling their employees as much as possible as undertaken at Semco and Best Buy to name some examples (HAMEL 2006, MARSH
2010, SEMLER 1995, SEMLER 2003). Moreover, according to AMABILE ET AL. (1996) ‘a focus on ends over means enhances creativity in work organizations’, which was another reason to consider this category as important for measuring the conditions for innovation in work environments.
4.2.2 Objectives
Another important dimension that emerged which is strongly correlated with decision making, is the freedom of goal selection. Given that different decisions are made at different levels in an organization where the company’s mission or purpose is broken down to a set of measures for its realization, down to concrete tasks, different hierarchical positions entail distinct powers for making decisions. Therefore it is necessary to differentiate between the distinct levels at examining decision capabilities of the employees. The process of breaking down company’s mission, strategy and goals to personal objectives for the individuals is visualized in figure 4-4 after SEIDENSCHWARZ 2012, see below.
Starting with the general purpose of the company from which core values, company visions and its strategy can be derived, it gets broken down further to more concrete action plans as balanced scorecards and strategic initiative down to the individual objectives of the employee. Clouding this further, the next level would comprise concrete decisions individuals take to realize their objectives. Thereby, every level of the displayed pyramid represents a level of decision-making on certain topics which are usually assigned to different positions within the organization.

34
However this category comprises the selection of the individual’s objectives along with the non-idealistic upper level elements that influence that personal goals level, including overall company strategy and decision criteria derived which compose the ‘balanced scorecard’, see the five shaded elements forming the base of figure 4-3.
Having the freedom to choose on what to work on can be an influential factor for innovativeness since a sense of ownership over the own work has a significant impact on the employee’s motivation according to AMABILE ET AL. (1996). Furthermore objectives can seem challenging in a positive or a negative way, depending of the individual’s perception of their appropriateness. Without doubt the reward system as a whole also has a great impact on motivation including the distribution of bonuses and benefits.
4.2.3 Processes
This dimension of covers forms of control, that determine by which means an individual is allowed to reach the objectives, how they are chosen and who is involved. Particularly, it comprises processes for idea generation, decision processes about product features and formal processes that standardize work conduction like stage-gate-processes, as well as requirements for documentation.
Hence this category represents the freedom of goal pursuit which would be the next lower level of decision making in figure 4-3 above, if it were continued. Special focus was directed on the details of the processes’ conduction and their flexibility. Regarding objectives, this category is about means that define how to reach the goals, while the previous category ‘Objectives’ was about what to achieve.
Figure 4-4: The Process from strategy to action - after SEIDENSCHWARZ 2012
Missionwhy we exist
Core Valuewhat we believe in
Vision incl. Overall Goalswhat we want to be
Strategygame plan to win customers, to outplace competitors
Balanced Scorecardwhat gets measured gets done
Strategic Initiativeswhat we need to do
Personal Objectiveswhat need to do

35
Assessing innovation supporting work environments, this category plays an important role since formalization can impede organizational innovation according to DAMANPOUR (1991) and SIMONS (1994).
4.2.4 Budget
The next group of identified constraints was constraints regarding non-human resources necessary for work conduction like equipment, material and business travels, as well as opportunities for advanced training and work benefits, particularly focusing on elements that can be measured in terms of expenses. This was considered to form a separate dimension of control and freedom since decisions on financial matters were observed to play a crucial role in most of the assessed cases.
This category represents the financial freedom of the individual enabling to purchase things that a necessary or supportive for achieving the objectives. Important for estimating this degree of freedom is to take into account who and how budget gets allocated and authorized.
Apart from the clear differentiation of this control category from other topics, budget was considered particularly important since scholars suggested that resource allocation is directly related to projects’ creativity levels, thus influencing innovation as well. Apart from that, limited resources might also be challenging and ensure that the organization does not overly invest into certain businesses (SIMONS 1994) and the perception of the adequacy of resources may also impact people’s intrinsic motivation by concluding their project’s value by this criteria (AMABILE ET AL. 1996).
4.2.5 Communication
Another dimension that’s degree of control and freedom significantly constitutes the present work environment is communication. Comprising the means and routines by which communication inside and outside the department takes place, it describes one of the core elements of coordination in organizations.
Representing the freedom of information flow, this category particularly examines the effort needed to establish and maintain contact to different communication partners as well as the degree of formality characterizing communication which.
The importance of these aspects was frequently pointed out in innovation management literature. For instance MEDINA ET AL. (2005) suggest that the way of communicating significantly define the features of new organizational forms. Furthermore, MEDINA ET AL. (2005) reciting other scholars, point out that excessively formal communication systems can impede innovation and conclude that the existence of informal communication processes should be considered a characteristic of today’s innovative companies, which explains the focus in the communication’s formality here.

36
4.2.6 Information
The next group of constraints that were identified is closely correlated to communication and concerns the sharing and confidentiality of information. Particularly this category comprises the information distribution systems and the individual’s capabilities of obtaining information on different topics.
The assessment of this facet of work environment control shows the degree of the employees’ involvement in different business-relevant aspects, which especially comprises the distribution and accessibility of information. Compared to the category ‘Communication’, which describes how information is being exchanged, this dimension covers what information is shared, accessible or confidential for employees.
Given that limiting information tended to be a mean of exercising power in the past it became more of an instrument of knowledge exchange (DAFT & LEWIN 1993). Furthermore, control of information accessibility, together with the formal controls described in the category ‘Time’, are the first forms of control freedom-advocating organizations loosen up, up to the point of abolishment in some cases (KEIL 2011, SEMLER 1995).
4.2.7 Culture
Ultimately a seventh control dimension could be identified representing the least tangible and hence the most subtle dimension: company culture. In particular it comprises the entity of organizational, departmental and team-level values that form the philosophy people incorporate in the work environment. Furthermore statements on the company’s particular power and purpose of existence were included to assess the present culture, as well as disclosures of the individual’s motivation contributed to the examination.
Culture here represents the degree of idealism and identification with the team, department or organization, whatever has the strongest influence on the individual’s attitude. These levels of organizational self-designation and -definition are visualized as the top two levels in figure 4-3, namely: company mission and core values. Examining this dimension, particular focus was directed on the individual’s perception of the value presence as well as on their resulting influence on the individual.
Organizational culture which is defined as ‘a system of shared values and norms that indicate appropriate attitudes and behaviors for organizational members’ (O’REILLY ET AL. 1991) is an important tool and lever for guiding employees behavior (DEAL & KENNEDY 1982) controlling and steering it in an informal way. Since company culture is permanently present within the individual, it penetrates decision-making at many levels in different domains and is therefore hard to separate precisely from other control dimensions. This circumstance accounts for the reciprocal relationship of culture and control, since culture partly emerges as a contingency of factors influenced by the present control mix and in turn itself influences the present control mix (CANGARLI & DELEN 2012). Anyway culture and values have to be considered as one dimension of control and freedom itself, given that they represent one of the most powerful management tools according to CANGARLI & DELEN (2012).
37
4.2.8 Non-independent aspects and dimensions of work environments
After a close examination of a multitude of classifications and forms of control as well as environmental factors and properties important for innovation together with the assessed data, several aspects of work environments were ultimately not considered to constitute dimensions of control and freedom that are independent from the aforementioned seven.
One of the first things and most frequent thing that people named when asked about what contributes the most to the innovativity of their work environment was having a flat hierarchy. Hierarchy is an obvious and important aspect defining work environments and setting the boundaries of individual authority, enforced by job titles and job descriptions. Although there already exist validated frameworks on impacts of hierarchy dimensions on organizations like HOFSTEDE’s (2001) concept of Power Distance, here hierarchy was considered a result of decision-making capabilities in different categories, especially ‘objectives’ and ‘processes’ together with the presence of constraints in categories like ‘information’, ‘communication’, ‘budget’ and ‘time’, instead of forming an independent dimension of its own. Hence, the flatness of the hierarchy and the formality of interaction as well as the strictness of managerial will be disclosed be the detailed investigation of the other dimensions.
The same circumstance concerns decision-making. As pointed out before, the power to make decisions and to take certain actions became the central element defining the degree of control and freedom in each of the identified categories. Therefore it cannot form a category itself, because it is the core statement that the assessment of the environment regarding each category will provide.
Another criteria used extensively for distinguishing between control forms and environments is the degree of bureaucracy and formality. The first reason why it is not considered as a control dimension here is that no reasonable counterpart could be identified representing a degree of freedom for bureaucracy or formality, in contrary to the other seven dimensions. Furthermore the concept of bureaucracy, comprising mainly means of formal control, regulating how to execute tasks is already contained in the dimension ‘processes’ to a great extent and also included in other categories as ‘communication’, ‘budget’, and ‘time’. Therefore here it was rather considered as an attribute of the control dimension, also treated that way in literature (POSKELA & MARTINSUO 2009), instead of representing a category of investigation.
Finally there is a need to clarify the time, since its use might be misleading in this thesis. Forming an independent dimension, the category ’time’ comprises the outermost boundary conditions of work environments that define when and where work should be conducted, mainly defined by freedom in regard of work time, but also including freedom to work from remote. Apart from that meaning, time as defined by the project management triangle, see figure 4-4 below, as a specification of a project or product objective is covered by the ‘objective’ dimension, where decisions on objectives are examined and neither form an individual dimension of control and freedom here.

38
4.3 Determination of dimension scales and assessment methods
Having identified dimensions of individual freedom in which control can be exerted, scales have to be defined by which the environments are going to be assessed regarding the different dimensions. By evaluating the company’s work environment by means of these scales, ultimately the present degree of individual freedom can be depicted along with the correspondent managerial set of controls.
Therefore, a display method has to be established for every dimension that is capable to describe the investigated environments appropriately. The models for this purpose that underlie the respective dimension have been derived from the evaluation of the in-depth case studies, supported by the insights of the previous literature research. The goal was to create an overarching framework for each domain of control and freedom that enables the future tool to assess as many different innovative work environments as possible.
Figure 4-5: Project Management Triangle - DEMARCO 2008
Figure 4-6: Work environment assessment

39
It is particularly important to stress here, that since the tool’s purpose is displaying environments to enable their comparability, it is not intended to include or even suggest any kind of rating of the displayed environments, nor is it aimed for to rate the organizations‘ innovativeness by investigating their internal work environments. Therefore following approach for the scales’ definition, utilization and alignment has been chosen: Given that every of the dimensional scales is one-dimensional, scoring close to one end of the scale stands for an extensive utilization of control in this domain, while scoring close to the other end represents the absence of control, which means a high degree of freedom in that dimension. While these circumstances mark the two scale ends, a flowing transition from control to freedom or the other way round allows environments to score anywhere in between these extremes. The lower magnitudes of the scales close to the chart’s center were here chosen to represent control, whereas the high magnitudes represent a high degree of freedom literally spanning the individual’s area of freedom by assessing the exertion of control in the different dimensions.
Nevertheless, given that the final depiction is intended using these simple scales in seven dimensions, it might tempt to make generalizing, one-dimensional conclusions as calling one environment ‘better’ than another one. This might occur in case that one environment would continuously score higher on next to every scale than the comparison environment, see figure 4-8, automatically implying that more freedom would be more desirable for the individual.
Since the depictive illustration of the investigated environment might mislead to such inadequate oversimplifications, it is necessary to state here explicitly that the tool‘s purpose is not to rate environments. Its objective is rather to visualize them by differentiating between control forms composing and defining them and measuring the control’s intensity. Moreover it would enable further investigation on what control mixes are appropriate for which businesses or particular situations.
Figure 4-7: Spanning individual freedom
TIME
BUDGET
OBJECTIVES
PROCESSESCULTURE
COMMUNICATION
INFORMATION

40
In order to grant a comparable level of detail on the scales of the different dimensions, it is convenient to forestall here, that numerical scales have been chosen, displaying values from one to five and allowing intermediate steps, since this concerns every dimension. This choice was made for several reasons that will be disclosed in the explanation of the individual dimensional frameworks in detail, but mainly it resulted from the circumstance, that cases in dimensions could best be distinguished by steps of five, or by steps of three in which case a staged scale was used comprising the values one, three and five. Accompanying the numerical depiction of the environments by the scales, additional descriptive information will be provided, covering the dimension content that has not been incorporated in the organization’s scale score.
The future tool’s assessment method was developed together with the framework and establishment of the scales. Therefore these three elements of the in-detail data evaluation: overarching frameworks, illustrating scales and the future assessment method will be disclosed examining the different dimensions one at a time in the following, to provide a comprehensive understanding of the underlying assumptions and resulting choices made for the tool’s establishment.
4.3.1 Time
The time dimension comprises control means regarding the outermost boundary condition that define the work environment in regard to when and where work is conducted. Assessing these topics it represents the degree of goal orientation, describing whether work gets measured by outcomes, granting freedom of time and location for achieving these, or measuring work by the invested time and therefore controlling the employee’s input.
Based on the investigated information of eleven dialogues on these elements of control accompanied by insights from research literature, four core inquiry items have been chosen to contribute to this control dimension’s assessment:
Figure 4-8: Different possible environments
TIM
OBJ
PRO
BUDCUL
COM
INF
Environment #1TIM
OBJ
PRO
BUDCUL
COM
INF
Environment #2
41
time measurement, meeting attendance, vacation taking and remote work.
Time measurement is the most obvious element forming the boundary conditions of conducting work. However, the different cases showed that there are more matters contributing to the present degree of freedom in this dimension apart from the fact, where the organization implements flextime or not.
In cases of no formal regulation of work time, the obligation of meeting attendance can undermine the freedom of time, according to RESSLER & THOMPSON (2010), since they would force the individual to come to a certain place at a certain time. In most examined cases this obligation of course greatly depends from the person assessing the meeting as well as from the meeting’s purpose. Anyway there were cases employing freedom of work time regarding this impediment, which followed the principle that the employee himself has to decide if the purpose of the meeting could be achieved attending it or by other means like for example a phone call, being more productive not attending it. These findings were also confirmed by cases described in literature for instance by FRIED (2010), SEMLER (1995) and SEMLER (2003).
A similar circumstance could be observed for vacation taking. While in some cases there existed a classical application procedure where the employee’s vacation has to be approved by the manager or by the human resources department, applying for vacation became obsolete in environments not exerting control over time. However even if it was up to the consideration of the individual when and how long to leave for vacation, a certain coordination with colleagues was required in most cases.
The fourth item, having the possibility to do remote work was especially present at companies of the software development business. Still there were additional companies, implementing this flexibility even in cases where a lot of presence is required or at least very facilitating. In cases remote work was formally prohibited, it was justified by matters of confidentiality.
The intention was to directly examine information on these topics, classify it and ultimately convert it to one numerical score on the dimension scale. Therefore the extremes have to be defined, that represent the highest and lowest scale scores.
Having assessed eleven cases, different degrees of exerting control regarding these criteria and distinct means of their implementation could be observed. For enabling the model to also assess further work environments beyond the scope of innovative ones, the extremes were extrapolated from the examined cases.
So, how can the freest environment possible be described in terms of the four items of assessment in this category of freedom of control? It would be an environment without measurement of work time, where individuals can choose when to work freely. Meetings would not be mandatory but rather up to the consideration of the individual. Vacation could be taken without having to ask anyone’s permission just by coordinating the minimal necessary amount with people affected from the absence and there would be the freedom to work from remote without any formal restriction.

42
In contrast the most intense control possible in this dimension, marking the other extreme of the scale, would form an environment where fixed work hours are prescribed and meetings are mandatory. Vacation would have to be applied for or assigned, without any possibility to influence the likeliness of approval or to choose the period and it would not be possible to work from a remote location instead of coming to the organization’s facilities.
These two scenarios were chosen to form the outermost values of the ’time’-dimension scale ranging from one to five. Any situation that would be considered in between the two extremes regarding these four aspects, should consequently score in between one and five. The midway scenario described by these four items of investigation was considered comprising for example flextime as work time measurement method and offering the possibility to discuss a meeting’s necessity, when assigned by a direct or higher level manager. Furthermore vacation would require coordination with the responsible person or department with a significant amount of personal influence but also including a veto-right of the organization. Remote work would here also need approval or coordination underlying the same conditions as vacation taking. A midway scenario like this one should score about three on the assessment scale.
In order to incorporate these four factors into one final value, it was chosen to assess the four aspects of this dimension, providing three multiple choice answers per aspects, correlated with the values one, three and five and subsequently evaluating the average dimension score of the examined environment by deriving the average of the four aspect scores. The following questions have been elaborated for the examination of the required information:
What measurement is used to measure work time?
fixed work hours (x1)
flextime (x3)
not measured (x5)
Is the attendance of meetings scheduled by your manager or other executives mandatory?
mandatory (x1) but still excusable by vacation, illness etc.
discussable (x3) necessity of attendance, day and time, or solve issue by email or other alternative
up to me (x5) to decide if my attendance is valuable or not, like an invitation, no neg. conseq. of
not going
How is taking vacation handled?
requires approval (x1) limited amount of annual vacation, you apply for time, manager makes decision
coordination (x3) vacation is taken in coord. with manager, veto very unlikely
up to me (x5) you can take vacation how much and whenever you want, just coordination
required
Are you allowed to work from home?
not possible (x1) have to work at the office
approv./coordinat. (x3) possible, but requires approval/must ask for in advance/manager has veto
up to me (x5) may work from other places whenever you want, just coordinate with persons that
might need you
Figure 4-9: Questionnaire section: time
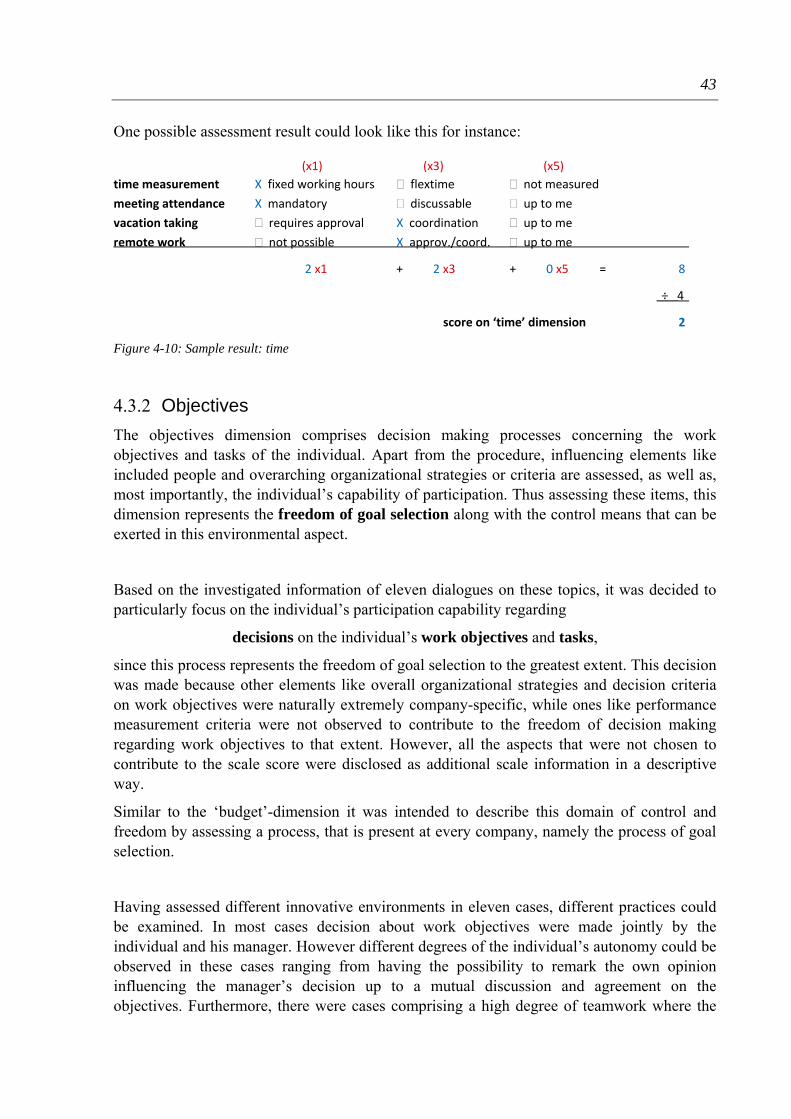
43
One possible assessment result could look like this for instance:
(x1) (x3) (x5) time measurement X fixed working hours flextime not measured
meeting attendance X mandatory discussable up to me
vacation taking requires approval X coordination up to me
remote work not possible X approv./coord. up to me
2 x1 + 2 x3 + 0 x5 = 8
÷ 4
score on ‘time’ dimension 2
Figure 4-10: Sample result: time
4.3.2 Objectives
The objectives dimension comprises decision making processes concerning the work objectives and tasks of the individual. Apart from the procedure, influencing elements like included people and overarching organizational strategies or criteria are assessed, as well as, most importantly, the individual’s capability of participation. Thus assessing these items, this dimension represents the freedom of goal selection along with the control means that can be exerted in this environmental aspect.
Based on the investigated information of eleven dialogues on these topics, it was decided to particularly focus on the individual’s participation capability regarding
decisions on the individual’s work objectives and tasks,
since this process represents the freedom of goal selection to the greatest extent. This decision was made because other elements like overall organizational strategies and decision criteria on work objectives were naturally extremely company-specific, while ones like performance measurement criteria were not observed to contribute to the freedom of decision making regarding work objectives to that extent. However, all the aspects that were not chosen to contribute to the scale score were disclosed as additional scale information in a descriptive way.
Similar to the ‘budget’-dimension it was intended to describe this domain of control and freedom by assessing a process, that is present at every company, namely the process of goal selection.
Having assessed different innovative environments in eleven cases, different practices could be examined. In most cases decision about work objectives were made jointly by the individual and his manager. However different degrees of the individual’s autonomy could be observed in these cases ranging from having the possibility to remark the own opinion influencing the manager’s decision up to a mutual discussion and agreement on the objectives. Furthermore, there were cases comprising a high degree of teamwork where the
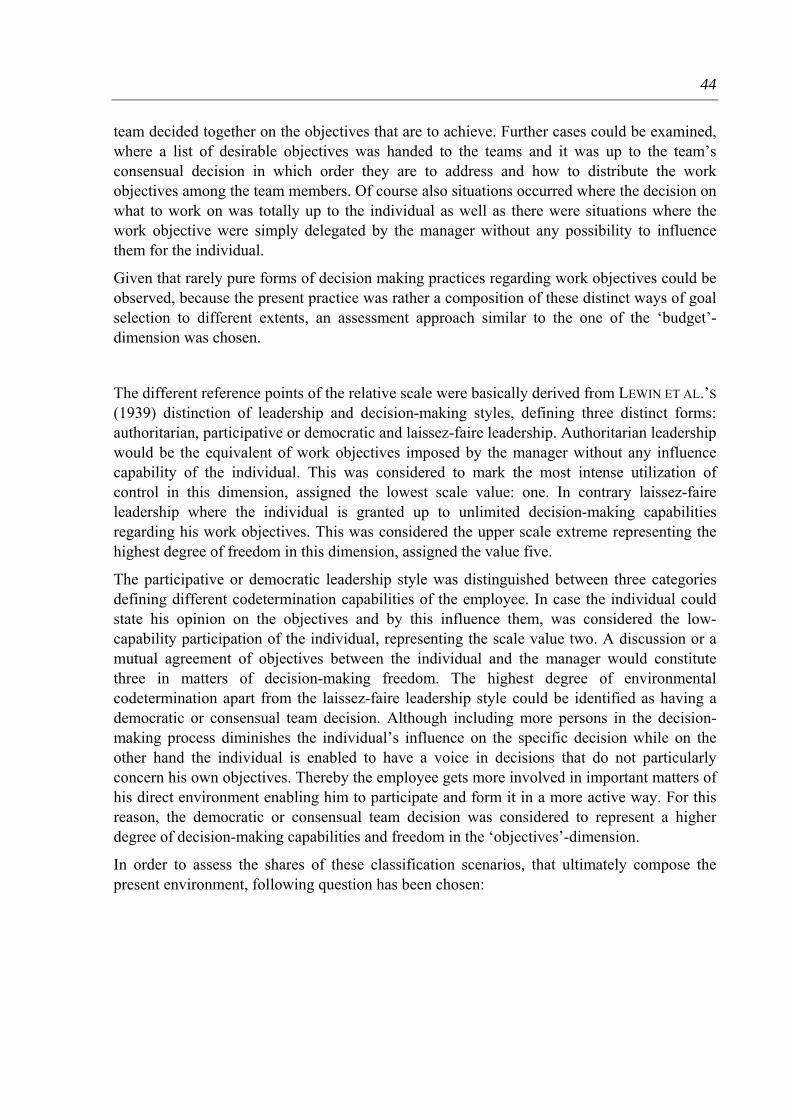
44
team decided together on the objectives that are to achieve. Further cases could be examined, where a list of desirable objectives was handed to the teams and it was up to the team’s consensual decision in which order they are to address and how to distribute the work objectives among the team members. Of course also situations occurred where the decision on what to work on was totally up to the individual as well as there were situations where the work objective were simply delegated by the manager without any possibility to influence them for the individual.
Given that rarely pure forms of decision making practices regarding work objectives could be observed, because the present practice was rather a composition of these distinct ways of goal selection to different extents, an assessment approach similar to the one of the ‘budget’-dimension was chosen.
The different reference points of the relative scale were basically derived from LEWIN ET AL.’S
(1939) distinction of leadership and decision-making styles, defining three distinct forms: authoritarian, participative or democratic and laissez-faire leadership. Authoritarian leadership would be the equivalent of work objectives imposed by the manager without any influence capability of the individual. This was considered to mark the most intense utilization of control in this dimension, assigned the lowest scale value: one. In contrary laissez-faire leadership where the individual is granted up to unlimited decision-making capabilities regarding his work objectives. This was considered the upper scale extreme representing the highest degree of freedom in this dimension, assigned the value five.
The participative or democratic leadership style was distinguished between three categories defining different codetermination capabilities of the employee. In case the individual could state his opinion on the objectives and by this influence them, was considered the low- capability participation of the individual, representing the scale value two. A discussion or a mutual agreement of objectives between the individual and the manager would constitute three in matters of decision-making freedom. The highest degree of environmental codetermination apart from the laissez-faire leadership style could be identified as having a democratic or consensual team decision. Although including more persons in the decision-making process diminishes the individual’s influence on the specific decision while on the other hand the individual is enabled to have a voice in decisions that do not particularly concern his own objectives. Thereby the employee gets more involved in important matters of his direct environment enabling him to participate and form it in a more active way. For this reason, the democratic or consensual team decision was considered to represent a higher degree of decision-making capabilities and freedom in the ‘objectives’-dimension.
In order to assess the shares of these classification scenarios, that ultimately compose the present environment, following question has been chosen:
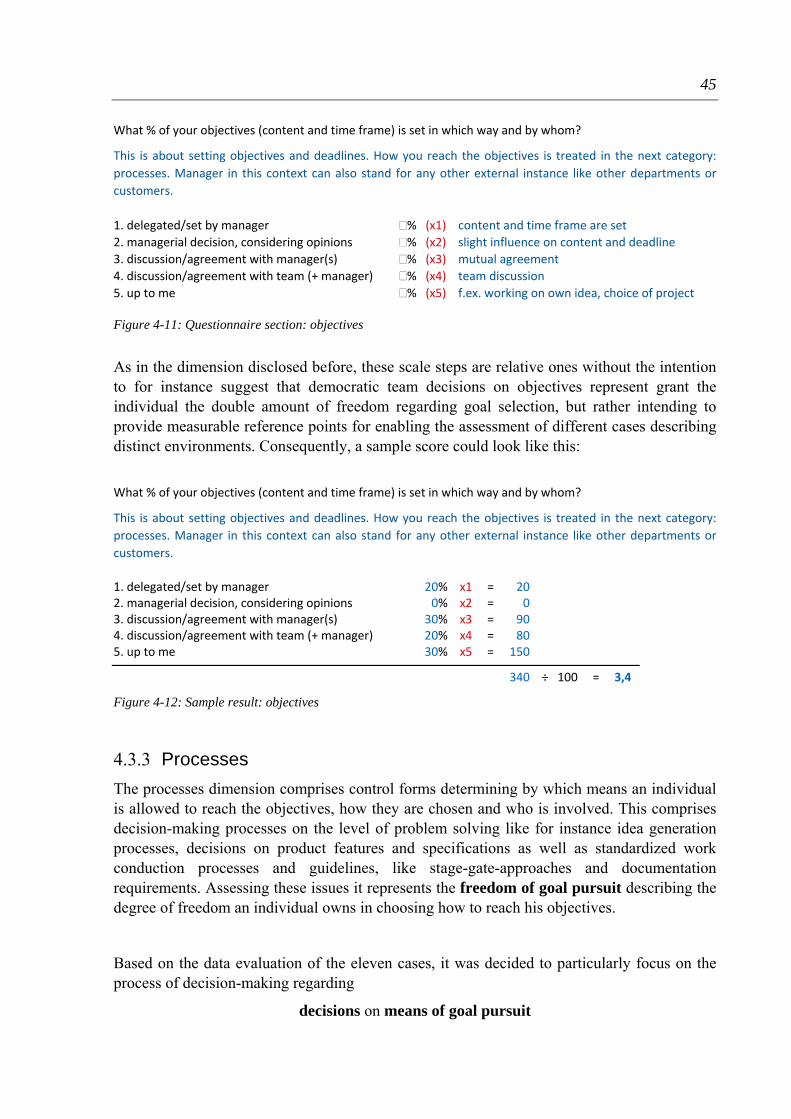
45
What % of your objectives (content and time frame) is set in which way and by whom?
This is about setting objectives and deadlines. How you reach the objectives is treated in the next category:
processes. Manager in this context can also stand for any other external instance like other departments or
customers.
1. delegated/set by manager % (x1) content and time frame are set
2. managerial decision, considering opinions % (x2) slight influence on content and deadline
3. discussion/agreement with manager(s) % (x3) mutual agreement
4. discussion/agreement with team (+ manager) % (x4) team discussion
5. up to me % (x5) f.ex. working on own idea, choice of project
Figure 4-11: Questionnaire section: objectives
As in the dimension disclosed before, these scale steps are relative ones without the intention to for instance suggest that democratic team decisions on objectives represent grant the individual the double amount of freedom regarding goal selection, but rather intending to provide measurable reference points for enabling the assessment of different cases describing distinct environments. Consequently, a sample score could look like this:
What % of your objectives (content and time frame) is set in which way and by whom?
This is about setting objectives and deadlines. How you reach the objectives is treated in the next category:
processes. Manager in this context can also stand for any other external instance like other departments or
customers.
1. delegated/set by manager 20% x1 = 020 2. managerial decision, considering opinions 00% x2 = 000 3. discussion/agreement with manager(s) 30% x3 = 090 4. discussion/agreement with team (+ manager) 20% x4 = 080 5. up to me 30% x5 = 150
340 ÷ 100 = 3,4
Figure 4-12: Sample result: objectives
4.3.3 Processes
The processes dimension comprises control forms determining by which means an individual is allowed to reach the objectives, how they are chosen and who is involved. This comprises decision-making processes on the level of problem solving like for instance idea generation processes, decisions on product features and specifications as well as standardized work conduction processes and guidelines, like stage-gate-approaches and documentation requirements. Assessing these issues it represents the freedom of goal pursuit describing the degree of freedom an individual owns in choosing how to reach his objectives.
Based on the data evaluation of the eleven cases, it was decided to particularly focus on the process of decision-making regarding
decisions on means of goal pursuit

46
to assess the numerical score on this freedom and control domain. This element was chosen, because the other examined items like standardized work conduction processes and guidelines were too organization-specific to enable a qualitative evaluation and comparison regarding their degree of freedom.
Given that this category features a high similarity to the ‘objectives’-dimension, solely concerning decisions on how to reach objectives instead of what objectives to reach, this particular process was considered the lowest common denominator, would be an essential element of every organizational environment.
Having assessed different innovative environments in eleven cases, different practices could be examined. There were cases, where particular formal processes were regulating and assuring the objective achievement, by appointing milestones or gates where certain achievements have to be realized. The best-known representatives are phase-gate or stage-gate processes, adapted to the specific needs of the company and the content. These formal rules simplify collaboration on subjects where the contribution of different individuals has to be organized and coordinated, while there can be allowed a certain degree of individual freedom between the processes’ reference points. In case the organization did not utilize specific formal processes, it could be observed that their coordinating function was provided by established guidelines which served as an orientation for employees on how work should be conducted. These could comprise processes and tools, available to be used by the individuals without having to aw well as aspired values providing means of orientation regarding decisions on work conductions or product specifications like for instance customer satisfaction, quality or minimal costs. Other means observed were furthermore team meetings and discussions where decisions were made in the group on the best way of pursuing the objective. Depending on the decision subject some of the decisions on work conduction were made by the individual without any influence of further persons. These described practices could be observed regarding decisions featuring relatively low importance and small extent, like for instance the choice of whether to cast or to mill a required component, up to decisions on relatively high importance levels like for instance how to break down a two year project to defined work packages.
Since the decision process regarding means of goal pursuit could hardly be described by one of the scenarios in 100 % of the decision situations, the same assessment approach was chosen as regarding the ‘budget’- and ‘objectives’-scale.
Therefore the lowest degree of freedom and therewith the highest degree of control exertion was assigned to situations where the means for conducting a task were predefined by rules or a formal process, representing the lowest scale score, which is one. Guidelines, having a less formal character than rules, ranging from instructions comprising flexible reference points to factors that should be taken into consideration when choosing the means for goal pursuit, were considered to describe a higher degree of freedom. Democratic or consensual group decisions were regarded to grant the individual a higher degree of decision-making freedom than the aforementioned situations, since no formal or explicit formulated control means are in use. Decision processes requiring coordination with further persons, up to considering or

47
conforming to their requests, while the individual still owns the competence to take that decision as also observed during the investigation, defines the next scale step of freedom in this dimension. Finally, decisions that were totally up to the individual without requiring any other person’s input or regarding specific rules or guidelines, was chosen to mark the upper scale extreme, assigned the value five.
In order to assess the shares of these classification scenarios that ultimately compose the present environment, the same method has been chosen as in examining the previous dimensions’ scores. The following question has been chosen:
What % of your work falls into which category of goal pursuit?
1. by rules % (x1) defined processes/procedures
2. by guidelines % (x2)
3. by team discussions/decisions % (x3) team agreement on best procedure
4. up to me + coordination % (x4) own decision + comm. with affect. people/evtl. ask for opinion
5. totally up to me % (x5) independent decision on how to achieve the goal
Figure 4-13: Questionnaire section: processes
Again these situations described relative scale steps although it was attempted to elaborate uniform step increments. A sample score in this dimension of control and freedom could look like this:
What % of your work falls into which category of goal pursuit?
1. by rules 50% x1 = 50
2. by guidelines 00% x2 = 0
3. by team discussions/decisions 30% x3 = 90
4. up to me + coordination 10% x4 = 80 5. totally up to me 10% x5 = 50
270 ÷ 100 = 2,7
Figure 4-14: Sample result: processes
4.3.4 Budget
This dimension comprises rules, guidelines and practices representing control means regarding expenses that occur at the workplace such as equipment, material and business travel, as well as opportunities for advanced training and work benefits. Assessing these issues it represents the degree of financial freedom enabling the individual to purchase things that are necessary or supportive for achieving the objectives.
Based on the data evaluation of the eleven cases, it was decided to particularly focus on expenses that are inevitable for conducting work, -mainly comprising
purchase of material and external services

48
on a non-regular basis. This agreement consciously excludes equipment, although appropriate equipment is necessary for work conduction. The reason therefore is that approval of equipment purchases are often treated in distinct processes of decision making levels that do not involve the interviewed individual. The same circumstance can be observed in most other cases when it comes to travel expenses and advanced trainings. Regarding work benefits, a great variety of benefits emerged that impeded this aspect’s contribution to the assessment of financial freedom. Furthermore general decisions on project investments are not treated separately in this category, since the freedom to make such decisions results of the score on the ‘objective’-scale, which discloses whether the individual can set his own objectives and thus undertake his own projects using his financial freedom to conduct his work. This capacity also results as a natural consequence, depending on the employee’s position in his company.
For this reason, the intention was to examine this control dimension on the lowest common denominator that organizations and individual cases have in common, which is the individual’s indispensable expenses for work conduction. Hence, particular focus has been directed at examining the regulations concerning budget allocation for these essential expenses.
Having assessed different innovative environments in eleven cases, different manners of budget allocation could be observed. Consistent with STEVENSON & GUMPERT’s (1985) suggestion to overcome the dualism of control and freedom in the aspect of budget by committing smaller amounts of money to employees at more frequent intervals to achieve a balance between autonomy and accountability, there were cases where the individual had a certain purchase limit up to which he could make purchase decisions without asking for permission. To exceed this limit it was necessary to ask the manager for approval. If the purchase would also have exceeded the manager’s limit, the manager would have to ask for his manager’s purchase permission, to complete the acquisition. Naturally, a more generous purchase limit came along with higher hierarchical positions. Another distinction between purchase limits besides their ceiling is the circumstance in which the purchases that did not require approval will be controlled afterwards or not. In some cases control was implemented afterwards in certain frequencies, to assure the appropriate usage of money and to intervene in case of significant negative deviations. Apart from the usage or purchase limit concepts, cases could be examined using the concept of budgets, where the individual or the team receives a certain amount of money at its disposal for conducting work or working on a particular project. In these cases there was no further need for managerial approval, but since it was up to the individual to economize his budget, these cases featured a distinct dynamic when it came to asking for additional funding. Apart from that, the budget concept was mostly implemented in managerial positions, while purchase limit regulations were predominant in non-managerial levels.
To establish an overarching framework, the following model was elaborated which should be able to describe the use of financial control in each of the eleven assessed environments. Independent of whether a purchase limit was implemented or an individual budget assigned, there was always a correspondent amount of financial means that was at the individual’s

49
disposal. In the case of the purchase limit it was the purchase limit, while in the case of budgets it was the budget size. This was the first distinction made in regard to the degree of freedom and control in this matter. Thereby the absence of requiring approval was assigned a higher degree of freedom than in cases in which financial means have to be applied for. As mentioned already, in some cases a follow-up control could be observed, while there was no post-control in others. This was used for a more subtle distinction between individual’s financial decision capabilities that do not require approval. Another set of cases could be observed, mainly in project based research and development environments, where a purchase limit or an assigned budget per se did not exist. In these cases every purchase required approval and every budget has to be applied for and granted. A varying range of difficulty levels could be examined concerning additional purchase or budget approval, dependent on the organization as well as the individual position and the subject matter. Budget or purchases requiring approval formed the second set of situations which were considered to feature a lower degree of freedom since they are controlled by anterior control. Furthermore, these situations were distinguished by the difficulty of receiving approval, representing the friction within the approval process and the resistance of people influencing it, which undermines the individual’s freedom to make financial decisions. Therefore the situations were classified in three difficulty levels for gaining approval: easy, medium and hard. Since the absolute amount of financial means defining the individual budgets or purchase limits examined in the cases varied greatly depending on the assessed company, project and the individual’s work and position, it was deliberately intended to measure the perception of accessibility and appropriateness of additional financial means. This measurement was ultimately chosen over the assessment of absolute values here, because it relates the absolute amount to the respective business and situation, providing more insight into whether the individual feels impeded or controlled by the present practice or experiences a good deal of freedom regarding this matter.
Given that most assessed cases were composed of certain shares of these different situations rather than characterized by the exclusive use of one control mean, the assessment method should provide an average score on the ’budget’ scale without losing assessment precision by generalizing the most common situation over the other ones that exist alongside. Therefore the following question was chosen to assess the individual’s degree of freedom on this scale:
What % of the budget decisions you make for doing your work fall into which budget category?
In other words: how many of the budget decisions are up to you and is there a check afterwards? how many
budget decisions need approval and how much effort does it take to get that money approved? This is about
purchase decisions comprising e.g. tools, material, exceptional equipment, outsourced services (NOT travel
budget, office material or things like a computer mouse)
1. budget/purchase limit – not controlled % (x5) e.g. assigned budget without need for application
2. budget/purchase limit – controlled % (x4) e.g. bills are checked afterwards
3. budget/purchases req. approval – easy to get % (x3) e.g. applying for budget orientated on last year’s
4. budget/purchases req. approval – medium % (x2) higher bureaucratic or persuasive effort
5. budget/purchases req. approval – hard to get % (x1) very hard to get approved
Figure 4-15: Questionnaire section: budget

50
By differentiating the entirety of financial decision situations, the overall degree of individual freedom can be assessed by incorporating the situational shares multiplied with a respective factor. Implementing the sequence that was disclosed before, uncontrolled budgets and purchase limits represent the highest degree of freedom on this scale, assigned the factor five, while budgets and purchases that are hard to get approved define the other scale extreme assigned with the value one. All the situations in between were assigned to the remaining respective multipliers. This was done utilizing consistent steps, representing a relative scale, since examining the exact increments between the situations’ degree of freedom would have exceeded the frame of this thesis. Nevertheless it was attempted to define appropriate steps on each scale to the best extent possible. Finally a sample score on the ‘budget’-scale could look like this:
1. budget/purchase limit – not controlled 10% x5 = 050 2. budget/purchase limit – controlled 30% x4 = 120 3. budget/purchases req. approval – easy to get 00% x3 = 000 4. budget/purchases req. approval – medium 50% x2 = 100 5. budget/purchases req. approval – hard to get 10% x1 = 010
280 ÷ 100 = 2,8
Figure 4-16: Sample result: budget
4.3.5 Communication
This dimension comprises control means for regulating and directing interactions of individuals. This includes the communication media, communication frequency and particularly communication partners as well as the establishment and maintenance of communication. Assessing these topics represents the freedom of information flow, which describes the individual’s capabilities to exchange information with persons inside and outside the organization.
Based on the investigated information from eleven dialogues on these topics, it was decided to particularly focus on the openness of the communication by assessing the
effort for establishing and maintaining communication.
This particular aspect was chosen because the means of communication were found to be quite company specific, without disclosing the degree of control in this dimension. By including the communicational effort associated with communication to different partners, formal restrictions and bureaucratic processes could be disclosed, which is particularly important since the communication’s formality is considered an important factor regarding the company’s innovatively (MEDINA ET AL. 2005). Furthermore it was considered to suitably depict the individual’s communication competence, given that intended or unintended as well as inevitable impediments were assessed.
The intention was to ultimately incorporate the character and ease of communication with different counterparts into one representative numerical score describing the degree of freedom regarding this dimension.

51
Having assessed eleven cases, different communication practices could be observed toward distinct communication partners. The simplest and most unrestricted ways of contacting persons which could be observed comprised simply walking up their desks, calling them or sending an email. Communication was mostly handled this way with direct work colleagues and direct managers, but there were also cases where this closeness of communication was present beyond departmental boundaries. The manner of writing an email needs further specification here, since choosing this media of communication might in some cases be the simplest and most uncomplicated way while in others it might be the only appropriate one in case the contact is not established to a sufficiently intense degree yet. There were cases in which communication was preferably initiated by an intermediate person, mostly a manager or another department, and then passed on to the individual with or without forms of interactive control, like putting a responsible person, often with broader decision-making capabilities, in the carbon copy of the email for instance. Another popular communication practice was holding meetings, this could be conducted in various constellations including persons from different or intentionally just one department at distinct hierarchy levels. Also the number of persons, length and procedure of the meeting varied greatly. Furthermore there were cases where direct contact was not desired at the organization which comprised mostly press contact or publicity because of confidentiality reasons. In most cases, direct contact with upper level management was also not desired, this could be experienced as unexpressed implication of inappropriateness up to an explicit prohibition. In most cases where communication was undesired or restricted, there were established means or channels for communication in these instances that the individual could use.
In any case, cautiousness is required assessing these practices since communication means, similar to processes, can facilitate communication by providing standardized ways, but also might impede communication by implementing overly formalized means. Furthermore, since these practices could intentionally be implemented to serve as control means regarding communication, they could be perceived as such even in cases that were not intended by their implementation. For that reason ultimately the individual perception of these communication processes was chosen as the element of assessment, particularly focusing on the effort associated with it.
Examining the individual degree of freedom regarding communication by measuring the impediments connected with it, the following assessment has been chosen. Firstly, the entity of communication partners, which could be examined by the cases’ evaluation were classified into types that were found to exist in almost every organizational environment:
team and colleagues, direct manager(s), higher level management, CEO(s), other departments or business units, customers and partners, consumers, own
workers, public and press
These communication counterparts were chosen to form the items of investigation for the ‘communication’ scale. Furthermore different levels of difficulties were defined and correlated with numerical values that represent their degree of freedom. Therefore, five categories have been chosen to describe the effort of communication establishment and maintenance:
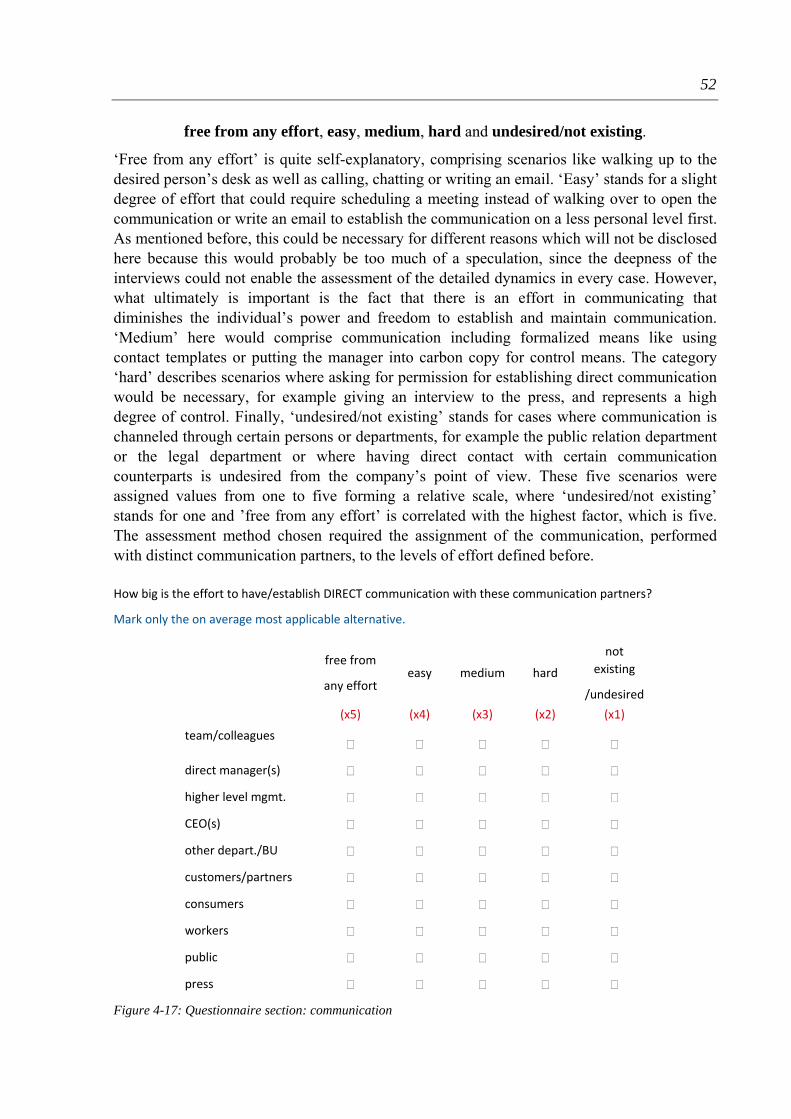
52
free from any effort, easy, medium, hard and undesired/not existing.
‘Free from any effort’ is quite self-explanatory, comprising scenarios like walking up to the desired person’s desk as well as calling, chatting or writing an email. ‘Easy’ stands for a slight degree of effort that could require scheduling a meeting instead of walking over to open the communication or write an email to establish the communication on a less personal level first. As mentioned before, this could be necessary for different reasons which will not be disclosed here because this would probably be too much of a speculation, since the deepness of the interviews could not enable the assessment of the detailed dynamics in every case. However, what ultimately is important is the fact that there is an effort in communicating that diminishes the individual’s power and freedom to establish and maintain communication. ‘Medium’ here would comprise communication including formalized means like using contact templates or putting the manager into carbon copy for control means. The category ‘hard’ describes scenarios where asking for permission for establishing direct communication would be necessary, for example giving an interview to the press, and represents a high degree of control. Finally, ‘undesired/not existing’ stands for cases where communication is channeled through certain persons or departments, for example the public relation department or the legal department or where having direct contact with certain communication counterparts is undesired from the company’s point of view. These five scenarios were assigned values from one to five forming a relative scale, where ‘undesired/not existing’ stands for one and ’free from any effort’ is correlated with the highest factor, which is five. The assessment method chosen required the assignment of the communication, performed with distinct communication partners, to the levels of effort defined before. How big is the effort to have/establish DIRECT communication with these communication partners?
Mark only the on average most applicable alternative.
free from
any effort easy medium hard
not
existing
/undesired
(x5) (x4) (x3) (x2) (x1)
team/colleagues
direct manager(s)
higher level mgmt.
CEO(s)
other depart./BU
customers/partners
consumers
workers
public
press
Figure 4-17: Questionnaire section: communication

53
Since the listed communication counterpart categories often comprised several distinct individual counterparts themselves, which would fall into different categories of effort in some cases, the assignment should be made by naming the most applicable case for each category. Thus, a sample score could look like this:
How big is the effort to have/establish DIRECT communication with these communication partners?
Mark only the on average most applicable alternative.
free from
any effort easy medium hard
not
existing
/undesired
(x5) (x4) (x3) (x2) (x1)
team/colleagues X
direct manager(s) X
higher level mgmt. X
CEO(s) X
other depart./BU X
customers/partners X
consumers X
workers X
public X
press X
3 x5 + 1 x4 + 2 x3 + 3 x2 + 1 x1 = 32
÷ 10
3,2
Figure 4-18: Sample result: communication
In case a category of communication partners did not exist in the assessed individual’s environment, the row remained unanswered and the average calculating factor was adapted without problem since the dimension scale is a flowing one, ranging from one to five.
4.3.6 Information
This dimension comprises the content of information that is shared inside the organizational environment and includes aspects like accessibility and distribution as well as tools and practices therefore. Representing the freedom of information acquisition, this category discloses on which topics the individual can get information, showing in which aspects of business and organizational life he is able to get involved.

54
Based on the data evaluation of the eleven cases, particular focus was directed on the individual’s capability of
accessing information
regarding different issues. Given that the tools and practices for accessing information and its distribution are relatively company specific, the degree of difficulty of accessibility was chosen as the item for this dimension’s assessment, since this process characteristic was considered to disclose the freedom of the individual together with potential means of control to the greatest extent.
As this category features a high similarity to the ‘objectives’-dimension, it was intended to ultimately derive the individual’s degree of freedom by incorporating the management practices regarding different information domains into one numerical statement.
Having assessed different innovative environments in eleven cases, different practices could be examined. Regarding certain topics, the company was particularly interested to spread and provide information to its employees, for example information about work methods and processes which disclose how particular work should be conducted. Another practice that could be observed was a passive approach to the matter. In these cases information was available, but neither actively spread nor considered confidential. It could be accessed if required, which could occur in various ways, for instance seeking it in an internal database, looking it up in respective documentation or using different means of communication that were disclosed in the prior dimension. Furthermore a third set of practices could be identified, comprising topics that were not accessible to certain individuals because of issues of confidentiality or privacy, for example on the topic of salaries in most of the assessed cases. The accessibility might vary depending on the hierarchical position and work of the individual. Limiting the individual’s capability for accessing information could be intended in some cases, representing a means to preserve power in particular positions, but in other cases result from strategic decisions to not risk the information’s diffusion outside the organization regarding certain topics. Furthermore it could also simply be a consequence of intentions to protect individual privacy. However, limiting information accessibility also limits the individual’s degree of possible involvement and thus his individual freedom of information acquisition.
To examine the individual’s freedom in this dimension a similar assessment method has been chosen as for the ’communication’ dimension. Firstly, domains of information have been derived from the evaluated data, comprising general topics which play a role in every company’s existence, namely:
product information, information on running projects, current research, business numbers, salaries, customer information, business strategies,
hiring as well as work methods and processes.
55
‘Product information’ comprises specification and details of products and services down to a desired degree of detail. ‘Running projects’ represents what projects and businesses are conducted inside the organization on a rather mature level, while ‘current research’ might stand for projects that still have a significant degree of uncertainty. ‘Business numbers’ mainly comprise financial information and information like numbers of employees, turnover etc. ‘Salaries’ was treated as a specific piece of information since it was intended to examine the hierarchical and organizational threshold which enables access to particularly confidential information. ‘Customer information’ comprises specific information describing the customer and the professional relation towards him like preferences, contact persons, contract information etc. ‘Business strategies’ stand for overarching strategies, representing the third and fourth level of decision-making in figure 4-4 see page 33, influencing decisions made at lower levels, for instance decisions on work objectives or on product specifications. ‘Hiring’ describes the involvement of the individual in everything that concerns new hires. Finally, work methods and processes are the means facilitating and regulating work conduction, disclosed in the ‘process’-dimension. These information topics were chosen to form the items of investigation for the ‘information’-scale. Furthermore, different categories of information accessibility were defined and correlated with numerical values that represent their degree of freedom. Therefore, three categories have been chosen to describe the ease of information acquisition:
actively spread/enabled, accessible and not accessible/undesired.
‘Actively spread/enabled’ describes information whose distribution is greatly appreciated and supported within the organization, thereby it can be actively spread by different means, for instance by leaflets, routines or manuals. ‘Accessible’ stands for information that is not actively spread, but is not restricted access either. It is available if needed but the individual has to take the initiative to acquire it. Finally ’not accessible/undesired’ represents topics on where information acquisition and distribution is not appreciated or even made impossible.
Forming a relative scale, values comprising one, three and five were assigned, similar to the assessment of the ‘time’-dimension. Thereby ‘actively spread/enabled’ was considered to facilitate freedom in this dimension to the highest degree, assigned with the value five, while ‘not accessible/undesired’ represents the other scale extreme, which is assigned the value one. Consequently ‘accessible’ constitutes the midway scenario which scores three on the freedom of information acquisition-scale. The assessment method chosen required the assignment of distinct information topics to the different accessibility categories.
Categorize these types of information by accessibility.
In other words: can you access the information and if yes, is it even actively distributed and spread? What information is confidential/not accessible?

56
actively spread,
enabled accessible
not accessible,
undesired
(x5) (x3) (x1)
product information
running projects
current research
business numbers
Salaries
customer information
business strategies
Hiring
work methods/processes
Figure 4-19: Questionnaire section: information
Since the listed categories of information topics in some cases comprised several elements themselves, which would fall into different categories accessibility in certain cases, the assignment should be made by deciding on the most applicable practice for each piece of information. Thus, a sample score could look like this:
Categorize these types of information by accessibility.
In other words: can you access the information and if yes, is it even actively distributed and spread? What information is confidential/not accessible?
actively spread,
enabled accessible
not accessible,
undesired
(x5) (x3) (x1)
product information X
running projects X
current research X
business numbers X
salaries X
customer information X
business strategies X
hiring X
work methods/processes X
4 x5 + 3 x3 + 2 x1 = 31
÷ 9
≈ 3,4
Figure 4-20: Sample result: information

57
Here again, if a category of information content did not exist in the assessed individual’s environment, the row remained unanswered and the average calculating factor was adapted, without causing any problems since the dimension scale is a flowing one, ranging from one to five.
4.3.7 Culture
This dimension comprises values and the incorporated philosophy that guides, influences and controls the individual’s behavior. This comprises values of declared importance to the company, the department, the team or emerging from the individual’s attitude and motivation. Representing the degree of idealism and identification it discloses to which extent the individual gets influenced by these values and whether they restrict him from taking certain actions.
Based on the investigated information of eleven dialogues on this environmental aspect, four core inquiry items have been chosen to contribute to this control dimension’s assessment:
congruence of values, degree of personal internalization, degree of companywide internalization and intervention in case of violation.
Given that the particular organizational values are naturally very company-specific, their content should not contribute to the examination of personal freedom on this scale. Since the important question is whether the values and philosophy influence people or not, their presence and intensity were chosen to be assessed together with their impact on the individual’s decision and attitude. Since company values and philosophy were observed to be very present and especially regarded in some environments they were seen as a theoretical ideal construct that the company might strive for, but in other cases ultimately they do not influence the individual’s workday life too much which could be observed as a consequence of frequently changing values, perhaps because of high turnover in upper management. In order to assess this issue, firstly it was chosen to examine whether the explicitly formulated company values and philosophy are congruent with the experienced one.
Assuming that every individual acts and makes decisions according to his own set of values and philosophy, which account for his attitude towards certain topics, the degree of accordance with the direct environment’s values and philosophy should be examined, describing the degree of personal internalization and identification. Evaluating the data, cases of high idealism could be observed where official company values were strongly incorporated by the individuals in the department, while in others individuals did not identify themselves to such a high extent with the explicitly formulated philosophy, independently of whether a declared one existed or not and the philosophy’s general presence.
Furthermore, the degree of companywide internalization and identification was assessed since in some cases it was found that a high degree of companywide identification together
58
with a high degree of personal one could create a strong sense of connection and community throughout the entire organization.
This was also observed to have a controlling effect, similar to mechanisms of peer pressure, since the individual’s actions and decisions then were measured and evaluated by these commonly internalized values. Therefore the case of value violation was also chosen to be integrated into the assessment of the company culture’s degree of freedom and control by examining whether intervention in such cases would not happen, which might indicate that values and philosophy do not have too much of a critical value in the environment, whether it would be up to the concerned people or whether it would be up to everyone who witnesses the conflict, as all three cases could be observed by assessing the data.
Featuring a high similarity with the ‘time’-dimension’s assessment practice, it was intended to incorporate the examined situation regarding these four aspects into one final numerical score on the scale of the ‘culture’-dimension. Hence a multiple-choice-type method of assessment was elaborated, providing three answers each, which were correlated with the factors one, three and five, indicating the situation’s contribution to individual freedom and control exerted by company values and philosophy.
For measuring the congruence of values that are explicitly formulated with the ones present in the environment, the extremes were formed by ‘yes, very much’ and ‘not much’. Having a high correlation and congruence was considered to describe a high degree of control, since the people’s behaviors could be guided and regulated very efficiently by describing the desired attitude in the official statements (DEAL & KENNEDY 1982) it was assigned the score one, while not being influenced by organizational values enables freedom to act according to personal ones, which was correlated with the factor five. A third answer ‘somewhat’ should represent the midway scenario, assigned with the value three. Furthermore an fourth alternative was included into this question which was ‘no explicitly formulated company philosophy and values’ which results in excluding the contribution of this question to the final scale score in that case.
Similar approaches were followed in the depiction of the scale’s extremes regarding the degree of personal and companywide internalization. The three answers provided were: ‘high’, ‘medium’ and ‘low’, where ‘high’ depicts the highest degree of influence on values and the highest potential exertion of control, assigned with the factor one and ‘low’ stands for the lowest dependence on values enabling the highest degree of freedom which is five.
The value and philosophy violation case was assessed by describing three possible scenarios of intervention which were ‘not a big deal/can happen’ representing no intervention assigned with the lowest degree of individual freedom which is five, while intervention by ‘concerned people’ describes the midway scenario and intervention by ‘everyone’ described the highest degree of influence and potential control which was assigned the value one.
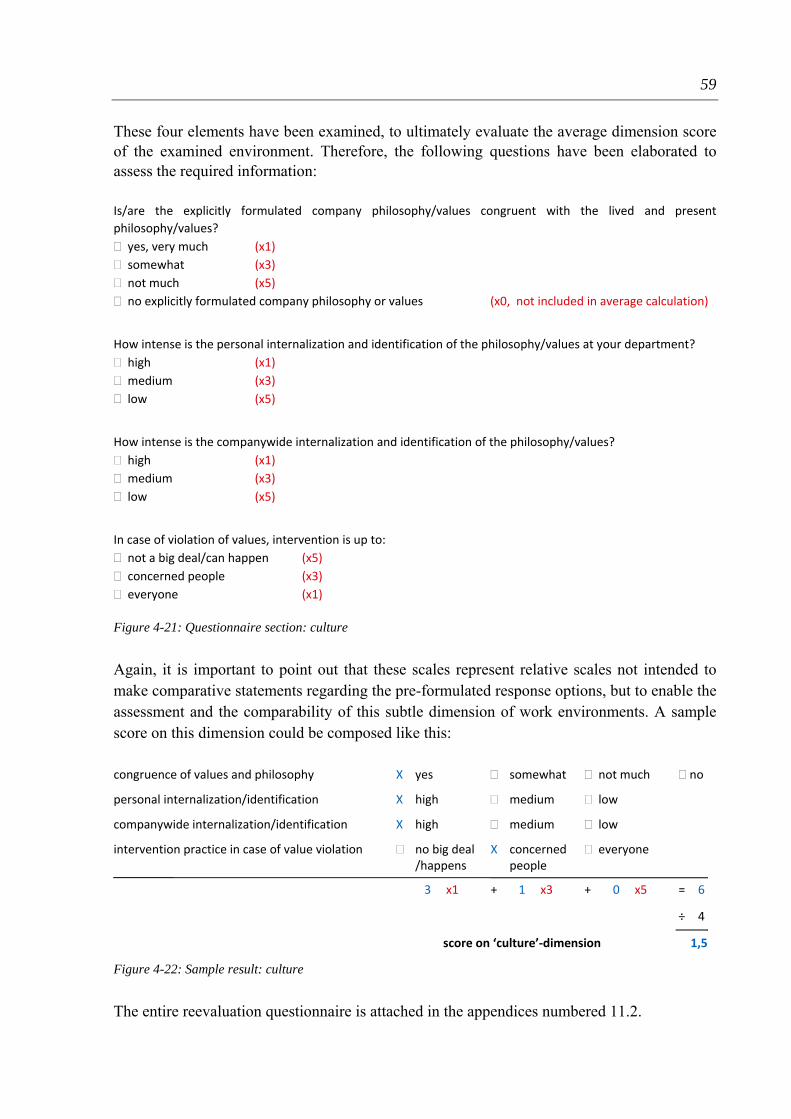
59
These four elements have been examined, to ultimately evaluate the average dimension score of the examined environment. Therefore, the following questions have been elaborated to assess the required information: Is/are the explicitly formulated company philosophy/values congruent with the lived and present
philosophy/values?
yes, very much (x1)
somewhat (x3)
not much (x5)
no explicitly formulated company philosophy or values (x0, not included in average calculation)
How intense is the personal internalization and identification of the philosophy/values at your department?
high (x1)
medium (x3)
low (x5)
How intense is the companywide internalization and identification of the philosophy/values?
high (x1)
medium (x3)
low (x5)
In case of violation of values, intervention is up to:
not a big deal/can happen (x5)
concerned people (x3)
everyone (x1)
Figure 4-21: Questionnaire section: culture
Again, it is important to point out that these scales represent relative scales not intended to make comparative statements regarding the pre-formulated response options, but to enable the assessment and the comparability of this subtle dimension of work environments. A sample score on this dimension could be composed like this: congruence of values and philosophy X yes somewhat not much no
personal internalization/identification X high medium low
companywide internalization/identification X high medium low
intervention practice in case of value violation no big deal X concerned everyone /happens people
3 x1 + 1 x3 + 0 x5 = 6
÷ 4
score on ‘culture’‐dimension 1,5
Figure 4-22: Sample result: culture
The entire reevaluation questionnaire is attached in the appendices numbered 11.2.

60
4.4 Way of presentation and its interpretation
Examining an environment in these seven dimensions by implementing the described assessment methods, enables it to be depicted on its seven dimensional scales, displaying the individual’s area of freedom between the environmental boundaries.
Thus the sample environment’s picture would look like this:
By examining distinct environments, different momentary pictures of the present balance of control and freedom can be depicted this way, enabling their interpretation, their comparison and the derivation of conclusions and insights from them.
4.4.1 Scale and area interpretation
Since the scales and their correlated assessment methods were designed to determine the environments’ scores on the respective dimension as a flowing numerical value ranging from one to five, it is important to realize that zero can’t be reached on these scales. Therefore the innermost area, comprised by connecting the lowest scores on each scale, does not contribute to the individual’s extent of freedom, since it is the basic area every environment incorporates due to the chosen assessment methods. This decision was made for two reasons.
The first one was to obviate the case where an environment scores the lowest possible values in two dimensions which frame a third one, comprising any kind of score that is not the lowest one. Defining zero as the lowest score in comparison to one would for instance result in the following picture:
0
1
2
3
4
5TIME
OBJECTIVES
PROCESSES
BUDGETCULTURE
COMMUNICATION
INFORMATION
Sample Environment
Figure 4-23: Sample environment

61
Since the normal value score might be overlooked because of its unobtrusive method of depiction if reaching zero was possible, the second method of display was chosen.
The other reason comprised saving one scale value for cases where one dimension would not be present and assessable in the environment. This could be observed to occur concerning the budget dimension, since certain businesses naturally do not require handling and purchasing physical material and the tools and work equipment was deliberately not included in this dimension’s assessment. Another possible reason leading to this circumstance could be assessing the environment of, for example, a very early stage startup, where budget and financial means do not exist yet. Therefore zero was chosen to display the immeasurability of a dimension preventing this case from being optically identical to the lowest scale score.
0
1
2
3
4
5TIM
OBJ
PRO
BUDCUL
COM
INF
1 as lowest possible value
0
1
2
3
4
5TIM
OBJ
PRO
BUDCUL
COM
INF
0 as lowest possible value
Figure 4-24: Lowest possible values
0
1
2
3
4
5TIM
OBJ
PRO
BUDCUL
COM
INF
low financial freedom
0
1
2
3
4
5TIM
OBJ
PRO
BUDCUL
COM
INF
budget not assessible
Figure 4-25: Low financial freedom - budget not accessible

62
Since not being able to assess an environmental dimension should be very rare, it was considered extremely unlikely that two unexaminable dimensions scoring zero on the scales and framing one measurable one would result in the aforementioned problem of depiction.
As a consequence of the chosen assessment method the most extreme work environments regarding control and freedom would result in the following assessment pictures:
Regarding every single dimension, picture one describes an environment comprising a high degree of goal orientation entailing high individual freedom of time and location, without having restrictions regarding purchases or checking afterwards. The investigated individual would set his own objectives and would not be influenced in how to achieve them. Furthermore, he would have the freedom to communicate to everyone he pleases and access every piece of information available in the organization. Finally he would not experience any cultural influences or constraints that prevent him from taking certain actions and decisions.
In contrast, picture two depicts a highly time-oriented environment assuring work input by required presence, which is precisely defined and centrally organized. Likewise objectives are delegated from the manager along with rules and processes for their accomplishment. Furthermore, extra expenses have to be granted and are difficult to get approved. Apart from that, information accessibility is highly restricted to the absolutely necessary amount as well as communication. Ultimately a high identification with the organization’s values and philosophy prevents the individual from taking certain, not explicitly prohibited actions.
These two scenarios are depicting an individual’s maximum degree of freedom on the one hand and an environment exerting the maximum degree of control on the other. It is particularly important to stress that the tool does not intend to assign attributes like ‘good’ or ‘bad’ to the environment when scoring high or low on the scales, but to classify the present balance between control and freedom by relating the assessed situation to these two theoretical extremes.
0
1
2
3
4
5TIM
OBJ
PRO
BUDCUL
COM
INF
maximumfreedom
0
1
2
3
4
5TIM
OBJ
PRO
BUDCUL
COM
INF
minimum freedom
Figure 4-26: Minimum freedom - maximum freedom
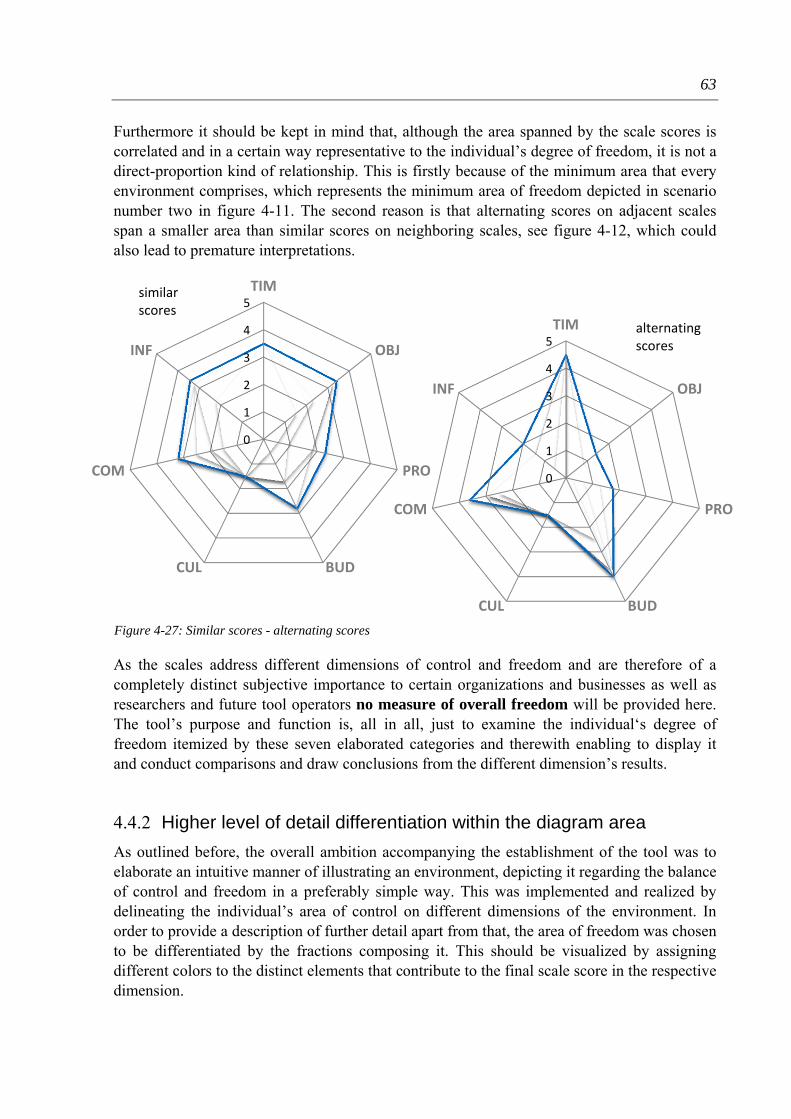
63
Furthermore it should be kept in mind that, although the area spanned by the scale scores is correlated and in a certain way representative to the individual’s degree of freedom, it is not a direct-proportion kind of relationship. This is firstly because of the minimum area that every environment comprises, which represents the minimum area of freedom depicted in scenario number two in figure 4-11. The second reason is that alternating scores on adjacent scales span a smaller area than similar scores on neighboring scales, see figure 4-12, which could also lead to premature interpretations.
As the scales address different dimensions of control and freedom and are therefore of a completely distinct subjective importance to certain organizations and businesses as well as researchers and future tool operators no measure of overall freedom will be provided here. The tool’s purpose and function is, all in all, just to examine the individual‘s degree of freedom itemized by these seven elaborated categories and therewith enabling to display it and conduct comparisons and draw conclusions from the different dimension’s results.
4.4.2 Higher level of detail differentiation within the diagram area
As outlined before, the overall ambition accompanying the establishment of the tool was to elaborate an intuitive manner of illustrating an environment, depicting it regarding the balance of control and freedom in a preferably simple way. This was implemented and realized by delineating the individual’s area of control on different dimensions of the environment. In order to provide a description of further detail apart from that, the area of freedom was chosen to be differentiated by the fractions composing it. This should be visualized by assigning different colors to the distinct elements that contribute to the final scale score in the respective dimension.
0
1
2
3
4
5TIM
OBJ
PRO
BUDCUL
COM
INF
similar scores
0
1
2
3
4
5TIM
OBJ
PRO
BUDCUL
COM
INF
alternating scores
Figure 4-27: Similar scores - alternating scores
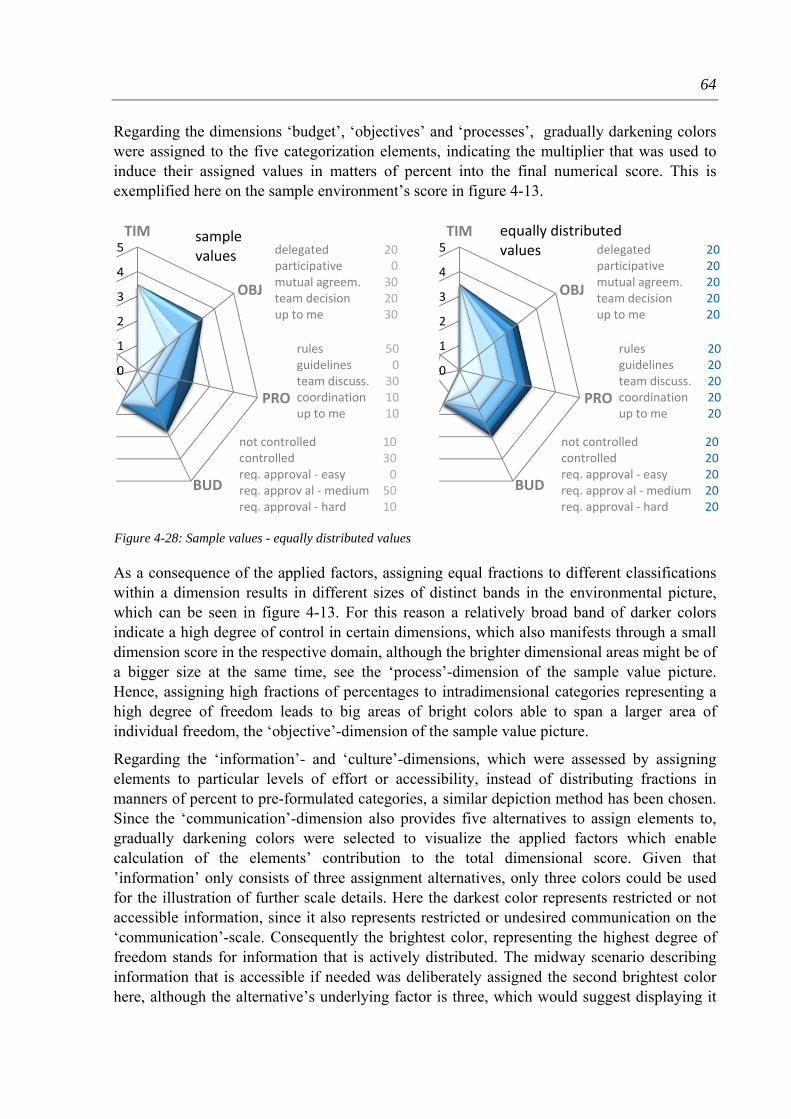
64
Regarding the dimensions ‘budget’, ‘objectives’ and ‘processes’, gradually darkening colors were assigned to the five categorization elements, indicating the multiplier that was used to induce their assigned values in matters of percent into the final numerical score. This is exemplified here on the sample environment’s score in figure 4-13.
As a consequence of the applied factors, assigning equal fractions to different classifications within a dimension results in different sizes of distinct bands in the environmental picture, which can be seen in figure 4-13. For this reason a relatively broad band of darker colors indicate a high degree of control in certain dimensions, which also manifests through a small dimension score in the respective domain, although the brighter dimensional areas might be of a bigger size at the same time, see the ‘process’-dimension of the sample value picture. Hence, assigning high fractions of percentages to intradimensional categories representing a high degree of freedom leads to big areas of bright colors able to span a larger area of individual freedom, the ‘objective’-dimension of the sample value picture.
Regarding the ‘information’- and ‘culture’-dimensions, which were assessed by assigning elements to particular levels of effort or accessibility, instead of distributing fractions in manners of percent to pre-formulated categories, a similar depiction method has been chosen. Since the ‘communication’-dimension also provides five alternatives to assign elements to, gradually darkening colors were selected to visualize the applied factors which enable calculation of the elements’ contribution to the total dimensional score. Given that ’information’ only consists of three assignment alternatives, only three colors could be used for the illustration of further scale details. Here the darkest color represents restricted or not accessible information, since it also represents restricted or undesired communication on the ‘communication’-scale. Consequently the brightest color, representing the highest degree of freedom stands for information that is actively distributed. The midway scenario describing information that is accessible if needed was deliberately assigned the second brightest color here, although the alternative’s underlying factor is three, which would suggest displaying it
0
1
2
3
4
5TIM
OBJ
PRO
BUDCUL
COM
INF
equally distributedvalues delegated
participativemutual agreem.team decisionup to me
2020202020
rulesguidelinesteam discuss.coordinationup to me
2020202020
not controlledcontrolledreq. approval ‐ easyreq. approv al ‐mediumreq. approval ‐ hard
2020202020
Figure 4-28: Sample values - equally distributed values
0
1
2
3
4
5TIM
OBJ
PRO
BUDCUL
M
INF
samplevalues delegated
participativemutual agreem.team decisionup to me
2000302030
rulesguidelinesteam discuss.coordinationup to me
5000301010
not controlledcontrolledreq. approval ‐ easyreq. approv al ‐mediumreq. approval ‐ hard
1030005010
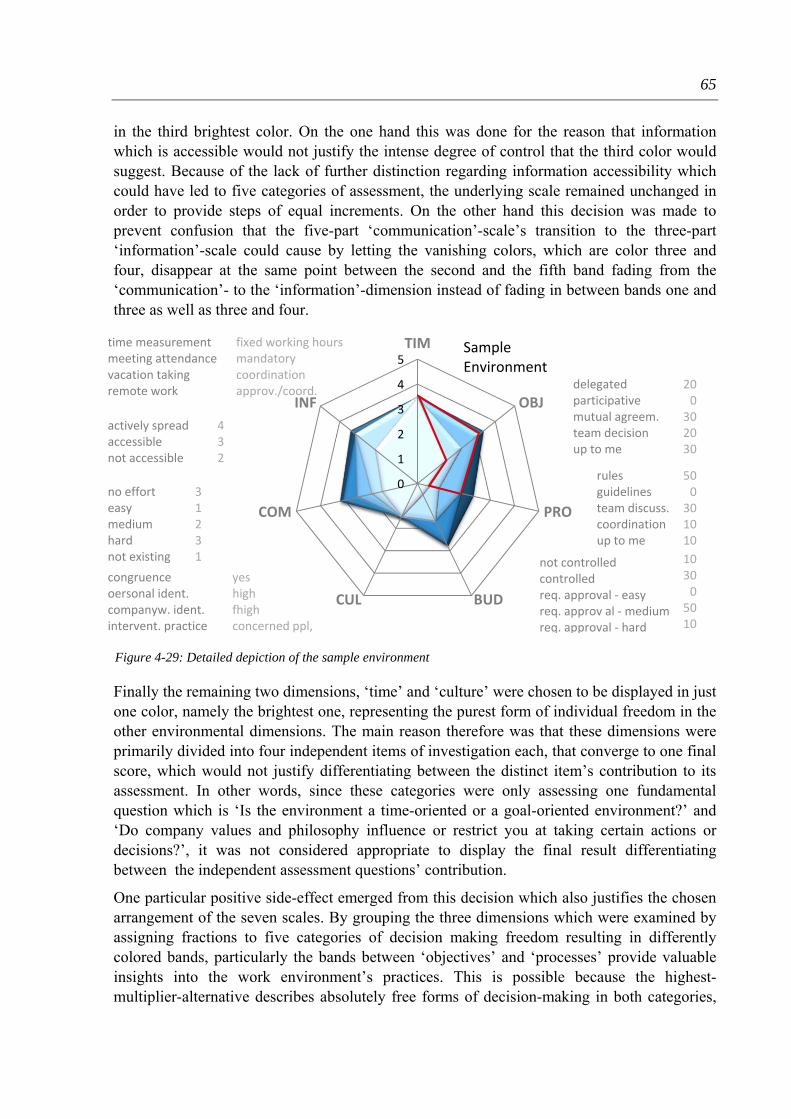
65
in the third brightest color. On the one hand this was done for the reason that information which is accessible would not justify the intense degree of control that the third color would suggest. Because of the lack of further distinction regarding information accessibility which could have led to five categories of assessment, the underlying scale remained unchanged in order to provide steps of equal increments. On the other hand this decision was made to prevent confusion that the five-part ‘communication’-scale’s transition to the three-part ‘information’-scale could cause by letting the vanishing colors, which are color three and four, disappear at the same point between the second and the fifth band fading from the ‘communication’- to the ‘information’-dimension instead of fading in between bands one and three as well as three and four.
Finally the remaining two dimensions, ‘time’ and ‘culture’ were chosen to be displayed in just one color, namely the brightest one, representing the purest form of individual freedom in the other environmental dimensions. The main reason therefore was that these dimensions were primarily divided into four independent items of investigation each, that converge to one final score, which would not justify differentiating between the distinct item’s contribution to its assessment. In other words, since these categories were only assessing one fundamental question which is ‘Is the environment a time-oriented or a goal-oriented environment?’ and ‘Do company values and philosophy influence or restrict you at taking certain actions or decisions?’, it was not considered appropriate to display the final result differentiating between the independent assessment questions’ contribution.
One particular positive side-effect emerged from this decision which also justifies the chosen arrangement of the seven scales. By grouping the three dimensions which were examined by assigning fractions to five categories of decision making freedom resulting in differently colored bands, particularly the bands between ‘objectives’ and ‘processes’ provide valuable insights into the work environment’s practices. This is possible because the highest-multiplier-alternative describes absolutely free forms of decision-making in both categories,
Figure 4-29: Detailed depiction of the sample environment
0
1
2
3
4
5TIM
OBJ
PRO
BUDCUL
COM
INF
SampleEnvironment
time measurement meeting attendancevacation takingremote work
fixed working hoursmandatorycoordinationapprov./coord.
delegatedparticipativemutual agreem.team decisionup to me
2000302030
rulesguidelinesteam discuss.coordinationup to me
5000301010
not controlledcontrolledreq. approval ‐ easyreq. approv al ‐mediumreq. approval ‐ hard
1030005010
actively spreadaccessiblenot accessible
432
no efforteasymediumhardnot existing
31231
congruenceoersonal ident.companyw. ident.intervent. practice
yeshighfhighconcerned ppl,

66
while the second- and the third-highest multiplier alternatives describe very interaction-intensive with a high degree of team work and coordination required and the two low-multiplier-alternatives describe decision making circumstances that only permit a low degree of influence to the individual.
Therefore a high degree of teamwork in the environment usually manifests as a considerable broad band of the second and the third brightest color between ‘objectives’ and ‘processes’ in the environmental picture. Consequently small or missing stripes of the color two and three, especially around the ‘objectives’-dimension indicate that rather few decisions are made by groups or the team and that individuals rather work independently, coordinating mainly with their manager. Correspondingly, a broad band of color four and five indicates that the environment does not provide a high degree of individual influence on decisions on work content and conduction, as exemplified in figure 4-15 below.
Since the ‘time’- and ‘culture’-dimension’s scores are depicted in one color not distinguishing between different elements’ contribution to the final score value, these two dimension perfectly separate the other two types of multi-area freedom types. This is especially desirable since these dimensions’ area differentiation does not provide any information on the environment’s degree of team coordination in contrast to the bands between the ‘objectives’ and the ‘processes’-dimension.
4.4.3 Additional information on the work environment
Given that particular pieces of information examined throughout the interviews were not disclosing any insights into the individual’s degree of granted freedom and experienced control or were simply too case- or company-specific, they were chosen to be added as items of additional information to the work environment’s final picture to provide a comprehensive description.
0
1
2
3
4
5TIM
OBJ
PRO
BUDCUL
COM
INF
rules, giudelines and delegation delegated
participativemutual agreem.team decisionup to me
3040150510
rulesguidelinesteam discuss.coordinationup to me
4030051015
not controlledcontrolledreq. approval ‐ easyreq. approv al ‐mediumreq. approval ‐ hard
1030005010
0
1
2
3
4
5TIM
OBJ
PRO
BUDCUL
OM
INF
intense teamwork
delegatedparticipativemutual agreem.team decisionup to me
0515403010
rulesguidelinesteam discuss.coordinationup to me
1005304015
not controlledcontrolledreq. approval ‐ easyreq. approv al ‐mediumreq. approval ‐ hard
1030005010
Figure 4-30: High degree of team work - high degree of rules, guidelines and delegation

67
The first piece of additional information related to the degree of goal orientation, was the question whether the employee has to earn their supervisor’s or organization’s trust to benefit from the freedom of time and location regarding his work, if offered, or not. Thus, the environment’s practice is disclosed under the item trust.
The next item, objective selection criteria, which is closely correlated to the ‘objective’-dimension, describes the criteria by which the individual’s work objectives are favored and selected. Selection criteria concerning decisions on the process-level that become relevant at, for instance, choosing between different alternatives of pursuing the work objective, are disclosed under the point process decision criteria. Furthermore, measures by which the final work results are evaluated apart from pre-defined objectives are listed under the item measures. As the caption might suggest, work practice discloses the individual characteristics of the work environment’s practice, comprising the way work is organized as well as traits of the work process.
Regarding the degree of financial freedom displayed on the ‘budget’-scale additional information is provided on the type of allocation practice under the item type and on the availability of appropriate equipment represented by the item tool availability.
Disclosing the detailed methods of communication, communication practice and decision influencers, show the frequency of meetings together with other practice characteristics and name the instances that play an important role in making decisions on the objective and budget level.
0
1
2
3
4
5TIM
OBJ
PRO
BUDCUL
COM
INF
Case #4COMMUNICATION PRACTICE‐ high degree of ondemand communication
‐ informal communication
DECISION INFLUENCERS‐ business department‐middle level management‐ higher level management
COMPANY CULTURE‐ open atmosphere‐ low structurization‐ appreciation ofconstuctive feedback
‐ emphasis on equal treatmentand conditions regarding employees
COMPANY VISION‐ no
WORK PRACTICE ‐matrix organization‐ further expertise consulted
on demand‐ low formalization
‐ employees advertise projects towardsbusiness department for budget allocation
MEASURES‐ technological readiness
TRUSTgranted
TOOL AVAILABILITY depends
TYPE budget
OBJECTIVE SELECTION CRITERIA‐ business opportunity and likeliness‐ innovativity and patentability
PROCESS DECISION CRITERIA‐ cost‐benefit relation‐ data driven evaluation of thealternative's suitability
Comp. C
guiding/supporting 1 2 3 4 5 6 7 8 9 10 controlling
ENVIRONMENTAL PERCEPTION 'I hate it' 1 2 3 4 5 6 7 8 9 10 'I love it'
X
X
Figure 4-31: Sample environment with additional information
68
Since the particular values and elements of company culture could not be used to assess the degree of the individual’s freedom, they were also included as additional information in the form of a list in the company picture. Furthermore, the overall objectives of the organization were disclosed, named under the headline company vision.
Finally, both assessment questions in which the individuals have been asked to rate their environments on scales from one to ten were added to the detailed environmental picture summarized under environmental perception.
4.5 Information not contributing to the environment’s depiction
Apart from the aforementioned data representing the information that was processed in the resulting picture of the work environment, some particular elements were chosen to be treated separately, not contributing to the final comprehensive depiction of the examined work environment. This comprises pieces of information on topics that were suspected to have a significant influence on the individual’s environmental perception that could be consolidated into an additional environment dimension describing the individual’s motivation.
Given that ‘motivation’ examined by elements like type of implemented reward system, performance measurement criteria and programs and benefits for employees would compose a one dimensional scale displaying the individual’s motivation, rather than a scale describing the individual’s freedom in one dimension and its counterpart of control exertion, it was not chosen to be implemented as an environmental measurement scale.
In any case, these examined pieces of information were not added to the comprehensive environmental pictures for several further reasons. One was that the evaluation of some elements, for instance the implemented reward system resulted in being surprisingly homogenous throughout the entity of examined cases, thus possibly representing items that do not contribute significantly to differentiating between work environments. Furthermore an overly detailed distinction between certain elements such as particular benefits, for instance free coffee, free food and free access to gyms were considered not to range on the same level of detail and importance as items disclosed as additional information and were also not considered to contribute to the individual’s degree of freedom. Another reason leading to this decision was that examined information in this aggregation was observed to be highly individual-specific, especially data resulting from open questions like ‘What motivates you in your company?’ not providing any comparability but still valuable information.
Moreover, further personal insights of the individuals, comprising opinions on best organizational practice could be collected throughout the conversations, without having been asked for, which will also be disclosed in this separate section of the study summarizing additional information not contributing to the environment’s description.

69
5 Tool application and resulting pictures
Having elaborated a framework for examining innovative work environments together with means for its assessment and a method of result depiction, its first application has been performed by reassessing the already investigated work environments. In order to understand the resulting pictures from this attempt, the decision on reevaluation as well as the examination procedure shall be disclosed in chapter 5.1. Furthermore, the illustration of the assessed environments shall be displayed in the subsequent chapter, 5.2, particularly pointing out case specific circumstances as well as commonalities and differences that could be observed.
5.1 Procedure of work environment examination
Reexamination of the already investigated environments was chosen here, since this represented a suitable opportunity to assess a considerable amount of work environments with a relatively low effort. Given that the former participants already offered their cooperation in case further data should be required, this spared the endeavor of again establishing contact with organizations and interested individuals together with a considerable amount of further impediments which would have made the additional effort exceed the frame of this thesis.
Hence the former participants were asked to fill in the multiple-choice questionnaire, representing the tools assessment method, which was elaborated together with the models and scales for each dimension in chapter 4.3, presented in its completeness see appendix 11.2. The questionnaire examines the work environment in the different identified dimensions, by asking the questions disclosed in the respective dimensional subchapters of chapter 4.3 whose pre-formulated response options determine the score on the respective dimension scale. Therefore, explanations and examples were provided to clarify the questions as well as to specify the provided alternatives enhancing their comprehension and helping to distinguish them from one another. Moreover, further assessment elements were included, comprising multiple-choice-like questions, questions asking the individuals to list things and open questions, enhancing the plain scale information with additional descriptive information enabling a comprehensive depiction of the work environment.
This questionnaire was sent out as a document via email as well as by an interactive online version to the individuals that already participated in the first round of data investigation. Since one participant, initially contacted to contribute to the first data examination procedure, offered his participation to the study right after already having elaborated the tool’s dimensions and assessment method, it was chosen to include him as an additional case to the survey, representing case #12, solely examined by the elaborated tool. Given that most of the additional descriptive information of the first eleven cases was examined by the first initial interviews, an enhanced version of the assessment questionnaire has been established to be able to assess additional descriptive information in cases without providing prior in-depth interviews, see appendix number 11.3, directly implemented in the examination of case #12. Hence, this new questionnaire formed the standard for the future practice of the tool’s application.

70
Case Position Department Com
p
Business Size Countr
y
Criteria
#1 non‐
managerial Research &
Developmen
t
A
Software
Developmen
t
medium
>100 AU
innovative
products,
unconv.
environment#2 managerial
#3 non‐
managerial
Research &
Developmen
t
B
Software
Developmen
t
multinationa
l>10.000 SE IP, TL, UE
#4 non‐
managerial Research C Engineering
multinationa
l>10.000 DE
technological
lead,
innovat.
products #5 managerial
#6 non‐
managerial Radical
Innovation
Team
D Engineeringmultinationa
l>10.000 DE
innovative
products #7 managerial
#8 managerial Developmen
t E Engineering
large
>1.000 DK
innovative
products
#9 managerial
Business
Developmen
t
F Engineeringmedium
>100 BR
unconvent.
environment
#10 CEO
Business
Developmen
t
G Service startup
<100 DE
innovative
product
#11 CEO
Business
Developmen
t
H Service startup
<100 DE
unconvent.
environment
#12 non‐
managerial
Developmen
t E Engineering
large
>1.000 DK
innovative
products
Table 5-1: Extended casebook
Unfortunately a perfect reply rate for the reexamination could not be denoted, since participant #2 did not reply in time before the completion of this thesis. Nevertheless, eleven pictures of work environments in total could be presented because of the data provided by the extra participant #12.

71
5.2 Pictures resulting from investigated data
Having retrieved the completed questionnaires and applied the elaborated evaluation method for each dimension of control and freedom, eleven work environments could be drafted in the manner visible below. Since the size of the detailed company pictures considerably handicaps the readability of this thesis’ text, the entity of environment illustration is disclosed in the appendices, see number 11.4, suffice to show three selected comprehensive environmental pictures here to explain particular points and several basic pictures for further comparisons of work environments in the following.
As described, the outermost boundary of the ‘freedom area’ is formed by the environments’ scores in each dimension, indicating the individual’s degree of freedom and the extent to which control is implemented in the respective environmental category. Moreover differently colored layers disclose to which extent particular managerial practices are in use, which applies for the ‘objectives’, ‘processes’ and ‘budget’ scales or specific circumstances have to been characterize, which is the case for assessing information and communication. Furthermore, additional descriptive information is provided covering several topics enabling a comprehensive depiction of the assessed environments.
Looking at the additional information it is important to notice that it was not always possible to gain information on every particular item, visible for instance on the elements decision influencers, objective selection criteria, measures and budget type in Figure 5-1 of case #11. This is because the additional information was evaluated by the initial analysis of the interview data, where due to the interview’s flexibility and the employee’s time commitment
0
1
2
3
4
5TIM
OBJ
PRO
BUDCUL
COM
INF
Case #11COMMUNICATION PRACTICE‐ team meetings, every 3 weeks
‐ centrally organized communicationamong the individuals
DECISION INFLUENCERS‐ no data
COMPANY CULTURE‐ aim for sustainability‐ economically criticalattitude
COMPANY VISION‐ provide reasonable workplacesfor manufacturers and otheroccupations creating high synergy
MEASURES‐ no data
TRUSTgranted
TOOL AVAILABILITY depends
TYPE no data
OBJECTIVE SELECTION CRITERIA‐ no data
PROCESS DECISION CRITERIA‐ costs
Comp. H
guiding/supporting 1 2 3 4 5 6 7 8 9 10 controlling
ENVIRONMENTAL PERCEPTION 'I hate it' 1 2 3 4 5 6 7 8 9 10 'I love it' X
WORK PRACTICE‐ different roles assigned
to team members‐ high involvement ofindividuals regardingdifferent decisions
X
Figure 5-1: Detailed picture, case #11 - company H

72
for contribution, not every topic could be covered in every conversation. Since this circumstance became conspicuous after the evaluation of the entirety of data, particular questions were included in the tool’s assessment questionnaire ensuring its examination in case #12 and future investigative environments. In some cases additional data could simply not be named which also resulted in a lack of information regarding certain items.

73
Figure 5-3: Detailed picture, case #7 - company D
Figure 5-2: Detailed picture, case #6 - company D
0
1
2
3
4
5TIM
OBJ
PRO
BUDCUL
COM
INF
Case #6COMMUNICATION PRACTICE‐ team meetings, 1/w‐ board meetings 4/y‐ special dep. for mediageneration and internal andexternal communication
DECISION INFLUENCERS‐ communication department‐ associates‐ board
COMPANY CULTURE‐ open atmosphere‐ family run business with highpeople orientation and identification
COMPANY VISION‐ #1 partner of the customer‐ being leading innovator
WORK PRACTICE‐ 1‐2 projects per individual
‐ people included on demand‐ lots of iterations, models and
prototypes‐ low formalization
‐ employees freed from non‐core tasks
MEASURES‐ perception of public & press‐ awards for innovation
TRUSTgranted
TOOL AVAILABILITY depends
TYPE purchase limit
OBJECTIVE SELECTION CRITERIA‐ visionarity, topic's business relevance
PROCESS DECISION CRITERIA‐maximum innovation, design,didactics
Comp. D
guiding/supporting 1 2 3 4 5 6 7 8 9 10 controlling
ENVIRONMENTAL PERCEPTION 'I hate it' 1 2 3 4 5 6 7 8 9 10 'I love it' X
X
0
1
2
3
4
5TIM
OBJ
PRO
BUDCUL
COM
INF
Case #7COMMUNICATION PRACTICE‐ team meetings, 1/w‐ board meetings 4/y‐ special dep. for mediageneration and internal andexternal communication
DECISION INFLUENCERS‐ communication department‐ associates‐ board
COMPANY CULTURE‐ open atmosphere‐ family run business with highpeople orientation and identification
COMPANY VISION‐ #1 partner of the customer‐ being leading innovator
WORK PRACTICE‐ 1‐2 projects per individual
‐ people included on demand‐ lots of iterations, models and
prototypes‐ low formalization
‐ employees freed from non‐core tasks
MEASURES‐ perception of public & press‐ awards for innovation
TRUSTto earn
TOOL AVAILABILITY depends
TYPE budget
OBJECTIVE SELECTION CRITERIA‐ visionarity, topic's business relevance
PROCESS DECISION CRITERIA‐maximum innovation, design,didactics
Comp. D
guiding/supporting 1 2 3 4 5 6 7 8 9 10 controlling
ENVIRONMENTAL PERCEPTION 'I hate it' 1 2 3 4 5 6 7 8 9 10 'I love it' X
X

74
Given that the additional descriptive data was examined in a cumulative manner in case it was possible to interview two persons from the same department, particular pieces of information that can be assumed to be perceived homogenously throughout the whole department are identical in all the assessment pictures describing same companies, as it can be seen comparing Figures 5-2 and 5-3 of case #6 and of #7. In contrast, additional information that was gathered through the tool’s assessment questionnaire can diverge if individuals should perceive the situation differently in the instances of trust, tool availability, and budget type and of course environmental perception. In the particular case of comparing case #6 to case #7, ratings on the perception scales are identical by accident.
5.2.1 Optical similarities of identical environments
Looking at the depicted core data of the environments displaying the implemented balance of control and freedom, the circumstance of individuals working at the same departments in the same organizations accounts for high similarities in the dimensions of ‘time’ and ‘culture’ as well as similarities in the domains of ‘information’ and ‘communication’ to some extent, comparing case #6 with #7 depicted in detail above and case #4 with #5 visualized in figure 5-4. Differences between pictures describing the very same work environment as in the case of these two pairs could be founded by the individual’s different hierarchical position, their distinct, specific work content and tasks as well as their differing individual perception.
As an exception to this pattern, pictures of case #8 and case #12 displaying environments of individuals both employed in company E do not show these similarities, see figure 5-5, since both are assigned different divisions within the same organization, which exemplifies the divergence of environmental factors across subgroups within organizations which was indicated by SACKMANN (1992).
0
1
2
3
4
5TIM
OBJ
PRO
BUDCUL
COM
INF
Comp. CCase #4
0
1
2
3
4
5TIM
OBJ
PRO
BUDCUL
COM
INF
Comp. CCase #5
Figure 5-4: Same company - C - case #4 and #5

75
0
1
2
3
4
5TIM
OBJ
PRO
BUDCUL
COM
INF
Comp. ACase #1
0
1
2
3
4
5TIM
OBJ
PRO
BUDCUL
COM
INF
Comp. BCase #3
Consequently, the detailed depiction of these two cases was not worked out in the aforementioned cumulative assessment method and thus, features fewer elements of identical additional information, as can be seen in appendix number 11.4.
5.2.2 Business specific depiction peculiarities
Regarding the ‘budget’ dimension in case #1 and #3 it stands out that no data could be assessed for depicting the individual’s degree of freedom and experienced control in this domain of the environment.
0
1
2
3
4
5TIM
OBJ
PRO
BUDCUL
COM
INFComp. ECase #8
0
1
2
3
4
5TIM
OBJ
PRO
BUDCUL
COM
INF
Comp. ECase #12
Figure 5-5: Same company - E - case #8 and #12
Figure 5-6: Business specific peculiarities - case #1 and #3
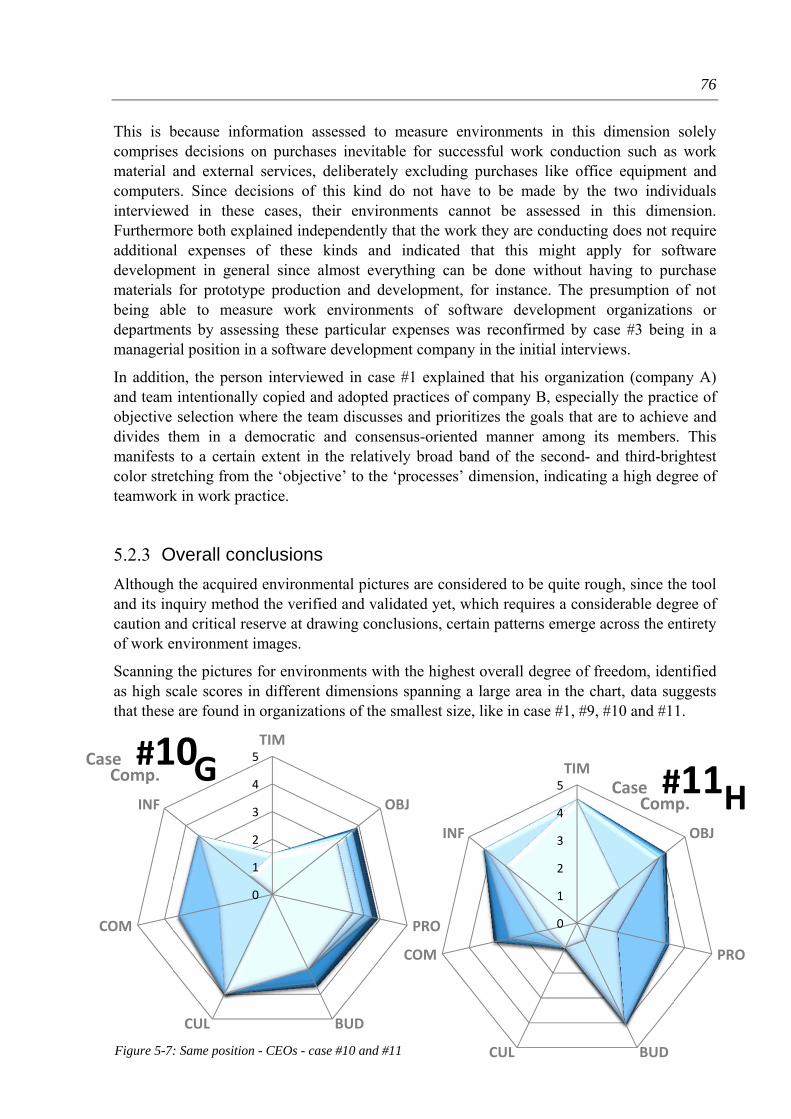
76
This is because information assessed to measure environments in this dimension solely comprises decisions on purchases inevitable for successful work conduction such as work material and external services, deliberately excluding purchases like office equipment and computers. Since decisions of this kind do not have to be made by the two individuals interviewed in these cases, their environments cannot be assessed in this dimension. Furthermore both explained independently that the work they are conducting does not require additional expenses of these kinds and indicated that this might apply for software development in general since almost everything can be done without having to purchase materials for prototype production and development, for instance. The presumption of not being able to measure work environments of software development organizations or departments by assessing these particular expenses was reconfirmed by case #3 being in a managerial position in a software development company in the initial interviews.
In addition, the person interviewed in case #1 explained that his organization (company A) and team intentionally copied and adopted practices of company B, especially the practice of objective selection where the team discusses and prioritizes the goals that are to achieve and divides them in a democratic and consensus-oriented manner among its members. This manifests to a certain extent in the relatively broad band of the second- and third-brightest color stretching from the ‘objective’ to the ‘processes’ dimension, indicating a high degree of teamwork in work practice.
5.2.3 Overall conclusions
Although the acquired environmental pictures are considered to be quite rough, since the tool and its inquiry method the verified and validated yet, which requires a considerable degree of caution and critical reserve at drawing conclusions, certain patterns emerge across the entirety of work environment images.
Scanning the pictures for environments with the highest overall degree of freedom, identified as high scale scores in different dimensions spanning a large area in the chart, data suggests that these are found in organizations of the smallest size, like in case #1, #9, #10 and #11.
0
1
2
3
4
5TIM
OBJ
PRO
BUDCUL
COM
INF
Comp. GCase #10
0
1
2
3
4
5TIM
OBJ
PRO
BUDCUL
COM
INF
Comp. HCase #11
Figure 5-7: Same position - CEOs - case #10 and #11
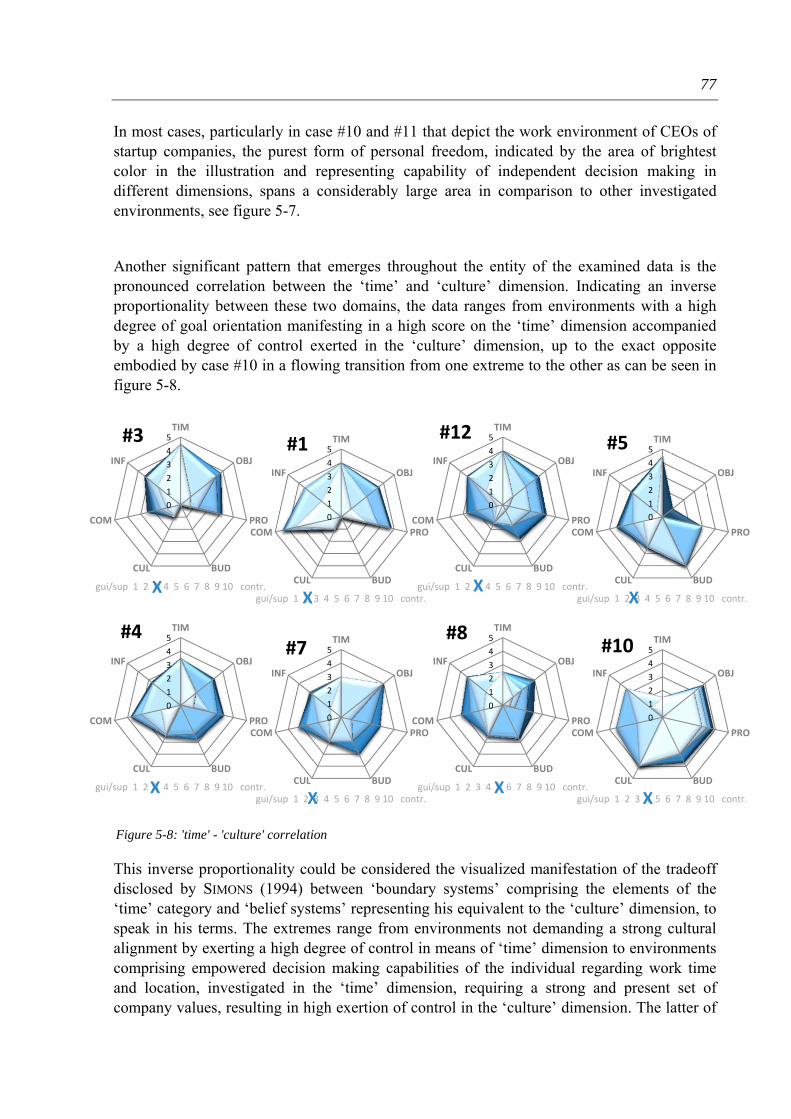
77
0
1
2
3
4
5TIM
OBJ
PRO
BUDCUL
COM
INF
#1
gui/sup 1 2 3 4 5 6 7 8 9 10 contr. X
0
1
2
3
4
5TIM
OBJ
PRO
BUDCUL
COM
INF
#3
gui/sup 1 2 3 4 5 6 7 8 9 10 contr. X
In most cases, particularly in case #10 and #11 that depict the work environment of CEOs of startup companies, the purest form of personal freedom, indicated by the area of brightest color in the illustration and representing capability of independent decision making in different dimensions, spans a considerably large area in comparison to other investigated environments, see figure 5-7.
Another significant pattern that emerges throughout the entity of the examined data is the pronounced correlation between the ‘time’ and ‘culture’ dimension. Indicating an inverse proportionality between these two domains, the data ranges from environments with a high degree of goal orientation manifesting in a high score on the ‘time’ dimension accompanied by a high degree of control exerted in the ‘culture’ dimension, up to the exact opposite embodied by case #10 in a flowing transition from one extreme to the other as can be seen in figure 5-8.
This inverse proportionality could be considered the visualized manifestation of the tradeoff disclosed by SIMONS (1994) between ‘boundary systems’ comprising the elements of the ‘time’ category and ‘belief systems’ representing his equivalent to the ‘culture’ dimension, to speak in his terms. The extremes range from environments not demanding a strong cultural alignment by exerting a high degree of control in means of ‘time’ dimension to environments comprising empowered decision making capabilities of the individual regarding work time and location, investigated in the ‘time’ dimension, requiring a strong and present set of company values, resulting in high exertion of control in the ‘culture’ dimension. The latter of
0
1
2
3
4
5TIM
OBJ
PRO
BUDCUL
COM
INF
#12
gui/sup 1 2 3 4 5 6 7 8 9 10 contr. X
0
1
2
3
4
5TIM
OBJ
PRO
BUDCUL
COM
INF
#10
gui/sup 1 2 3 4 5 6 7 8 9 10 contr. X
0
1
2
3
4
5TIM
OBJ
PRO
BUDCUL
COM
INF
#8
gui/sup 1 2 3 4 5 6 7 8 9 10 contr. X
0
1
2
3
4
5TIM
OBJ
PRO
BUDCUL
COM
INF
#7
gui/sup 1 2 3 4 5 6 7 8 9 10 contr. X
0
1
2
3
4
5TIM
OBJ
PRO
BUDCUL
COM
INF
#4
gui/sup 1 2 3 4 5 6 7 8 9 10 contr. X
0
1
2
3
4
5TIM
OBJ
PRO
BUDCUL
COM
INF
#5
gui/sup 1 2 3 4 5 6 7 8 9 10 contr. X
Figure 5-8: 'time' - 'culture' correlation
78
these two is referred to by QUCHI (1979) as the control mechanism of cultural control and is also disclosed as a management practice in further references such as RESSLER & THOMPSON
(2010), SEMLER (1995), SEMLER (2003).
Another noteworthy circumstance is the emerging correlation between the degree of cultural control exertion and the score on the self-assessment scale examining the perception of overall control within the environment, where one stands for a guided and supported way of leadership and ten represents a controlling management practice. Given that the implementation of intense cultural control goes along with low scores on the perception of overall control scale, while high control of time dimension seems to cause relatively high scores, the data suggests that intense cultural control is not perceived as controlling by the individuals who participated in this survey.
One possible explanation therefore could be that since an intense cultural control goes along with a high internalization of the company values and philosophy by the very design of the investigation method, it is not perceived as a form of external control but rather as a consensual set of norms that would even be followed outside of the environment. In contrast thereto, formal regulations about work time and workplace represent a classic example of external control. Since control mechanism might particularly be perceived as controlling when individuals are restricted from taking a decision by an external influence instead of an internal one, control in the ‘time’ dimension could appear controlling while control by ‘culture’ seems unrestricting in case there is a high unenforced congruence of the individual’s values with the organizational ones.

79
6 Additionally investigated information
Apart from the information processed to depict the different investigated work environments, certain pieces of information comprising potential drivers of individuals’ motivation are disclosed in this section of information not contributing to the environments’ description. This data has mainly been examined during the initial interviews covering topics such as the implemented reward system, the method of work evaluation and involved persons and provided benefits in addition to financial means, putting this information in relation to the self-assessment scale of environmental perception. The numerical value on the perception scale results from the interview question ‘How do you perceive the overall way of working?’ requesting the individuals to rate the overall way of working on a scale from one to ten, where one represents a strong dislike and ten stands for great enthusiasm to conduct work in their environment.
Case Position Co. Reward System Assessment Benefits Percep.
#1
non‐
manageri
al A fixed +
bonuses
manager,
colleagues
food, drinks, board
games, coffee
8,5
#2 manageri
al no data
#3
non‐
manageri
al
B base + perf. orient.
bonuses + equity
self‐assessment
coworkers,
manager
coffee, snacks, food,
gym, daycare,
games
10
#4
non‐
manageri
al C fixed +
bonuses
self‐assessment,
several managers
coffee, games,
activities
8,5
#5 manageri
al 9
#6
non‐
manageri
al D
pay‐scale +
bonuses
manager further education,
activities
9
#7 manageri
al
non‐pay‐scale +
perf. orient.
bonuses
9
#8 manageri
al E no data no data
fruit, coffee, snacks,
bonus program,
gym
8
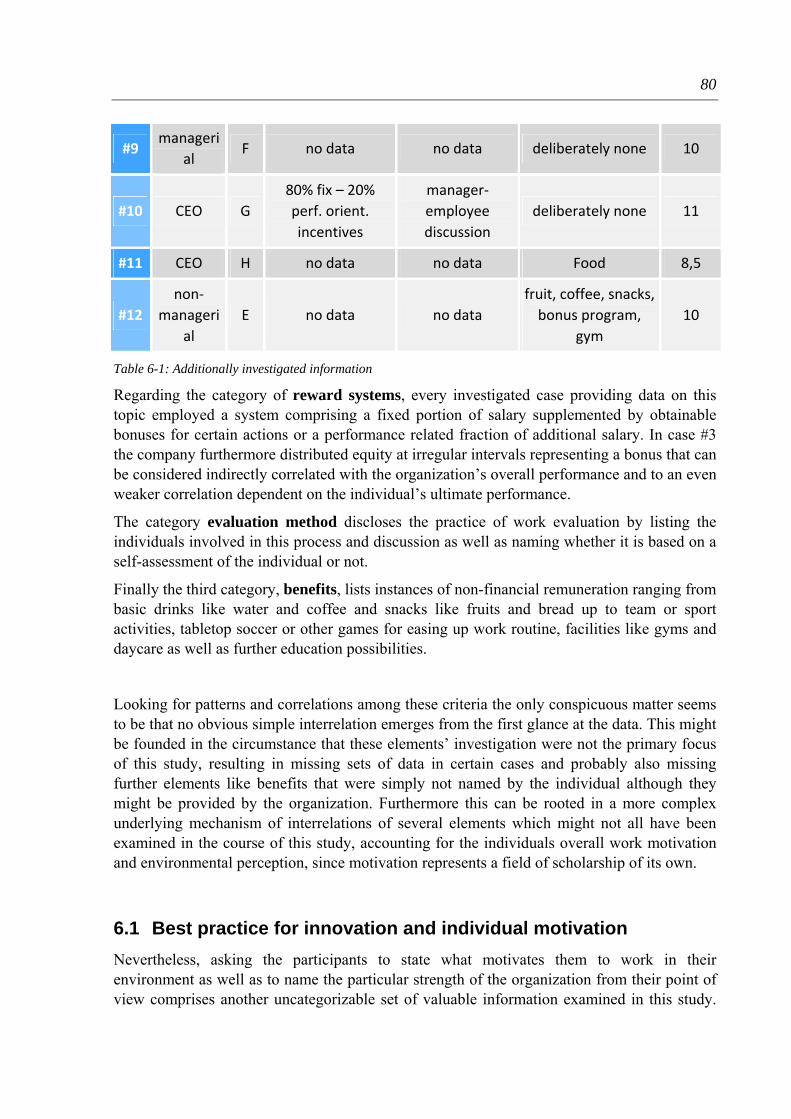
80
#9 manageri
al F no data no data deliberately none 10
#10 CEO G
80% fix – 20%
perf. orient.
incentives
manager‐
employee
discussion
deliberately none 11
#11 CEO H no data no data Food 8,5
#12
non‐
manageri
al
E no data no data
fruit, coffee, snacks,
bonus program,
gym
10
Table 6-1: Additionally investigated information
Regarding the category of reward systems, every investigated case providing data on this topic employed a system comprising a fixed portion of salary supplemented by obtainable bonuses for certain actions or a performance related fraction of additional salary. In case #3 the company furthermore distributed equity at irregular intervals representing a bonus that can be considered indirectly correlated with the organization’s overall performance and to an even weaker correlation dependent on the individual’s ultimate performance.
The category evaluation method discloses the practice of work evaluation by listing the individuals involved in this process and discussion as well as naming whether it is based on a self-assessment of the individual or not.
Finally the third category, benefits, lists instances of non-financial remuneration ranging from basic drinks like water and coffee and snacks like fruits and bread up to team or sport activities, tabletop soccer or other games for easing up work routine, facilities like gyms and daycare as well as further education possibilities.
Looking for patterns and correlations among these criteria the only conspicuous matter seems to be that no obvious simple interrelation emerges from the first glance at the data. This might be founded in the circumstance that these elements’ investigation were not the primary focus of this study, resulting in missing sets of data in certain cases and probably also missing further elements like benefits that were simply not named by the individual although they might be provided by the organization. Furthermore this can be rooted in a more complex underlying mechanism of interrelations of several elements which might not all have been examined in the course of this study, accounting for the individuals overall work motivation and environmental perception, since motivation represents a field of scholarship of its own.
6.1 Best practice for innovation and individual motivation
Nevertheless, asking the participants to state what motivates them to work in their environment as well as to name the particular strength of the organization from their point of view comprises another uncategorizable set of valuable information examined in this study.

81
Moreover, personal opinions on best management practice have also been disclosed in the course of the interviews and shall be reflected in the insights of innovation management literature in this last section of result depiction.
Asked about the particular strength of his organization, participant #10, being one of the CEOs of his company, pointed out that they intentionally try to empower employees by granting a high degree of personal responsibility and the possibility to follow their own idea of best practice for reaching certain objectives in order to foster entrepreneurship within the organization. This corresponds with EKVALL’s (1983) opinion pointing out that a considerable amount of freedom and autonomy in work conduction is believed to be vital for innovation and is backed up by participant #7 stating that a high degree of personal responsibility accounts for a great deal of his motivation. Furthermore, AMABILE ET AL.’S (1996), MUMFORD
ET AL.’S (2002) and QUINN’s (1985) belief of innovativity being promoted when individuals feel a sense of ownership and control over their own work and ideas was also observed to be confirmed by several participants such as #5 declaring that ‘the point is, that people should consider it (the project) as their own, take off with the mindset: ‘I will sell this! I will try to procure budget in order to work on it!’ This way you have the highest motivation, this is how such things work out. Like small internal startups if you want to say so.’ Moreover, participants #3 and #4 pointed out that the possibility to bring in their own ideas and realize them is something that contributes to a high extent to their individual motivation. In addition both added that the availability of a multitude of interesting topics addressed in their organizations enforce this effect. Furthermore, participant #4 mentioned that he greatly values the enhanced variety of personal tasks that have to be conducted, counteracting the scenario of overspecialization, which was also pointed out by participant #6.
Describing the particular elements accountable for his company’s success, participant #7 mentioned the intention and the explicit internal and external declaration to keep the innovation lead in its business sector. This is also believed to play an important role by TUSHMAN & ANDERSON (1997), stating that self-identification as an innovative company fosters the organizations innovation capability. Apart from the goals of the organizational level, case #7 furthermore stressed the impact of motivation caused by challenging objectives, being supported independently by participant #9, stating that: ‘…if you have a very difficult thing to do, this motivates me a lot. ...and when you can achieve a good result, it’s wonderful! So, to answer your question on what is motivating: I think it’s challenge!’ This again confirms the assumptions encountered in literature of AMABILE ET AL. (1996) arguing that a considerable amount of pressure has a positive impact on creativity and thus on innovation, while pressure can also result in undermining motivation exceeding a certain threshold. In fact, the absence of excessive pressure was pointed out to be a positive feature of his work environment by participant #6, furthermore mentioning that its tolerance for making mistakes is also a desirable positive feature contributing to its pleasantness. This, in turn, can also be found in literature pointed out by O’REILLY & TUSHMAN (1997) concluding that reward and recognition for risk-taking and a tolerance of mistakes were identified as essential characteristics for innovation promoting environments. According to AMABILE ET AL. (1996) managerial motivation represents another important factor promoting innovativity in work environments. This could again be observed to be confirmed by the empirical findings of this

82
study by participant #6 stating that ‘…my manager also motivates me, because he is very enthusiastic and really capable of inspiring one with subjects. It is simply catching.’
Talking about the immediate environment several participants declared the skilled and nice colleagues as well as competent leaders were important success factors. Participant #1 pointed out the motivating influence of working within such an environment to ‘...do a good job, because you’re surrounded by so many smart people you don’t want to be left behind, being the person that’s not pulling their weight.’ Another aspect stressed by several individuals was the freedom to communicate openly and directly lowering possible hierarchical barriers, for instance eliminating degrees from internal communication. This is consistent with KANTER’s (1983) demand for open communication also supported by MEDINA ET AL. (2005) suggesting that informal communication processes should be considered a characteristic of today’s innovative companies.
Asked about the specific strengths of their company, every participant working in a family-owned enterprise said this fact contributed considerably to their internal work environment’s pleasantness as well as to the organization’s success. Particularly, the company’s farsightedness and long-term orientation regarding organizational objectives as well as the high degree of internal people orientation were pointed out to be significant by participants #6, #7, #8 and #12. A high external people orientation, deep-stated in the companies’ values and philosophy, was also observed to create high individual motivation, devoting participants to ‘create a good base for other people’s work’ by their products, as stated by participant #11 or ‘making a million people’s lives easier’, citing participant #1. The latter statement was provided by an individual working within an organization featuring a far reach, which is also a motivational factor of its own mentioned by further participants. Working in an organization that set this practice as a good example for a considerable amount of years, the motivating effect of this traditional dedication was described by participant #8, talking about the affectionate reaction of others when mentioning his workplace, whereby ‘…you automatically have a friend. And there's something about that, it's not anything that I did necessarily. That's, you know, 80 years of people before me that had set the groundwork to create this really powerful notion of [company name] as something that's pretty good. …so I think what motivates me is that I would love to continue that tradition and I want to be able to earn that courtesy of someone smiling when I say where I work. … So, I want to continue that to make sure that I do feel like I have ownership of all that and that I can pass it on to the next group of people.’
Another noteworthy particularity is the absence financial motivators in the participants’ responses throughout the entirety of examined cases.

83
7 Discussion Having addressed the information content of the tool in the previous chapter along with its implication for individuals, organizations and work environment in general, this section shall discuss the work conducted in this study by critically examining different aspects. First the final tool’s inquiry method shall be discussed, followed by an investigation of the tool’s underlying framework and finally, the overall validity of the tool shall be examined.
7.1 Method of investigation
Reviewing the final tool’s inquiry method, certain issues become apparent, that disclose room for further improvement.
One of these concerns is the comprehensibility of the investigation questions. Although it was attempted to prevent misunderstandings by formulating the questions in the simplest manner possible, while still trying to provide all the information necessary for their reply by adding additional explanation text, several questions have been noticed to cause confusion. This confusion could be observed as participant’s requests for further explanations or even as plainly incompatible answers regarding the nature of the questions in some cases.
Examining the financial freedom of the individual for examples the participants were asked to break down their entirety of financial decisions representing 100% into five different categories of approval difficulty. In some cases it occurred that individuals assigned different amounts of money to the difficulty categories to explain at which threshold the difficulty increases instead of splitting up the entity of decision situations. This discloses the need to reexamine the inquiry questions and investigate their perception by the participants to elaborate a possible simple, intuitive and self-explanatory wording preventing future investigators to ask further questions because of this current shortcoming and guarantee reliable and convenient data collection without his personal presence.
For this particular problem another possible solution could be imagined, solving it by design. This could be realized by enhancing the digital interactive version by features preventing participants from entering numbers exceeding 100 into the answer boxes, interlinking the boxes to always result in a sum of 100 or providing a more intuitive visualization clarifying the intention behind the question. By the same means, digital design could help with the completion of every single question by indicating left out boxes before overall completion.
Another possible pitfall undermining the final data’s quality is the phenomenon of participants shifting the examination level. This occurrence became apparent mainly because of inconsistencies between data inquired by the tool’s examination questionnaire and data collected in the initial interviews or meta-information disclosing the individual’s circumstances.

84
Participant #10 stated he worked in an environment where flextime is implemented and one has to ask for permission in order to take vacation, resulting in a low degree of freedom in the ‘time’ dimension. Considering that he is the CEO of his organizations and thus does not have to comply with these regulations, it becomes clear that he describes the internal environment from his employees’ perspective. Although it was initially intended that individuals describe their specific experience of their work environment, by answering the inquired questions, this bias does not compromise the data’s integrity if every dimension is systematically disclosed from the same level of investigation. On the other hand this effect severely undermines the integrity of the resulting environmental picture in case the participant shifts his environmental focus in between the examination of different dimensions. Hence, it would be possible that an individual describes the upper management’s budget allocation practice regarding his budget, while explaining the process of goal selection talking about the team he leads within the ‘objectives’-dimension instead of describing how his own goals get specified.
Particularly managers were observed to describe their environments from their employees’ point of view. Since it could not be tracked which view was taken in the distinct categories it cannot be identified to which extent the bias of view point shift in between dimensions undermines the data assessed in this study, if occurred at all.
To counteract this effect, participants should be informed beforehand to answer every question from their own perspective, describing their individual environment or by intentionally demanding them to describe some other particular environment that is of interest.
Since these biases were observed to occur as a side effect of this specific attempt, still particular caution and critical retention is demanded at interpreting the resulting pictures and drawing conclusions as applied within this study. Anyhow, these biases disclose valuable starting points for further improvement on the inquiry questionnaire that could considerably improve the sharpness of the examined work environments’ depictions.
7.2 Elaborated model and framework
Since this study embodies the first attempt to elaborate a tool for the depiction of inter-organizational work environments displaying the present balance of control and freedom and thus represents the first iteration of theory establishment therefore, there is still potential to improve the tool’s expressiveness by elaborating its underlying framework.
Reflecting on the different dimensions of investigation, particularly further differentiation within the ‘information’ dimension could add additional value to the tool’s resulting pictures. As the data investigation in this dimension, until now, uses three assessment categories each assigned different numerical multipliers to transform the participants’ answers into numerical complement, see chapter 4.3.6, the differentiation degree could easily be enhanced to five categories within this model since the majority of the remaining categories are also based on a five-categorical division. Therefore it would be necessary to differentiate the accessibility of

85
information between more distinct scenarios comprising five in total. Since no appropriate division could be elaborated within this study, a three-part distinction was chosen which does not exclude that a five part differentiation could be implemented, if suitable.
Evaluating the evaluated data by the tool’s investigation instrument in detail, it appeared that the second and the third inquiry questions of the culture category, namely: ‘How intense is the personal internalization and identification of the philosophy/values at your department?’ and ‘How intense is the companywide internalization and identification of the philosophy /values?’ simultaneously evoked identical answers to both questions. This circumstance applies to every single examined case and thus either indicates a high correlation of personal value and philosophy internalization with the companywide one, or suggest some kind of possible percipience bias such as the individual’s generalization of the personal perception. In case this circumstance should prove itself not to be a statistical coincidence, it could be constructive to work over the inquiry questions for this dimension to capture the company culture’s restricting influence on individual’s decisions more accurately, leading to a sharper depiction of the examined work environments in this dimension.
Regarding the underlying framework on a general level this first approach does not claim to constitute the ultimate theoretic construct for describing work environments regarding their internal dynamic of control and freedom. Hence it could be imagined that a yet unknown further dimension would have to be added, which might not have emerged from the initially investigated data and literature examined here, in order enable the comprehensive depiction of work environments. Likewise the investigation items of additional data, disclosing descriptive information on the environment, could be imagined to be enhanced by certain elements, if considered beneficial.
Generally speaking, the theory underlying the work environment depiction tool could, just as every theory, profit from critical examination and additional work in this field of scholarship. Hence, since this is still the first approach to depict the present balance between control and freedom in work environments and nothing is carved in stone, valuable input and insights could certainly contribute to the theory’s consistency as well as to the sharpness and completeness of the resulting pictures.
7.3 Validity of the tool
In order enable the tool to be applied for the scientific research of inter-organizational work environment, further verification and validation of the tool’s inquiry method as well as its underlying framework has to be conducted. Therefore several different types of further studies are considered to be particularly beneficial.
Firstly the focus should be directed to eliminate the bias resulting from misunderstanding the inquiry questions. Therefore, a certain number of intense data investigation interviews could be conducted, particularly examining the participants’ perceptions of the inquiry questions for correspondently adapting them to eradicate the aforementioned biases.
86
Then a study comprising a large number of participants conducted within one specific organization, could, for instance, allow drawing conclusions to which degree the bias of personal perception of individuals working in possibly identical environments such as being in the same team, having the same managers and performing highly similar tasks influences the resulting environmental pictures. This study is suggested to preferably comprise a possibly large number of participants within an organization to be able to observe the altering effects on the depictions by comparing within and to different subgroups. Hence, this would enable to conclude whether and to which extent distinct dimensions vary among and within these subgroups which would delineate the tool’s validity and the results’ generalizability.
Finally, a third promising investigation would comprise a large-scale study of several subgroups of distinct organizations. This setup would enable to derive whether environmental differences within subgroups in one organization preponderate differences between subgroups of distinct organizations. Moreover, this study would show to which extent these differences occur, further disclosing insights on the tool’s expressiveness for describing work environments.
In any case, while conducting these suggested studies, further valuable insight can be expected to emerge disclosing additional potential improvement points and enabling the verification of the tool’s theoretical basis. Furthermore, it can be assumed that a considerable amount of data regarding work environments will be collected meanwhile which might simultaneously enable insights into differences between management practice for innovation, the individual’s perception of control and freedom, as well as further details composing work environments, just as the findings which resulted from this study.

87
8 Summary and outlook
The goal of this thesis was to elaborate a tool that enables the depiction of different work environments by describing their presently implemented balance between control and freedom. This was done by deriving a theoretical framework from evaluating investigated empirical data of different environments and prior literature that studies the individual’s degree of freedom and the experienced control in different aspects that compose these environments. Elaborating an examination method for this framework as well as developing an intuitive, understandable and, however, still detailed means of depiction, produced a tool that allows the comparison of distinct work environments in different aspects of control and freedom, as conducted in the later course of this study.
Although information content of the pictures acquired within this study, marking the current accuracy of the tool, still has to be regarded with caution since this represents the initial attempt of the framework’s application, already perceivable patterns begin to emerge from the examined data, which could be considered as a mark of this approach’s effectiveness in addressing and examining the research question. In retrospective this underlines its appropriateness to investigate this question, by delineating the potential comprised in this approach of depiction.
Thinking about possible future applications from a research perspective, this tool can be used for the examination and comparison of different work environments and in particular for describing their present balance of control and freedom. Combined with a method for measurement of, for instance, innovation capability or success, possible future findings could contribute to identify elements that correlate positively with the examined performance providing insights that could finally lead to improved management practices. Regarding environments on a higher detail level, it could disclose the effect of different control mechanisms and how they are perceived by the individual. Furthermore, the tool would enable scholars to back their future findings up with additional data on the investigated environments contributing to cross-survey comparability of future findings.
Regarding the tool’s potential from an organizational perspective, providing the ability to compare work environments enables to conduct benchmarking of management practices comprising distinct organizations as well as between different subgroups within one organization, which could ultimately lead to practice improvement. However, the tool could also be used for self-assessment purposes for establishing a comprehension of the proper internal environment and its implemented balance of control and freedom. Based on this self-awareness, research insights could inspire the improvement of applied practices, just as comparison to other desirable subjects of investigation could.

88
9 List of references
AHUJA & LAMPERT 2001 Ahuja, G.; Lampert, C.: Entrepreneurship in the large corporation: A longitudinal study of how established firms create breakthrough inventions. Strategic Management Journal, (2001) 22, pp. 521−543.
AMABILE 1993 Amabile, T.: Motivational Synergy: Toward New Conceptualizations of Intrinsic and Extrinsic Motivation in the Workplace. Human Resource Management Review (1993) 3, pp. 185-201.
AMABILE 1996 Amabile, T.: Creativity and Innovation in Organizations. Case Study, Harvard Business School, Boston (1996).
AMABILE ET AL. 1996 Amabile, T.M.; Conti, R.; Coon, H.; Lazenby, J.; Herron, M.: Assessing the Work Environment for Creativity. The Academy of Management Journal (1996) 39, pp. 1154-1184.
AMBOS & SCHLEGELMILCH 2007 Ambos, B.; Schlegelmilch, B.B.: Innovation and Control in the Multinational Firm: A Comparison of Political and Contingency Approaches. Strategic Management Journal (2007) 28, pp. 473-486.
ANDRIOPOULOS & LOWE 2000 Andriopoulos, C.; Lowe, A.: Enhancing organizational creativity: the process of perpetual challenging. Management Decision (2000) 38, pp. 734−743.
ANTHONY & DEARDEN 1976 Anthony, R.; Dearden, J.: Management Control Systems: texts and cases. Homewood, III: Irwin 1976. ISBN: 0256018162.
BAIN ET AL. 2001 Bain, P.G.; Mann, L.; Pirola-Merlo, A.: The innovation imperative: The relationships between team climate, innovation, and performance in research and development teams. Small Group Research (2001) 32, pp. 55−73.
BALACHANDRA & FRIAR 1997 Balachandra, R.; Friar, J.H.: Factors for Success in R&D Projects and New Product Innovation: A Contextual Framework. IEEE Transactions on Engineering Management (1997) 44, pp. 276-287.
BAUMOL 1994 Baumol, W.J.: Entrepreneurship, Management, and the Structure of Payoffs. Cambridge: MIT Press 1994. ISBN: 0262023601.

89
BELLON 1994 Bellon, B.: Innover ou disparaître. Paris: Economica 1994. ISBN: 2717825754.
BISBE & OTLEY 2004 Bisbe, J.; Otely, D.: The effects of the interactive use of management control systems on product innovation. Accounting, Organizations and Society (2004) 29, pp. 709-737.
BONNER ET AL. 2002 Bonner, J.M.; Ruekert, R.W.; Walker, O.C. Jr.: Upper management control of new product development projects and project performance. The Journal of Product Innovation Management (2002) 19, pp. 233-245.
BURNS & STALKER 1966 Burns, T.; Stalker, G.: The Management of Innovation. London: Tavistock 1966. ISBN: 042272050X.
CANGARLI & DELEN 2012 Cangarli, B.G.; Delen, M.: Multidimensionality of organizational culture and its relationship with bureaucratic, market, clan and output control in MNCs. African Journal of Business Management (2012) 6, pp. 2391-2402.
CLARK & FUJIMOTO 1991 Clark, K.B.; Fujimoto, T.: Product development performance: Strategy, Organization, and Management in the World Auto Industry. Boston: Harvard Business School Press 1991. ISBN: 0875842453.
COOPER 1999 Cooper, R.G.: Product leadership: creating and launching superior new products. Cambridge: Perseus Books 1999. ISBN: 0738201561.
CRAWFORD & DI BENEDETTO 2010 Crawford, C.M.; Di Benedetto, C.A.: New products management. 10th Ed. Chicago: Irwin 2010, ISBN: 0073404802.
DAFT & LEWIN 1993 Daft, R.; Lewin, A.: Where are the theories of new organizational forms? An editorial essay. Organizational Science (1993) 4, pp. i-iv.
DAMANPOUR 1991 Damanpour, F.: Organizational innovation: a meta-analysis of effects of determinants and moderators. Academy of Management Journal (1991) 34, pp. 555−590.
DAVILA 2000 Davila, T.: An empirical study on the drivers of management control systems' design in new product development. Accounting, Organizations and Society (2000) 25, pp. 383-409.
DEAL & KENNEDY 1982 Deal, T.E.; Kennedy, A.A.: Corporate culture: The rites and rituals of corporate life. Reading, MA: Addison-Wesley 1982. ISBN: 0201102773.
90
DEMARCO 2008 DeMarco, A.: Estimating is not just about cost, it is about respecting the Project Management Triangle <http://blog.pricesystems.com/blog/tony-demarco-on-accurate-estimating/estimating-is-not-just-about-cost-it-is-about-respecting-the-project-management-triangle> (19.11.2012)
DOUGHERTY & HARDY 1996 Dougherty, D.; Hardy, C.: Sustained product innovation in large, mature organizations: overcoming innovation-to-organization problem. Academy of Management Journal (1996) 39, pp. 1120−1153.
EISENHARDT & GRAEBNER 2007 Eisenhardt, K.M.; Graebner, M.E.: Theory building from cases: opportunities and challenges. Academy of Management Journal (2007) 50, pp. 25–32.
EKVALL 1983 Ekvall, G.: Climate, structure, and innovativeness of organizations: A theoretical framework and an experiment. Report 1, The Swedish Council for Management and Organizational Behaviour, Stockholm (1983).
ELENKOV & MANEV 2005 Elenkov, D.; Manev, I.: Top management leadership and influence on innovation: The role of sociocultural context. Journal of Management (2005) 31, pp. 381−402.
FRANCIC & BESSANT 2005 Francic, D.; Bessant, J.: Targeting innovation and implications for capability development. Technovation (2005) 25, pp. 171-183.
FRIED 2010 Fried, J.: Why work doesn’t happen at work <http://www.ted.com/talks/ jason_fried_why_work_doesn_t_happen_at_work.html> (04.11.2012)
GERSICK 1988 Gersich, C.J.G.: Time and transition in work teams: Toward a new model of group development. Academy of Management Journal (1988) 41, pp. 9-41.
GOFFIN & MITCHELL 2010 Goffin, K.; Mitchell, R.: Innovation Management: Strategy and Implementation using the Pentathlon Framework. 2nd Ed. Houndmills: Palgrave Macmillan 2010. ISBN: 0230205828.
HAMEL 2006 Hamel, G.: Why, What, and How of Management Innovation. Harvard Business Review (2006) February.
HARTER ET AL. 2002 Harter, J.K.; Schmidt, F.L.; Keyes, C.L.: (2002) Well-Being in the Workplace and its Relationship to Business Outcomes: A Review of the Gallup Studies. In Keyes, C.L. et al.: Flourishing: Positive psychology and the life well-lived. Washington DC: American Psychological Association 2003, pp. 205–24. ISBN: 1557989303
91
HITT ET AL. 2001 Hitt, M.A.; Ireland, R.D.; Camp, S.M.; Sexton, D.L.: Guest editors’ introduction to the special issue strategic entrepreneurship: entrepreneurial strategies for wealth creation. Strategic Management Journal (2001) 22, pp. 479–491.
HOFSTEDE 2001 Hofstede, G.: Culture’s Consequences: Comparing Values, Behaviors, Institutions, and Organizations Across Nations. 2nd Ed. Thousand Oaks: Sage Publications 2001. ISBN: 0803973241.
HOPWOOD 1976 Hopwood, A.G.: Accounting and Human Behavior. Englewood Cliffs, N.J.: Prentice-Hall 1976. ISBN: 013002063X.
HORNBY 2010 Hornby, A.S. (Ed.): Oxford Advanced Learner’s Dictionary. 2th Ed. Oxford: Oxford University Press 2010. ISBN: 019479900X.
ISAKSEN & EKVALL 2010 Isaksen, S.G.; Ekvall, G.: Managing for Innovation: The Two Faces of Tension in Creative Climates. Creativity and Innovation Management (2010) 19, pp. 73-88.
IYER & DAVENPORT 2008 Iyer, B.; Davenport, T.H.: Reverse Engineering Google’s Innovation Machine. Harvard Business Review (2008) April.
JELINEK & SCHOONHOVEN 1993 Jelinek, M.; and Schoonhoven, C.B.: The innovation marathon: Lessons from high technology firms. San Francisco: Jossey-Bass 1993. ISBN: 1555425984.
JOHNS 2006 Johns, G.: The Essential Impact of Context on Organizational Behavior. Academy of Management Review (2006) 31, pp. 386–408.
JUNG ET AL. 2003 Jung, D.; Chow, C.; Wu, A.: The role of transformational leadership in enhancing organizational innovation: Hypotheses and some preliminary findings. The Leadership Quarterly (2003) 14, pp. 525−540.
KAMM 1980 Kamm, J.: The balance of innovative behavior and control in new product development. DBA Dissertation. Graduate School of Business Administration, Harvard University (1980).
KANTER 1983 Kanter, M.R.: The Change Masters: Innovations for Productivity in the American Corporation. New York: Simon & Schuster, 1983. ISBN: 0671428020.
92
KASPER 1987 Kasper, H.: Dilemmas of Innovation Management. Engineering Costs and Production Economics (1987) 12, pp. 307-314.
KEIL 2011 Keil, S.: A manifesto for play, for Bulgaria and beyond. <http://www.ted.com/talks/ steve_keil_a_manifesto_for_play_for_bulgaria_and_beyond.html> (06.07.2012)
KHURANA & ROSENTHAL 1998 Khurana, A.; Rosenthal, S.R.: Towards Holistic ‘Front Ends’ In New Product Development. The Journal of Product Innovation Management (1998) 15, pp. 57-74.
KOEN ET AL. 2001 Koen, P.; Ajamian, G.; Burkart, R.; Clamen, A.; Davidson, J.; D’Amore, R.; Elkins, C.; Herald, K.; Incorvia, M.; Johnson, A.; Karol, R.; Seibert, R.; Slavejkov, A.; Wagner, K.: Providing Clarity and a Common Language to the “Fuzzy Front End”. Research Technology Management (2001) 31, pp. 46-55.
KUENZI & SCHMINKE 2009 Kuenzi, M.; Schminke, M.: Assembling the Fragments into a Lens: A Review, Critique, and Proposed Research Agenda for the Organizational Work Climate Literature. Journal of Management (2009) 35, pp. 634–717.
LANGFIELD-SMITH 1997 Langfield-Smith, K.: Management Control Systems And Strategy: A Critical Review. Accounting, Organizations and Society (1997) 22, pp. 207-232.
LEWIN ET AL. 1939 Lewin, K.; Lippit, R.; White, R.K.: Patterns of aggressive behavior in experimentally created social climates. Journal of Social Psychology (1939) 10 ,pp. 271-301.
LEWRICK ET AL. 2012 Lewrick, M.; Raeside, R; Omar, M.: Organizational Capabilities for Successful Innovation. In: Katzy, B. et al. (Ed.) 2012 18th International Conference on Engineering, Technology and Innovation (ICE), Munich, 18-20 June 2012. Munich: Strascheg Center for Entrepreneurship (SCE) 2012, pp. 757-770. ISBN: 9781467322571.
MAKRI & SCANDURA 2010 Makri, M.; Scandura, T.A.: Exploring the effects of creative CEO leadership on innovation in high-technology firms. The Leadership Quarterly (2010) 21, pp. 75-88.
MAKRI ET AL. 2006 Makri, M.; Lane, P.J.; Gomez-Mejia, L.: CEO Incentives, innovation, and performance in technology-intensive firms. Strategic Management Journal (2006) 27, pp. 1057−1080.
MARSH 2010 Marsh, N.: How to make work-life balance work <http://www.ted.com/talks/ nigel_marsh_how_to_make_work_life_balance_work.html> (06.06.2012)

93
MEDINA ET AL. 2005 Medina, C.C.; Lavado, A.C.; Cabrera, R.V.: Characteristics of Innovative Companies: A Case Study of Companies in Different Sectors. Creativity and Innovation Management (2005) 14, pp. 272-287.
MERCHANT 1985 Merchant, K.: Control in business organizations. Boston: Pitman 1985. ISBN: 0273019147.
MCDERMOTT & O’CONNOR 2002 McDermott, C.M.; O’Connor, G.C.: Managing radical innovation: an overview of emergent strategy issues. The Journal of Product Innovation Management (2002) 19, pp. 424-438.
MUMFORD & GUSTAFSON 1988 Mumford, M.D.; Gustafson, S.B.: Creativity syndrome: Integration, application and innovation. Psychological Bulletin (1988) 103, pp. 27−43.
MUMFORD ET AL. 2002 Mumford, M.D.; Scott, G.M.; Gaddis, B., Strange, J.M.: Leading creative people: orchestrating expertise and relationships. The Leadership Quarterly (2002) 13, pp. 705−750.
O’REILLY & TUSHMAN 1997 O’Reilly, C.; Tushman M.L.: Using Culture for Strategic Advantage: Promoting Innovation through Social Control. In Tushman, M.L. et al.: Managing Strategic Innovation and Change: A Collection of Readings, New York: Oxford University Press 1997, pp. 631-641. ISBN: 0195100107.
O’REILLY ET AL. 1991 O’Reilly, C.A.; Chatman, J.A.; Caldwell, D.F.: People and organizational culture: A profile comparison approach to assessing person-organization fit. The Academy of Management Journal (1991) 34, pp. 487-516.
ORTEGA 2009 Ortega, R. (Ed.): Innovation = Good Idea + Implementation + Measurement <http://cacm.acm.org/blogs/blog-cacm/49983-innovation-good-idea-implementation-measurement/fulltext> (11.11.2012)
OUCHI 1977 Ouchi, W.G.: The Relationship between Organizational Structures and Organizational Control. Administrative Science Quarterly (1977) 22, pp. 95-l 12.
OUCHI 1979 Ouchi, W.G.: A Conceptual Framework for the Design of Organizational Control Mechanisms. Management Science (1979) 25, pp. 833-848.
PIERCE ET AL. 1989 Pierce, J.L.; Gardner, D.G.; Cummings, L.L.; Dunham, R.B.: Organization-based self-esteem: Construct definition, measurement, and validation. Academy of Management Journal (1989) 32, pp. 622-648.

94
PINK 2009 Pink, D.: The puzzle of motivation <http://www.ted.com/talks/dan_pink_on_motivation.html> (18.07.2012)
PLESCHAK & SABISCH 1996 Pleschak, F; Sabisch, H.: Innovationsmanagement. Stuttgart: UTB 1996. ISBN: 3825281221.
PORTER 1980 Porter, M.E.: Competitive Strategy: techniques for analyzing industries and competitors. New York: Free Press 1980. ISBN: 0029253608.
POSKELA & MARTINSUO 2009 Poskela, J.; Martinsuo, M.: Management control and strategic renewal in the front end of innovation. Journal of Product Innovation Management (2009) 26, pp. 671-684.
PURANAM ET AL. 2006 Puranam, P.; Singh, H.; Zollo, M.: Organizing for innovation: managing the coordination-autonomy dilemma in technology acquisitions. Academy of Management Journal (2006) 49, pp. 263−280.
QUINN 1985 Quinn, J.B.: Managing innovation: controlled chaos. Harvard Business Review (1985) 63, pp. 78−84.
RASULZADA & DACKERT 2009 Rasulzada, F.; Dackert, I.: Organizational Creativity and Innovation in Relation to Psychological Well-Being and Organizational Factors. Creativity Research Journal (2009) 21, pp.191–198.
RESSLER & THOMPSON 2010 Ressler, C.; Thompson, J.: Why Work Sucks and How to Fix It: The Results-Only Revolution. London: Portfolio Trade 2010. ISBN: 1591842921
SACKMANN 1992 Sackmann, S.A.: Culture and subcultures: An analysis of organizational knowledge. Administrative Science Quarterly (1992) 37, pp. 140-161.
SCHEWE 1994 Schewe, G.: Successful innovation management: An integrative perspective. Journal of Engineering and Technology Management (1994) 11, pp. 25-53.
SCHUMPETER 1912 Schumpeter, J.: The Theory of Economic Development: An Inquiry into Profits, Capital, Credit, Interest, and the Business Cycle. Cambridge: Harvard University Press 1912. ISBN: 0878556982
SCHUMPETER 2005 Schumpeter, J.: Business Cycles: A Theoretical, Historical, and Statistical Analysis of the Capitalist Process. Eastford: Martino Publishing 2005. ISBN: 1578985560. (Reprint)
95
SCOTT & BRUCE 1994 Scott, S.G.; Bruce, R.A.: Determinants of innovative behavior: A path model of individual innovation in the workplace. Academy of Management Journal (1994) 37, pp. 580−607.
SEDDON 2003 Seddon, J.: Freedom from Command and Control: A Better Way to Make the Work Work. Buckingham: Vanguard Education Limited 2003. ISBN: 0954618300.
SEIDENSCHWARZ 2012 Scheidenschwarz: W.: Management von Geschäftsstrategien. Vorlesungsskript. Technische Universität München (2012)
SEMLER 1995 Semler, R.: Das Semco System: Management ohne Manager: Das neue revolutionäre Führungsmodell. München: Heine 1995. ISBN: 3453087879.
SEMLER 2003 Semler, R.: The Seven-Day Weekend: A Better Way to Work in the 21st Century. London: Random House 2003. ISBN: 0099425236.
SHIELDS 1997 Shields, M.D.: Research in management accounting by North Americans in the 1990s. Journal of Management Accounting Research (1997) 9, pp. 3–61.
SIMONS 1994 Simons, R.: Levers of Control: How Managers Use Innovative Control Systems to Drive Strategic Renewal. Boston: Harvard Business Review Press 1994. ISBN: 0875845592.
SOSIK ET AL. 2004 Sosik, J.J.; Jung, D.; Berson, Y.; Dionne, S.D.; Jaussi, K.S.: The dream weavers: Strategy-focused leadership in technology-driven organizations. Greenwich, CT: Information Age Publishing 2004. ISBN: 159311110X.
STEVENSON & GUMPERT 1985 Stevenson, H.H.; Gumpert, D.E.: The heart of entrepreneurship. Harvard Business Review (1985) 63, p. 85.
THE COCA-COLA COMPANY 2010 The Coca-Cola Company (Ed.): History of Coca-Cola. <http://www.coca-cola.co.uk/about-us/history-of-coca-cola-1886-1892.html> (02.12.2012)
TIDD 2001 Tidd, J.: Innovation management in context: environment, organization and performance. International Journal of Management Reviews (2001) 3, pp. 169-183.
TOMALA & SÉNÉCHAL 2004 Tomala, F.; Sénéchal, O.: Innovation Management: a synthesis of academic and industrial points of view. International Journal of Project Management (2004) 22, pp. 281-287.
96
TROTT 2005 Trott, P.: Innovation management and new product development. 3rd Ed. Harlow: Pearson Education Limited 2005. ISBN: 0273686437.
TUSHMAN & ANDERSON 1997 Tushman, M.L.; Anderson P. (Eds.): Managing Strategic Innovation and Change: A Collection of Readings. New York: Oxford University Press 1997. ISBN: 0195100107.
TUSHMAN & O’REILLY 1996 Tushman, M.L.; O'Reilly, C.: Ambidextrous organizations: Making evolutionary and revolutionary change. California Management Review (1996) 38, pp. 8−30.
VAN DE VEN & FERRY 1980 Van de Ven, A.H.; Ferry, D.L.: Measuring and assessing organizations. New York: John Wiley & Sons Inc. 1980. ISBN: 0471048321. (Wiley series on organizational assessment & change)
VINCENT ET AL. 2004 Vincent, L.H.; Bharadwaj, S.G.; Challagalla, G.N.; Does Innovation Mediate Firm Performance? A Meta-Analysis of Determinants and Consequences of Organizational Innovation. Working Paper, Georgia Institute of Technology, Atlanta (2004).
ZHOU 2003 Zhou, J.: Feedback valence, feedback style, task autonomy, and achievement orientation: Interactive effects on creative performance. Journal of Applied Psychology (2003) 83, pp. 261-276.
ZIEN & BUCKLER 1997 Zien, K.A.; Buckler, S.A.: From Experience: Dreams to Market: Crafting a Culture of Innovation. Journal of Product Innovation Management (1997) 14, pp. 274-287.

97
10 List of figures and tables
Figure 2-1: Definition of innovation .......................................................................................... 9
Figure 2-2: The Work Environment's Impact on Creativity - AMABILE 1996 ......................... 11
Figure 2-3: Simons' Levers of Control - SIMONS 1994 ............................................................ 16
Figure 4-1: Individual freedom ................................................................................................ 30
Figure 4-2: Identification of control dimensions ...................................................................... 31
Figure 4-3: Identified dimensions of control ............................................................................ 32
Figure 4-4: The Process from strategy to action - after SEIDENSCHWARZ 2012 ....................... 34
Figure 4-5: Project Management Triangle - DEMARCO 2008 .................................................. 38
Figure 4-6: Work environment assessment .............................................................................. 38
Figure 4-7: Spanning individual freedom................................................................................. 39
Figure 4-8: Different possible environments ............................................................................ 40
Figure 4-9: Questionnaire section: time ................................................................................... 42
Figure 4-10: Sample result: time .............................................................................................. 43
Figure 4-11: Questionnaire section: objectives ........................................................................ 45
Figure 4-12: Sample result: objectives ..................................................................................... 45
Figure 4-13: Questionnaire section: processes ......................................................................... 47
Figure 4-14: Sample result: processes ...................................................................................... 47
Figure 4-15: Questionnaire section: budget ............................................................................. 49
Figure 4-16: Sample result: budget .......................................................................................... 50
Figure 4-17: Questionnaire section: communication ............................................................... 52
Figure 4-18: Sample result: communication ............................................................................ 53
Figure 4-19: Questionnaire section: information ..................................................................... 56
Figure 4-20: Sample result: information .................................................................................. 56
Figure 4-21: Questionnaire section: culture ............................................................................. 59
Figure 4-22: Sample result: culture .......................................................................................... 59
Figure 4-23: Sample environment ............................................................................................ 60
Figure 4-24: Lowest possible values ........................................................................................ 61
Figure 4-25: Low financial freedom - budget not assessible ................................................... 61
Figure 4-26: Minimum freedom - maximum freedom ............................................................. 62
Figure 4-27: Similar scores - alternating scores ....................................................................... 63
98
Figure 4-28: Sample values - equally distributed values .......................................................... 64
Figure 4-29: Detailed depiction of the sample environment .................................................... 65
Figure 4-30: High degree of team work - high degree of rules, guidelines and delegation ..... 66
Figure 4-31: Sample environment with additional information ............................................... 67
Figure 5-1: Detailed picture, case #11 - company H ................................................................ 71
Figure 5-2: Detailed picture, case #6 - company D .................................................................. 73
Figure 5-3: Detailed picture, case #7 - company D .................................................................. 73
Figure 5-4: Same company - C - case #4 and #5 ...................................................................... 74
Figure 5-5: Same company - E - case #8 and #12 .................................................................... 75
Figure 5-6: Business specific peculiarities - case #1 and #3 .................................................... 75
Figure 5-7: Same position - CEOs - case #10 and #11............................................................. 76
Figure 5-8: 'time' - 'culture' correlation .................................................................................... 77
Table 3-1: Casebook ................................................................................................................. 25
Table 5-1: Extended casebook.................................................................................................. 70
Table 6-1: Additionally investigated information .................................................................... 80
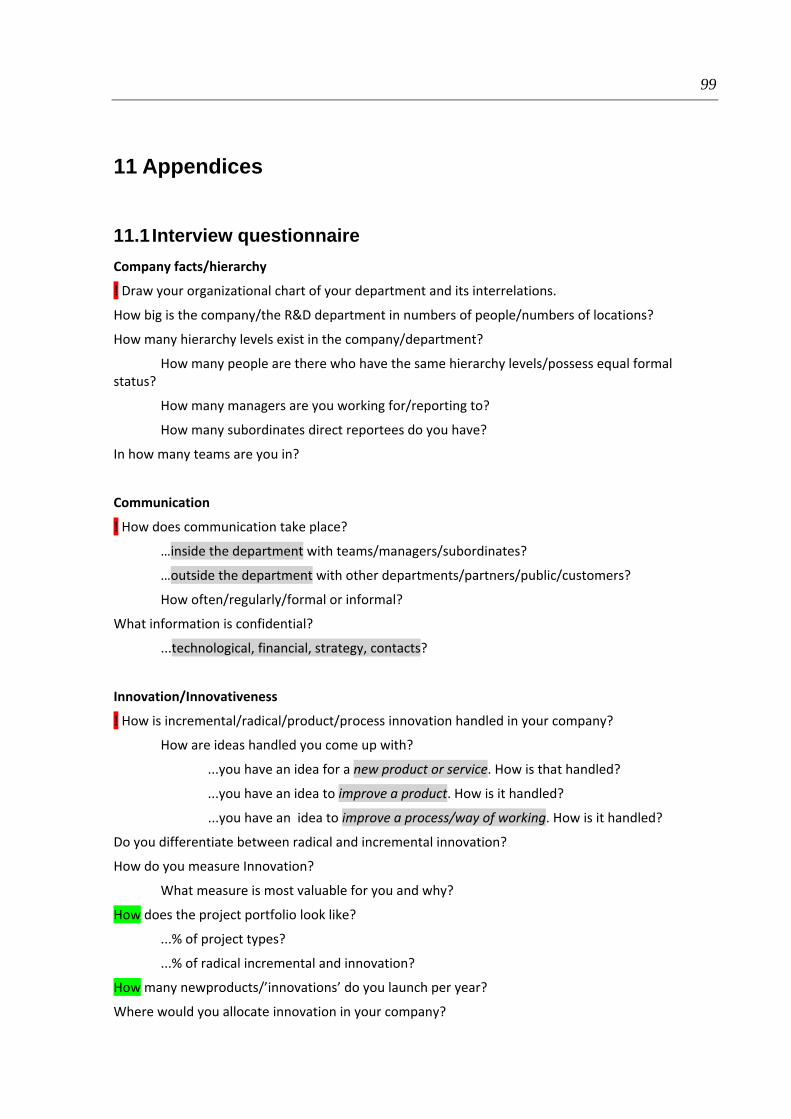
99
11 Appendices
11.1 Interview questionnaire
Company facts/hierarchy
! Draw your organizational chart of your department and its interrelations.
How big is the company/the R&D department in numbers of people/numbers of locations?
How many hierarchy levels exist in the company/department?
How many people are there who have the same hierarchy levels/possess equal formal status?
How many managers are you working for/reporting to?
How many subordinates direct reportees do you have?
In how many teams are you in?
Communication
! How does communication take place?
…inside the department with teams/managers/subordinates?
…outside the department with other departments/partners/public/customers?
How often/regularly/formal or informal?
What information is confidential?
...technological, financial, strategy, contacts?
Innovation/Innovativeness
! How is incremental/radical/product/process innovation handled in your company?
How are ideas handled you come up with?
...you have an idea for a new product or service. How is that handled?
...you have an idea to improve a product. How is it handled?
...you have an idea to improve a process/way of working. How is it handled?
Do you differentiate between radical and incremental innovation?
How do you measure Innovation?
What measure is most valuable for you and why?
How does the project portfolio look like?
...% of project types?
...% of radical incremental and innovation?
How many newproducts/’innovations’ do you launch per year?
Where would you allocate innovation in your company?

100
Decision making
! How does the decision making process look like?
...number of people? which people/departments?
...decisions about products/features/projects/process improvements?
...big decisions: objectives/budget/time frames/hiring?
What decisions can you make on your own/which ones need you to request or to apply for?
How formal/flexible is the decision process?
What exceptions do exist?
How is it documented?
How detailed does the documentation have to be?
! What overall strategyand criteria is/are underlying decisions?
...quality/risk/cost?
Control
! What formal/explicit rules do exist in your company?
...working hours/work location/dresscode/routines?
Are there rules/guidelines on how to do things/rules of thumb?
How is the reward system working?
What benefits/bonuses do exist for employees?
…which ones do you have/use/get?
What events does your company organize/take part in?
…workshops, programs, prices?
! How and by whom is (your) work evaluated?
What happens in case of bad performance/underperformance/failure?
…are there sanctions?
! Do you perceive the way your work is organized as:
guiding/supporting 1 2 3 4 5 6 7 8 9 10 controlling
! How do you perceive all these rules/bonuses/controls/guiding?
! How do you perceive the overall way of working:
I hate it 1 2 3 4 5 6 7 8 9 10 I love it
Culture
! What values are held up in your company/is the company’s philosophy?
What is important to your company?
What ist he company‘s overall(/long term) goal/strategy?
What is the power of your organization?
What is it that your company stands out with?
! What motivates you in your work/company?
Legend
! core question
…… specification/example/scenario
…… potential question for manager

101
11.2 Reevaluation questionnaire
Please choose only one answer from the multiple choice questions and mark that one with a sign or a color. If several answers would apply, please choose the most common one. If questions are not formulated clearly enough/hard to answer, please mark the question red and leave a comment so that I can improve the questionnaire with your input. Thank you. Further explanation and examples are given in blue.
TIME
What measurement is used to measure working time?
fixed working hours
flexitime
not measured
Is the attendance of meetings scheduled by your manager or other executives mandatory?
mandatory but still excusable by vacation, illness etc.
discussable necessity of attendance, day and time, or solve issue by email or other alternative
up to me to decide if my attendance is valuable or not, like an invitation, no neg. conseq. of
not going
How is taking vacation handled?
requires approval limited amount of annual vacation, you apply for time, manager makes decision
coordination vacation is taken in coord. with manager, veto very unlikely
up to me you can take vacation how much and whenever you want, just coordination required
Are you allowed to work from home?
not possible have to work at the office
approval/coordinat. possible, but requires approval/must aks for in advance/manager has veto
up to me may work from other places whenever you want, just coordinate with persons that
might need you
Does/did one have to earn trust in advance for being able to use flexibility of working time and working place?
yes
no
OBJECTIVES
What % of your objectives (content and time frame) are set in which way and by whom? This is about setting objectives and deadlines. How you reach the objectives is treated in the next category: processes. Manager in this context can also stand for any other external instance like other departments or customers.
1. delegated/set by manager % content and time frame are set
2. manager makes decision, considering people’s prefer./opinions % slight influence on content and deadline
3. discussion/agreement with manager(s) % mutual agreement
4. discussion/agreement with team (+manager) % team discussion
5. up to me % f.ex. working on an idea, choosing a project
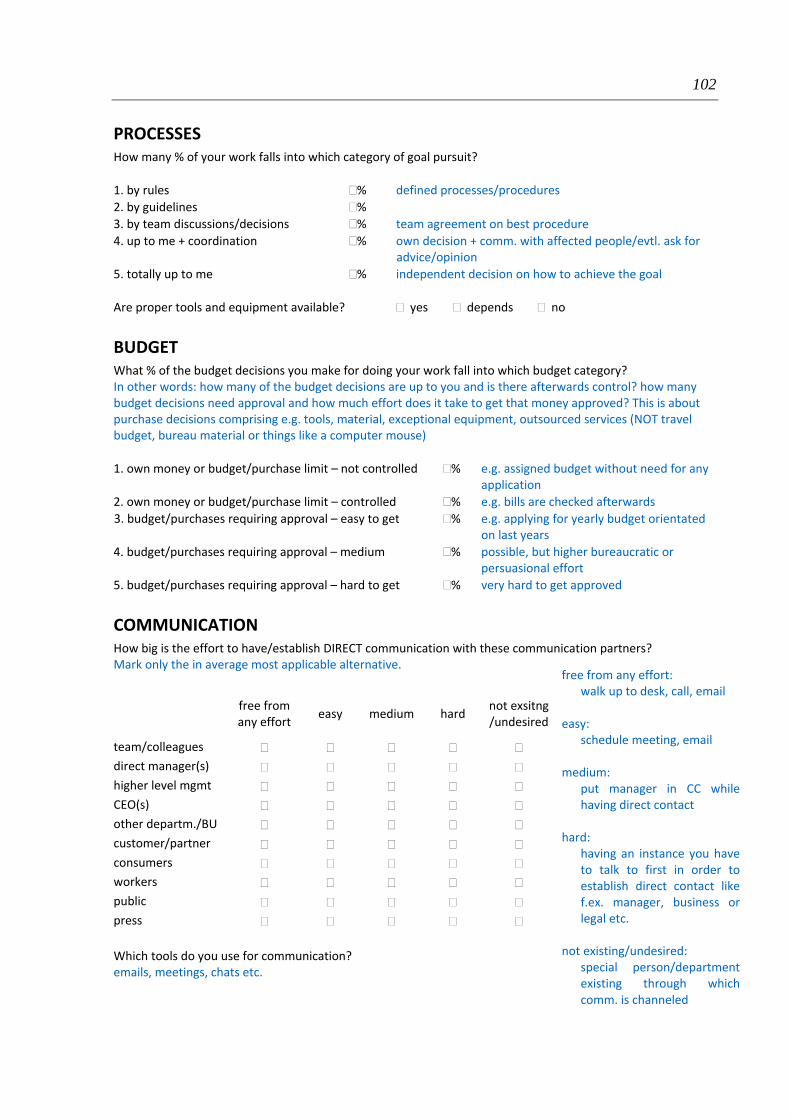
102
PROCESSES How many % of your work falls into which category of goal pursuit?
1. by rules % defined processes/procedures
2. by guidelines %
3. by team discussions/decisions % team agreement on best procedure
4. up to me + coordination % own decision + comm. with affected people/evtl. ask for advice/opinion
5. totally up to me % independent decision on how to achieve the goal
Are proper tools and equipment available? yes depends no
BUDGET What % of the budget decisions you make for doing your work fall into which budget category? In other words: how many of the budget decisions are up to you and is there afterwards control? how many budget decisions need approval and how much effort does it take to get that money approved? This is about purchase decisions comprising e.g. tools, material, exceptional equipment, outsourced services (NOT travel budget, bureau material or things like a computer mouse)
1. own money or budget/purchase limit – not controlled % e.g. assigned budget without need for any application
2. own money or budget/purchase limit – controlled % e.g. bills are checked afterwards
3. budget/purchases requiring approval – easy to get % e.g. applying for yearly budget orientated on last years
4. budget/purchases requiring approval – medium % possible, but higher bureaucratic or persuasional effort
5. budget/purchases requiring approval – hard to get % very hard to get approved
COMMUNICATION
How big is the effort to have/establish DIRECT communication with these communication partners? Mark only the in average most applicable alternative.
free from any effort
easy medium hard not exsitng /undesired
team/colleagues direct manager(s) higher level mgmt CEO(s) other departm./BU customer/partner consumers workers public press Which tools do you use for communication? emails, meetings, chats etc.
free from any effort:walk up to desk, call, email
easy:
schedule meeting, email medium:
put manager in CC while having direct contact
hard:
having an instance you have to talk to first in order to establish direct contact like f.ex. manager, business or legal etc.
not existing/undesired:
special person/department existing through which comm. is channeled
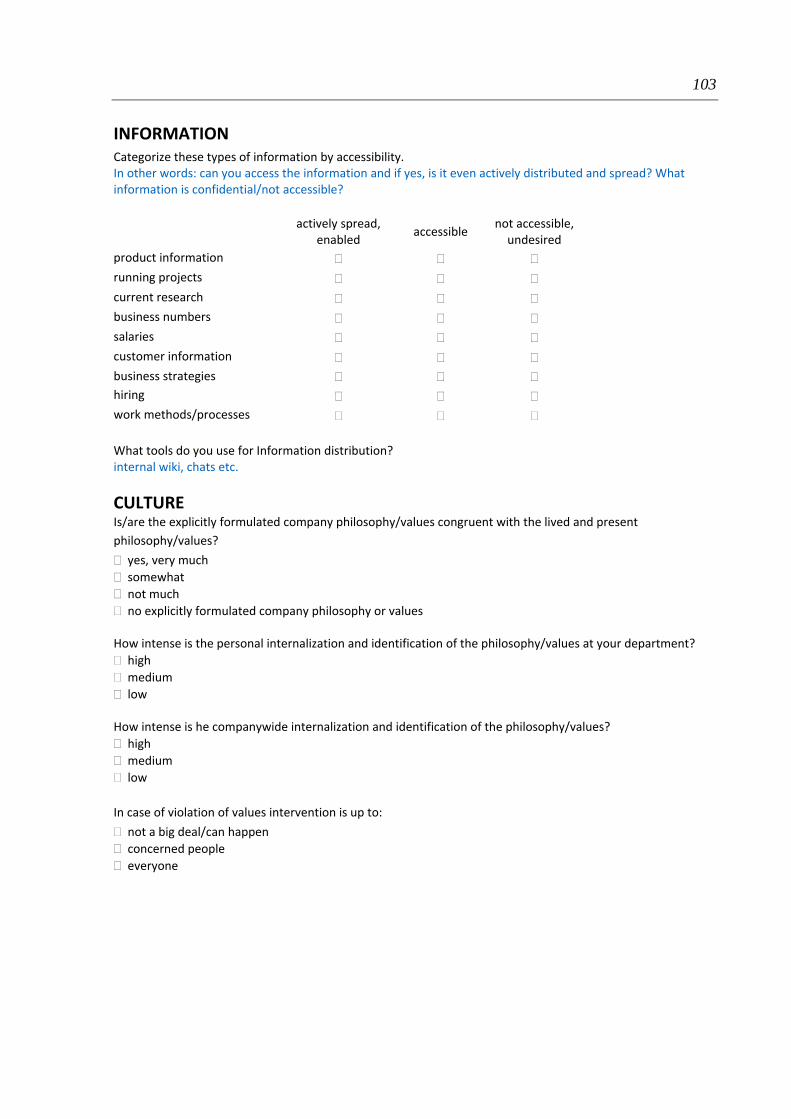
103
INFORMATION
Categorize these types of information by accessibility. In other words: can you access the information and if yes, is it even actively distributed and spread? What information is confidential/not accessible? actively spread,
enabled accessible
not accessible, undesired
product information running projects current research business numbers salaries customer information business strategies hiring work methods/processes
What tools do you use for Information distribution? internal wiki, chats etc.
CULTURE Is/are the explicitly formulated company philosophy/values congruent with the lived and present
philosophy/values?
yes, very much
somewhat
not much
no explicitly formulated company philosophy or values How intense is the personal internalization and identification of the philosophy/values at your department?
high
medium
low How intense is he companywide internalization and identification of the philosophy/values?
high
medium
low
In case of violation of values intervention is up to:
not a big deal/can happen
concerned people
everyone

104
11.3 Enhanced reevaluation questionnaire
Please chose only one answer at multiple choice questions and mark that one with a sign or a color. If several answers would apply, please choose the one displaying most of the cases. If questions are not formulated clearly enough/hard to answer, please mark the question red and leave a comment so that I can improve the questionnaire with your input. Thank you. Further explanation and examples are given in blue.
TIME What type of working time measurement is in use?
fixed working hours
flextime
not measured
Is the attendance of meetings scheduled by your manager or other executives mandatory?
mandatory but still excusable by vacation, illness etc.
discussable necessity of attendance, day and time, or solve issue by email or other alternative
up to me to decide if my attendance is valuable or not, like an invitation, no neg. conseq. of
not going
How is taking vacation handled?
requires approval limited amount of annual vacation, you apply for time, manager makes decision
coordination vacation is taken in coord. with manager, veto very unlikely
up to me you can take vacation how much and whenever you want, just coordination required
Are you allowed to work from home?
not possible have to work at the office
approval/coordinat. possible, but requires approval/must ask for in advance/manager has veto
up to me may work from other places whenever you want, just coordinate with persons that
might need you
Does/did one have to earn trust in advance for being able to use flexibility of working time and working place?
yes
no
OBJECTIVES How many % of your objectives (content and time frame) are set in which way and by whom? This is about setting objectives and deadlines. How you reach the objectives is treated in the next category: processes. Manager in this context can also stand for any other external instance like other departments or customers.
1. delegated/set by manager % content and time frame are set
2. manager makes decision, considering people’s prefer./opinions % slight influence on content and deadline
3. discussion/agreement with manager(s) % mutual agreement
4. discussion/agreement with team (+manager) % team discussion
5. up to me % f.ex. working on an idea, choosing a project
Who is involved in work evaluation and how is it done?
Does upwards evaluation/feedback exist?
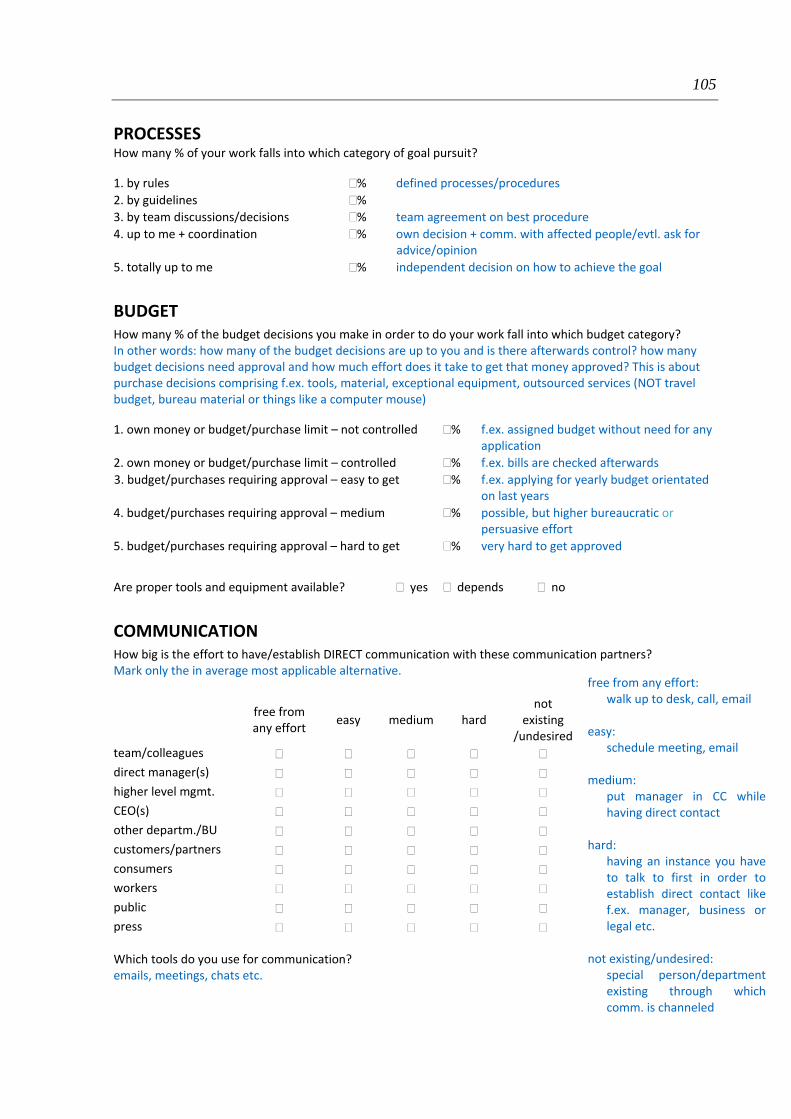
105
PROCESSES How many % of your work falls into which category of goal pursuit?
1. by rules % defined processes/procedures
2. by guidelines %
3. by team discussions/decisions % team agreement on best procedure
4. up to me + coordination % own decision + comm. with affected people/evtl. ask for advice/opinion
5. totally up to me % independent decision on how to achieve the goal
BUDGET How many % of the budget decisions you make in order to do your work fall into which budget category? In other words: how many of the budget decisions are up to you and is there afterwards control? how many budget decisions need approval and how much effort does it take to get that money approved? This is about purchase decisions comprising f.ex. tools, material, exceptional equipment, outsourced services (NOT travel budget, bureau material or things like a computer mouse)
1. own money or budget/purchase limit – not controlled % f.ex. assigned budget without need for any application
2. own money or budget/purchase limit – controlled % f.ex. bills are checked afterwards
3. budget/purchases requiring approval – easy to get % f.ex. applying for yearly budget orientated on last years
4. budget/purchases requiring approval – medium % possible, but higher bureaucratic or persuasive effort
5. budget/purchases requiring approval – hard to get % very hard to get approved
Are proper tools and equipment available? yes depends no
COMMUNICATION
How big is the effort to have/establish DIRECT communication with these communication partners? Mark only the in average most applicable alternative.
free from any effort
easy medium hard not
existing /undesired
team/colleagues
direct manager(s)
higher level mgmt.
CEO(s)
other departm./BU
customers/partners
consumers
workers
public
press
Which tools do you use for communication? emails, meetings, chats etc.
free from any effort:walk up to desk, call, email
easy:
schedule meeting, email medium:
put manager in CC while having direct contact
hard:
having an instance you have to talk to first in order to establish direct contact like f.ex. manager, business or legal etc.
not existing/undesired:
special person/department existing through which comm. is channeled

106
INFORMATION
Categorize these types of information by accessibility. In other words: can you access the information and if yes, is it even actively distributed and spread? What information is confidential/not accessible? actively spread,
enabled accessible
not accessible, undesired
product information
running projects
current research
business numbers
salaries
customer information
business strategies
hiring
work methods/processes
What tools do you use for Information distribution? internal wiki, chats etc.
CULTURE Is/are the explicitly formulated company philosophy/values congruent with the lived and present
philosophy/values?
yes, very much
somewhat
not much
no explicitly formulated company philosophy or values
How intense is the personal internalization and identification of the philosophy/values at your department?
high
medium
low
How intense is he companywide internalization and identification of the philosophy/values?
high
medium
low
In case of violation of values intervention is up to:
not a big deal/can happen
concerned people
everyone

107
MOTIVATION
Do you have benefits? f.ex. parking/food/coffee/discounts/travels/further training/extra salary/bonuses
Are there company programs?
f.ex. profit sharing/result oriented payment/internal startup funding/20%time/Idea generation processes/job
rotation
What is the particular strength of the company?
family business/in‐house competences/strong partners/flexibility/lot of money/strong culture/loyalty
How do you perceive the way your work is organized on a scale from 1 to 10 where 1 would be 'guiding/supporting' and 10 would be controlling?
guiding/supporting 1 2 3 4 5 6 7 8 9 10 controlling How do you perceive the overall way of working on a scale from 1 to 10 where 1 would be 'I hate it' and 10 would be 'I love it'?
I hate it 1 2 3 4 5 6 7 8 9 10 I love it
What motivates you to work?

108
11.4 Comprehensive environmental pictures
0
1
2
3
4
5TIM
OBJ
PRO
BUDCUL
COM
INF
Case #1COMMUNICATION PRACTICE‐ standup meetings, 1/d‐ planing meetings 2/m‐ work improvement meetings 1/m‐ interactive online projectplaning tool and wiki
DECISION INFLUENCERS‐ product managers‐marketing department
COMPANY CULTURE‐ open atmosphere‐ high team orientation‐ encouraging employees tocreate internal positive change
COMPANY VISION‐ faciliate the customer to reachhis goal and to innovate
WORK PRACTICE‐ people organized by products‐ priorization and ditribution of
work packages by the team‐ team choses its practices
‐many iterations, intense customer communication
‐ employees freed from non‐core tasks
MEASURES‐ customer feedback
TRUSTgranted
TOOL AVAILABILITY yes
TYPE not applicable
OBJECTIVE SELECTION CRITERIA‐ internal votes on ideas
PROCESS DECISION CRITERIA‐ customer opinion and reactionto preliminary versions
Comp. A
guiding/supporting 1 2 3 4 5 6 7 8 9 10 controlling
ENVIRONMENTAL PERCEPTION 'I hate it' 1 2 3 4 5 6 7 8 9 10 'I love it'
X
X
0
1
2
3
4
5TIM
OBJ
PRO
BUDCUL
COM
INF
Case #3COMMUNICATION PRACTICE‐ setting objectivesmeeting, 4/y
‐ high degree of onon demand communication
‐ informal communication
DECISION INFLUENCERS‐ product managers
COMPANY CULTURE‐ high trust in employees‐ open atmosphere‐ high ethical standards‐ high content and output orientation
COMPANY VISION‐ provide the best user experience possible‐ never violate the basic ethics
MEASURES‐ customer feedback
TRUSTgranted
TOOL AVAILABILITY yes
TYPE not applicable
OBJECTIVE SELECTION CRITERIA‐ strategy developed by managers
PROCESS DECISION CRITERIA‐ decisions made prom acustomer's perspective
Comp. B
guiding/supporting 1 2 3 4 5 6 7 8 9 10 controlling
ENVIRONMENTAL PERCEPTION 'I hate it' 1 2 3 4 5 6 7 8 9 10 'I love it'
X
X
WORK PRACTICE‐ people organized by products‐ priorization and ditribution of
work packages by the team‐ self organization by employees
‐many and fast iterations‐ intense customer communication
‐ employees freed from non‐core tasks

109
0
1
2
3
4
5TIM
OBJ
PRO
BUDCUL
COM
INF
Case #4COMMUNICATION PRACTICE‐ high degree of ondemand communication
‐ informal communication
DECISION INFLUENCERS‐ business department‐middle level management‐ higher level management
COMPANY CULTURE‐ open atmosphere‐ low structurization‐ appreciation ofconstuctive feedback
‐ emphasis on equal treatmentand conditions regarding employees
COMPANY VISION‐ no
WORK PRACTICE ‐matrix organization‐ further expertise consulted
on demand‐ low formalization
‐ employees advertise projects towardsbusiness department for budget allocation
MEASURES‐ technological readiness
TRUSTgranted
TOOL AVAILABILITY depends
TYPE budget
OBJECTIVE SELECTION CRITERIA‐ business opportunity and likeliness‐ innovativity and patentability
PROCESS DECISION CRITERIA‐ cost‐benefit relation‐ data driven evaluation of thealternative's suitability
Comp. C
guiding/supporting 1 2 3 4 5 6 7 8 9 10 controlling
ENVIRONMENTAL PERCEPTION 'I hate it' 1 2 3 4 5 6 7 8 9 10 'I love it'
X
X
0
1
2
3
4
5TIM
OBJ
PRO
BUDCUL
COM
INF
Case #5COMMUNICATION PRACTICE‐ high degree of ondemand communication
‐ informal communication
DECISION INFLUENCERS‐ business department‐middle level management‐ higher level management
COMPANY CULTURE‐ open atmosphere‐ low structurization‐ appreciation ofconstuctive feedback
‐ emphasis on equal treatmentand conditions regarding employees
COMPANY VISION‐ no data
WORK PRACTICE ‐matrix organization‐ further expertise consulted
on demand‐ low formalization
‐ employees advertise projects towardsbusiness department for budget allocation
MEASURES‐ technological readiness
TRUSTgranted
TOOL AVAILABILITY depends
TYPE budget
OBJECTIVE SELECTION CRITERIA‐ business opportunity and likeliness‐ innovativity and patentability
PROCESS DECISION CRITERIA‐ cost‐benefit relation‐ data driven evaluation of thealternative's suitability
Comp. C
guiding/supporting 1 2 3 4 5 6 7 8 9 10 controlling
ENVIRONMENTAL PERCEPTION 'I hate it' 1 2 3 4 5 6 7 8 9 10 'I love it'
X
X
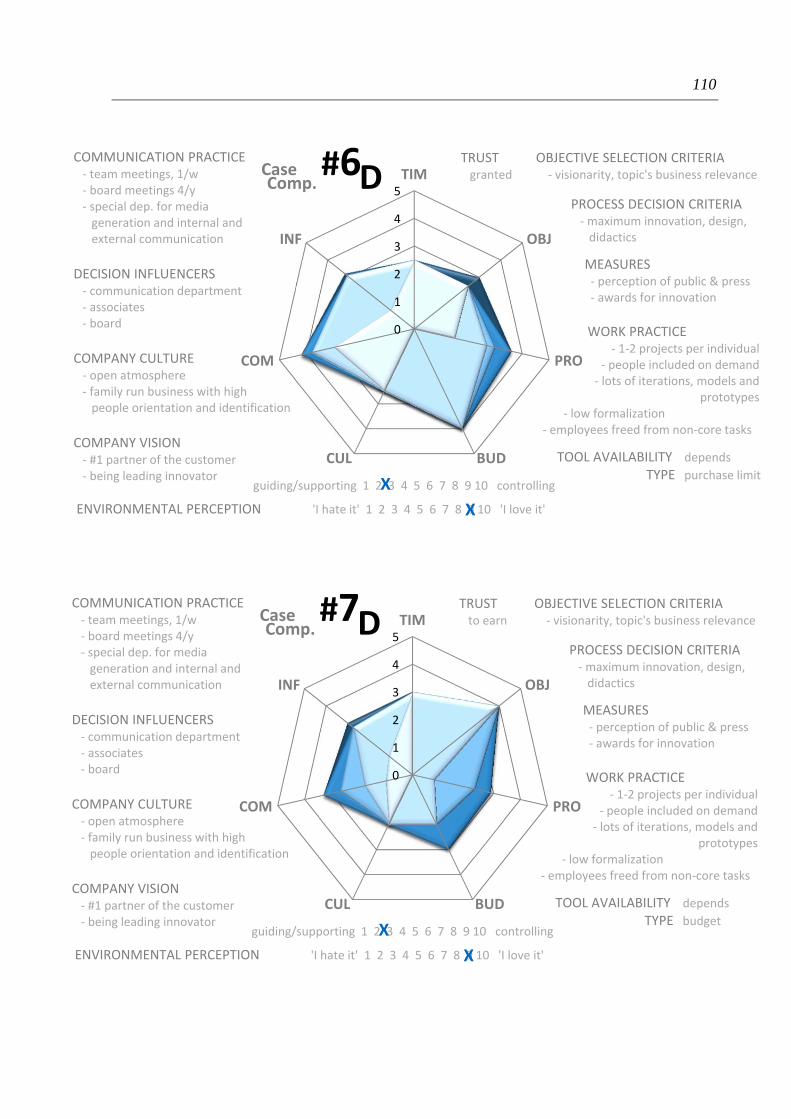
110
0
1
2
3
4
5TIM
OBJ
PRO
BUDCUL
COM
INF
Case #6COMMUNICATION PRACTICE‐ team meetings, 1/w‐ board meetings 4/y‐ special dep. for mediageneration and internal andexternal communication
DECISION INFLUENCERS‐ communication department‐ associates‐ board
COMPANY CULTURE‐ open atmosphere‐ family run business with highpeople orientation and identification
COMPANY VISION‐ #1 partner of the customer‐ being leading innovator
WORK PRACTICE‐ 1‐2 projects per individual
‐ people included on demand‐ lots of iterations, models and
prototypes‐ low formalization
‐ employees freed from non‐core tasks
MEASURES‐ perception of public & press‐ awards for innovation
TRUSTgranted
TOOL AVAILABILITY depends
TYPE purchase limit
OBJECTIVE SELECTION CRITERIA‐ visionarity, topic's business relevance
PROCESS DECISION CRITERIA‐maximum innovation, design,didactics
Comp. D
guiding/supporting 1 2 3 4 5 6 7 8 9 10 controlling
ENVIRONMENTAL PERCEPTION 'I hate it' 1 2 3 4 5 6 7 8 9 10 'I love it'
X
X
0
1
2
3
4
5TIM
OBJ
PRO
BUDCUL
COM
INF
Case #7COMMUNICATION PRACTICE‐ team meetings, 1/w‐ board meetings 4/y‐ special dep. for mediageneration and internal andexternal communication
DECISION INFLUENCERS‐ communication department‐ associates‐ board
COMPANY CULTURE‐ open atmosphere‐ family run business with highpeople orientation and identification
COMPANY VISION‐ #1 partner of the customer‐ being leading innovator
WORK PRACTICE‐ 1‐2 projects per individual
‐ people included on demand‐ lots of iterations, models and
prototypes‐ low formalization
‐ employees freed from non‐core tasks
MEASURES‐ perception of public & press‐ awards for innovation
TRUSTto earn
TOOL AVAILABILITY depends
TYPE budget
OBJECTIVE SELECTION CRITERIA‐ visionarity, topic's business relevance
PROCESS DECISION CRITERIA‐maximum innovation, design,didactics
Comp. D
guiding/supporting 1 2 3 4 5 6 7 8 9 10 controlling
ENVIRONMENTAL PERCEPTION 'I hate it' 1 2 3 4 5 6 7 8 9 10 'I love it'
X
X

111
0
1
2
3
4
5TIM
OBJ
PRO
BUDCUL
COM
INF
Case #8COMMUNICATION PRACTICE‐ no data
DECISION INFLUENCERS‐ concerned depatrments
COMPANY CULTURE‐ consumer focus‐ family run businesswhere legacy of the founders form traditioncompany values
COMPANY VISION‐ no data
WORK PRACTICE‐ project teams
‐ highly formalizedprocess driven
practice
MEASURES‐ customer and consumer
feedback
TRUSTgranted
TOOL AVAILABILITY no data
TYPE no data
OBJECTIVE SELECTION CRITERIA‐ supreme quality‐ supreme product experience
PROCESS DECISION CRITERIA‐ no data
Comp. E
guiding/supporting 1 2 3 4 5 6 7 8 9 10 controlling
ENVIRONMENTAL PERCEPTION 'I hate it' 1 2 3 4 5 6 7 8 9 10 'I love it'
X
X
0
1
2
3
4
5TIM
OBJ
PRO
BUDCUL
COM
INF
Case #9COMMUNICATION PRACTICE‐ frequent board meetings‐ high degree of ondemand communication
‐ intense communication
DECISION INFLUENCERS‐ board of executives
COMPANY CULTURE‐ high employee orientation‐ open atmosphere‐ democratic environment‐ high orientation towardssustainability
‐ high degree of social responsibility
COMPANY VISION‐ help the country's industry to develop‐ establish lasting businesspartnerships
WORK PRACTICE ‐ further expertise consulted
on demand‐ high employee involvement in different topics and desicions
‐ intense investigation and considerationprior to consensual decision making
MEASURES‐ no data
TRUSTto earn
TOOL AVAILABILITY yes
TYPE budget
OBJECTIVE SELECTION CRITERIA‐ synergy with existing business areas‐ business potential
PROCESS DECISION CRITERIA‐ high quality
Comp. F
guiding/supporting 1 2 3 4 5 6 7 8 9 10 controlling
ENVIRONMENTAL PERCEPTION 'I hate it' 1 2 3 4 5 6 7 8 9 10 'I love it'
X
X
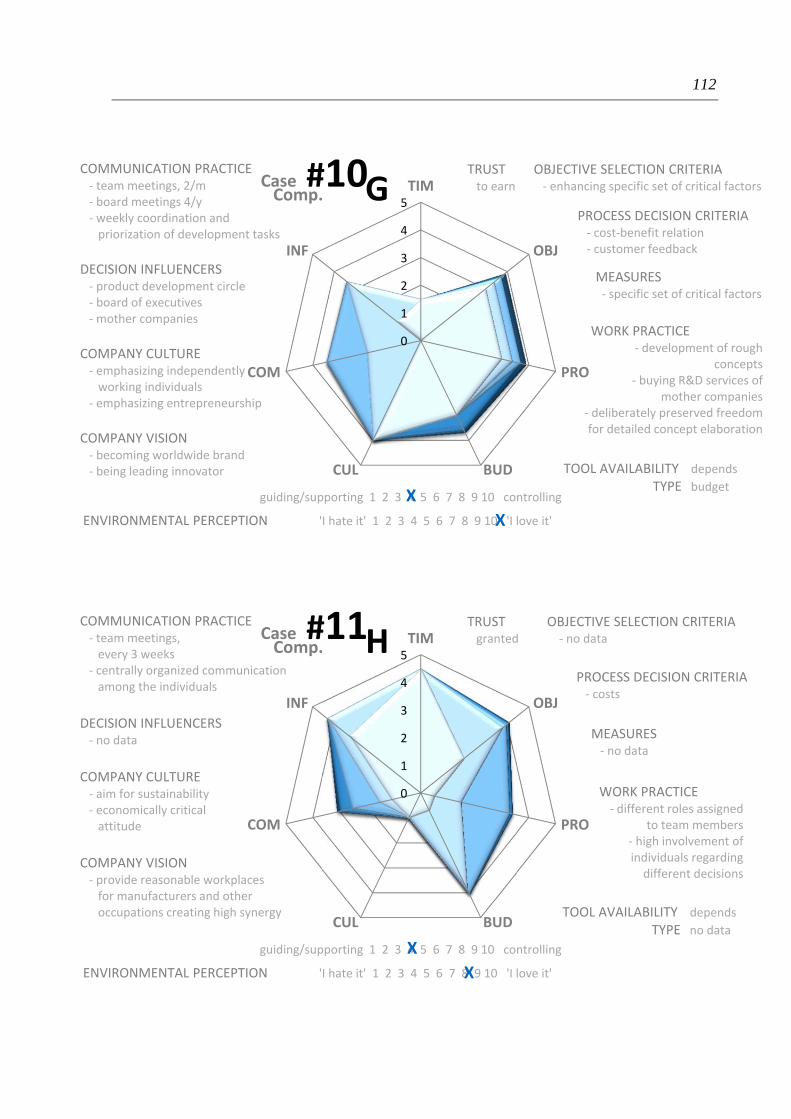
112
0
1
2
3
4
5TIM
OBJ
PRO
BUDCUL
COM
INF
Case #10COMMUNICATION PRACTICE‐ team meetings, 2/m‐ board meetings 4/y‐ weekly coordination andpriorization of development tasks
DECISION INFLUENCERS‐ product development circle‐ board of executives‐mother companies
COMPANY CULTURE‐ emphasizing independentlyworking individuals
‐ emphasizing entrepreneurship
COMPANY VISION‐ becoming worldwide brand‐ being leading innovator
WORK PRACTICE‐ development of rough
concepts‐ buying R&D services of
mother companies‐ deliberately preserved freedomfor detailed concept elaboration
MEASURES‐ specific set of critical factors
TRUSTto earn
TOOL AVAILABILITY depends
TYPE budget
OBJECTIVE SELECTION CRITERIA‐ enhancing specific set of critical factors
PROCESS DECISION CRITERIA‐ cost‐benefit relation‐ customer feedback
Comp. G
guiding/supporting 1 2 3 4 5 6 7 8 9 10 controlling
ENVIRONMENTAL PERCEPTION 'I hate it' 1 2 3 4 5 6 7 8 9 10 'I love it'
X
X
0
1
2
3
4
5TIM
OBJ
PRO
BUDCUL
COM
INF
Case #11COMMUNICATION PRACTICE‐ team meetings, every 3 weeks
‐ centrally organized communicationamong the individuals
DECISION INFLUENCERS‐ no data
COMPANY CULTURE‐ aim for sustainability‐ economically criticalattitude
COMPANY VISION‐ provide reasonable workplacesfor manufacturers and otheroccupations creating high synergy
MEASURES‐ no data
TRUSTgranted
TOOL AVAILABILITY depends
TYPE no data
OBJECTIVE SELECTION CRITERIA‐ no data
PROCESS DECISION CRITERIA‐ costs
Comp. H
guiding/supporting 1 2 3 4 5 6 7 8 9 10 controlling
ENVIRONMENTAL PERCEPTION 'I hate it' 1 2 3 4 5 6 7 8 9 10 'I love it'
X
X
WORK PRACTICE‐ different roles assigned
to team members‐ high involvement ofindividuals regardingdifferent decisions

113
0
1
2
3
4
5TIM
OBJ
PRO
BUDCUL
COM
INF
Case #12COMMUNICATION PRACTICE‐meetings‐ open forum discussions
DECISION INFLUENCERS‐ concerned depatrments
COMPANY CULTURE‐ consumer focus‐ family run businesswhere legacy of the founders form traditioncompany values
COMPANY VISION‐ no data
WORK PRACTICE‐ project teams
‐ highly formalizedprocess driven
practice
MEASURES‐ no data
TRUSTgranted
TOOL AVAILABILITY yes
TYPE no data
OBJECTIVE SELECTION CRITERIA‐ supreme quality‐ supreme product experience
PROCESS DECISION CRITERIA‐ no data
Comp. E
guiding/supporting 1 2 3 4 5 6 7 8 9 10 controlling
ENVIRONMENTAL PERCEPTION 'I hate it' 1 2 3 4 5 6 7 8 9 10 'I love it'
XX