Baker Hughes Pipeline Inspection ,-1~----, complete pipeline tally including girth welds, pipe...
19
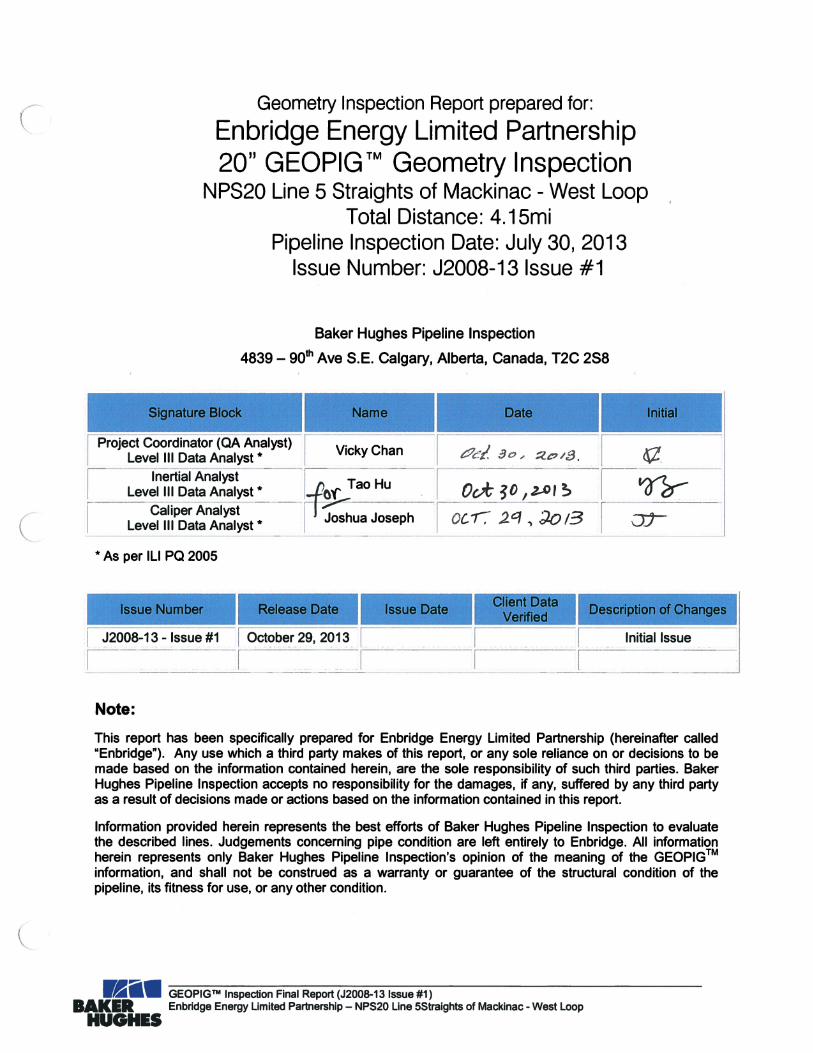
( ( Geometry Inspection Report prepared for : Enbridge Energy Limited Partnership 20" GEOPIG 1 M Geometry Inspection NPS20 Line 5 Straights of Mackinac - West Loop Total Distance: 4. 15mi Pipeline Inspection Date : July 30 , 20 13 Issue Number: J2008-13 Issue #1 Baker Hughes Pipeline Inspection 4839-90th Ave S.E. Calgary, Alberta, Canada, T2C 258 Project Coordinator (QA Analyst) V k Ch / . j level Ill Data Analyst* ,c Y an t9c:-. !Jo,. :Z.enB. I Inertial Analyst - -. ,.. ,- -, - level Ill Data Analyst* -- ;! o 'f Tao Hu I ovt D , 2,..0, ' -· ---Caliper Analyst ,- 1~ ----, level III Data Analyst * Joshua Joseph ocr: 2 '1 ., J.o 13 * As per Ill PQ 2005 - --------- - - - -- Note: This report has been specifically prepared for Enbridge Energy limited Partnership (hereinafter called "Enbridge"). Any use which a third party makes of this report, or any sole reliance on or decisions to be made based on the information contained herein, are the sole responsibility of such third parties. Baker Hughes Pipeline Inspection accepts no responsibility for the damages, if any, suffered by any third party as a result of decisions made or actions based on the information contained in this report. Information provided herein represents the best efforts of Baker Hughes Pipeline Inspection to evaluate the described lines. Judgements concerning pipe condition are left entirely to Enbridge. All information herein represents only Baker Hughes Pipeline Inspection's opinion of the meaning of the GEOPIG ™ information, and shall not be construed as a warranty or guarantee of the structural condition of the pipeline, its fitness for use, or any other condition. W&ii• GEOPIG™ Inspection Final Report (J2008-13 Issue #1) BAKER Enbridge Energy Limited Partnership - NPS20 Line 5Straights of Mackinac - West Loop HUGHES
Transcript of Baker Hughes Pipeline Inspection ,-1~----, complete pipeline tally including girth welds, pipe...
(
(
Geometry Inspection Report prepared for:
Enbridge Energy Limited Partnership 20" GEOPIG 1
M Geometry Inspection NPS20 Line 5 Straights of Mackinac - West Loop
Total Distance: 4.15mi Pipeline Inspection Date: July 30, 2013
Issue Number: J2008-13 Issue #1
Baker Hughes Pipeline Inspection
4839-90th Ave S.E. Calgary, Alberta, Canada, T2C 258
Project Coordinator (QA Analyst) V k Ch / . j level Ill Data Analyst* ,c Y an t9c:-. !Jo,. :Z.enB .
I Inertial Analyst - -.,.., - - , -level Ill Data Analyst* -- ;!o'f Tao Hu I ovt ~ D , 2,..0, ~
'
-·---Caliper Analyst ,-1~----, level III Data Analyst * Joshua Joseph ocr: 2 '1 ., J.o 13
* As per Ill PQ 2005
- --------- - - - --
Note:
This report has been specifically prepared for Enbridge Energy limited Partnership (hereinafter called "Enbridge"). Any use which a third party makes of this report, or any sole reliance on or decisions to be made based on the information contained herein, are the sole responsibility of such third parties. Baker Hughes Pipeline Inspection accepts no responsibility for the damages, if any, suffered by any third party as a result of decisions made or actions based on the information contained in this report.
Information provided herein represents the best efforts of Baker Hughes Pipeline Inspection to evaluate the described lines. Judgements concerning pipe condition are left entirely to Enbridge. All information herein represents only Baker Hughes Pipeline Inspection's opinion of the meaning of the GEOPIG ™ information, and shall not be construed as a warranty or guarantee of the structural condition of the pipeline, its fitness for use, or any other condition.
W&ii• GEOPIG™ Inspection Final Report (J2008-13 Issue #1) BAKER Enbridge Energy Limited Partnership - NPS20 Line 5Straights of Mackinac - West Loop
HUGHES

GEOPIG™ Inspection Final Report (J2008-13 Issue #1) Enbridge Energy Limited Partnership – NPS20 Line 5 Straights of Mackinac - West Loop
TABLE OF CONTENTS
1 EXECUTIVE SUMMARY 1
2 INSPECTION SUMMARY 2
2.1 Operational Details 2
2.2 Reporting threshold 2
3 SURVEY RESULTS 3
3.1 Chainage 3
3.2 GPS Tie Points 3
3.3 Pipe Anomalies 3
3.4 Bends 4
3.5 Pipeline Movements 4
3.6 Pipe Tally 4
3.7 Plan and Profile 4
4 GEOPIG DESCRIPTION 5
4.1 System Description 5
4.2 Strapdown Inertial Navigation System 5
4.3 Caliper 5
4.4 Other Sensors and Components 6
4.5 Survey Accuracy Specifications 6
5 DATA ANALYSIS PROCEDURES 7
5.1 Chainage 7 5.1.1 Slack Chainage 7 5.1.2 Absolute Chainage 7 5.1.3 Horizontal Chainage 7 5.1.4 Client Chainage 8
5.2 Pipeline Position 8 5.2.1 Tie Points 8 5.2.2 Pipeline Movement 8
5.3 Bending Strain 9 5.3.1 Computation Method 9 5.3.2 Smoothing Curvature Data 11 5.3.3 Interpretation of Bending Strain Data 11
5.4 Pipewall Anomaly Calculation 12
6 BHI SOFTWARE INSTALLATION 13

GEOPIG™ Inspection Final Report (J2008-13 Issue #1) Enbridge Energy Limited Partnership – NPS20 Line 5 Straights of Mackinac - West Loop
APPENDICES Appendix 1. GPS Reference Points Appendix 2. Pipewall Anomaly Listing Appendix 3. Internal Diameter Restriction Listing Appendix 4. Pipeline Movement Listing Appendix 5. Bend Listing (Angle ≥ 5º) Appendix 6. Wall Thickness Transitions Appendix 7. Valves and Tees Appendix 8. Sample BHI – Enbridge Chainage Correlation Listing Appendix 9. Sample Pipe Tally Listing Appendix 10. Pipewall Anomaly Inspection Sheets Appendix 11. Plots of Areas of Pipeline Movement Appendix 12. Plots of Pipeline Plan, Profile, Internal Diameter and Features Appendix 13. Enbridge ILI Reporting Profile Standard
Page 1
GEOPIG™ Inspection Final Report (J2008-13 Issue #1) Enbridge Energy Limited Partnership – NPS20 Line 5 Straights of Mackinac - West Loop
1 EXECUTIVE SUMMARY Baker Hughes Pipeline Inspection has successfully completed an Inertial Geometry survey of Enbridge’s 4.15mi NPS20 Oil pipeline, running from St. Ignace to Mackinaw. The successful run was performed on July 30, 2013. The purpose of the inspection was to determine pipeline geometry, which includes plan, profile, bends, weld tally, and pipe wall deformations.
The analysis of the caliper data has identified no dents greater than 2% O.D., and 2 ovalities greater than 5% O.D. No dents were found greater than 1% O.D., which met the criteria of “Dents in Close Proximity” or “Multiple Apex”. The largest anomaly is a 1.750in (8.75 % OD) ovality located at absolute chainage 15,478.71ft. The complete anomaly listing is included in Appendix 2.
11 internal diameter restrictions, where the I.D. was less than 90% O.D., were identified during the caliper analysis. The largest minimum I.D. reached 17.35in (86.76%) and was located at absolute chainage 15,478.82ft on an ovality. The internal diameter restriction listing is included in Appendix 3.
The analysis of the inertial data has identified 25 bends with an angle larger than 1.5° and a radius of curvature less than 100D. No bends are tighter than 5D. The bends with are listed in Appendix 5. GPS coordinates for the receive valve were provided by Enbridge. This information was integrated with the pipe centerline coordinates obtained from the inertial survey, providing a means for locating pipeline anomalies and a foundation for a Geographic Information System (GIS). A listing of the UTM coordinates based on the WSG84 datum appears in Appendix 1. 1 area of pipe replacement since the 2005 survey has been identified spanning the first 209.08ft (up to Master GWD#200) at the launch valve. The line was analyzed for pipeline movements between the current inspection and 2005 GEOPIG™ Inspection. The reporting threshold is to report pipeline movements with differential bending strain exceeding 0.1%. No areas of pipeline movement, except the rerouted section, meeting the reporting threshold were identified in this line. It is listed in Appendix 4. One copy of the survey data and the BHI software for viewing is stored on the enclosed DVD. The complete pipeline tally including girth welds, pipe fittings, wall thickness transitions, bends and anomalies can be displayed in BHI’s software together with the caliper and inertial data. This information is also available in the Microsoft Excel file “BHI 2013 GEOPIG Survey NPS20 Straights of Mackinac - West Loop.xls”, which is located in the directory “\BHI\ NPS20_Line5_StIgnace-Mackinaw-West_Loop\2013_GEOPIG\_FINAL REPORT Issue #1” on the DVD. Also included on the DVD-ROM is the pipe tally provided in “comma delimited file” (csv) format for ISAS GIS System.
A hard copy of Enbridge ILI Reporting Profile Standard is included in Appendix 13.
Page 2
GEOPIG™ Inspection Final Report (J2008-13 Issue #1) Enbridge Energy Limited Partnership – NPS20 Line 5 Straights of Mackinac - West Loop
2 Inspection Summary
2.1 Operational Details
Baker Hughes Pipeline Inspections has mobilized equipment and a qualified crew to perform in-line inspections of the following system:
BHI Job Number J2008-13
Pipeline Operator Enbridge Energy Limited Partnership
Segment Name Line 5 Straights of Mackinac - West Loop
Launch Site 907 Boulevard Drive, St. Ignace, Michigan 49781
Receive Site 580 Wilderness Park Drive, Mackinaw City, Michigan 49701
Section Age/Date Constructed 1953
Pipeline Nominal Diameter 20’’
Product Oil
Section Length 4.15mi
Date of GEOPIG™ Inspection July 30, 2013
Duration of GEOPIG™ Inspection 31 minutes
Field Project Manager Blaine Titterington Table 1. Operational Details
After passing all of the Baker Hughes pre-run inspection procedures, the GEOPIG™ was launched at 17:14 on July 30, 2013. The tool entered the receive trap at 17:45 the same day. The GEOPIG™ emerged relatively clean with no visible mechanical damage.
2.2 Reporting threshold
The reporting criterion is to report the anomalies greater than 2% of the nominal O.D. of the pipeline, the ovalities greater than 5% of the nominal O.D. of the pipeline and all dents including those greater than or equal to 1% O.D. in depth, which meet the criteria of “Dents in Close Proximity” or “Multiple Apex”. In addition, areas with either vertical or horizontal bending strain difference exceeding 0.1% with pipeline movement and spanning more than 1 pipe joint are included in this report. The anomaly size definition varies by feature type and is provided in Section 5.4.
Page 3
GEOPIG™ Inspection Final Report (J2008-13 Issue #1) Enbridge Energy Limited Partnership – NPS20 Line 5 Straights of Mackinac - West Loop
3 SURVEY RESULTS
The GEOPIG™ inertial survey provides pipeline plan, profile and bending strain, allowing one to locate the pipeline in the GPS mapping projection, and to detect pipeline movement between runs. The positional information is derived from the onboard strapdown inertial unit, the odometer readings and the GPS coordinates of selected tie points obtained from a GPS survey.
The caliper survey provides the information on the internal diameter and shape of the pipe, allowing for detection and measurement of pipe wall anomalies (dents, ovalities and wrinkles), wall thickness changes, valves, tees and girth welds.
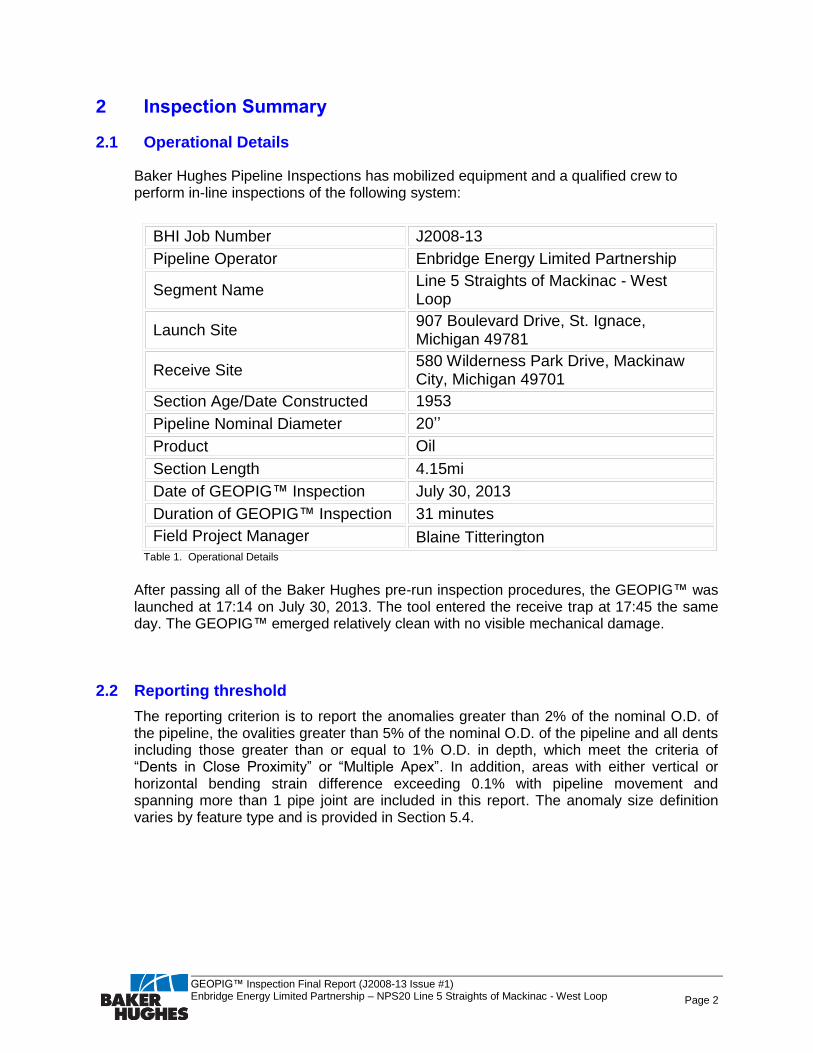
3.1 Chainage
The GEOPIG™ chainage is the distance measured by the GEOPIG's odometers along the pipeline and is denoted as SCh (slack chainage) on the plots. It starts from 76.0ft at the pig launch trap and ends at 21,888ft in the receive trap. A separate client chainage that correlates the GEOPIG™ slack chainage to the Enbridge’s As-built chainage has been created. A one-page sample of the BHI – Enbridge chainage correlation listing is included in Appendix 8. The horizontal chainage is also available, and it represents the true horizontal distance of the surveyed pipeline.
3.2 GPS Tie Points
GPS coordinates for the receive valve were provided by Enbridge. This information was integrated with the pipe centerline coordinates obtained from the inertial survey, providing a means for locating pipeline anomalies and a foundation for a Geographic Information System (GIS). A listing of the UTM coordinates based on the WSG84 datum appears in Appendix 1.
3.3 Pipe Anomalies
The caliper data was used for detecting and sizing diameter restrictions and pipe wall anomalies, such as ovalities, dents, and wrinkles. The anomaly size definition is provided in Section 5.4.
The analysis of the caliper data has identified no dents greater than 2% O.D., and 2 ovalities greater than 5% O.D. No dents were found greater than 1% O.D., which met the criteria of “Dents in Close Proximity” or “Multiple Apex”. The largest anomaly is a 1.750in (8.75 % OD) ovality located at absolute chainage 15,478.71ft. The complete anomaly listing is included in Appendix 2.
All ( ≥ 1%) ≥ 6% Top of Pipe Near GWD
0 0 0 0 2 0 0
Size (%OD) 8.75
Chainage (ft) 15,478.71
Outward
Wrinkles
Summary of Pipewall Deformations
DentsDeformations
Total Number
Largest
OvalitiesInward
Wrinkles
Page 4
GEOPIG™ Inspection Final Report (J2008-13 Issue #1) Enbridge Energy Limited Partnership – NPS20 Line 5 Straights of Mackinac - West Loop
Appendix 10 contains inspection sheets for the largest anomaly. There are three inspection sheets per anomaly: a dig sheet showing the position of the feature in a pipe joint together with the adjacent joints, a plot of pipeline plan and profile between the nearest u/s and d/s reference points, and a plot showing 3 views of the anomaly: 3-D view, pipe cross-section and diameter profile. The 3-D view scale is exaggerated 3 times. The pipe diameter profile consists of 25 lines showing the pipe internal diameter at different clock positions measured by the 25 pairs of opposing caliper arms. The clock positions of these caliper arms are colour coded according to the spectrum displayed on the left side of the plot.
11 internal diameter restrictions, where the I.D. was less than 90% O.D., were identified during the caliper analysis. The largest minimum I.D. reached 17.35in (86.76%) and was located at absolute chainage 15,478.82ft on an ovality. The internal diameter restriction listing is included in Appendix 3.
3.4 Bends
The analysis of the inertial data has identified 25 bends with an angle larger than 1.5° and a radius of curvature less than 100D. No bends are tighter than 5D. The bends with are listed in Appendix 5. Each bend is described in terms of absolute chainage, bend radius and angle, as well as change of direction in horizontal and vertical plane.
3.5 Pipeline Movements
The inertial data from the current and the 2005 GEOPIGTM surveys have been compared in order to identify areas of strain difference greater than 0.1% associated with pipeline movement. No such areas have been identified in this line. 1 area of pipeline replacement has been identified spanning 209.1ft at the launch barrel.
3.6 Pipe Tally
The pipe internal diameter measured by the calipers is used for calculation of pipe wall thickness assuming a constant pipe O.D. The list of valves and tees are included in Appendix 7.
The GEOPIG™ has also detected all the girth welds in the pipeline. They are listed in the worksheet “Weld Log”, which contains the information on the length and start chainage of each pipe joint. The weld log combined with all the other features in the pipeline (valves, tees, wall thickness transitions, anomalies and bends) are listed in the worksheet “Pipe Tally”. A one-page sample of the pipe tally listing is included in Appendix 9.
All the listings included in Appendices 1 to 8 as well as the full pipe tally are available in electronic form in the MS Excel spreadsheet “BHI GEOPIG Survey 2013 NPS20 Straights of Mackinac - West Loop.xls”.
3.7 Plan and Profile
The first plot in Appendix 12 shows the plan, profile, internal diameter and pig velocity, and valves of the entire pipeline. The remaining 8 plots show the pipeline plan, profile, internal diameter and location of selected features, such as valves, tees, anomalies, internal diameter restrictions, and wall thickness transitions at 3,000ft per page.
Page 5
GEOPIG™ Inspection Final Report (J2008-13 Issue #1) Enbridge Energy Limited Partnership – NPS20 Line 5 Straights of Mackinac - West Loop
4 GEOPIG DESCRIPTION
4.1 System Description
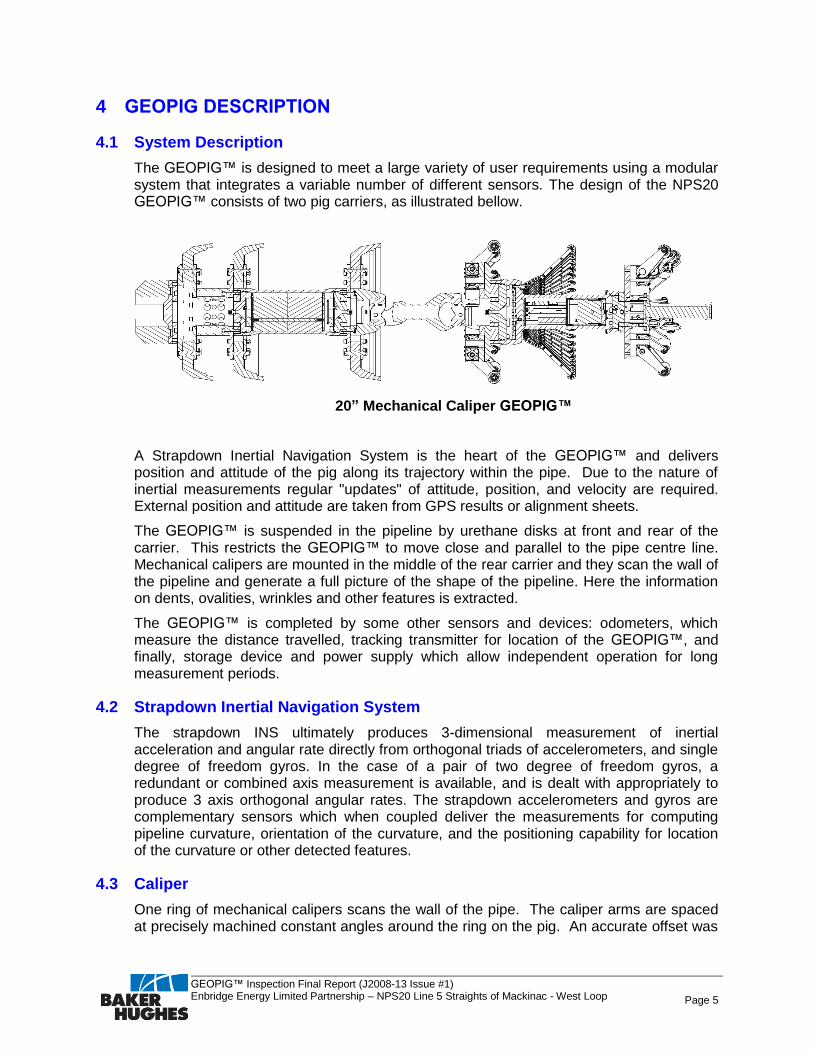
The GEOPIG™ is designed to meet a large variety of user requirements using a modular system that integrates a variable number of different sensors. The design of the NPS20 GEOPIG™ consists of two pig carriers, as illustrated bellow.
20” Mechanical Caliper GEOPIG™
A Strapdown Inertial Navigation System is the heart of the GEOPIG™ and delivers position and attitude of the pig along its trajectory within the pipe. Due to the nature of inertial measurements regular "updates" of attitude, position, and velocity are required. External position and attitude are taken from GPS results or alignment sheets.
The GEOPIG™ is suspended in the pipeline by urethane disks at front and rear of the carrier. This restricts the GEOPIG™ to move close and parallel to the pipe centre line. Mechanical calipers are mounted in the middle of the rear carrier and they scan the wall of the pipeline and generate a full picture of the shape of the pipeline. Here the information on dents, ovalities, wrinkles and other features is extracted.
The GEOPIG™ is completed by some other sensors and devices: odometers, which measure the distance travelled, tracking transmitter for location of the GEOPIG™, and finally, storage device and power supply which allow independent operation for long measurement periods.
4.2 Strapdown Inertial Navigation System
The strapdown INS ultimately produces 3-dimensional measurement of inertial acceleration and angular rate directly from orthogonal triads of accelerometers, and single degree of freedom gyros. In the case of a pair of two degree of freedom gyros, a redundant or combined axis measurement is available, and is dealt with appropriately to produce 3 axis orthogonal angular rates. The strapdown accelerometers and gyros are complementary sensors which when coupled deliver the measurements for computing pipeline curvature, orientation of the curvature, and the positioning capability for location of the curvature or other detected features.
4.3 Caliper
One ring of mechanical calipers scans the wall of the pipe. The caliper arms are spaced at precisely machined constant angles around the ring on the pig. An accurate offset was
Page 6
GEOPIG™ Inspection Final Report (J2008-13 Issue #1) Enbridge Energy Limited Partnership – NPS20 Line 5 Straights of Mackinac - West Loop
added to these ranges to give the actual distance from the centre of the carrier to the pipe wall. There are 50 mechanical caliper arms mounted in the middle of the carrier.
4.4 Other Sensors and Components
Other sensors and components integrated in the GEOPIG™ are:
Odometer wheels providing direct measurements of distance traveled (chainage). Velocity is derived from these time tagged distances.
Temperature and pressure sensors
A flash memory system
Interface electronics
Batteries
Micro-processor controllers
Power management module
Pig Tracking Module (Electromagnetic)
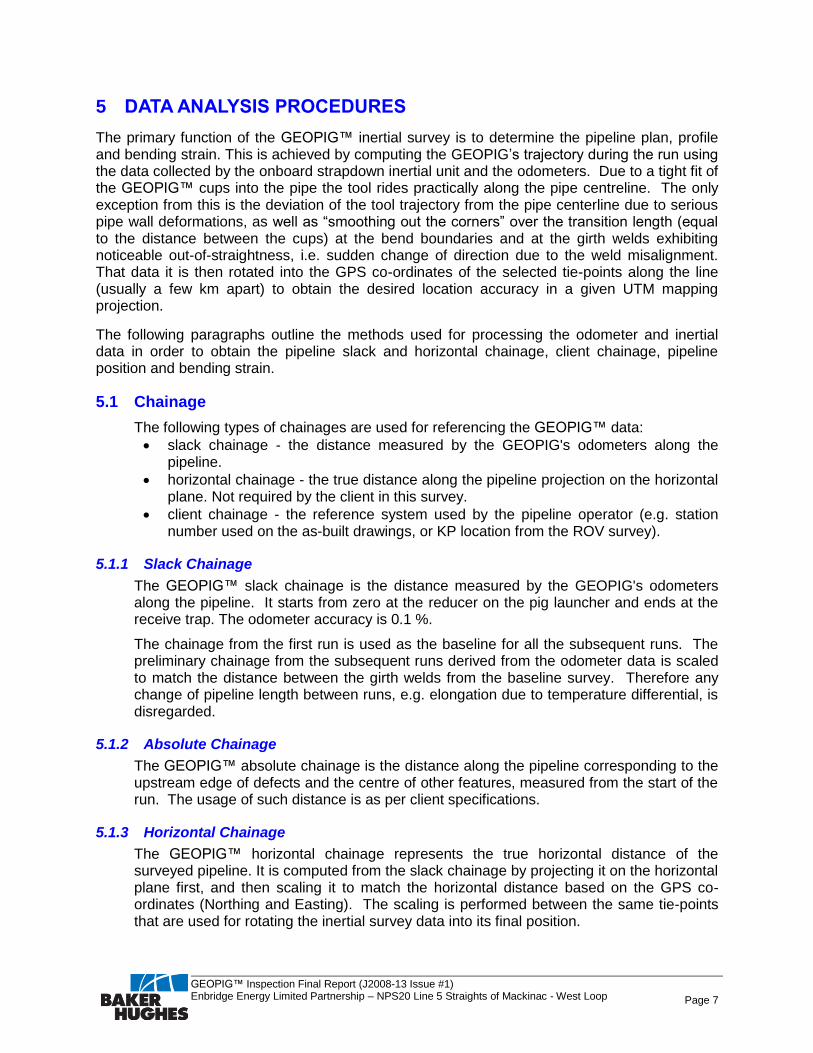
4.5 Survey Accuracy Specifications
The accuracy of the GEOPIG™ measurements are as follows:
Pipeline position 1:2,000
Bending strain +/- 0.02%
Bend angle +/- 0.1
Anomaly size +/- 0.1”
Temperature +/- 0.1 Deg C
Pressure 0.1% or +/- 3 PSI (0.2 BARSG)
Page 7
GEOPIG™ Inspection Final Report (J2008-13 Issue #1) Enbridge Energy Limited Partnership – NPS20 Line 5 Straights of Mackinac - West Loop
5 DATA ANALYSIS PROCEDURES
The primary function of the GEOPIG™ inertial survey is to determine the pipeline plan, profile and bending strain. This is achieved by computing the GEOPIG’s trajectory during the run using the data collected by the onboard strapdown inertial unit and the odometers. Due to a tight fit of the GEOPIG™ cups into the pipe the tool rides practically along the pipe centreline. The only exception from this is the deviation of the tool trajectory from the pipe centerline due to serious pipe wall deformations, as well as “smoothing out the corners” over the transition length (equal to the distance between the cups) at the bend boundaries and at the girth welds exhibiting noticeable out-of-straightness, i.e. sudden change of direction due to the weld misalignment. That data it is then rotated into the GPS co-ordinates of the selected tie-points along the line (usually a few km apart) to obtain the desired location accuracy in a given UTM mapping projection.
The following paragraphs outline the methods used for processing the odometer and inertial data in order to obtain the pipeline slack and horizontal chainage, client chainage, pipeline position and bending strain.
5.1 Chainage
The following types of chainages are used for referencing the GEOPIG™ data:
slack chainage - the distance measured by the GEOPIG's odometers along the pipeline.
horizontal chainage - the true distance along the pipeline projection on the horizontal plane. Not required by the client in this survey.
client chainage - the reference system used by the pipeline operator (e.g. station number used on the as-built drawings, or KP location from the ROV survey).
5.1.1 Slack Chainage
The GEOPIG™ slack chainage is the distance measured by the GEOPIG's odometers along the pipeline. It starts from zero at the reducer on the pig launcher and ends at the receive trap. The odometer accuracy is 0.1 %.
The chainage from the first run is used as the baseline for all the subsequent runs. The preliminary chainage from the subsequent runs derived from the odometer data is scaled to match the distance between the girth welds from the baseline survey. Therefore any change of pipeline length between runs, e.g. elongation due to temperature differential, is disregarded.
5.1.2 Absolute Chainage
The GEOPIG™ absolute chainage is the distance along the pipeline corresponding to the upstream edge of defects and the centre of other features, measured from the start of the run. The usage of such distance is as per client specifications.
5.1.3 Horizontal Chainage
The GEOPIG™ horizontal chainage represents the true horizontal distance of the surveyed pipeline. It is computed from the slack chainage by projecting it on the horizontal plane first, and then scaling it to match the horizontal distance based on the GPS co-ordinates (Northing and Easting). The scaling is performed between the same tie-points that are used for rotating the inertial survey data into its final position.
Page 8
GEOPIG™ Inspection Final Report (J2008-13 Issue #1) Enbridge Energy Limited Partnership – NPS20 Line 5 Straights of Mackinac - West Loop
5.1.4 Client Chainage
The purpose of a client chainage is to represent any one-dimensional information used by the client, which could be correlated to the slack chainage. Usually the client chainage corresponds to the chainage shown on the as-builts, or to the chainage recorded during another in-line inspection. It can be incorporated into the data at any time after the DVD is issued to the client.
5.2 Pipeline Position
The pipeline position is provided in terms of Northing, Easting and Height as a function of the chainage, in a selected mapping projection (usually UTM) and a specified datum.
5.2.1 Tie Points
Inertial data is translated, rotated and scaled to the "tie points" with known co-ordinates. Those points are typically selected at traps, valves, welds, bends, wall thickness transitions, or any other pipeline features that can be detected directly or indirectly by the GEOPIG™ sensors. The co-ordinates of those points are usually obtained from GPS survey.
This procedure provides correction for long term drifts that can introduce an absolute position error in the inertial survey over time. By transforming the GEOPIG™ trajectory into the tie points, the Northing, Easting, and Height are obtained for any point along the pipe.
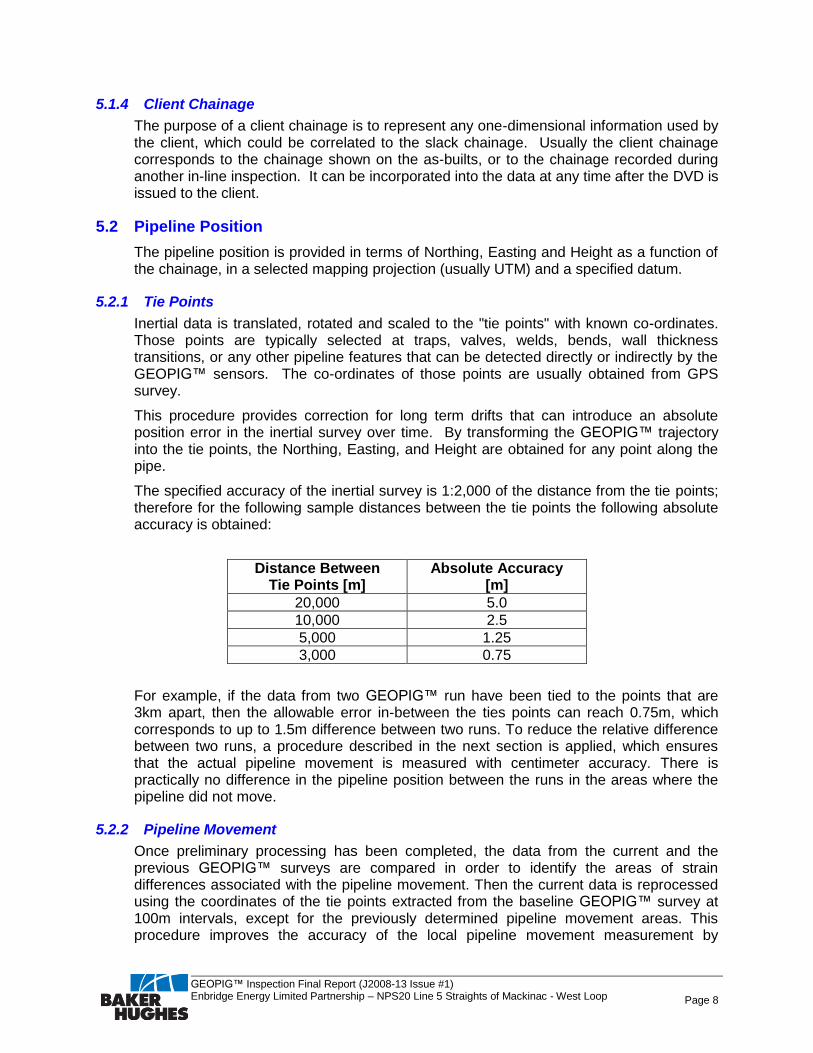
The specified accuracy of the inertial survey is 1:2,000 of the distance from the tie points; therefore for the following sample distances between the tie points the following absolute accuracy is obtained:
Distance Between
Tie Points [m] Absolute Accuracy
[m]
20,000 5.0
10,000 2.5
5,000 1.25
3,000 0.75
For example, if the data from two GEOPIG™ run have been tied to the points that are 3km apart, then the allowable error in-between the ties points can reach 0.75m, which corresponds to up to 1.5m difference between two runs. To reduce the relative difference between two runs, a procedure described in the next section is applied, which ensures that the actual pipeline movement is measured with centimeter accuracy. There is practically no difference in the pipeline position between the runs in the areas where the pipeline did not move.
5.2.2 Pipeline Movement
Once preliminary processing has been completed, the data from the current and the previous GEOPIG™ surveys are compared in order to identify the areas of strain differences associated with the pipeline movement. Then the current data is reprocessed using the coordinates of the tie points extracted from the baseline GEOPIG™ survey at 100m intervals, except for the previously determined pipeline movement areas. This procedure improves the accuracy of the local pipeline movement measurement by
Page 9
GEOPIG™ Inspection Final Report (J2008-13 Issue #1) Enbridge Energy Limited Partnership – NPS20 Line 5 Straights of Mackinac - West Loop
reducing the relative error between two runs. A noticeable error would result from the absolute position accumulation error when only the original tie points (from the GPS survey, at about 1km spacing) were used for scaling and rotating the inertial survey data.
5.3 Bending Strain
The bending strain is computed directly from the curvature of the GEOPIG™ trajectory, typically averaged over the distance of three pipe diameters. The specification for the bending strain measurements from the GEOPIG™ survey is +/- 0.02% strain. When the strain difference between two runs is compared that specification is usually exceeded in the originally straight sections of the line, and the accuracy of +/- 0.005% strain is achieved. The following subsections contain the description of the bending strain measurement and general remarks on interpretation of strain data.
5.3.1 Computation Method
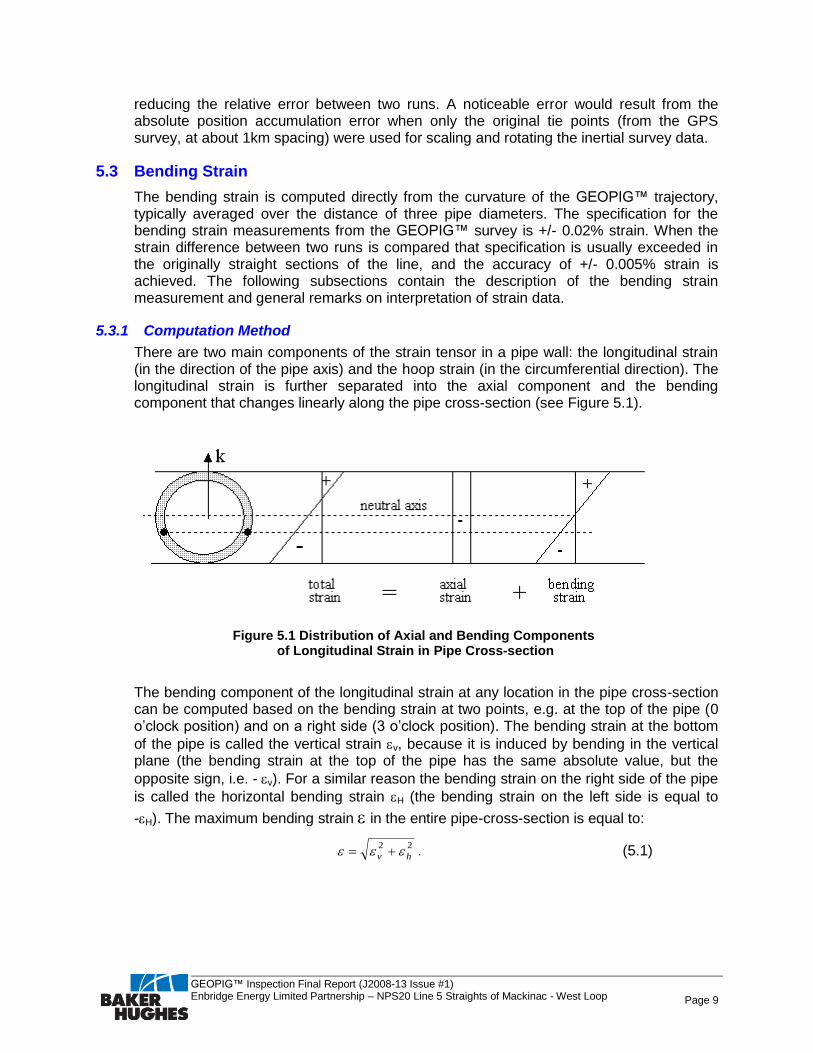
There are two main components of the strain tensor in a pipe wall: the longitudinal strain (in the direction of the pipe axis) and the hoop strain (in the circumferential direction). The longitudinal strain is further separated into the axial component and the bending component that changes linearly along the pipe cross-section (see Figure 5.1).
Figure 5.1 Distribution of Axial and Bending Components of Longitudinal Strain in Pipe Cross-section
The bending component of the longitudinal strain at any location in the pipe cross-section can be computed based on the bending strain at two points, e.g. at the top of the pipe (0 o’clock position) and on a right side (3 o’clock position). The bending strain at the bottom
of the pipe is called the vertical strain v, because it is induced by bending in the vertical plane (the bending strain at the top of the pipe has the same absolute value, but the
opposite sign, i.e. -v). For a similar reason the bending strain on the right side of the pipe
is called the horizontal bending strain H (the bending strain on the left side is equal to
-H). The maximum bending strain in the entire pipe-cross-section is equal to:
22
hv . (5.1)
Page 10
GEOPIG™ Inspection Final Report (J2008-13 Issue #1) Enbridge Energy Limited Partnership – NPS20 Line 5 Straights of Mackinac - West Loop
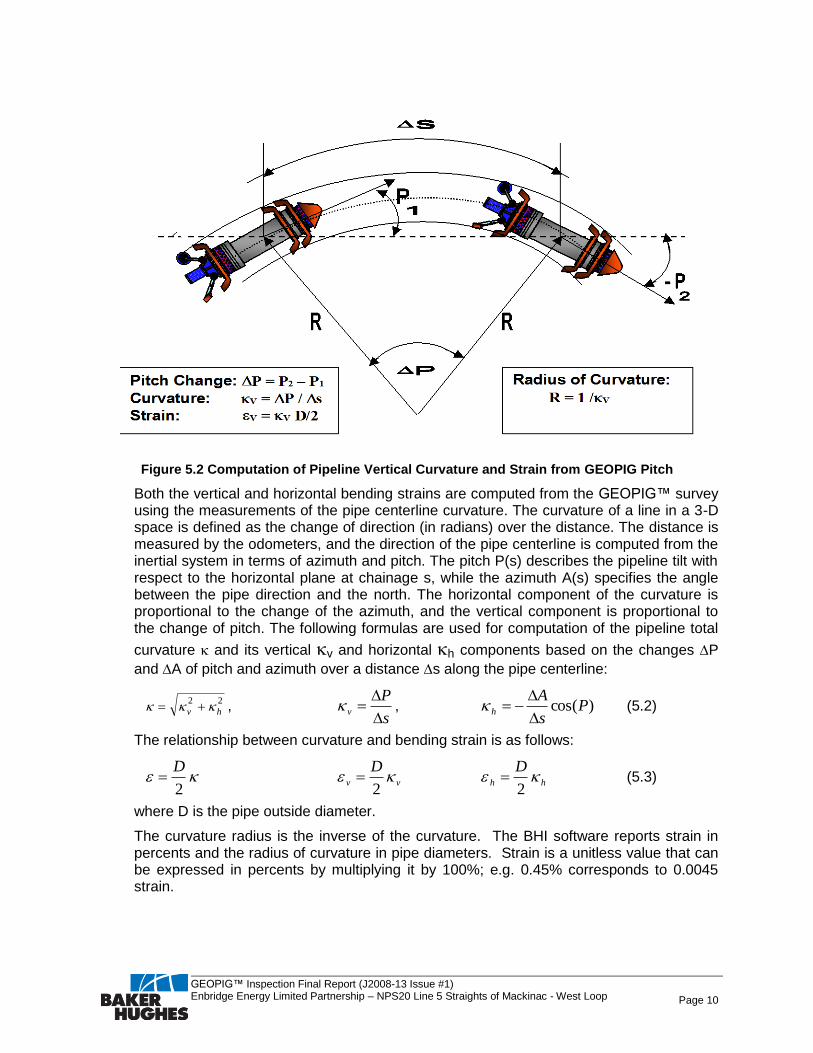
Figure 5.2 Computation of Pipeline Vertical Curvature and Strain from GEOPIG Pitch
Both the vertical and horizontal bending strains are computed from the GEOPIG™ survey using the measurements of the pipe centerline curvature. The curvature of a line in a 3-D space is defined as the change of direction (in radians) over the distance. The distance is measured by the odometers, and the direction of the pipe centerline is computed from the inertial system in terms of azimuth and pitch. The pitch P(s) describes the pipeline tilt with respect to the horizontal plane at chainage s, while the azimuth A(s) specifies the angle between the pipe direction and the north. The horizontal component of the curvature is proportional to the change of the azimuth, and the vertical component is proportional to the change of pitch. The following formulas are used for computation of the pipeline total
curvature and its vertical v and horizontal h components based on the changes P
and A of pitch and azimuth over a distance s along the pipe centerline:
22
hv , s
Pv
, )cos(P
s
Ah
(5.2)
The relationship between curvature and bending strain is as follows:
2
D vv
D
2 hh
D
2 (5.3)
where D is the pipe outside diameter.
The curvature radius is the inverse of the curvature. The BHI software reports strain in percents and the radius of curvature in pipe diameters. Strain is a unitless value that can be expressed in percents by multiplying it by 100%; e.g. 0.45% corresponds to 0.0045 strain.
Page 11
GEOPIG™ Inspection Final Report (J2008-13 Issue #1) Enbridge Energy Limited Partnership – NPS20 Line 5 Straights of Mackinac - West Loop
5.3.2 Smoothing Curvature Data
The curvature can be computed according to formula (5.2) using the change of azimuth or pitch over the chainage increment as small as the distance between two inertial samples. The inertial data is collected at the rate of 100 samples per second. If the tool travels at the speed of 2 m/s then the distance between two samples is only 2 cm. The raw curvature computed this way would exhibit a significant level of noise, e.g. due to tool vibrations. In order to reduce that noise the curvature is typically averaged over a distance of 3 – 5 pipe diameters, i.e. 2-3m for 16” diameter pipe. For computational efficiency, instead of calculating the actual average, the curvature is computed using formula (5.2),
where the increments P and A of pitch and azimuth are taken over a distance of 2m. This is practically equivalent to averaging curvature over the same distance - if the data are equally spaced, i.e. when the tool velocity is stable. The longer is the averaging length the smoother are the results.
Another smoothing technique is a regression line fit to the pitch or azimuth considered as functions of chainage. That method fits a line to all of the pitch values (or azimuth) over a specified length. This is practically equivalent to fitting a circle to all of the points along the GEOPIG™ trajectory over the specified length, but again much more computationally efficient than actually doing it. The radius of that circle is equal to the radius of curvature of the pipeline. The regression line fit produces smoother results than a regular moving average applied over the same length.
When estimating the bending strain induced by pipe-soil interaction, the curvature can be smoothed out over a length longer than 5 pipe diameters, usually over 5 - 10m. This approach significantly reduces the effect of weld misalignment, pipe wall imperfections and tool dynamics on the computed curvature, and at the same time it doesn’t underestimate the bending strain induced by pipeline movement. This approach is particularly suited for calculation of strain difference between two runs. However, averaging over too long distance is not proper for computation of curvature of short features, such as bends or buckles. The bending strain of a feature would be underestimated if the feature was shorter than the effective averaging distance, which includes both the length used in curvature computation and the tool length, i.e. the distance between the cups supporting the pig body (i.e. the inertial canister in case of multi-body tools).
5.3.3 Interpretation of Bending Strain Data
The GEOPIG™ measures the total pipeline bending strain at the time of inspection, which includes strain induced during manufacturing, construction and operation. While pipeline is in operation the strain may be caused by the operating conditions (temperature and pressure differential) or by the external forces affecting the pipeline as the results of sea-bottom scouring, sub-sea currents, slope instability, soil settlement and erosion, etc. As the GEOPIG™ measures the total bending strain, including the plastic component induced during the whole history of loading, the current shape of the pipe and its bending strain cannot be fully explained by taking into consideration only the forces acting on the pipe during the inspection, e.g. the gravity, buoyancy and support reaction.
The GEOPIG™ measures the curvature of the pipe centerline with all its imperfections, including the out-of-straightness at welds that is theoretically described by infinite curvature, although it does not correspond to any bending strain in the pipe wall. When such curvature is measured by the GEOPIG™ is obviously not infinite due to the finite length of the tool and some additional smoothing applied during data processing, but it may still show up as spikes of significant amplitude in the curvature data.
Page 12
GEOPIG™ Inspection Final Report (J2008-13 Issue #1) Enbridge Energy Limited Partnership – NPS20 Line 5 Straights of Mackinac - West Loop
When analyzing the bending strain induced during operation the high residual plastic strain present in the field bends should be disregarded. The main features distinguishing the bending strain induced during operation from the field bends are briefly discussed below. The bending strain in the field bends is usually in the range from 1 to 2% strain and is confined to one pipe joint and is characterized by an abrupt change of strain at the beginning and the end of a bend. The bending strain induced during operation is usually of smaller amplitude, spans more than one pipe joint and undergoes gradual change over longer transition sections.
5.4 Pipewall Anomaly Calculation
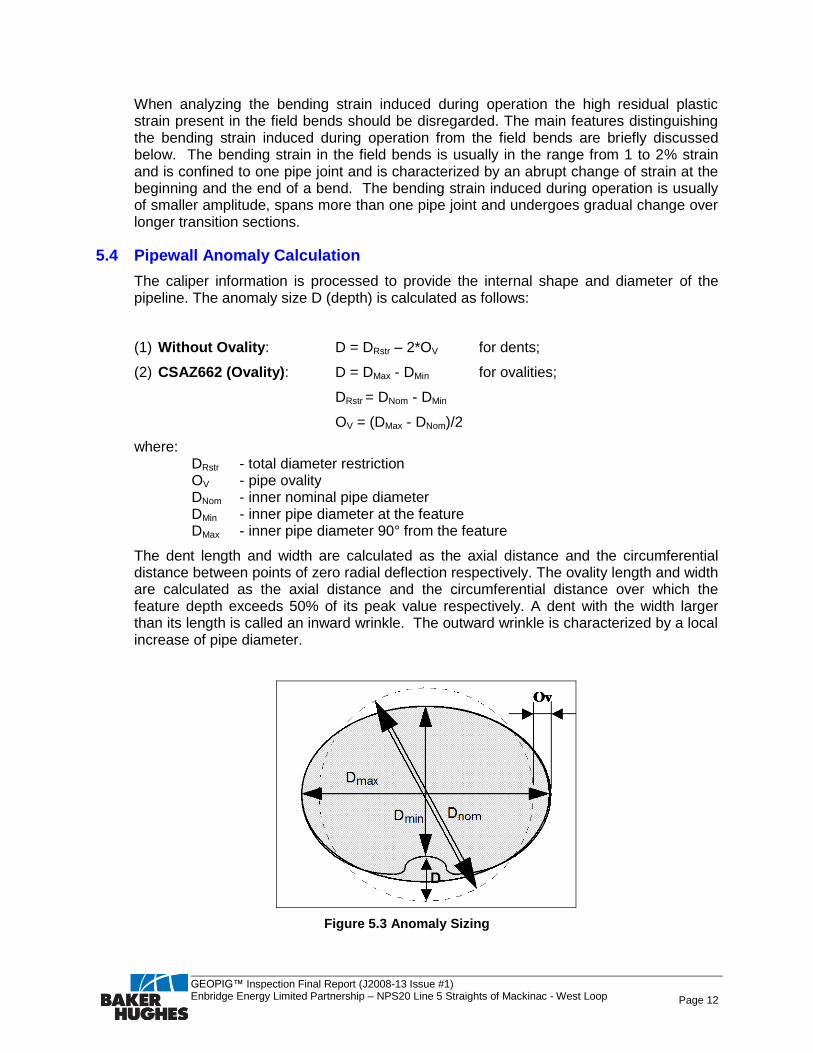
The caliper information is processed to provide the internal shape and diameter of the pipeline. The anomaly size D (depth) is calculated as follows:
(1) Without Ovality: D = DRstr – 2*OV for dents;
(2) CSAZ662 (Ovality): D = DMax - DMin for ovalities;
DRstr = DNom - DMin
OV = (DMax - DNom)/2
where: DRstr - total diameter restriction OV - pipe ovality DNom - inner nominal pipe diameter DMin - inner pipe diameter at the feature DMax - inner pipe diameter 90° from the feature
The dent length and width are calculated as the axial distance and the circumferential distance between points of zero radial deflection respectively. The ovality length and width are calculated as the axial distance and the circumferential distance over which the feature depth exceeds 50% of its peak value respectively. A dent with the width larger than its length is called an inward wrinkle. The outward wrinkle is characterized by a local increase of pipe diameter.
Figure 5.3 Anomaly Sizing
Page 13
GEOPIG™ Inspection Final Report (J2008-13 Issue #1) Enbridge Energy Limited Partnership – NPS20 Line 5 Straights of Mackinac - West Loop
6 BHI Software Installation
The report is accompanied by a DVD-ROM containing the BHI display software and the data from the present survey. The data can be viewed using the GeminiView and GeoDisplay programs running in Microsoft Windows operating system. GeminiView is used to display the 3-D view of the pipe and the inner pipe wall shape measured by the calipers. GeoDisplay is used for displaying the inertial, odometer, weld, caliper, and other data bases (if available).
The directory structure on the DVD is as follows:
\BHI\NPS20_Line5_StIgnace-Mackinaw-West_Loop\2013_GEOPIG, which contains:
several subdirectories with the GEOPIG™ data from the run
environment file 2013_GEOPIG_NPS20_St_Ignace-Mackinaw-West_Loop_Issue1.env with the information on the location of the data files from the run. (%RootDir% specifies the path, and %BaseName% - the name)
configuration file GD.cfg for Geodisplay
\BHI\BHI_Software with the software stored on two subdirectories: \GeminiView with the GeminiView program (GEMINIVIEW.EXE) \GD with the GeoDisplay program (GDWIN.EXE)
The entire content of the DVD can be copied to a network drive, or a local hard drive for faster access of the data and the ability to save configurations files with customized displays. The programs can be also stored on the local hard drive while the data is accessed from the DVD or a network drive. In this case only the \BHI_Software subdirectory needs to be copied on the local hard drive.
Geminiview:
To setup the GeminiView program for the first time on a computer:
- Run the setup.exe program in the BHI\BHI_Software\GeminiView directory.
To launch the GeminiView program:
- Double click Geminiview_3.17.0.0.exe
Jobs can then be loaded using the File Open menu
GeoDisplay:
The simplest way to launch GeoDisplay from the DVD is to double click on the application program (GDWIN.EXE) using Windows Explorer.
The recommended way to launch GeoDisplay is to copy the “Geodisplay 2013 GEOPIG NPS20_Line5_StIgnace-Mackinaw-West_Loop” icon onto the computer desktop using the procedure outlined below. It is assumed that the subdirectory \BHI\BHI_Software is stored on the C: drive, and the data directory \BHI\NPS20_Line5_StIgnace-Mackinaw-West_Loop is on the D: drive. However, the proper drive letters for the DVD, network or hard drive corresponding to the actual location of those directories have to be used.
1) Go to directory C:\BHI\BHI_Software\GD using the Windows Explorer and drag the shortcut icon “Geodisplay NPS20_Line5_StIgnace-Mackinaw-West_Loop (with the blue and white BHI logo) to the desktop.
2) Right click on this new icon and left click on “Properties”.

Page 14
GEOPIG™ Inspection Final Report (J2008-13 Issue #1) Enbridge Energy Limited Partnership – NPS20 Line 5 Straights of Mackinac - West Loop
3) Click on the “Shortcut” tab and make sure the “Target” and “Start in” are set to C:\BHI\BHI_Software\GD\GDWIN.exe and D: \BHI\NPS20_Line5_StIgnace-Mackinaw-West_Loop respectively.
4) Click on the “General” tab and uncheck the “Read-only” box.
5) To start the program, double click on the icon.
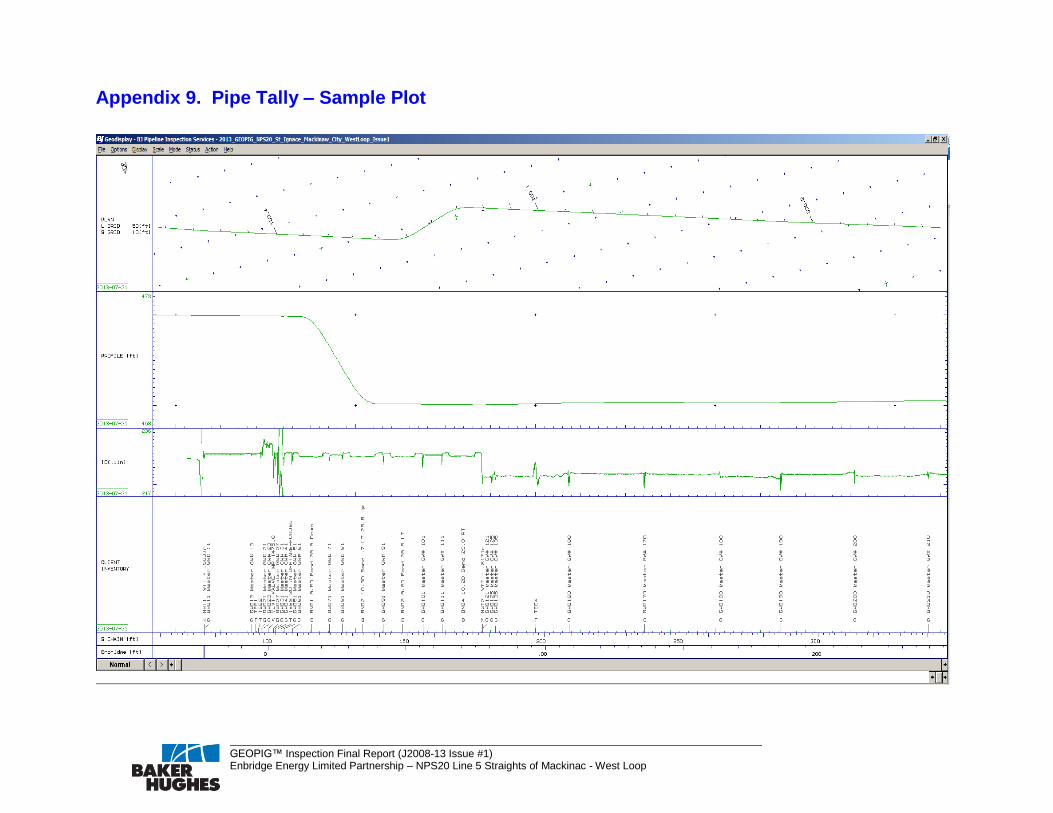
Appendix 9. Pipe Tally – Sample Plot
GEOPIG™ Inspection Final Report (J2008-13 Issue #1)
Enbridge Energy Limited Partnership – NPS20 Line 5 Straights of Mackinac - West Loop

Appendix 12. Plots of Pipeline Plan, Profile, Internal Diameter and
Features
GEOPIG™ Inspection Final Report (J2008-13 Issue #1) Enbridge Energy Limited Partnership – NPS20 Line 5 Straights of Mackinac - West Loop