Bajaj finserv Working capital case study ppt
27
Case Study on – BAJAJ ALLIANZ Presented By- Jahanvi Pandya - 93 Shekhar Parab -94 Harshal Pedamkar-95 Suvarna Phad - 96
-
Upload
harshal-pedamkar -
Category
Business
-
view
172 -
download
2
Transcript of Bajaj finserv Working capital case study ppt

Case Study on – BAJAJ ALLIANZ
Presented By-Jahanvi Pandya - 93Shekhar Parab -94Harshal Pedamkar-95Suvarna Phad - 96

Introduction Working Capital is the required for maintenance of
day to day business operations. The present day competitive market environment calls for an efficient management of working capital
The goal of working capital management is to ensure that the firm is able to continue its operations and that it has sufficient cash flow to satisfy both maturing short-term debt and upcoming operational expenses.

Working capitalIntroduction
Working capital typically means the firm’s holding ofcurrent or short-term assets such as cash, receivables,inventory and marketable securities.
These items are also referred to as circulating capital.
Corporate executives devote a considerable amount ofattention to the management of working capital.

Concept of working capital
There are two possible interpretations ofworking capital concept:
1) Gross working Capital
2) Net Working Capital

Gross Working Capital:-
The gross capital working capital focuses on two aspects of current assets management:
Optimum investment in current assets
Financing of current assets
Net Working Capital:-
Net working capital comprises short term net assets: stock, debtors and cash less creditors.
Net working capital represents the excess of total current assets over total current liabilities.

Objective of Working capital:-
Meet day to day cash flow needs.
Pay wages and salaries when they fall due.
Pay creditors to ensure continued suppliers of goods and services.
Pay government taxation and providers of cash dividends.
Ensure the long term survival of the business entity.

Components of Working CapitalThe working capital cycle is made up of four core components:
Cash & Cash equivalent.
Creditors/accounts payable.
Inventory/stock in hand.
Debtors/accounts receivables.

IMPORTANCE OF WORKING CAPITAL
Growth and Expansion Activities
Operating Efficiency
Price Level Changes
Other Factors

APPROACHES TO MANAGING WORKING CAPITAL
Two approaches are generally followed for the management of working capital,
(i) conventional approach
(ii) operating cycle approach

Site Information and Mobilization Expenses
Raw Materials, Components, Stores etc.
Work-InProcess
AccountsPayable Wages, Salaries and
Construction Costs
Cash
Marketing Costs, GeneralAdministration & Financial Costs
Transfer ofProperty in
Goods
Sundry Debtors OR AccountsReceivable
Mobilization Advance fromClient
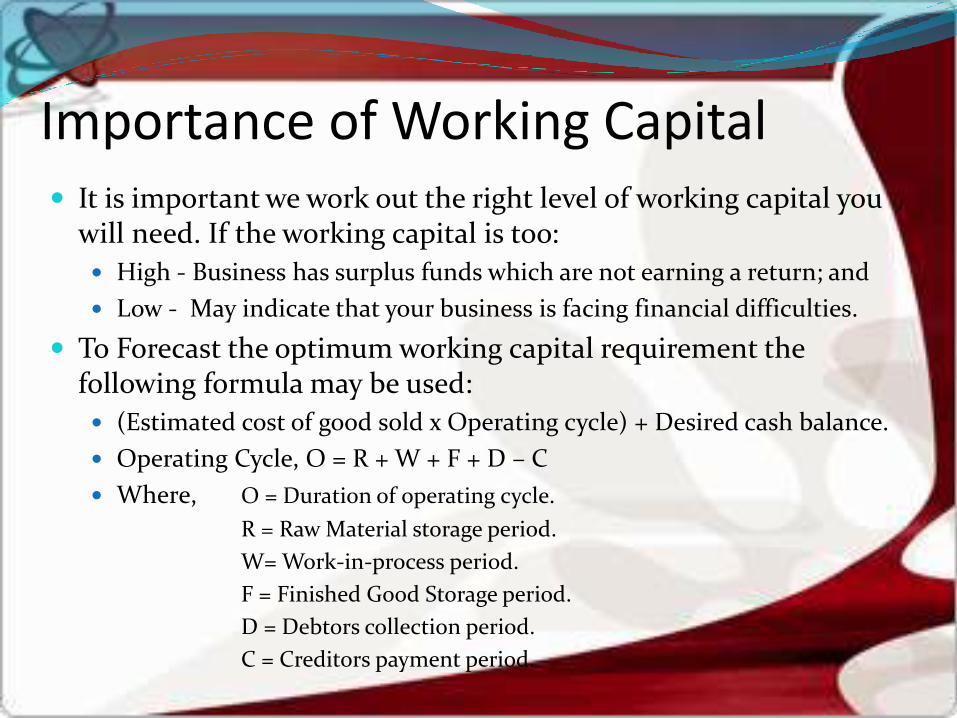
Importance of Working Capital It is important we work out the right level of working capital you
will need. If the working capital is too:
High - Business has surplus funds which are not earning a return; and
Low - May indicate that your business is facing financial difficulties.
To Forecast the optimum working capital requirement the following formula may be used:
(Estimated cost of good sold x Operating cycle) + Desired cash balance.
Operating Cycle, O = R + W + F + D – C
Where, O = Duration of operating cycle.
R = Raw Material storage period.
W= Work-in-process period.
F = Finished Good Storage period.
D = Debtors collection period.
C = Creditors payment period.

BAJAJ ALLIANZ Bajaj Allianz Life Insurance is a union between Allianz SE, one of
the largest Insurance Company and Bajaj Finserv.
Allianz SE is a leading insurance conglomerate globally and one of the largest asset managers in the world, managing assets worth over a Trillion (Over INR. 55,00,000Crores). Allianz SE has over 119 years of financial experience and is present in over 70 countries around the world.
At Bajaj Allianz Life Insurance, customer delight is our guiding principle. Our business philosophy is to ensure excellent insurance and investment solutions by offering customized products, supported by the best technology.

Components of current assets:Current assets refer those assets that are cash or can be converted into cash
within a year.
1)The composition of current assets or the main components of current assets at BALIC are cash and bank balance, loan and advances and government securities
2) Miscellaneous current assets are also a component of current assets. Prepaid expenses, outstanding income like interest receivable and other current assets are also included in miscellaneous current assets

The following table shows the amount of cash and bank balance, money at call or short notice, loan and advanced government securities and other current assets of Bajaj Allianz Life Insurance Company Pvt. Ltd.
Source:- Annual Report of BALIC From 2008/09 to 2012/13
Fiscal Year Sundry
Debtors
Cash and Bank
balance
Loan and
advance
Other C.A Total
2008/09 639,948 3,515,993 76,970 1,148,475 5,381,386
2009/10 1,089,070 2,186,908 130,275 2,022,560 5,298,538
2010/11 1,341,359 4,285,098 147,078 2,344,020 8,217,555
2011/12 1,223,706 4,520,165 170,660 3,832,457 9,746,988
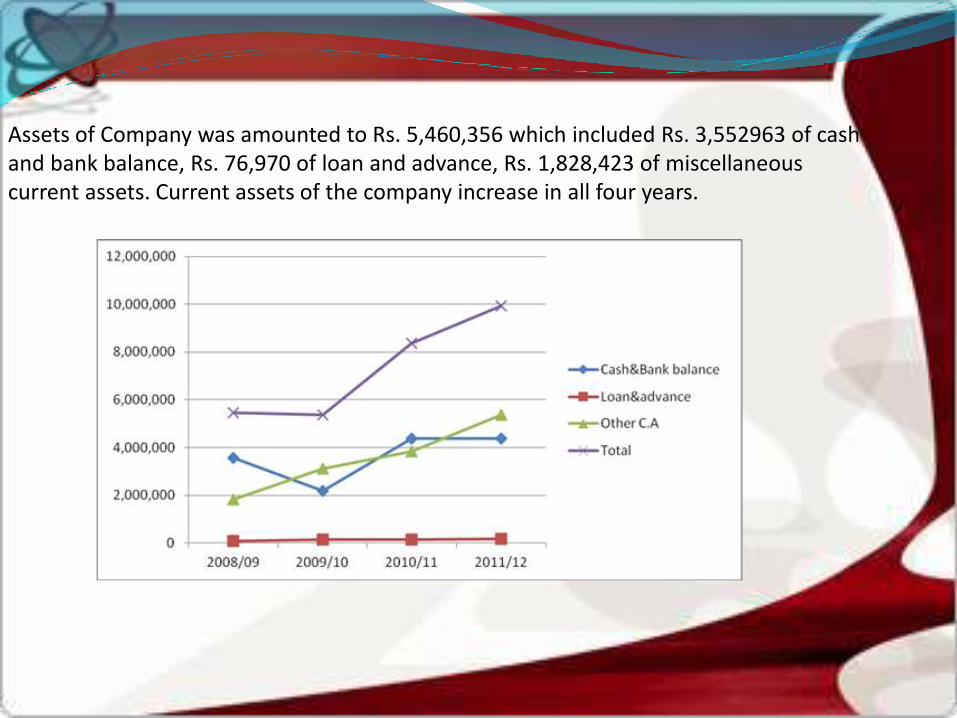
Assets of Company was amounted to Rs. 5,460,356 which included Rs. 3,552963 of cash and bank balance, Rs. 76,970 of loan and advance, Rs. 1,828,423 of miscellaneous current assets. Current assets of the company increase in all four years.

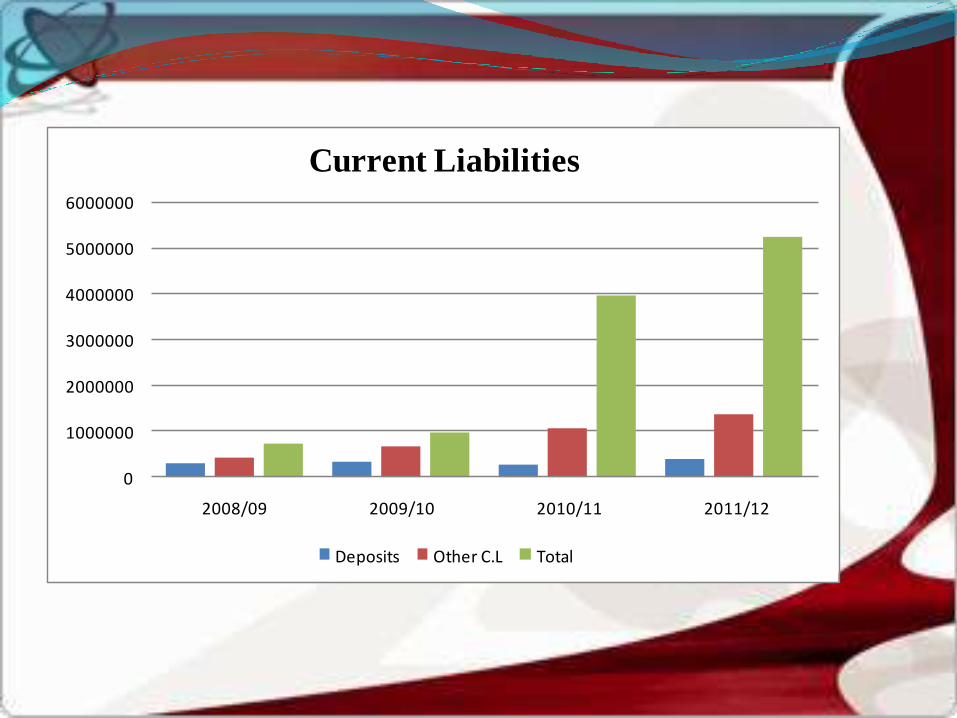
Component of Current LiabilitiesCurrent liabilities is a short-term obligation which is payable within a year.
The composition of current liabilities or the main components of current liabilities. Tax provision, staff bonus, proposed dividend payable and other liabilities are included in other current liabilities
In the above table, the component of current liabilities which consists deposits.Source
annual report of company
Fiscal Year Creditors Deposit Bills Payable Other C.L Total
2008/09 2,249,357 3,318,900 87,607 2,396,492 8,052,356
2009/10 3,701,079 4,129,900 196,168 2,491,564 10,518711
2010/11 3,281,079 4,430,900 98,372 1,690,564 9,500,915
2011/12 4,246,449 4,142,491 97,087 2,368,827 10,654,854
0
1000000
2000000
3000000
4000000
5000000
6000000
2008/09 2009/10 2010/11 2011/12
Current Liabilities
Deposits Other C.L Total
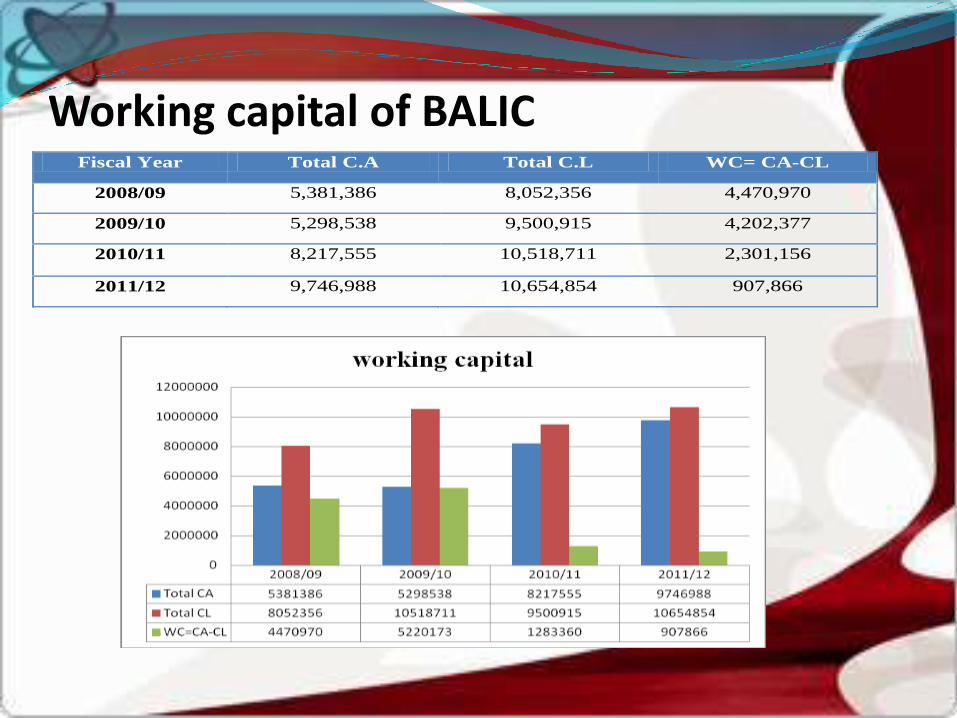
Working capital of BALICFiscal Year Total C.A Total C.L WC= CA-CL
2008/09 5,381,386 8,052,356 4,470,970
2009/10 5,298,538 9,500,915 4,202,377
2010/11 8,217,555 10,518,711 2,301,156
2011/12 9,746,988 10,654,854 907,866
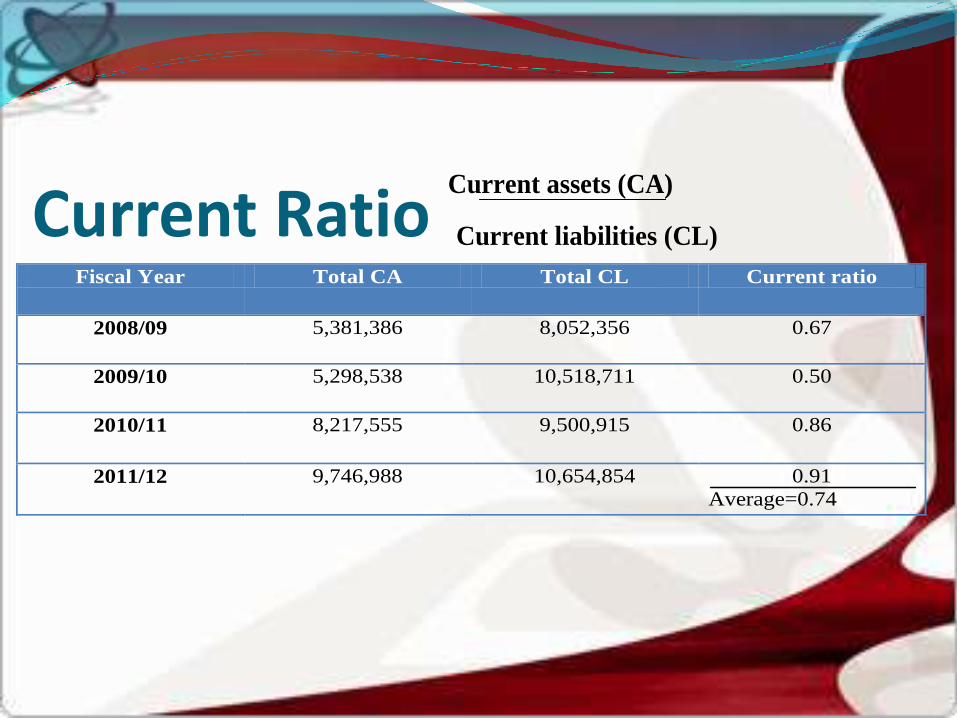
Current RatioCurrent assets (CA)
Current liabilities (CL)
Fiscal Year Total CA Total CL Current ratio
2008/09 5,381,386 8,052,356 0.67
2009/10 5,298,538 10,518,711 0.50
2010/11 8,217,555 9,500,915 0.86
2011/12 9,746,988 10,654,854 0.91
Average=0.74
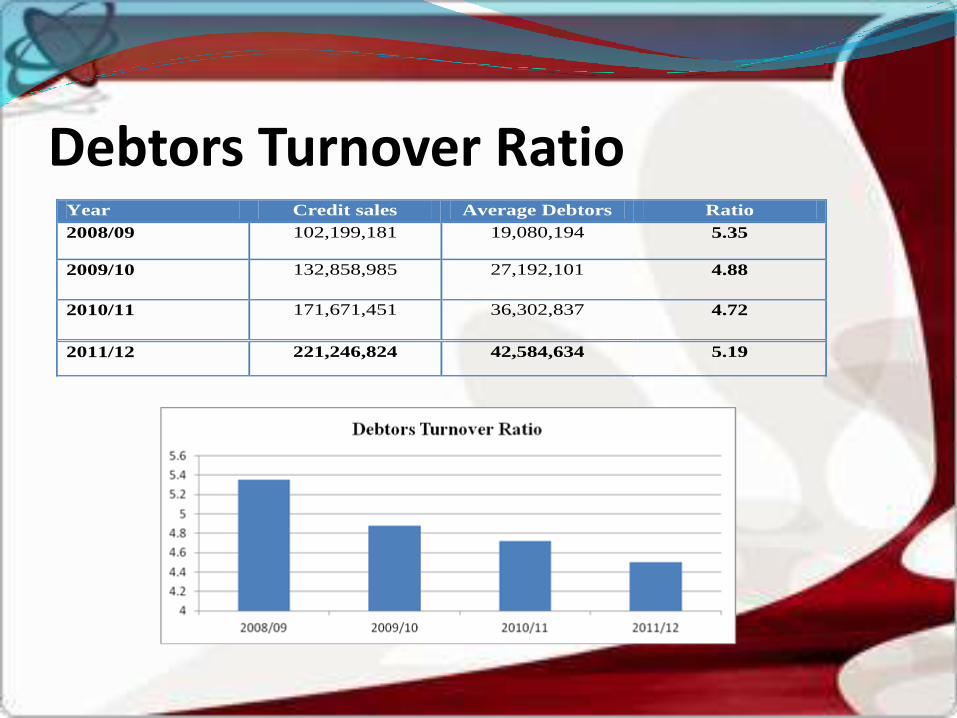
Debtors Turnover RatioYear Credit sales Average Debtors Ratio
2008/09 102,199,181 19,080,194 5.35
2009/10 132,858,985 27,192,101 4.88
2010/11 171,671,451 36,302,837 4.72
2011/12 221,246,824 42,584,634 5.19

Creditors Turnover Ratio = Net Credit Purchases
Average creditorsYear Credit Purchases Average Creditors Ratio
2008/09 96,724,469 82,074,994 1.17
2009/10 127,553,879 112,554,635 1.13
2010/11 165,680,148 146,617,013 1.13
2011/12 213,323,185 189,501,666 1.12
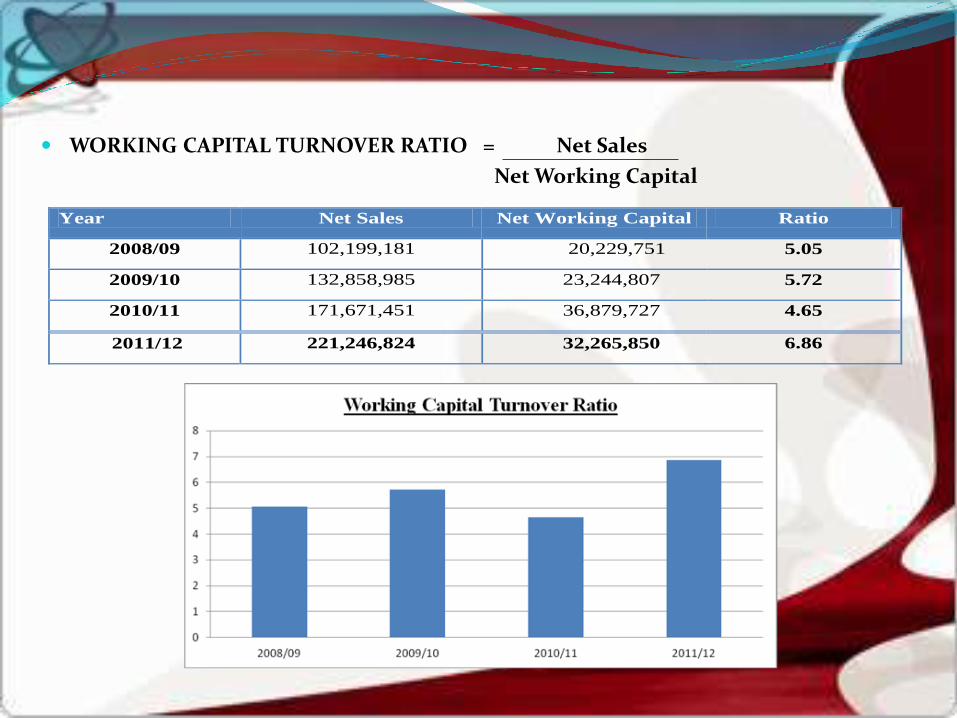
WORKING CAPITAL TURNOVER RATIO = Net Sales
Net Working Capital
Year Net Sales Net Working Capital Ratio
2008/09 102,199,181 20,229,751 5.05
2009/10 132,858,985 23,244,807 5.72
2010/11 171,671,451 36,879,727 4.65
2011/12 221,246,824 32,265,850 6.86
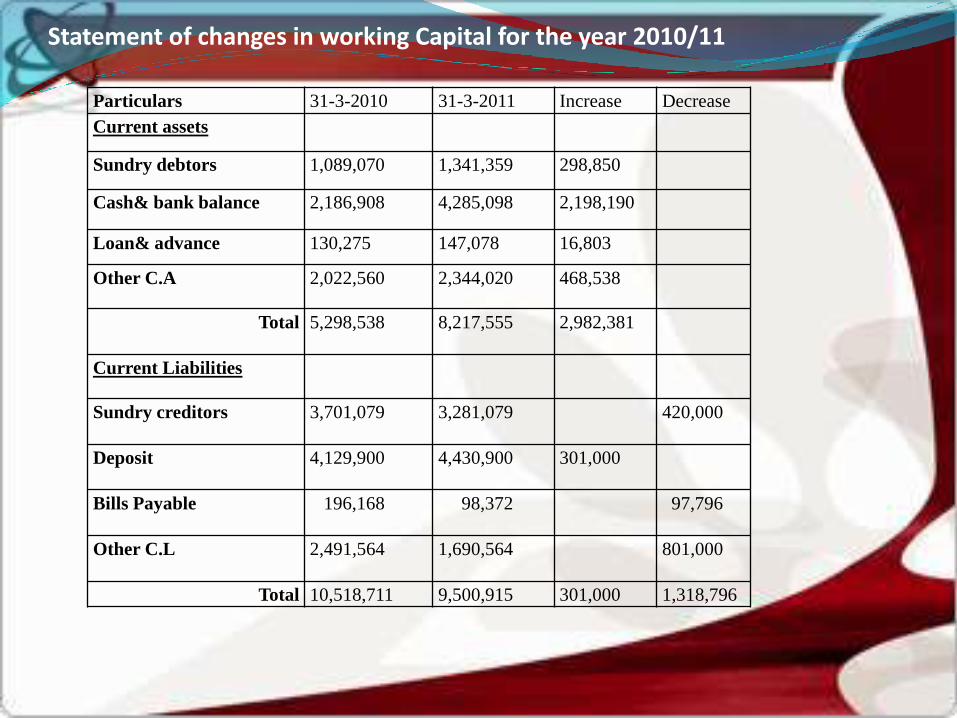
Statement of changes in working Capital for the year 2010/11
Particulars 31-3-2010 31-3-2011 Increase Decrease
Current assets
Sundry debtors 1,089,070 1,341,359 298,850
Cash& bank balance 2,186,908 4,285,098 2,198,190
Loan& advance 130,275 147,078 16,803
Other C.A 2,022,560 2,344,020 468,538
Total 5,298,538 8,217,555 2,982,381
Current Liabilities
Sundry creditors 3,701,079 3,281,079 420,000
Deposit 4,129,900 4,430,900 301,000
Bills Payable 196,168 98,372 97,796
Other C.L 2,491,564 1,690,564 801,000
Total 10,518,711 9,500,915 301,000 1,318,796
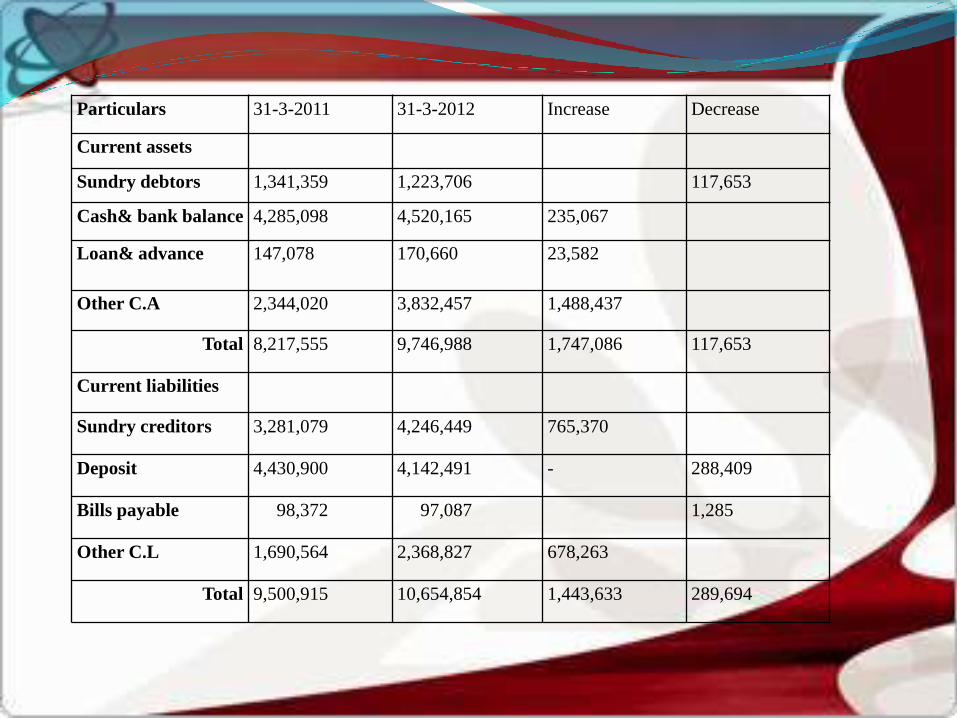
Particulars 31-3-2011 31-3-2012 Increase Decrease
Current assets
Sundry debtors 1,341,359 1,223,706 117,653
Cash& bank balance 4,285,098 4,520,165 235,067
Loan& advance 147,078 170,660 23,582
Other C.A 2,344,020 3,832,457 1,488,437
Total 8,217,555 9,746,988 1,747,086 117,653
Current liabilities
Sundry creditors 3,281,079 4,246,449 765,370
Deposit 4,430,900 4,142,491 - 288,409
Bills payable 98,372 97,087 1,285
Other C.L 1,690,564 2,368,827 678,263
Total 9,500,915 10,654,854 1,443,633 289,694

Findings Current assets for the year 2009/10 is decreases and its application for the company and current liabilities of the
company is increased by 2,466,355.and by putting formula (W.C= C.A- C.L)working capital of the company for year 2009/10 is 4,470,970.
Current assets for the year 2009/10 is increases and it is good condition for the company and current liabilities of the company is decreased by 1,017,796 that’s shows the working capital of the company is increased. Here debtors increased means cash balance of company decreased.
Current assets for the year 2009/10 is increases and it is good condition for the company and current liabilities of the company is increased by 1,153,939 that’s shows working capital of company decreased. Here debtors decreased that’s good for company it shows cash of company increased.
Current ratio (C.R) of fiscal year 2008/09 to 2011/12 showed slightly increase i.e. 0.67 to 0.91. But in fiscal year 2009/10 C.R decreased comparatively in deposits and in fiscal year 2010/11 C.R is again increase 0.86 due to increase in factors which influence it.
Cash and Bank balance to current assets ratio of the company is in 2009/10 decreased and in 2010/11 it increased and again in 2011/12 is decreased.
The above figure depicts that the cash and bank balance to total deposit of BALIC has been slightly decreasing in FY 2009/10, 2010/11, 2011/12.
Net profit to total asset ratio in 2008/09 1.05 and it increasing slightly in financial year 2009/10, 2010/11 and 2011/12.

SUGGESTION
On the basis of the analysis and observation an attempt made to present some suggestions.
In the year 2009-2010 the current assets of the company has declined and current liability of the company has increases therefore the net working capital declined. There for the current ratio has declined. The net working capital of the company has increased remaining year.
The company has able to repay the liability of the creditors because the profit of the company has increased every year.
Because of the current assets has declined in the year 2010-2011 but profit of the company has increased in the year 2008-2009. There for the return on current assets is high.
Company has able to full fill the standard level of current ratio i.e. 2:1 .There for the company has able to repay the liability and loan of company.

THANK YOU