BADGER METER, INC. GENERAL INVESTOR PRESENTATION
23
© 2021 Badger Meter, Inc. 1 BADGER METER, INC. GENERAL INVESTOR PRESENTATION October 2021
Transcript of BADGER METER, INC. GENERAL INVESTOR PRESENTATION

© 2021 Badger Meter, Inc. 1
BADGER METER, INC.
GENERAL INVESTOR PRESENTATION
October 2021
FORWARD LOOKING STATEMENTS
Certain statements contained in this presentation as well as other information provided from time to time by Badger Meter, Inc. (the “company”) or its employees, may contain forward-looking statements that involve risks and uncertainties that could cause actual results to differ materially from those statements. The words “anticipate,” “believe,” “estimate,” “expect,” “think,” “should,” “could” and “objective” or similar expressions are intended to identify forward looking statements. All such forward looking statements are based on the company’s then current views and assumptions and involve risks and uncertainties. Potential factors that could affect such forward-looking statements include the duration, severity and geographic spread of the COVID-19 pandemic, government actions to address or mitigate the impact of the COVID-19 pandemic, and the potential negative impacts of COVID-19 on the global economy, the company’s operations and those of our customers and suppliers. The company’s results are subject to its ability to develop and manufacture technologically advanced products that are accepted by the market, supply chain risk, legal and regulatory risks, political and general economic risks, risks related to doing business in foreign countries, including foreign currency risk, competition for skilled employees, material and labor cost increases, competitive pricing and operating efficiencies, the effects of climate change, cybersecurity attacks and disruptions to our information technology and the successful integration of acquisitions. See the company’s Form 10-K filed with the SEC for further information regarding risk factors, which are incorporated herein by reference. The company disclaims any obligation to publicly update or revise any forward-looking statements as a result of new information, future events or any other reason.
In this presentation certain non-GAAP financial measures may be used. Please see the supplemental financial schedules at the end of this presentation for a reconciliation to the appropriate GAAP measure.
© 2021 Badger Meter, Inc. 2
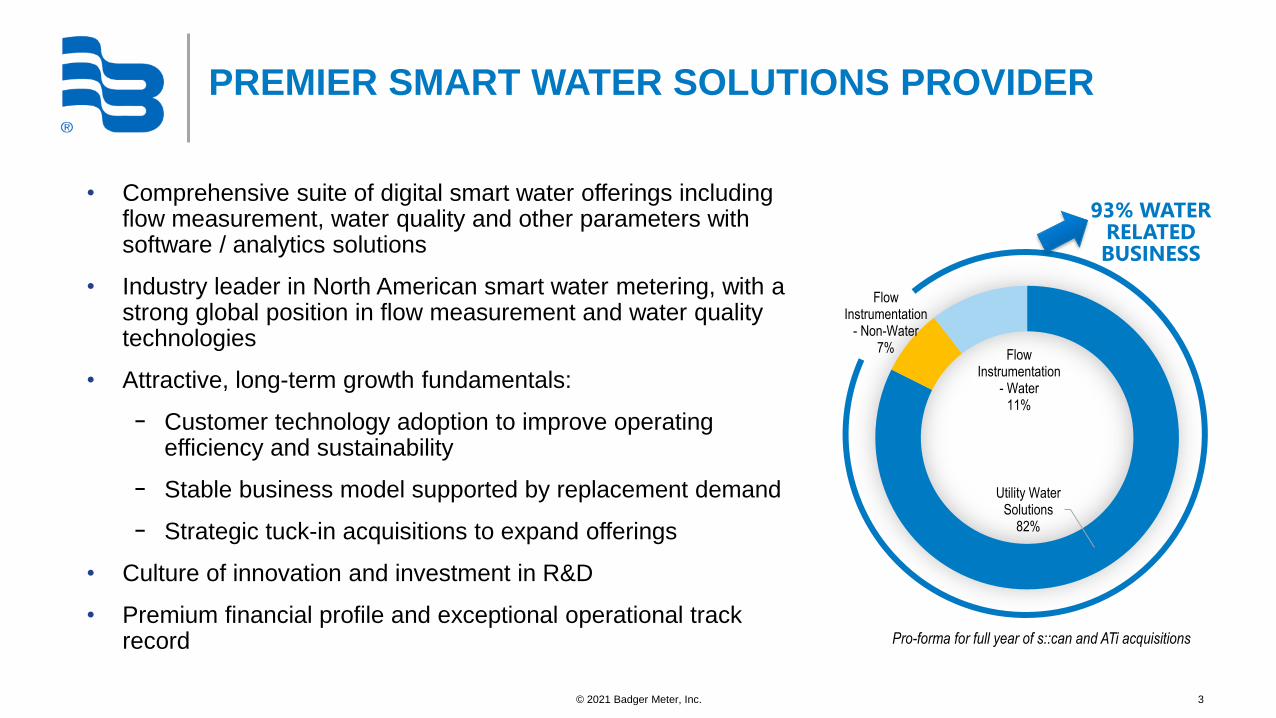
PREMIER SMART WATER SOLUTIONS PROVIDER
• Comprehensive suite of digital smart water offerings including flow measurement, water quality and other parameters with software / analytics solutions
• Industry leader in North American smart water metering, with a strong global position in flow measurement and water quality technologies
• Attractive, long-term growth fundamentals:
− Customer technology adoption to improve operating efficiency and sustainability
− Stable business model supported by replacement demand
− Strategic tuck-in acquisitions to expand offerings
• Culture of innovation and investment in R&D
• Premium financial profile and exceptional operational track record
© 2021 Badger Meter, Inc. 3
Utility Water Solutions
82%
Flow Instrumentation
- Non-Water7%
Flow Instrumentation
- Water11%
93% WATER RELATED BUSINESS
Pro-forma for full year of s::can and ATi acquisitions
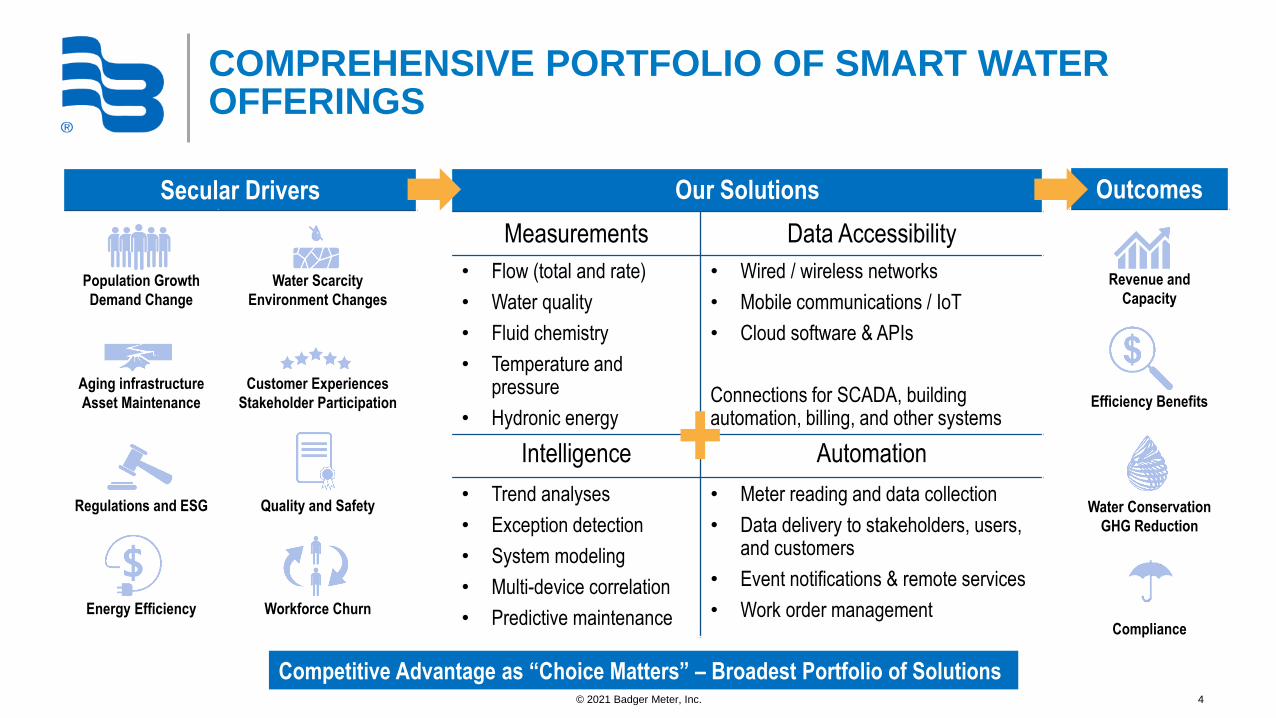
COMPREHENSIVE PORTFOLIO OF SMART WATER OFFERINGS
© 2021 Badger Meter, Inc. 4
Outcomes
Revenue and
Capacity
Efficiency Benefits
Water Conservation
GHG Reduction
Compliance
Secular Drivers
Population Growth
Demand Change
Water Scarcity
Environment Changes
Aging infrastructure
Asset Maintenance
Customer Experiences
Stakeholder Participation
Regulations and ESG Quality and Safety
Energy Efficiency Workforce Churn
Our Solutions
Measurements Data Accessibility
• Flow (total and rate)
• Water quality
• Fluid chemistry
• Temperature and pressure
• Hydronic energy
• Wired / wireless networks
• Mobile communications / IoT
• Cloud software & APIs
Connections for SCADA, building automation, billing, and other systems
Intelligence Automation
• Trend analyses
• Exception detection
• System modeling
• Multi-device correlation
• Predictive maintenance
• Meter reading and data collection
• Data delivery to stakeholders, users, and customers
• Event notifications & remote services
• Work order management
+
Competitive Advantage as “Choice Matters” – Broadest Portfolio of Solutions

SMART WATER INNOVATION LEADER
© 2021 Badger Meter, Inc. 5
Driving Enhancements in Smarter Measurement & Actionable Data Enhanced Operational Efficiencies
Innovation Centers:
Vienna, Austria
Philadelphia, PA, USA
Water Quality• Low maintenance,
reagent-less sensors
• Advanced IoT edge computing detects events
• 60+ parameters for water and gas
• 20+ years of leadership in optical spectrometry, 30+ years in electrochemical
Software & Analytics• Cloud software for utility
operations, sustainability
• Holistic view of water systems
• Real time detection of anomalies and events
• Decision dashboards
• Process automation
Innovation Center:
Los Gatos, CA, USA
Innovation Center:
Milwaukee, WI, USA
Cellular & IoT• 5th generation endpoint
released in 2021
• 18-24 month iterative development cycles
• Pioneer in market; first generation debut was 2014
• Millions of cellular endpoints deployed
Static Metering• Smarter meters – flow,
pressure, temperature, valves
• 2nd generation platform releases started in 2020
• Vertical integration of chip sets in order to control the evolution of smarter devices
• Improved accuracies
Innovation Centers:
Lulea, Sweden
Milwaukee, WI, USA
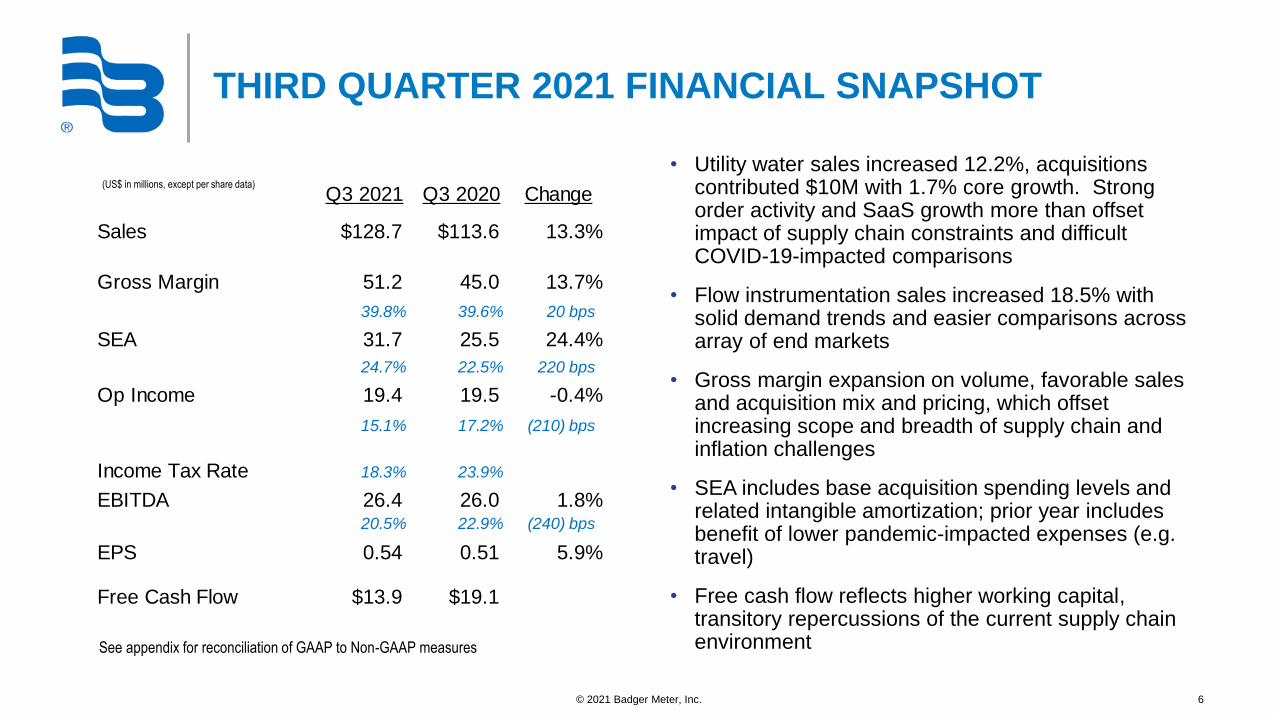
THIRD QUARTER 2021 FINANCIAL SNAPSHOT
• Utility water sales increased 12.2%, acquisitions contributed $10M with 1.7% core growth. Strong order activity and SaaS growth more than offset impact of supply chain constraints and difficult COVID-19-impacted comparisons
• Flow instrumentation sales increased 18.5% with solid demand trends and easier comparisons across array of end markets
• Gross margin expansion on volume, favorable sales and acquisition mix and pricing, which offset increasing scope and breadth of supply chain and inflation challenges
• SEA includes base acquisition spending levels and related intangible amortization; prior year includes benefit of lower pandemic-impacted expenses (e.g. travel)
• Free cash flow reflects higher working capital, transitory repercussions of the current supply chain environment
© 2021 Badger Meter, Inc. 6
Q3 2021 Q3 2020 Change
Sales $128.7 $113.6 13.3%
Gross Margin 51.2 45.0 13.7%
39.8% 39.6% 20 bps
SEA 31.7 25.5 24.4%
24.7% 22.5% 220 bps
Op Income 19.4 19.5 -0.4%
15.1% 17.2% (210) bps
Income Tax Rate 18.3% 23.9%
EBITDA 26.4 26.0 1.8%20.5% 22.9% (240) bps
EPS 0.54 0.51 5.9%
Free Cash Flow $13.9 $19.1
(US$ in millions, except per share data)
See appendix for reconciliation of GAAP to Non-GAAP measures

OUTLOOK / SUMMARY
© 2021 Badger Meter, Inc. 7
• Partnerships to advance ESG goals
• One of several AT&T Connected Climate Initiative collaborators utilizing the power of IoT to reduce emissions
• ORION® cellular endpoints enable infrastructure-free AMI, helping to preserve and protect the world’s most precious resource
Executing Strategic Growth Priorities and Actively Managing Market Dynamics
• Demonstrated success in managing myriad of macroeconomic challenges and delivering for our customers – strong execution of supply chain, logistics and inflation dynamics. Anticipate continuation of these headwinds into Q4 and 2022
• Investing in and advancing digital solutions to address holistic water system requirements; “choice matters” portfolio of offerings provides differentiation and resilience in supply-constrained environment
• Strong cash flow and balance sheet flexibility to execute capital allocation priorities including dividend increases as well as organic and acquisition growth
AT&T Connected Climate Press Release: https://about.att.com/story/2021/gigaton_global_emissions_2035.html
Badger Meter Smart Water Show #30– Climate water event resiliency: https://www.badgermeter.com/the-smart-water-show/

WATER QUALITY MONITORING – S::CAN AND ATI
• Complementary offerings
• Product technology – robust and full portfolio of both
electrochemical and optical sensors
• Geographies - ATi strong in the US and UK, while s::can has
installed product in 50 countries, with concentration in W. Europe
and SE Asia
• Scale – customer relationships, inside sales, rep networks,
distributors, for greater ability to cross sell
• Coverage - combined solutions provide opportunities across all
aspects of the water eco-system – including water utilities,
wastewater treatment and industrial water applications
• Long-term growth synergies
• Quantity plus quality data parameters – online, near real-time via
ORION® Cellular radio
• BEACON® and EyeOnWater ® to store, integrate, analyze and
visualize information providing holistic view of water network
• Expanded international footprint/customer relationships for smart
metering
© 2021 Badger Meter, Inc. 8
Evolving to Smart Water Solutions Provider - On Demand / Real Time / Anywhere
Potable water monitoring; optimize water treatment and ensure safety
of water supply
Increased reporting mandates for wastewater discharge
Heightened COVID-19 impact to vulnerable populations – hospitals,
senior living, education
Corporate ESG reporting requirements
Macro Trends Driving Applications WATER SECURITY
A case for network water quality monitoring
• Oldsmar FL cyber breach at water treatment facility
• Dangerous level of sodium chloride dispersed into system
• pH sensors in plant identified parameter
• Distributed monitoring stations could have detected penetration throughout system
• Trigger remedies, such as flushing
• Beyond quality, BEACON provides robust security protocols

CAPITAL ALLOCATION PRIORITIES
© 2021 Badger Meter, Inc. 9
Internal Investment to support organic
growth and sustain core business
Grow the dividend annually in line with
earnings
Accelerate acquisitions that align to strategy
and return targets
• No outstanding debt obligations and $67M of cash at September 30, 2021
• Strong free cash flow, working capital management – 125% conversion of net earnings YTD in 2021
• $150M untapped revolver –recently upsized facility adding covenant and other flexibility
• August 2021 dividend increase of 11% marked 29 consecutive years of dividend increases.
Ample Liquidity to Fund Growth Priorities
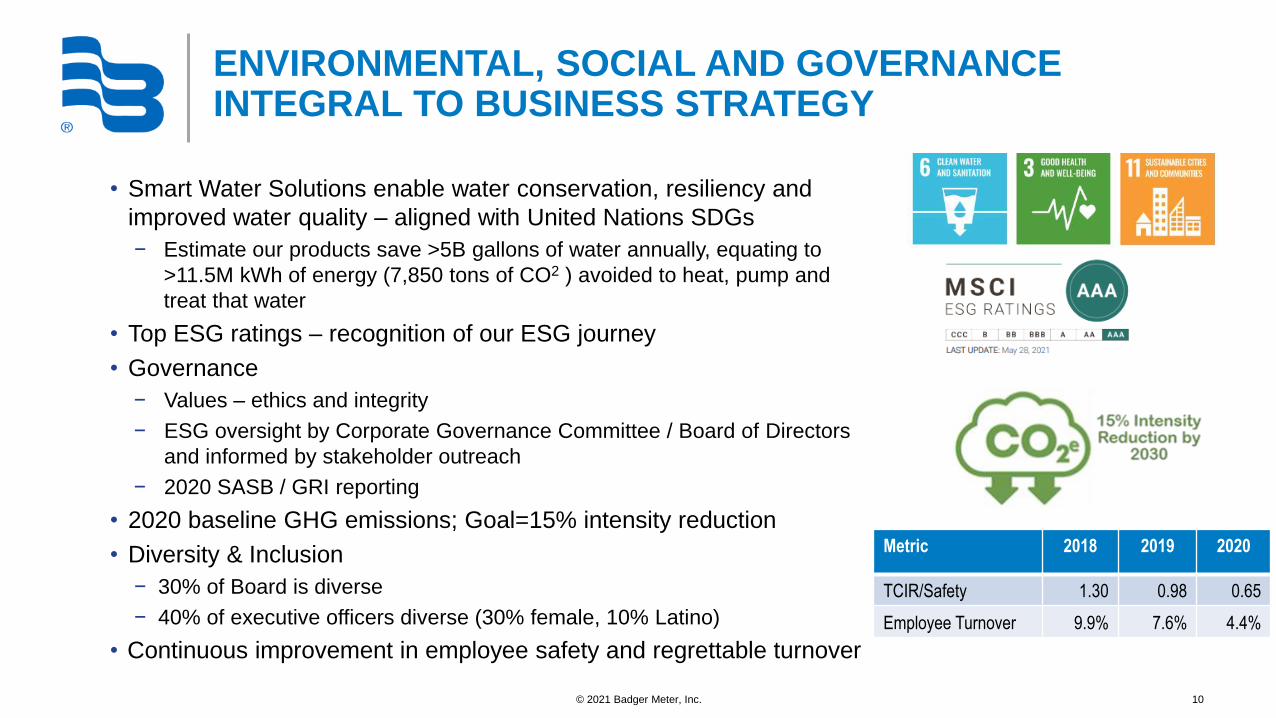
ENVIRONMENTAL, SOCIAL AND GOVERNANCE INTEGRAL TO BUSINESS STRATEGY
• Smart Water Solutions enable water conservation, resiliency and
improved water quality – aligned with United Nations SDGs
− Estimate our products save >5B gallons of water annually, equating to
>11.5M kWh of energy (7,850 tons of CO2 ) avoided to heat, pump and
treat that water
• Top ESG ratings – recognition of our ESG journey
• Governance
− Values – ethics and integrity
− ESG oversight by Corporate Governance Committee / Board of Directors
and informed by stakeholder outreach
− 2020 SASB / GRI reporting
• 2020 baseline GHG emissions; Goal=15% intensity reduction
• Diversity & Inclusion
− 30% of Board is diverse
− 40% of executive officers diverse (30% female, 10% Latino)
• Continuous improvement in employee safety and regrettable turnover
© 2021 Badger Meter, Inc. 10
Metric 2018 2019 2020
TCIR/Safety 1.30 0.98 0.65
Employee Turnover 9.9% 7.6% 4.4%
BACKGROUND INFORMATION
© 2021 Badger Meter, Inc. 11
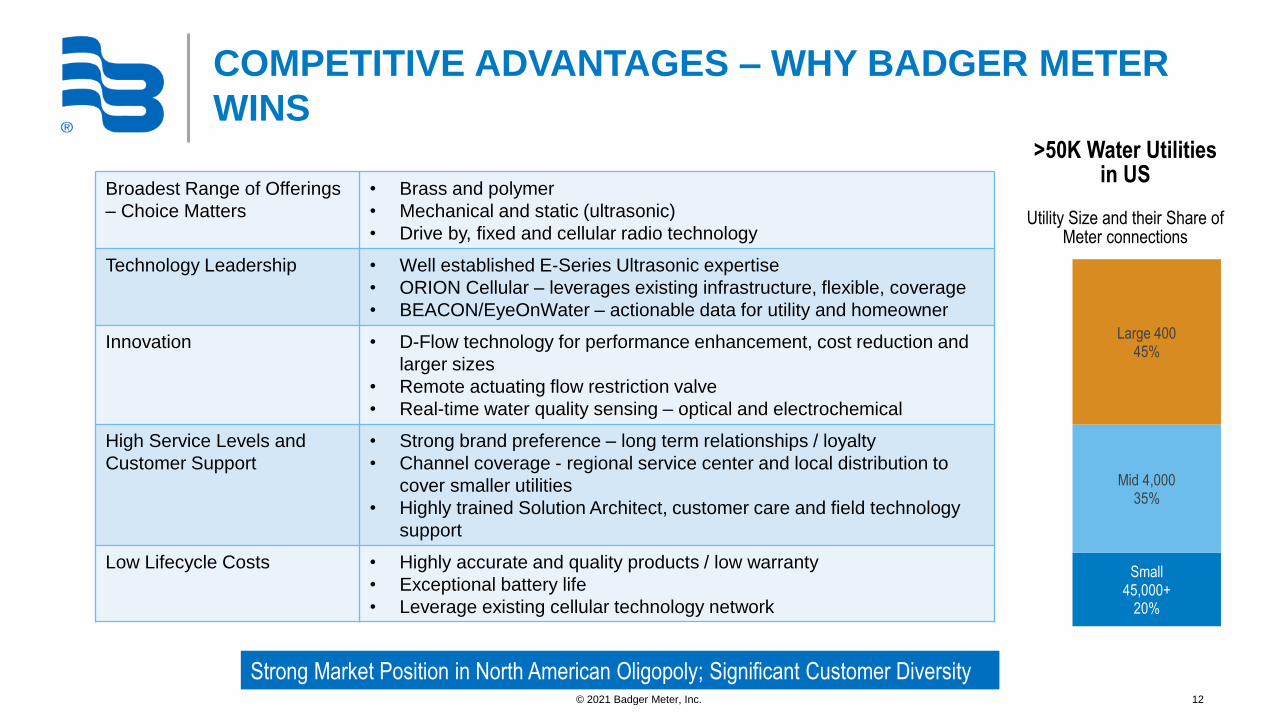
COMPETITIVE ADVANTAGES – WHY BADGER METER
WINS
© 2021 Badger Meter, Inc. 12
Broadest Range of Offerings
– Choice Matters
• Brass and polymer
• Mechanical and static (ultrasonic)
• Drive by, fixed and cellular radio technology
Technology Leadership • Well established E-Series Ultrasonic expertise
• ORION Cellular – leverages existing infrastructure, flexible, coverage
• BEACON/EyeOnWater – actionable data for utility and homeowner
Innovation • D-Flow technology for performance enhancement, cost reduction and
larger sizes
• Remote actuating flow restriction valve
• Real-time water quality sensing – optical and electrochemical
High Service Levels and
Customer Support
• Strong brand preference – long term relationships / loyalty
• Channel coverage - regional service center and local distribution to
cover smaller utilities
• Highly trained Solution Architect, customer care and field technology
support
Low Lifecycle Costs • Highly accurate and quality products / low warranty
• Exceptional battery life
• Leverage existing cellular technology network
Small 45,000+
20%
Mid 4,00035%
Large 40045%
>50K Water Utilities in US
Utility Size and their Share of Meter connections
Strong Market Position in North American Oligopoly; Significant Customer Diversity

CELLULAR COMMUNICATION VS. FIXED NETWORK
© 2021 Badger Meter, Inc. 13
• Easy
• Flexible
• Resilient
• Savings
• Standard
LTE-M Cellular Communication Technology – Example of Innovation Leadership

SMART WATER ACCELERATION
• Reduce non-revenue water (NRW)
• Mechanical meters lose some accuracy over
time
• Leak detection
• Lower operating cost / improve efficiencies
• Move out reads / billings
• Flow shut-off/restriction technology – labor
to turn off and on water services
• Encourage conservation
• Manage what you measure
• Leak avoidance / fix
© 2021 Badger Meter, Inc. 14
• Meters
• Static (E-series ultrasonic) holds accuracy over
lifetime; commercial sizes
• Radio Endpoints
• Safety- remote reads
• Data and analytics – more data, more often
• Cellular – infrastructure-free for utilities;
enables efficiencies for remote flow restriction,
move-outs, installation pacing
• Software
• Leak identification / detection
• EyeOnWater App for consumer awareness
The Business CaseWhy are utilities willing to pay more?
The SolutionsHow our leading technologies deliver
Overall Served Available Market Value Continues to Trend Higher

METERS
• Broadest product offering - both mechanical and static meters in both metal and polymer
• Next generation E-Series Ultrasonic Meter with D-Flow technology
RADIOS
• Complete line of connectivity solutions, including drive-by, fixed network and cellular radios
• Leading edge ORION Cellular radio, including LTE-M technology. Infrastructure free.
SOFTWARE
• BEACON AMA, (Advanced Metering Analytics) software suite -analytics tools, dashboards and integration with utility billing systems
• EyeOnWater® Consumer Application
1
2
3
UTILITY WATER-INTEGRATED SOLUTION OFFERING
© 2021 Badger Meter, Inc. 15
Mechanical Meters
Recordall® Disc
Static Meters
E-Series® Ultrasonic
Cellular Endpoint
Fixed Network Endpoint
Cellular Network ORION® NetworkGateway Transceiver
Consumer Portal
SmartPhone
Utility Client
ComputersUtility Co.
BEACON®
Cloud-BasedSolution
1
2 2
2 2
1
3 3
3

• Maintain leading position in the North American smart water market through continued development of leading-edge offerings
• Penetrate and grow select international markets (e.g. Middle East, UK) with fit-for-market solutions
• Leverage addition of real-time water quality monitoring, and other system health parameters into actionable data to improve utility operations
• Augment software, including consumer engagement technology, for optimized customer solution
SMART WATER KEY GROWTH STRATEGIES
© 2021 Badger Meter, Inc. 16
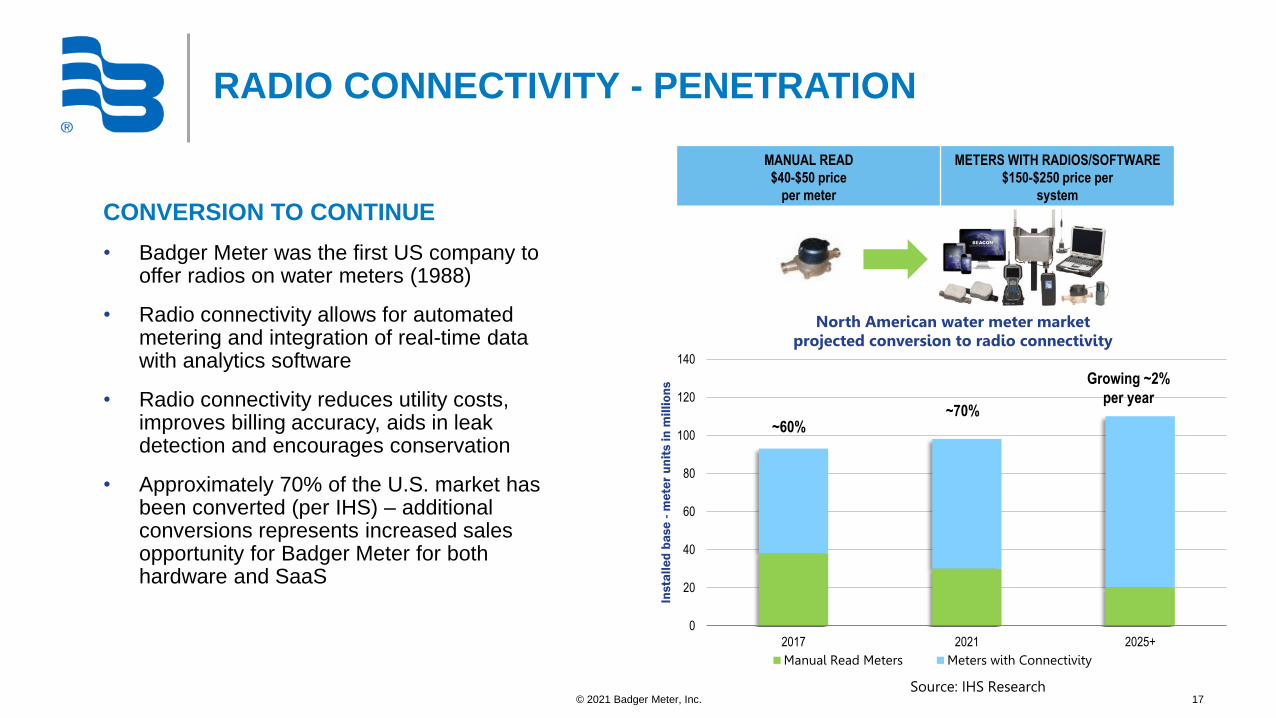
RADIO CONNECTIVITY - PENETRATION
CONVERSION TO CONTINUE
• Badger Meter was the first US company to offer radios on water meters (1988)
• Radio connectivity allows for automated metering and integration of real-time data with analytics software
• Radio connectivity reduces utility costs, improves billing accuracy, aids in leak detection and encourages conservation
• Approximately 70% of the U.S. market has been converted (per IHS) – additional conversions represents increased sales opportunity for Badger Meter for both hardware and SaaS
© 2021 Badger Meter, Inc. 17
0
20
40
60
80
100
120
140
2017 2021 2025+
Insta
lle
d b
ase
-m
ete
r u
nit
s i
n m
illi
on
s
North American water meter marketprojected conversion to radio connectivity
Manual Read Meters Meters with Connectivity
~60%~70%
MANUAL READ
$40-$50 price
per meter
METERS WITH RADIOS/SOFTWARE
$150-$250 price per
system
Source: IHS Research
Growing ~2%
per year
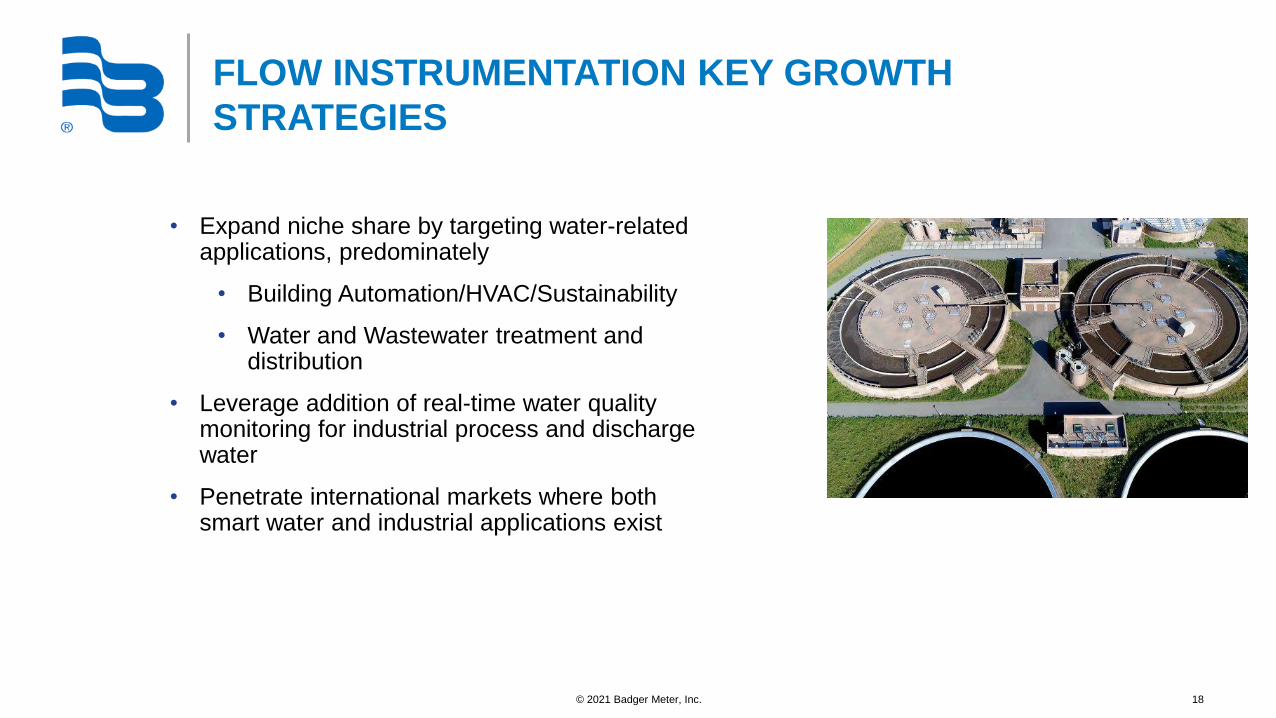
• Expand niche share by targeting water-related applications, predominately
• Building Automation/HVAC/Sustainability
• Water and Wastewater treatment and distribution
• Leverage addition of real-time water quality monitoring for industrial process and discharge water
• Penetrate international markets where both smart water and industrial applications exist
FLOW INSTRUMENTATION KEY GROWTH
STRATEGIES
© 2021 Badger Meter, Inc. 18

STRATEGIC ACQUISITIONS
Steps in ProcessPotential
Acquisition Targets
175+
~75
In Process
Opportunities
RefinedAssessment
Assess Size andOwnership
In Process
• Companies previously tracked
• New targets added as a result of strategic review
• Searches among trade groups and various databases
• Eliminatecompanies due to size, ownership, and unattractive business
• Opportunities forfurther review
Ideation List of Potential Targets
• Water quality monitoring• Sensors / Instruments• Software, AI and analytics• Geographic expansion
• Apply strategic considerations and assess specific attributes
Criteria
© 2021 Badger Meter, Inc. 19
• Technology solutions that can be leveraged across both utility and flow instrumentation markets
• Water quality monitoring
• Leak detection, conservation
• Software enhancements - SaaS
• Utility operations
• Consumer portals
• Smart City / Internet of Things
• International penetration
Disciplined Capital Allocation – accretive, growth synergies, leverage globally

ACQUISITION HISTORY
Year Company Type Location Price
Utility Water Instrumentation and Connectivity:
2021 Analytical Technology, Inc Water quality monitoring USA / UK $44M
2020 s::can Water quality monitoring Vienna, Austria $31M
2018 Innovative Metering Solutions
Distributor Tampa, FL $8M
2017 Carolina Meter Distributor Wilmington, NC $6M
2017 D-Flow Ultrasonic Technology/R&D Lulea, Sweden $23M
2015 United Utilities Distributor Smyrna, TN $3M
2014 National Meter Distributor Denver, CO $23M
2013 Aquacue Software/cellular technology/R&D Los Gatos, CA $14M
Flow and Industrial Instrumentation:
2012 Racine Federated Technology/Manufacturing Racine, WI $57M
2011 Remag Technology/Manufacturing Bern, Switzerland $5M
2010 Cox Instruments Technology/Manufacturing Scottsdale, AZ $8M
© 2021 Badger Meter, Inc. 20
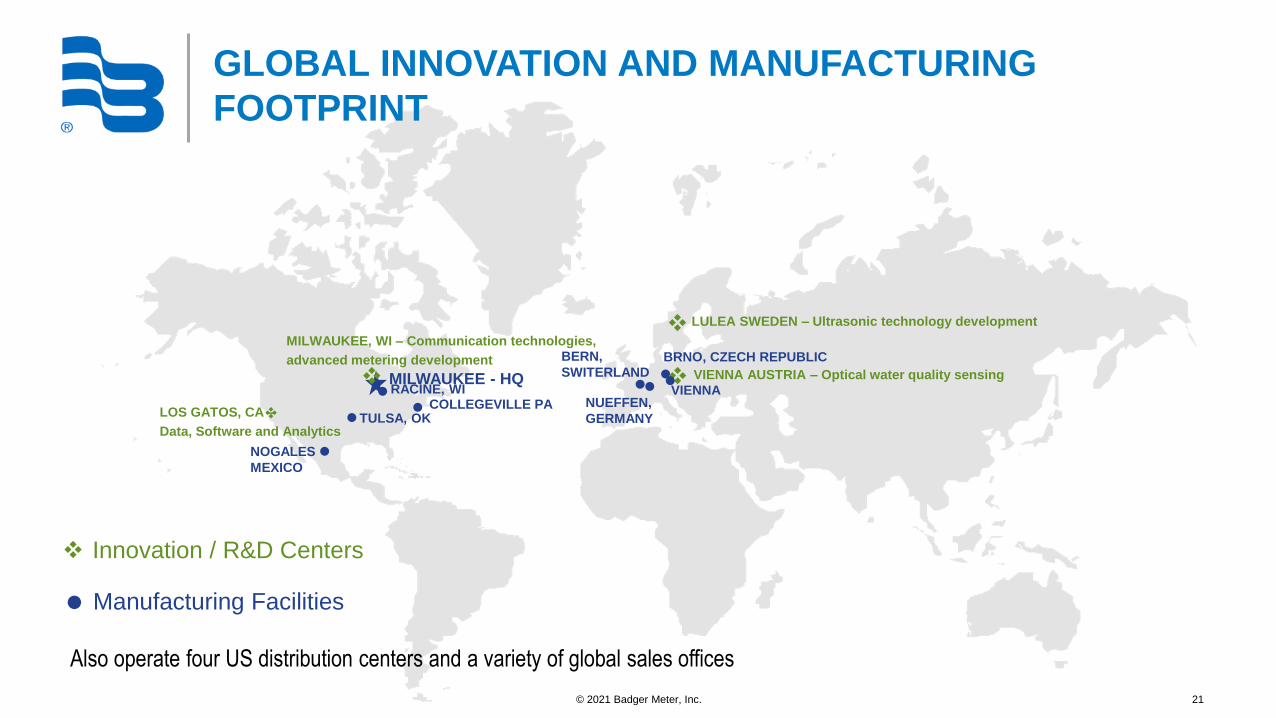
GLOBAL INNOVATION AND MANUFACTURING
FOOTPRINT
21
LOS GATOS, CA –
Data, Software and Analytics
Manufacturing Facilities
NUEFFEN,
GERMANY
NOGALES
MEXICO
BRNO, CZECH REPUBLIC
Innovation / R&D Centers
TULSA, OK
BERN,
SWITERLANDRACINE, WI
MILWAUKEE - HQ
LULEA SWEDEN – Ultrasonic technology development
MILWAUKEE, WI – Communication technologies,
advanced metering development
VIENNA AUSTRIA – Optical water quality sensingVIENNA
COLLEGEVILLE PA
Also operate four US distribution centers and a variety of global sales offices
© 2021 Badger Meter, Inc.
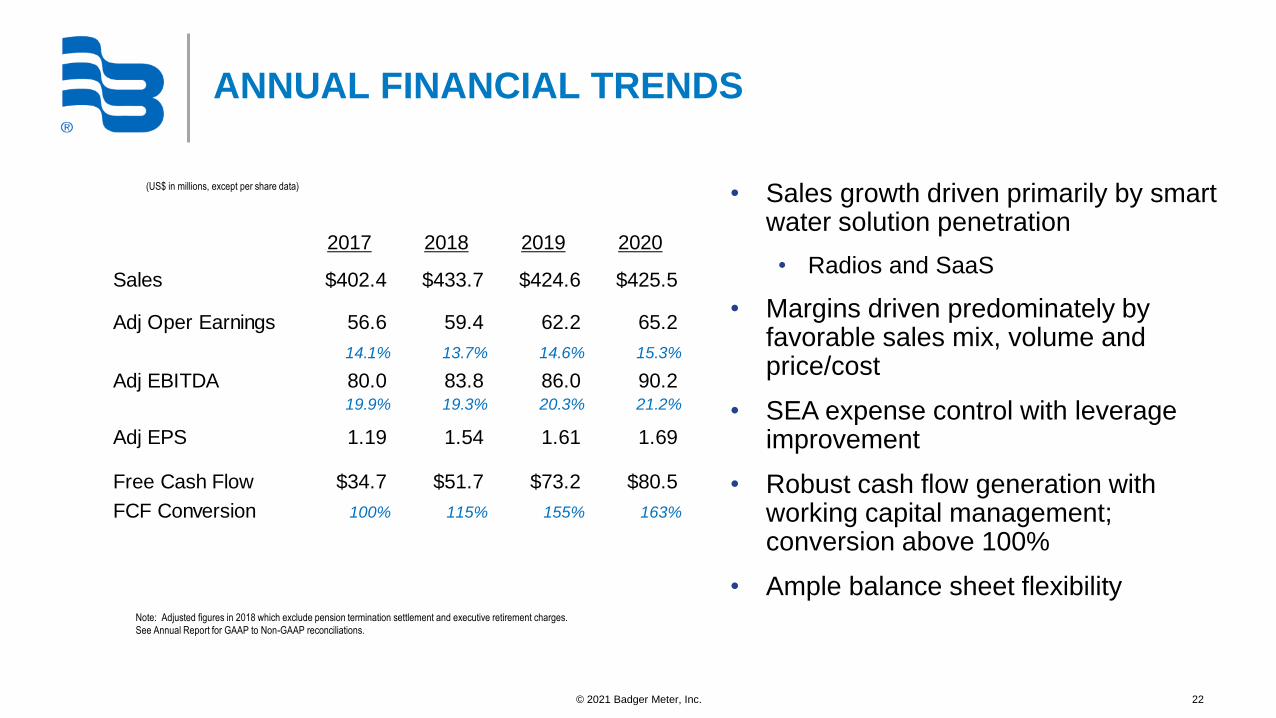
ANNUAL FINANCIAL TRENDS
• Sales growth driven primarily by smart water solution penetration
• Radios and SaaS
• Margins driven predominately by favorable sales mix, volume and price/cost
• SEA expense control with leverage improvement
• Robust cash flow generation with working capital management; conversion above 100%
• Ample balance sheet flexibility
© 2021 Badger Meter, Inc. 22
2017 2018 2019 2020
Sales $402.4 $433.7 $424.6 $425.5
Adj Oper Earnings 56.6 59.4 62.2 65.2
14.1% 13.7% 14.6% 15.3%
Adj EBITDA 80.0 83.8 86.0 90.219.9% 19.3% 20.3% 21.2%
Adj EPS 1.19 1.54 1.61 1.69
Free Cash Flow $34.7 $51.7 $73.2 $80.5
FCF Conversion 100% 115% 155% 163%
(US$ in millions, except per share data)
Note: Adjusted figures in 2018 which exclude pension termination settlement and executive retirement charges.
See Annual Report for GAAP to Non-GAAP reconciliations.

GAAP TO NON-GAAP RECONCILIATIONS
© 2021 Badger Meter, Inc. 23
Q3 2021 Q3 2020 YTD 2021 YTD 2020
Net Earnings (GAAP) $15.9 $14.9 $43.6 $36.2
Interest expense 0.0 0.0 0.0 0.0
Income tax provision 3.5 4.7 12.1 11.8
Depreciation 2.7 3.1 8.6 9.2
Amortization 4.3 3.3 12.4 9.8
EBITDA $26.4 $26.0 $76.7 $67.0
EBITDA
(US$ in millions)
Q3 2021 Q3 2020
Cash from Ops (GAAP) $17.7 $21.4
Capital Expenditures (3.8) (2.3)
Free Cash Flow $13.9 $19.1
YTD 2021 YTD 2020
Cash from Ops (GAAP) $62.8 $73.7
Capital Expenditures (8.2) (5.9)
Free Cash Flow $54.6 $67.8
Free Cash Flow
(US$ in millions)