Backward and Forward integration along Global Value Chains
24
1 Backward and Forward integration along Global Value Chains Davide Del Prete † Armando Rungi ‡ (University of Naples Parthenope) (IMT Lucca) October 2019 Abstract Backward and forward vertical integrations both shape the organization of Global Value Chains (GVCs). Yet, many studies make the unrealistic assumption that integration decisions are binary and one-directional, i.e., companies make the integration decision only once and they can go either backward or forward but not in both directions. The aim of this paper is to analyze the firm-level organization of GVCs when both vertical integration decisions are taken into account. Exploiting a global sample of more than 1.4 million firms, we first document how midstream parents actually integrate on both directions along the chain, and they are at least as common as downstream and upstream parents. Then, we find that parent companies prefer to integrate production stages with a relatively low elasticity of substitution and with a technological proximity on the supply chain. Finally, we provide evidence that more than one subsidiary in a given location can perform the same production stage. Keywords: global value chains; vertical integration; property rights theory; multinational enterprises; downstreamness; corporate boundaries. JEL codes: F14, F23, D23, G34, L20. † Mail to [email protected]. Department of Business and Economics, via Generale Parisi 13 – 80132 Naples - Italy. ‡ Mail to [email protected]. Laboratory for the Analysis of Complex Economic Systems, piazza San Francesco 19 - 55100 Lucca – Italy
Transcript of Backward and Forward integration along Global Value Chains

1
Backward and Forward integration along Global Value Chains
Davide Del Prete† Armando Rungi‡
(University of Naples Parthenope) (IMT Lucca)
October 2019
Abstract
Backward and forward vertical integrations both shape the organization of Global Value Chains
(GVCs). Yet, many studies make the unrealistic assumption that integration decisions are binary
and one-directional, i.e., companies make the integration decision only once and they can go either
backward or forward but not in both directions. The aim of this paper is to analyze the firm-level
organization of GVCs when both vertical integration decisions are taken into account. Exploiting
a global sample of more than 1.4 million firms, we first document how midstream parents actually
integrate on both directions along the chain, and they are at least as common as downstream and
upstream parents. Then, we find that parent companies prefer to integrate production stages with
a relatively low elasticity of substitution and with a technological proximity on the supply chain.
Finally, we provide evidence that more than one subsidiary in a given location can perform the
same production stage.
Keywords: global value chains; vertical integration; property rights theory; multinational enterprises;
downstreamness; corporate boundaries.
JEL codes: F14, F23, D23, G34, L20.
† Mail to [email protected]. Department of Business and Economics, via Generale Parisi 13 – 80132 Naples -
Italy.
‡ Mail to [email protected]. Laboratory for the Analysis of Complex Economic Systems, piazza San Francesco 19 -
55100 Lucca – Italy

2
1. Introduction
In 1871, Continental AG was founded in Germany and started its business as a rubber manufacturer. Now-
adays, it is one of the largest manufacturers of tires but, since its foundation, it extended its range of activ-
ities including both backward and forward tasks along the automotive chain. For example, Continental AG
acquired the segment of brakes and chassis in 1998 from ITT Inc. It concluded a deal with Motorola in
2006 to take over the segment of automotive electronic components. Then, the company acquired the VDO
brand by Siemens for powertrain and fuel injection systems in 2007. Later, in 2015, the company moved
further upstream after the acquisition of the US firm Vejance Technologies, which is a supplier of engi-
neered rubber products. Consider also Acer, the Taiwanese company that started in 1976 as an electronic
components importer and became among the top producer of PCs in two decades. Upstream, in 1989 Acer
partnered with Texas Instruments to produce semiconductors and, in 1998, it integrated TI for additional
electronic components. Downstream, Acer's regional business units took over local assembly and it started
to develop capabilities in distribution activities (Bartlett and Ghoshal, 2000). More in general, we may think
of many cases in which a manufacturer extends her firm boundary to include other activities both upstream
and dowsntream.
These backward and forward integration strategies both shape the firm-level organization of Global
Value Chains (GVCs). From our data, we estimate that they represent about 45% and 35% of the total,
respectively. Yet, many studies make the unrealistic assumption that integration decisions are binary and
one-directional, i.e., companies can go either backward or forward but not in both directions. Take the case
of the voluminous trade literature inspired by Antràs (2003) and followed by Antrás and Chor (2013) and
Alfaro et al., (2019), according to whom integration always starts from the bottom of the supply chain and
consequently the coexistence of forward and backward integration choices (from now on, VIF and VIB,
respectively) is assumed away. If the two types of integration coexist and are driven by different mecha-
nisms, any empirical exercise based on the one-directional assumption turns out to be biased.
The aim of this paper is to analyze the firm-level organization of GVCs when both VIB and VIF
decisions are taken into account. To this end, we adopt a framework in which production processes are
sequential on an ideal supply chain. Therefore, GVCs can be organized in two organizational modes: i)
firms exchange goods at arm’s length when they sign supply contracts (outsourcing), or ii) firms integrate
one or more production stages along GVCs after establishing affiliates or taking over companies that will
eventually exchange intermediates intra-firm, within the boundary of the group that may stretch across
national borders. The latter case is visualized in Figure 1, where the principal (a parent firm) can decide to

3
integrate an agent (a subsidiary) under a unique firm boundary. The arrows indicate the transaction direc-
tion. In the VIB case, the buyer (parent) employs the supplier (subsidiary) of an intermediate input, whereas
in the VIF case the supplier (parent) of the intermediate input employs one of its buyers (subsidiaries).
Figure 1: Backward and forward integration along GVCs
For our purpose, we exploit a sample of about 201,272 Multinational Enterprises (MNEs) control-
ling about 1.2 million domestic or foreign subsidiaries. Then, we further identify newly established subsid-
iaries or takeovers that have been completed in the period 2004-2012.
First, we find that parent companies more likely integrate production stages that have a relatively
low elasticity of substitution, be it a buyer or a supplier in an input-output relationship, possibly because an
underinvestment by a low substitutable firm would undermine the value generated at the end of the chain.
In this framework, we partially rely on the intuition by Antràs and Chor (2013) and Alfaro et al. (2019),
where however only final producers can start integration, hence excluding VIF. Yet, they were the first to
introduce the notion of interdependence along the GVCs, where all buyers and suppliers must rely on a
partition of the final surplus. We believe that the latter is a peculiar characteristic of fragmented production
processes oriented over a technological sequence. This is also in line with the original assumption of the
contract theory of the firm sketched in the seminal work by Grossman and Hart (1986) and Hart and Moore
(1990) whereby, in presence of incomplete contracts, vertical integration helps mitigate inefficiencies that
arise from underinvestment, and the party whose marginal investment is more relevant should start integra-
tion.
Second, we find that integrated activities (both VIF and VIB) tend to be proximate on a supply
chain. That is, a parent company is less likely to integrate subsidiaries if they perform activities that are
technologically distant from its core activity. Such a proximity on supply chains can be explained by the
Subsidiary Parent
a) Backward (vertical) integration
Transaction
Parent Subsidiary
b) Forward (vertical) integration
Transaction

4
existence of some economies of scope across similar technologies, when it is easier to coordinate activities
that share some technological features (Del Prete and Rungi, 2017).
Finally, we provide evidence of a multiplication of subsidiaries performing the same production
stages in a given location. As far as we know, the latter is a largely unexplored fact that paves the way for
an understanding of an important organizational characteristic of GVCs, when a duplication of production
stages is not the exception. In fact, we find about 26% of cases in our sample, when the activity by a
subsidiary is a duplicate at the industry–country level. This resonates with Atalay et al. (2019), who provide
a first rationale for the duplication of integrated stages, as they found that having an additional vertically
integrated establishment in a given destination ZIP code within US has the same effect on shipment volumes
as a 40% reduction in distance.
To grasp the essential aspects of our main findings, let us consider three case studies of downstream,
midstream and upstream parents sourced from our data and reported in the upper, middle and bottom panels,
respectively, of Figure 2. For each case, we plot the relative positions on the supply chain of both the parent
company and its affiliates.1 First, we show Daimler AG, a German multinational automotive corporation
headquartered in Stuttgart, Baden-Württemberg, which presents a downstreamness measure of .99, i.e. rel-
atively close to final demand. The German corporation controls 357 subsidiaries around the world, all lo-
cated relatively more upstream than the parent company, i.e. performing production processes that possibly
supply inputs required for the core activity of headquarters. Hence, we consider them as choices of back-
ward integration. Of these subsidiaries, about 62% are a duplicate at the country-industry level within the
firm boundary. That is, in these cases, we find that there is more than one subsidiary in Daimler AG that
performs the same production stage in a given location. Second, we report a case of a midstream parent
company, Continental AG, which is a leading German automotive manufacturer specialized in tires,
brake systems, and other parts for the automotive and transportation industries. From our data, it has a
downstreamness of .69 and controls 279 affiliates, located both relatively more upstream and downstream
along the chain. That is, we find that the headquarters of Continental AG possibly receive inputs from some
subsidiaries, but they can also deliver inputs to some other subsidiaries along the automotive supply chain.
On total, there is a redundancy of 59% subsidiaries within Continental AG that perform the same production
stage. Finally, we report the case of ArcelorMittal, which is the world's largest steel producer headquartered
in Luxembourg City. This is a typical case of forward integration, since its headquarters are indeed up-
1 Downstreamness metrics are sourced from Antràs and Chor (2013). See Section 3 for more details on firm-level data matched
by industry affiliations with industry characteristics.

5
stream, with a downstreamness measure of .3, which has integrated over time 631 relatively more down-
stream affiliates. In the case of ArcelorMittal, we also find a remarkable share of production stages dupli-
cated within the firm boundary (67%).
Figure 2: Cases of downstream a), midstream b) and upstream c) parent companies
a) Daimler AG
b) Continental AG

6
c) ArcelorMittal
All in all, it is very common in our data to find a multiplicity of organizational modes, including
both VIF and VIB and a duplication of production stages along the supply chain. From our point of view,
these findings violate the main stringent assumptions of existing theoretical models of GVCs, according to
which integration always starts from either the top or the bottom of the supply chain, and only one supplier
of an intermediate input is needed on the technological sequence.
The remainder of this paper is organized as follows. In Section 2, we briefly review related works.
Section 3 introduces the construction of our sample and first evidence from descriptive statistics. In Section
4, we present empirical analyses and robustness checks. Section 5 concludes.
2. Literature Review
Several works investigated the determinants of either forward or backward vertical integration. Lafontaine
and Slade (2007) categorize this voluminous literature by the direction of integration and the type of indus-
try under study. According to these authors, the empirical literature on forward integration generally con-
siders a manufacturer's decision to sell her outputs directly to consumers, by reaching them through prem-
ises she owns, rather than using independent retailers. In this case, the main sector under investigation is
the retail industry. Examples include: Lafontaine (1992), who assesses various agency-theoretic explana-
tions for franchising; Minkler and Park (1994) study the role of asset specificity; Scott (1995) investigates
system quality in VFI decisions; Lafontaine and Shaw (1999) provide evidence on how franchisors adjust
their royalty rates and fees as they gain franchising experience; Woodruff (2002) examines patterns of
forward integration among footwear manufacturers and retailers in Mexico; Baker and Hubbard (2004)
investigate how contractual incompleteness affects asset ownership in trucking.

7
On the other hand, the literature on backward integration is concerned with a manufacturer’s deci-
sion to integrate with its suppliers of parts or equipment or, in other words, the decision whether to ‘make
or buy’ an input. This approach has gained popularity in trade literature thanks to the seminal paper by
Antràs (2003), who show how intra-firm trade is mainly concentrated in capital intensive industries and
between capital abundant countries. Antràs and Helpman (2004) argue that only the most productive firms
are able to sustain the higher sunk costs of international vertical integration, which would explain the pos-
itive correlation existing between intra-firm trade and productivity dispersions. It is worth noting that a key
assumption in both these works, is that the intermediate input is produced in the foreign subsidiary’s country
and is then shipped to the headquarter country, i.e. a VIB case. If these imports would have instead been
shipped from a foreign parent to a U.S. subsidiary, then this assumption would be no longer realistic. Later,
adopting a broader perspective, Acemoglu et al. (2007) are the first to consider the possibility that unique
headquarters commit to contracts with several suppliers, in this way extending in scope the one-shot ’make
or buy’ decision. They show that a greater contractual incompleteness leads to the adoption of less advanced
technologies, even more when intermediate inputs are highly complementary. Finally, it is only recently
that a VIB framework has been applied to consider the sequential nature of production in GVCs (Antràs
and Chor, 2013; Alfaro et al., 2019), when discussing how the optimal allocation of ownership rights along
the chain crucially depends on two main parameters: the positions of suppliers along the sequence and the
relative size of elasticities of final demand vis à vis the elasticity of substitution across production stages.
In that framework, the final producer posts contracts for agents for each stage, stating the organizational
mode (integration or outsourcing), and then chooses for each stage only one agent among the applicants. It
will eventually outsource downstream stages and integrate upstream ones when it faces a relatively high
demand elasticity.
In all previous cases, however, integration decision is assumed to be made by a final good producer
picking among its input suppliers, or by a manufacturer towards its retailers. In the first case, assuming that
the most downstream producer is the decision-maker excludes the possibility of forward integration. On
the other hand, assuming that the upstream manufacturer is the principal firm excludes the possibility of
backward integration. Two exceptions are worth mentioning. Acemoglu et al. (2010) develop a theoretical
model that allows integration to go either forward or backward. However, in their empirical application,
they focus only on VIB cases because their database does not contain information on the direction of inte-
gration. They find that greater technology intensity of the producer w.r.t. to the supplier, and greater cost
shares for inputs make vertical integration more likely. More recently, MengXiao (2019) models and tests

8
cases of dual integration, both VIB and VIF2, in a context of contractual imperfections. However, both these
works do not extend the single ‘make or buy’ decision to study technological sequences of GVCs. In other
words, by assuming away the case in which two firms share a common parent, the authors neglect the
dependence of downstream stages from upstream stages, when production processes are fragmented along
GVCs.
3. Data
We source data on MNEs from Orbis, a commercial dataset with global coverage compiled by the Bureau
Van Dijk3. Then, we match firm-level primary activities at the 6-digit of the NAICS classification with
similarly disaggregated industrial metrics of positions on supply chains, sourced from Antràs and Chor
(2013)4, which allow us to identify positions of firms along the chain proxied as the technological distance
from final consumers. We complement our data with metrics of demand elasticity sourced from Broda and
Weinstein (2006), to catch the substitutability of final products and intermediate inputs. For similar map-
pings of firm-level sourcing based on input-output tables and industry affiliations, see Alfaro and Charlton
(2009), Acemoglu et al. (2010), Alfaro et al. (2016), and Del Prete and Rungi (2017).
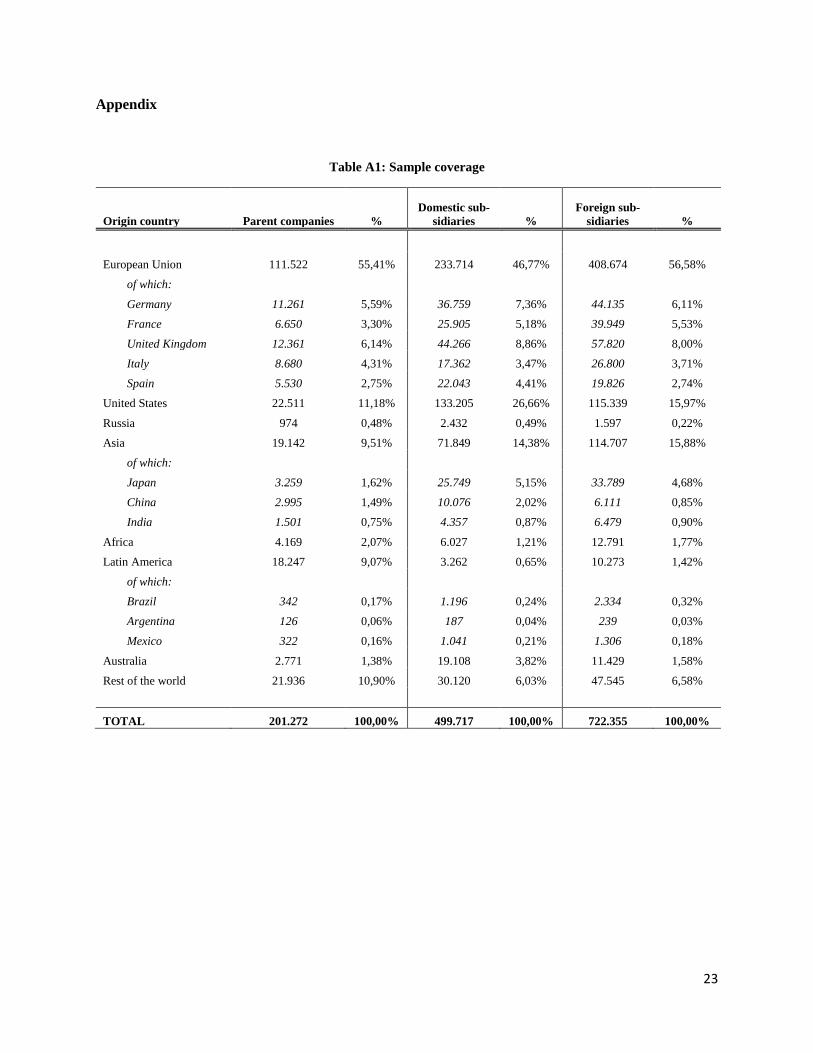
In Appendix Table A1, we report the geographic coverage of our dataset by origin country, i.e.
considering the country where the parent company is located. Our sample includes information on parents
and subsidiaries located in about 196 countries. As expected, the European Union reports the highest num-
ber of MNEs, in line with official Eurostat FATS statistics. There are less MNEs from US, and they are
usually bigger than European ones. Both advanced economies and emerging countries are present in our
dataset.
Our unit of observation is a pair comprising a parent company (taken with its activity) and any
possible input and output industry, as derived from I-O tables. Then, following previous studies (Alfaro et
al., 2019; Del Prete and Rungi, 2017), we consider a stage to be integrated by a parent company if at least
one of its subsidiaries is active in an input or output industry. 5 If the parent has not integrated any subsidiary
in an input (output) industry resulting from I-O tables, then that good is assumed to be sourced (shipped)
2 MengXiao (2019) finds that, if each industry pair is weighted by its total number of seller-buyer relationships, 62% of the industry
pairs feature the coexistence of backward and forward integration. 3 We follow international standards for the identification of parents and subsidiaries of MNEs (OECD, 2005; UNCTAD, 2009;
UNCTAD, 2016), according to which a subsidiary is controlled after a (direct or indirect) concentration of voting rights (> 50%).
See also Rungi et al. (2019). Similar data structures have been used in Alviarez et al. (2016), Cravino and Levchenko (2017) and
Rungi and Del Prete (2018). 4 In the absence of original information on actual shipments of intermediate inputs, Antràs and Chor (2013) turn to Input-Output
tables to locate an industry along a supply chain, which is measured as the technological distance from final consumers. Metrics
are normalized on a range (0,1), where 0 is the ideal start of a production line and 1 represents final consumption. 5 A key difference with these previous studies is, however, that we also consider output industries.

9
from an independent supplier (buyer) outside the firm boundary. In a second part of the paper we also
consider the number of subsidiaries per production stage.
In Table 1, we report the total number of integration strategies included in our sample. VIB and
VIF cases are both relatively common, as they represent about 45% and 35% of the total integrated stages,
respectively.
Table 1: Integrated subsidiaries by organizational mode
Integration decision: N. subsidiaries %
Backward 545,044 44.6%
Forward 427,725 35.0%
Horizontal 249,302 20.4%
Total 1,222,072 100.00%
Then, in Figure 3, we show the firm-level positions on a GVC of both parents and integrated firms
(subsidiaries) based on their industry affiliations. Interestingly, in both cases, we detect a higher density
midstream, i.e. when producers are engaged in the production of intermediate goods or services. This is at
odds with main assumptions from existing theories on the organization of GVCs, according to which ver-
tical integration starts from the bottom of the chain, where parents should be, and it involves production
stages that are relatively more upstream. In this case, we should find that subsidiaries are on average farther
from the final demand than parent companies.
Figure 3: Positions of parents and subsidiaries on the GVC
a) parents b) subsidiaries
Den
sity
0 .2 .4 .6 .8 1downstreamness
Den
sity
0 .2 .4 .6 .8 1downstreamness

10
On the contrary, in Figure 4, when we plot the differences in downstreamness between each parent
and any of its subsidiaries, we find that the median value is about zero in our data. Moreover, within-MNE
differences in position include both cases when the parent is more downstream than its subsidiary, and cases
when the subsidiaries are more downstream than the parent company. As downstreamness metrics are com-
prised in a range (0, 1), we also comment that the interquartile distance reported in the boxplot shows how
the parent company does not move too far along the supply chain for integration decisions. In our case,
most integration choices occur in smaller segments along the production sequence, whereas more distant
tasks are usually outsourced. We will specifically challenge this preliminary evidence in the econometric
analysis of Section 4.1.
Figure 4: Differences in downstreamness between any parent and its subsidiaries
In Figure 5, we finally report some descriptive statistics on the heterogeneity in size of MNEs in
our dataset. Up to 74% of MNEs integrated only one activity in one industry and in one country. This is the
yellow point in the sunflower graph reported in Figure 5. About 26% of MNEs integrated more than one
production stage. In fact, we retrieve few cases when parent companies control affiliates that are active in
more than 40 input industries and/or locate in more than 50 countries. Such heterogeneity in size after
integration choices is largely unaccounted for in previous literature. We will specifically address this evi-
dence in following Section 4.2.

11
Figure 5: Multiple integration choices within MNEs at country-industry level
4. Empirical results
In this Section, we test the determinants of vertical integration choices along GVCs without any constraint
on whether it is a buyer that integrates suppliers or a supplier that integrates a buyer. The first is a case of
backward vertical integration (VIB), which has been often studied in most recent trade literature, whereas
the second is a case of forward vertical integration (VIF) mostly neglected in the study of GVCs, but largely
analyzed in IO literature (see Section 2 for further discussion). Therefore, after exploiting a comprehensive
dataset on MNEs with a global coverage, we already showed in Section 3 how a multiplicity of organiza-
tional modes can be found in the real world, often including a combination of VIB and VIF strategies.
Crucially, we rely on the intuitions by Antràs and Chor (2013) and Alfaro et al. (2019), according
to which an economic interdependence is established along a supply chain and all suppliers must rely on a
final surplus realized when the final product is sold on the market. In this framework, three parameters
matter for the decision to integrate or not along the supply chain: i) the relative position on the technological
sequence; ii) the relative demand elasticities of inputs and final output; iii) the contractibility of single
production stages.
In this contribution, as a purely empirical exercise, we extend that framework to check how these
parameters correlate with vertical integration choices when we include VIF cases, in Section 4.1, and when
we consider a duplication of production processes performed by more than one subsidiary within the same
firm boundary, in Section 4.2.

12
4.1. Integrating backward and forward stages
We first provide evidence of the parents’ decision to integrate either backward or forward, as a function of
the relative position on the supply chain, the relative demand elasticities and the contractibility of each
production stage with respect to the output of headquarters. In what follows, we always exclude horizontal
integration choices, identified as activities in the same sector of the parent companies, since these integra-
tion decisions may be driven by different motivations, e.g. market-seeking strategies.
To study within-MNE integration decisions, we test a multinomial logit model with three possible
choices: outsourcing, backward integration (VIB), and forward integration (VIF), in the form:
𝜂𝑗𝑘𝑚 = 𝑙𝑜𝑔 𝜋𝑘𝑚
𝜋𝑘𝑀= 𝛼𝑚 + 𝒙𝑘
′ 𝛽𝑚
where the M-th base decision is an outsourcing strategy, against which the odds of 𝑚 = {𝑉𝐼𝐵, 𝑉𝐼𝐹} are
tested. The dependent variable is constructed considering whether at least one subsidiary exists in an MNE
that operates in a production stage classified according to 6-digit U.S. I-O tables sourced from the Bureau
of Economic Analysis. If the subsidiary is located more upstream than the parent, we have a VIB case, and
if the parent is located more upstream than the subsidiary, we have a VIF case. The vector of k-th stage-
specific regressors, 𝒙𝑘′ , includes: the (absolute value of the) difference between the downstreamness of the
parent and the downstreamness of the stage, to catch how far from the parent the decision to integrate falls;
the log difference between the elasticity of the parent output and the elasticity of the production stage, to
catch who has the highest bargaining power on the final markets. Finally, the own contractibility of the
single stage is included as following the methodology of Nunn (2007), in line with the liberal classification
by Rauch (1999): a non-contractible input is neither reference-priced nor traded on an organized exchange.
Parent-level fixed effects are included, and errors are clustered by parent companies.
Table 2 reports results expressed as relative risk ratios. In column 1, we start considering the entire
sample and in following columns we consider choices by parent companies originated in the European
Union, North America and Asia, respectively.

13
Table 2: Multinomial logit for backward and forward integration vis à vis outsourcing strategies
(1)
All countries
(2)
European
Union
(3)
North
America
(4)
Asia &
Africa
Backward integration
Differential downstreamness 0.378*** 0.330*** 0.184*** 0.514***
(0.029) (0.031) (0.043) (0.080)
Differential elasticity 1.745*** 1.787*** 1.780*** 1.712***
(0.030) (0.041) (0.099) (0.059)
Contractibility 0.275*** 0.240*** 0.099*** 0.337***
(0.025) (0.031) (0.038) (0.057)
Constant 0.004*** 0.005*** 0.007*** 0.011***
(0.001) (0.001) (0.001) (0.001)
Forward integration
Differential downstreamness 0.537*** 0.774*** 0.145*** 0.474***
(0.059) (0.142) (0.036) (0.081)
Differential elasticity 1.422*** 1.473*** 1.361*** 1.376***
(0.028) (0.043) (0.074) (0.049)
Contractibility 0.317*** 0.314*** 0.077*** 0.402***
(0.035) (0.052) (0.033) (0.073)
Constant 0.004*** 0.003*** 0.008*** 0.010***
(0.001) (0.001) (0.001) (0.001)
Observations 2,291,795 1,468,852 418,104 333,672
Pseudo R-squared 0.0092 0.0100 0.007 0.0083
Log pseudolikelihood -149,590.0 -79,992.3 -36,138.6 -38,343.2
Parent company FEs Yes Yes Yes Yes Note: Multinomial model with a control group based on the choice of outsourcing. Relative risk ratios are reported. Downstream-
ness is sourced from Antràs and Chor (2013). Elasticities of substitutions have been sourced from Broda and Weinstein (2006).
Contractibility is calculated following Rauch (1999), sourced from Antràs and Chor (2003). Standard errors clustered at parent
level in parentheses. ***, **, * stand for p-value <0.01, p-value <0.05 and p-value <0.10, respectively.
Interestingly, we find that results on both backward and forward integration are quite symmetric
along the determinants that we include in our specification, and coefficients are just slightly different in
magnitude across geographic areas. In fact, the relative risk ratios on differential downstreamness are al-
ways lower than one, implying that we have lower odds that an integrated stage will be far from the parent
company from a technological point of view, in line with what we already observed in Figure 4. This is
what was already found by Del Prete and Rungi (2017), in a context where VIF cases were not explicitly

14
considered. Furthermore, the relative risk ratios on the differential elasticity of substitution are always sig-
nificantly higher than one, implying that the parent company will more likely integrate activities with a
relatively lower elasticity of substitution, as it is also the side whose underinvestment could reduce rela-
tively less the final surplus realized on the market. Finally, relative risk ratios on industry-level contracti-
bility are always significantly lower than one, meaning that less contractible inputs are more likely inte-
grated than more contractible ones, in line with main tenets of the property rights theory of the firm6. No-
tably, in North America, including US, Canada and Mexico, the relative risk ratios on differential down-
streamness and contractibility of either VIB or VIF with respect to an outsourcing strategy have the lowest
magnitudes. In this case, it is possible that the good institutional environment in the origin country plays a
role, and the parent companies can better enforce their contracts in outsourced activities, if compared with
other origin countries.
Eventually, in Table 3, we introduce some checks on the robustness of our results when we adopt
alternative indicators of our main drivers of integration. In the first column, we exploit an alternative meas-
ure of downstreamness (DownMeasure) proposed by Antràs and Chor (2013), which further discounts more
upstream stages of production. In the second column, we switch to the more conservative measure of con-
tractibility originally proposed by Rauch (1999), which considers only the share of differentiated versus
undifferentiated products while excluding products with referenced prices. In column 3, we reduce integra-
tion choices considering only the top 100 input-output exchanges with the highest direct requirement coef-
ficients in the I-O tables, to avoid including stages less likely integration choices. In column 4, we include
in our sample only the parent companies whose core activity is a manufacturing product, to exclude activ-
ities that are less related to GVC like finance and non-tradable services. Please note how main findings
from Table 3 follow the patterns of the baseline in Table 2, although with slight differences in the magnitude
of the coefficients.
Table 3: Robustness checks on the multinomial choice of integration
(1)
DownMeasure
(2)
Conservative
measure of
contractibility
(3)
Top 100
input-output
relationships
(4)
Manufacturing
parents
Backward integration
6 There are also recurrent yet counterintuitive results of positive effect of contractibility on integration in the property
rights literature (Baker and Hubbard, 2004; Nunn and Trefler, 2013; Defever and Toubal, 2013).
.

15
Differential downstreamness 0.431*** 0.385*** 0.370*** 0.701***
(0.023) (0.029) (0.020) (0.102)
Differential elasticity 1.765*** 1.614*** 1.805*** 1.928***
(0.030) (0.029) (0.013) (0.053)
Contractibility 0.260*** 0.399*** 0.180*** 0.102***
(0.024) (0.014) (0.016) (0.019)
Constant 0.006*** 0.007*** 0.009*** 0.008***
(0.001) (0.001) (0.001) (0.001)
Forward integration
Differential downstreamness 0.183*** 0.522*** 0.175*** 0.359***
(0.023) (0.058) (0.022) (0.041)
Differential elasticity 1.404*** 1.586*** 1.030*** 1.510***
(0.028) (0.032) (0.021) (0.041)
Contractibility 0.295*** 0.258*** 0.218*** 0.288***
(0.032) (0.039) (0.024) (0.047)
Constant 0.005*** 0.004*** 0.006*** 0.009***
(0.001) (0.001) (0.001) (0.001)
Observations 2,291,795 2,291,795 958,400 629,803
Pseudo R-squared 0.0110 0.0116 0.0070 0.0129
Log pseudolikelihood -149,314.2 -149,219.8 -69,914.3 -63,784.8
Parent company FEs Yes Yes Yes Yes Note: Multinomial model with a control group based on the choice of outsourcing. Relative risk ratios are reported. Downstream-
ness is sourced from Antràs and Chor (2013). Elasticities of substitutions have been sourced from Broda and Weinstein (2006).
Contractibility is calculated following Rauch (1999), sourced from Antràs and Chor (2003). Standard errors clustered at parent
level in parentheses. ***, **, * stand for p-value <0.01, p-value <0.05 and p-value <0.10, respectively.
4.2. Duplicating stages along the GVC
In this section, we investigate whether and how more than one subsidiary controlled by a parent can perform
the same production stage in a given location within its corporate boundary. To this aim, we modify our
data structure, in line with Del Prete and Rungi (2017), to consider only those stages that were integrated.
That is, we lose the parent-industry dimension to switch to a parent and affiliate level dimension.
Consequently, our unit of observation is a pair made of a parent company (taken with its output) and any
of its controlled affiliates. From our total sample, we further select those parents that have concluded at
least one deal in the period 2004-2012, for which we have information on new incorporations and takeovers.
The duplication of production stages, considered along both the country and the industrial 6-digit
NAICS rev. 2007 dimensions, is a systematic feature of the corporate boundaries that we observe already
in Figure 5. In Figure 6, we report some more details on the relevance of this phenomenon. Although the

16
majority of affiliates (74%) are unique within corporate boundaries as they are the only productive units
devoted to the completion of a production stage in a location, a non negligible share of 26% of subsidiaries
do perform tasks that are already operated by other co-subsidiaries in a given location.7 Among these, about
13% are tasks performed by two co-subsidiaries, 5% performed by three co-subsidiaries, up to a maximum
of 446 redundancies within an MNE boundary.
Figure 6: Unique and multiple production stages performed by affiliates
To study multiple integration decisions, we start by testing a linear probability model with country-
level fixed effects as:
𝑀𝑢𝑙𝑡𝑖𝑝𝑙𝑒𝑖𝑗𝑘𝑐 = 𝛽0 + 𝛽1𝐷𝑖𝑓𝑓𝑒𝑟𝑒𝑛𝑡𝑖𝑎𝑙 𝑑𝑜𝑤𝑛𝑠𝑡𝑟𝑒𝑎𝑚𝑛𝑒𝑠𝑠𝑖𝑗𝑘𝑐 + 𝛽2𝐷𝑖𝑓𝑓𝑒𝑟𝑒𝑛𝑡𝑖𝑎𝑙 𝑒𝑙𝑎𝑠𝑡𝑖𝑐𝑖𝑡𝑦𝑖𝑗𝑘𝑐
+ 𝛽3𝐶𝑜𝑛𝑡𝑟𝑎𝑐𝑡𝑖𝑏𝑖𝑙𝑖𝑡𝑦𝑖𝑘𝑐 + 𝛽4𝑋𝑗 + 𝜇𝑐 + 𝜀𝑚𝑗
where 𝑀𝑢𝑙𝑡𝑖𝑝𝑙𝑒𝑖𝑗𝑘𝑐 is a binary variable equal to one when the parent j has integrated at least two affiliates
i active in the same industry k located in the same country c, and zero otherwise. The coefficients 𝛽1 and
𝛽2 catch the correlation with the absolute difference between the downstreamness of the parent j and that
of the affiliate i and the log difference of the two elasticities of substitution, respectively.
𝐶𝑜𝑛𝑡𝑟𝑎𝑐𝑡𝑖𝑏𝑖𝑙𝑖𝑡𝑦𝑖𝑘𝑐 is a proxy for the ability to sign a complete contract with a supplier in the industry of
7 The duplication of tasks also exists when we check for ’pure’ vertical integration strategies, once excluding horizontal integration
decisions, for affiliates that report the same downstreamness of the parent. In this case we report a 24% of affiliates performing
tasks already integrated within the corporate boundary.

17
the subsidiary, in line with Rauch (1999). 𝑋𝑗 are parent level controls, namely the number of affiliates within
the group, productivity, capital intensity, size and age. Finally, we introduce a full set of country-level fixed
effects ( 𝜇𝑐).
Table 4 shows that the farther the affiliate from the parent, either upstream or downstream, the less
likely a duplication of stage within a country occurs, as the coefficient on differential downstreamness is
significantly and negatively correlated with the dependent variable. Consistent with a recent literature, we
find that firms under common ownership tend to be proximate to the parent on a supply chain (Del Prete
and Rungi, 2017), and geographically closer to one another (Antràs and de Gortari, 2019; Atalay et al.,
2019). Newer to existing literature is the joint decision to co-locate more than one subsidiary performing
exactly the same production stage in the same country. We argue that such proximity, both in space and
along the GVC, allows a parent to more easily coordinate activities of the integrated firms, thereby possibly
increasing those firms’ productivity and, in turn, profitability, as for example tested by Giroud (2013) and
Kalnins and Lafontaine (2004; 2013).
Also, while the elasticities of substitution do not seem to play a role in the duplication of stages,
we find that a higher contractibility of that stage correlates with the presence of more subsidiaries involved
in its production process. This may be due to the fact that complex or highly differentiated inputs, which
entail a higher risk of imitation when technology may leak to competing producers, tend indeed not to be
dispersed among several units. Finally, as expected, we also find that bigger, younger and more capital-
intensive MNEs are more likely to duplicate stages of production.8
Table 4: Duplicating stages along GVCs
(1) (2) (3)
Differential downstreamness -0.425*** -0.497*** -0.523***
(0.025) (0.052) (0.044)
Differential elasticity 0.006 -0.007
(0.006) (0.006)
Contractibility 0.104*** 0.080**
(0.026) (0.032)
Number of affiliates 0.041***
(0.009)
Productivity -0.005
(0.007)
8 In Table A2 in Appendix, we show that our results are robust to the implementation of a probit model.

18
Capital intensity 0.033***
(0.007)
Size 0.012**
(0.006)
Age -0.024**
(0.010)
Constant 0.000 0.108*** -0.216***
(0.000) (0.033) (0.064)
Observations 260,886 72,931 58,396
R-squared 0.105 0.110 0.165
Country FEs Yes Yes Yes Note: Downstreamness is sourced from Antràs and Chor (2013). Elasticities of substitutions have been sourced from Broda and
Weinstein (2006). Contractibility is calculated following Rauch (1999), sourced from Antràs and Chor (2003). Standard errors
clustered at parent level in parentheses. ***, **, * stand for p-value <0.01, p-value <0.05 and p-value <0.10, respectively
In Table 5, we finally check whether our previous results are robust to sample compositions. We
first exclude horizontal strategies. Then we only include either VIB or VIF. In column 4 we exclusively
consider manufacturing parents, while in column 5 we test only new investments in our sample, i.e. those
occurred between 2004 and 2012, for which we have information on new incorporations and takeovers. In
the last column, in place of a dummy variable, we use the number of multiple stages as a dependent variable.
In all these cases our main findings are confirmed.
Table 5: Sample compositions for the integration of duplicated stages
(1) (2) (3) (4) (5) (6)
No Hori-
zontal VIB VIF
Manufactur-
ing parents
New
investments
Number
of multi-
ple stages
Differential
downstreamness -0.116*** -0.086* -0.152*** -0.316*** -0.508*** -1.640***
(0.039) (0.051) (0.056) (0.039) (0.045) (0.202)
Differential
elasticity -0.001 0.006 -0.010 -0.001 -0.032*** -0.042*
(0.006) (0.008) (0.008) (0.007) (0.008) (0.023)
Contractibility 0.085** 0.090** 0.062 0.148*** 0.139*** -0.064
(0.040) (0.042) (0.083) (0.039) (0.043) (0.118)
Constant -0.276*** -0.318*** -0.227*** -0.345*** -0.241*** -0.524**
(0.060) (0.065) (0.085) (0.067) (0.068) (0.236)
Observations 43,017 23,083 19,934 39,808 19,452 58,396
R-squared 0.122 0.133 0.119 0.145 0.178 0.244

19
Country FEs Yes Yes Yes Yes Yes Yes
Firm ctrls Yes Yes Yes Yes Yes Yes
Note: Downstreamness is sourced from Antràs and Chor (2013). Elasticities of substitutions have been sourced from Broda and
Weinstein (2006). Contractibility is calculated following Rauch (1999), sourced from Antràs and Chor (2003). Standard errors
clustered at parent level in parentheses. ***, **, * stand for p-value <0.01, p-value <0.05 and p-value <0.10, respectively
5. Conclusions
The voluminous literature on vertical integration choices has largely neglected the possibility that firms
may find optimal to integrate both upstream and downstream along the supply chain. As a matter of fact, a
key assumption of these models is that integration decisions are one-directional, i.e., companies can go
either backward or forward but not in both directions.
In this paper, using a global dataset of activities by MNEs, we first document the coexistence of
backward and forward integration strategies along the GVCs. Second, our results show that the decision to
integrate falls on activities with a relatively low elasticity of substitution and tend to target production stages
that are technologically closer along the chain, possibly to maximize coordination efforts. Finally, we sys-
tematically find a duplication of production stages in our data, as they are performed by different subsidi-
aries within the same corporate boundary.
From our point of view, the above results call for a refinement of existing theoretical models, ac-
cording to which integration always starts from either the top or the bottom of the supply chain, and only
one supplier of an intermediate input is needed on the technological sequence.

20
References
Acemoglu, D., P. Antràs, and E. Helpman (2007). Contracts and Technology Adoption. American Eco-
nomic Review 97(3), 916–943.
Acemoglu, D., R. Griffith, P. Aghion, and F. Zilibotti (2010). Vertical integration and technology: theory
and evidence. Journal of the European Economic Association 8(5), 989–1033.
Alfaro, L. and A. Charlton (2009). "Intra-industry Foreign Direct Investment". American Economic Review
99(5), 2096–2119.
Alfaro, L., P. Conconi, H. Fadinger, and A. Newman (2016). Do Price Determine Vertical Integration?.
Review of Economic Studies 83, 1–35.
Alfaro, L., Chor, D., Antras, P., & Conconi, P. (2019). Internalizing global value chains: A firm-level anal-
ysis. Journal of Political Economy, 127(2), 508-559.
Alviarez, V., J. Cravino, and A. A, Levchenko (2016). The Growth of Multinational Firms in the Great
Recession. Journal of Monetary Economics 85, 50–64.
Antràs, P. (2003). Firms, Contracts, And Trade Structure. The Quarterly Journal of Economics, 118(4),
1375–1418.
Antràs, P. and E. Helpman (2004). Global Sourcing. Journal of Political Economy 112(3), 552–580.
Antràs, P., Chor, D., (2013). Organizing the global value chain. Econometrica 81 (6), 2127–2204.
Antràs, P., & De Gortari, A. (2017). On the geography of global value chains. (No. w23456). National
Bureau of Economic Research.
Atalay, E., Hortaçsu, A., Li, M. J., & Syverson, C. (2019). How wide is the firm border?. The Quarterly
Journal of Economics, 134(4), 1845-1882.
Baker, G. P., & Hubbard, T. N. (2004). Contractibility and asset ownership: On-board computers and gov-
ernance in US trucking. The Quarterly Journal of Economics, 119(4), 1443-1479.
Bartlett, C. A., & Ghoshal, S. (2000). Going Global. Harvard Business Review, 78(2), 132-141.
Broda, C. and D. Weinstein (2006). Globalization and the Gains From Variety. Quarterly Journal of Eco-
nomics 121(2), 541–585.
Cravino, J. and A. A. Levchenko (2016). "Multinational Firms and International Business Cycle Transmis-
sion". The Quarterly Journal of Economics, 132(2), 921-962.
Defever, F., & Toubal, F. (2013). Productivity, relationship-specific inputs and the sourcing modes of mul-
tinationals. Journal of Economic Behavior & Organization, 94, 345-357.
Del Prete, D. and A. Rungi (2017), Organizing the Global Value Chain: a firm level test, Journal of Inter-
national Economics, 109, 16-30. ISSN: 0022-1996, doi: 10.1016/j.jinteco.2017.08.003
Giroud, X. (2013), Proximity and Investment: Evidence from Plant-Level Data, Quarterly Journal of Eco-
nomics, 128, 861–915.
21
Grossman, S. J., & Hart, O. D. (1986). The costs and benefits of ownership: A theory of vertical and lateral
integration. Journal of Political Economy, 94(4), 691-719.
Hart, O., & Moore, J. (1990). Property Rights and the Nature of the Firm. Journal of Political Economy,
98(6), 1119-1158.
Kalnins, A., and F. Lafontaine (2004), Multi-unit Ownership in Franchising: Evidence from the Fast-Food
Industry in Texas,” RAND Journal of Economics, 35, 747–61.
Kalnins, A., and F. Lafontaine (2013), Too Far Away? The Effect of Distance to Headquarters on Business
Establishment Performance, American Economic Journal: Microeconomics, 5, 157–79
Lafontaine, F. (1992). Agency theory and franchising: some empirical results. RAND journal of Economics,
23(2), 263-283.
Lafontaine, F., & Shaw, K. L. (1999). The dynamics of franchise contracting: Evidence from panel data.
Journal of Political Economy, 107(5), 1041-1080.
Lafontaine, F., & Slade, M. (2007). Vertical integration and firm boundaries: The evidence. Journal of
Economic Literature, 45(3), 629-685.
MengXiao, L., (2019). The Missing Option in Firm Boundary Decisions, mimeo.
Minkler, A. P., & Park, T. A. (1994). Asset specificity and vertical integration in franchising. Review of
Industrial Organization, 9(4), 409-423.
Nunn, N. (2007). "Relationship-specificity, incomplete contracts, and the pattern of trade". Quarterly Jour-
nal of Economics 122(2), 569–600.
Nunn, N., & Trefler, D. (2013). Incomplete contracts and the boundaries of the multinational firm. Journal
of Economic Behavior & Organization, 94, 330-344.
OECD (2005). "Guidelines for Multinational Enterprises". OECD, Paris.
Rauch, J. E. (1999). "Networks versus markets in international trade". Journal of International Economics
48(1), 7–35.
Rungi, A. and Del Prete, D. (2018). The smile curve at the firm level: Where value is added along supply
chains. Economics Letters, 164, 38-42.
Rungi, A., Morrison G. and Pammolli F. (2019) Global Ownership and Hierarchies of Firms. That Which
is Essential is Invisible to the Eye, mimeo.
Scott, F. A. (1995). Franchising vs. company ownership as a decision variable of the firm. Review of In-
dustrial Organization, 10(1), 69-81.
UNCTAD (2009). "Training Manual on Statistics for FDI and the Operations of TNCs Vol. II.". United
Nations.
UNCTAD (2016). "World Investment Report 2016". United Nations

22
Woodruff, C. (2002). Non-contractible investments and vertical integration in the Mexican footwear indus-
try. International Journal of Industrial Organization, 20(8), 1197-1224.
23
Appendix
Table A1: Sample coverage
Origin country Parent companies %
Domestic sub-
sidiaries %
Foreign sub-
sidiaries %
European Union 111.522 55,41% 233.714 46,77% 408.674 56,58%
of which:
Germany 11.261 5,59% 36.759 7,36% 44.135 6,11%
France 6.650 3,30% 25.905 5,18% 39.949 5,53%
United Kingdom 12.361 6,14% 44.266 8,86% 57.820 8,00%
Italy 8.680 4,31% 17.362 3,47% 26.800 3,71%
Spain 5.530 2,75% 22.043 4,41% 19.826 2,74%
United States 22.511 11,18% 133.205 26,66% 115.339 15,97%
Russia 974 0,48% 2.432 0,49% 1.597 0,22%
Asia 19.142 9,51% 71.849 14,38% 114.707 15,88%
of which:
Japan 3.259 1,62% 25.749 5,15% 33.789 4,68%
China 2.995 1,49% 10.076 2,02% 6.111 0,85%
India 1.501 0,75% 4.357 0,87% 6.479 0,90%
Africa 4.169 2,07% 6.027 1,21% 12.791 1,77%
Latin America 18.247 9,07% 3.262 0,65% 10.273 1,42%
of which:
Brazil 342 0,17% 1.196 0,24% 2.334 0,32%
Argentina 126 0,06% 187 0,04% 239 0,03%
Mexico 322 0,16% 1.041 0,21% 1.306 0,18%
Australia 2.771 1,38% 19.108 3,82% 11.429 1,58%
Rest of the world 21.936 10,90% 30.120 6,03% 47.545 6,58%
TOTAL 201.272 100,00% 499.717 100,00% 722.355 100,00%

24
Table A2: Probit model for duplicating stages along GVCs
(1) (2) (3)
Differential downstreamness -1.189*** -1.361*** -1.505***
(0.072) (0.144) (0.133)
Differential elasticity 0.018 -0.020
(0.016) (0.018)
Contractibility 0.290*** 0.240**
(0.073) (0.095)
Number of affiliates 0.118***
(0.026)
Productivity -0.014
(0.021)
Capital intensity 0.095***
(0.022)
Size 0.034**
(0.017)
Age -0.071**
(0.031)
Constant -1.243*** -0.122 -1.041*
(0.461) (0.441) (0.543)
Observations 260,333 72,487 58,032
Pseudo R-squared 0.077 0.079 0.124
Country FEs Yes Yes Yes
Note: Downstreamness is sourced from Antràs and Chor (2013). Elasticities of substitutions have been sourced from Broda and
Weinstein (2006). Contractibility is calculated following Rauch (1999), sourced from Antràs and Chor (2003). Standard errors
clustered at parent level in parentheses. ***, **, * stand for p-value <0.01, p-value <0.05 and p-value <0.10, respectively


![Ppt0000011.ppt [Lecture seule]...Message-passing on chains Global minimum in linear time Optimization proceeds in two passes: Forward pass (dynamic programming) Backward pass prq s](https://static.fdocuments.in/doc/165x107/5ff8631a599c3e071c6bba30/lecture-seule-message-passing-on-chains-global-minimum-in-linear-time-optimization.jpg)