background using lunar occultation - arXiv
13
MNRAS 000, 1–13 (2017) Preprint 6 September 2018 Compiled using MNRAS L A T E X style file v3.0 Measuring the global 21-cm signal with the MWA-I: improved measurements of the Galactic synchrotron background using lunar occultation B. McKinley, 1 ,2 ,3 ? G. Bernardi, 4 ,5 ,6 C. M. Trott, 1 ,2 ,3 J. L. B. Line, 7 ,3 R. B. Wayth, 1 ,2 ,3 A. R. Offringa, 8 B. Pindor, 7 ,2 ,3 C. H. Jordan, 1 ,2 ,3 M. Sokolowski, 1 ,2 S. J. Tingay, 1 E. Lenc, 9 ,2 N. Hurley-Walker, 1 J. D. Bowman, 10 F. Briggs, 11 R. L. Webster 7 ,2 ,3 1 International Centre for Radio Astronomy Research, Curtin University, Bentley, WA 6102, Australia 2 ARC Centre of Excellence for All-sky Astrophysics (CAASTRO),Curtin University, Bentley, WA 6102, Australia 3 ARC Centre of Excellence for All Sky Astrophysics in 3 Dimensions (ASTRO 3D), Curtin University, Bentley 6845 Australia 4 INAF-Istituto di Radioastronomia, via Gobetti 101, 40129, Bologna, Italy 5 Department of Physics and Electronics, Rhodes University, P.O. Box 94, Grahamstown, 6140, South Africa 6 Square Kilometre Array South Africa (SKA SA), Park Road, Pinelands 7405, South Africa 7 School of Physics, The University of Melbourne, Parkville, VIC 3010, Australia 8 Netherlands Institute for Radio Astronomy (ASTRON), Postbus 2, 7990 AA Dwingeloo, The Netherlands 9 Sydney Institute for Astronomy, School of Physics, The University of Sydney, NSW 2006, Australia 10 School of Earth and Space Exploration, Arizona State University, Tempe, AZ 8528USA 11 Research School of Astronomy and Astrophysics, Australian National University, Canberra, ACT 2611, Australia Accepted XXX. Received YYY; in original form ZZZ ABSTRACT We present early results from a project to measure the sky-averaged (global), redshifted 21 cm signal from the Epoch of Reionisation (EoR), using the Murchison Widefield Ar- ray (MWA) telescope. Because interferometers are not sensitive to a spatially-invariant global average, they cannot be used to detect this signal using standard techniques. However, lunar occultation of the radio sky imprints a spatial structure on the global signal, allowing us to measure the average brightness temperature of the patch of sky immediately surrounding the Moon. In this paper we present one night of Moon ob- servations with the MWA between 72 – 230 MHz and verify our techniques to extract the background sky temperature from measurements of the Moon’s flux density. We improve upon previous work using the lunar occultation technique by using a more sophisticated model for reflected ‘earthshine’ and by employing image differencing to remove imaging artefacts. We leave the Moon’s (constant) radio brightness tempera- ture as a free parameter in our fit to the data and as a result, measure T moon = 180±12 K and a Galactic synchrotron spectral index of -2.64 ± 0.14, at the position of the Moon. Finally, we evaluate the prospects of the lunar occultation technique for a global EoR detection and map out a way forward for future work with the MWA. Key words: dark ages, reionization, first stars – Moon – techniques: interferometric 1 INTRODUCTION Many experiments are now underway to detect and charac- terise redshifted 21 cm emission from the Epoch of Reion- isation (EoR) and the cosmic dark ages. This signal pro- vides the most promising avenue for exploring these early epochs in the Universe’s history, however it is difficult to observe for two fundamental reasons. Firstly, the signal is ? E-mail:[email protected] weak and shrouded by bright astrophysical foregrounds and secondly, systematic instrumental effects contaminate the observations, requiring experiments to have unprecedented levels of calibration precision. Experiments to measure the redshifted 21 cm signal from the early Universe can be separated into two broad categories; those attempting to measure spatial fluctuations in the signal as a function of angular scale and frequency, and those attempting to measure the total power of the signal as a function of frequency, by averaging across the whole sky. © 2017 The Authors arXiv:1809.01351v1 [astro-ph.CO] 5 Sep 2018
Transcript of background using lunar occultation - arXiv

MNRAS 000, 1–13 (2017) Preprint 6 September 2018 Compiled using MNRAS LATEX style file v3.0
Measuring the global 21-cm signal with the MWA-I:improved measurements of the Galactic synchrotronbackground using lunar occultation
B. McKinley,1,2,3? G. Bernardi,4,5,6 C. M. Trott,1,2,3 J. L. B. Line,7,3 R. B. Wayth,1,2,3
A. R. Offringa,8 B. Pindor,7,2,3 C. H. Jordan,1,2,3 M. Sokolowski,1,2 S. J. Tingay,1
E. Lenc,9,2 N. Hurley-Walker,1 J. D. Bowman,10 F. Briggs,11 R. L. Webster7,2,31International Centre for Radio Astronomy Research, Curtin University, Bentley, WA 6102, Australia2ARC Centre of Excellence for All-sky Astrophysics (CAASTRO),Curtin University, Bentley, WA 6102, Australia3ARC Centre of Excellence for All Sky Astrophysics in 3 Dimensions (ASTRO 3D), Curtin University, Bentley 6845 Australia4INAF-Istituto di Radioastronomia, via Gobetti 101, 40129, Bologna, Italy5Department of Physics and Electronics, Rhodes University, P.O. Box 94, Grahamstown, 6140, South Africa6Square Kilometre Array South Africa (SKA SA), Park Road, Pinelands 7405, South Africa7School of Physics, The University of Melbourne, Parkville, VIC 3010, Australia8Netherlands Institute for Radio Astronomy (ASTRON), Postbus 2, 7990 AA Dwingeloo, The Netherlands9Sydney Institute for Astronomy, School of Physics, The University of Sydney, NSW 2006, Australia10School of Earth and Space Exploration, Arizona State University, Tempe, AZ 8528USA11Research School of Astronomy and Astrophysics, Australian National University, Canberra, ACT 2611, Australia
Accepted XXX. Received YYY; in original form ZZZ
ABSTRACTWe present early results from a project to measure the sky-averaged (global), redshifted21 cm signal from the Epoch of Reionisation (EoR), using the Murchison Widefield Ar-ray (MWA) telescope. Because interferometers are not sensitive to a spatially-invariantglobal average, they cannot be used to detect this signal using standard techniques.However, lunar occultation of the radio sky imprints a spatial structure on the globalsignal, allowing us to measure the average brightness temperature of the patch of skyimmediately surrounding the Moon. In this paper we present one night of Moon ob-servations with the MWA between 72 – 230 MHz and verify our techniques to extractthe background sky temperature from measurements of the Moon’s flux density. Weimprove upon previous work using the lunar occultation technique by using a moresophisticated model for reflected ‘earthshine’ and by employing image differencing toremove imaging artefacts. We leave the Moon’s (constant) radio brightness tempera-ture as a free parameter in our fit to the data and as a result, measure Tmoon = 180±12 Kand a Galactic synchrotron spectral index of −2.64±0.14, at the position of the Moon.Finally, we evaluate the prospects of the lunar occultation technique for a global EoRdetection and map out a way forward for future work with the MWA.
Key words: dark ages, reionization, first stars – Moon – techniques: interferometric
1 INTRODUCTION
Many experiments are now underway to detect and charac-terise redshifted 21 cm emission from the Epoch of Reion-isation (EoR) and the cosmic dark ages. This signal pro-vides the most promising avenue for exploring these earlyepochs in the Universe’s history, however it is difficult toobserve for two fundamental reasons. Firstly, the signal is
? E-mail:[email protected]
weak and shrouded by bright astrophysical foregrounds andsecondly, systematic instrumental effects contaminate theobservations, requiring experiments to have unprecedentedlevels of calibration precision.
Experiments to measure the redshifted 21 cm signalfrom the early Universe can be separated into two broadcategories; those attempting to measure spatial fluctuationsin the signal as a function of angular scale and frequency, andthose attempting to measure the total power of the signal asa function of frequency, by averaging across the whole sky.
© 2017 The Authors
arX
iv:1
809.
0135
1v1
[as
tro-
ph.C
O]
5 S
ep 2
018

2 B. McKinley et al.
The former category, with instruments such as the Murchi-son Widefield Array (MWA; Tingay et al. 2013; Bowman etal. 2013; Beardsley 2016), the LOw Frequency ARray (LO-FAR; van Haarlem et al. 2013; Patil et al. 2017), the Pre-cision Array to Probe the Epoch of Reionization (PAPER;Parsons et al. 2014) and the Hydrogen Epoch of ReionizationArray (HERA; Pober et al. 2014; DeBoer et al. 2016), areemploying radio interferometers to measure spatial fluctua-tions by means of power spectra. Future instruments, suchas the Square Kilometre Array (SKA; Dewdney et al. 2010),will be able to directly image the fluctuations (Koopmanset al. 2015).
The latter category of experiments, including the Ex-periment to Detect the Global EoR Signature (EDGES;Rogers, Bowman & Hewitt 2008; Rogers & Bowman 2008;Bowman & Rogers 2010; Monsalve et al. 2017b; Bowmanet al. 2018), the Shaped Antenna measurement of the back-ground RAdio Spectrum (SARAS; Patra et al. 2013 andSARAS2; Singh et al. 2017a,b), the Large Aperture Ex-periment to Detect the Dark Age (LEDA; Bernardi et al.2016), the Dark Ages Radio Explorer (DARE; Burns et al.2012), Discovering the Sky at the Longest wavelength (DSL;Boonstra et al. 2016), the Broadband Instrument for GlobalHydrOgen ReioNisation Signal (BIGHORNS; Sokolowski etal. 2015b) and SCI-HI (Voytek et al. 2014) use (or will use)single-antennas to measure the all-sky or ‘global’ signal. Thisapproach has the advantage of an increased signal-to-noiseratio (SNR), but is challenging due to systematic instru-mental effects (Monsalve et al. 2017a; Singh et al. 2017a;Sokolowski et al. 2015b).
The first detection of the global, redshifted 21 cm signalhas been claimed by EDGES (Bowman et al. 2018), whodetect an absorption trough at 78 MHz, which is thoughtto coincide with the early cooling and then reheating ofthe gas in the Universe during Cosmic Dawn. While thefrequency of the absorption trough observed by Bowmanet al. (2018) is expected from theoretical predictions andmodelling of the Cosmic Dawn (Pritchard & Loeb 2010;Cohen et al. 2017), the large amplitude and flattened pro-file of the absorption trough require new physics to explain(Barkana 2018). Our observing band, with a lower boundof 72 MHz, partially overlaps with the observed absorptiontrough, which is 19 MHz wide. Therefore, the MWA lunaroccultation experiment provides an important means to ver-ify the EDGES result, since it is subject to very differentsystematics.
The idea to use the Moon as a thermal reference sourcein an interferometric measurement of the global EoR sig-nal was first presented by Shaver et al. (1999). This ap-proach, which has been investigated further by McKinley etal. (2013) and Vedantham et al. (2015), combines the advan-tages of an interferometer, such as immunity from frequency-dependent receiver-noise bias and the ability to spatially iso-late reflected RFI signals, with the increased SNR of a globalexperiment. Using interferometric techniques also reducesthe effects of frequency-dependent antenna beam responsethat can cause artificial spectral structure in global signalobservations (e.g., Vedantham et al. 2014; Bernardi et al.2015; Mozdzen et al. 2016).
In this paper we present new results from lunar obser-vations with the MWA, which demonstrate our ability tomeasure the average temperature of a Moon-sized patch of
the sky across a frequency range 72 – 230 MHz. This isthe first paper in a series that will describe the MWA lunaroccultation experiment. We begin by reviewing the theorybehind the lunar occultation technique in Section 2. In Sec-tion 3 we describe our observations with the MWA, followedby the details of the data reduction and modelling in Sec-tion 4, which includes earthshine mitigation. In section 5, wepresent our results and analysis. In Section 6 we discuss ourresults in the context of other experiments and the prospectsfor detecting the global EoR signal using the lunar occulta-tion technique. We conclude in Section 7 and outline thepath forward for the MWA lunar occultation experiment.
2 THEORY
Interferometers are not completely insensitive to the globalaverage temperature of the sky, but the sensitivity dropsoff rapidly as a function of baseline length such that onlythe very shortest baselines (a few wavelengths) are sensitiveto the signal (see Singh et al. 2015 and Vedantham et al.2015). Presley et al. (2015) suggested that the sensitivityto the global signal by an interferometer is due to the spa-tial imprint of the primary beam shape causing an overlapwith the ‘zero baseline’ in (u, v) space, and that this couldbe exploited by using very closely spaced antennas, with suf-ficiently large apertures. However Singh et al. (2015) haveshown that it is in fact not possible to build such antennasclose enough together to get any overlap with the origin inthe (u, v) plane, without shadowing of the antennas occur-ring. Rather, interferometers are inherently sensitive to aglobal signal because, even for a uniform sky, the coherencefunction sampled by an interferometer does extend beyondthe origin, and there are methods that can be used to extendthis sensitivity out to longer baseline lengths (Singh et al.2015).
One such method to extend the sensitivity of an inter-ferometer to the global signal out to longer baseline lengthsis the lunar occultation technique (see Vedantham et al. 2015for a full description). Using this technique the flux densityof the Moon, Sm(ν), as a function of frequency ν, can bemeasured (so long as the angular scales corresponding tothe Moon’s disk are adequately sampled) and converted toa brightness temperature, ∆T(ν) in K, by:
∆T(ν) = 10−26c2Sm(ν)2kΩν2 , (1)
where ν is the frequency in Hz, c is the speed of light inm s−1, k is the Boltzmann constant in units of m2 kg s−2 K−1,Sm(ν) is the measured flux density of the Moon in Jy andΩ is the solid angle subtended by the Moon, which, dur-ing these observations, was 7.365 × 10⁻⁵ sr. We calculate Ωin sr by first calculating the angular area of the Moon insquare degrees using the value of the Moon’s angular radiuson 2015 September 26 as seen from the MRO, computedusing pyephem (Rhodes 2011) and then dividing this bythe angular area of one sr expressed in square degrees (seeGuthrie 1947).
Since the ‘zero baseline’, average signal is missing inthe interferometer measurements, the brightness tempera-ture ∆T(ν) in K, represents the difference between the to-tal lunar brightness temperature, Tlunar(ν), and the average
MNRAS 000, 1–13 (2017)
Global EoR signal with the Moon and the MWA 3
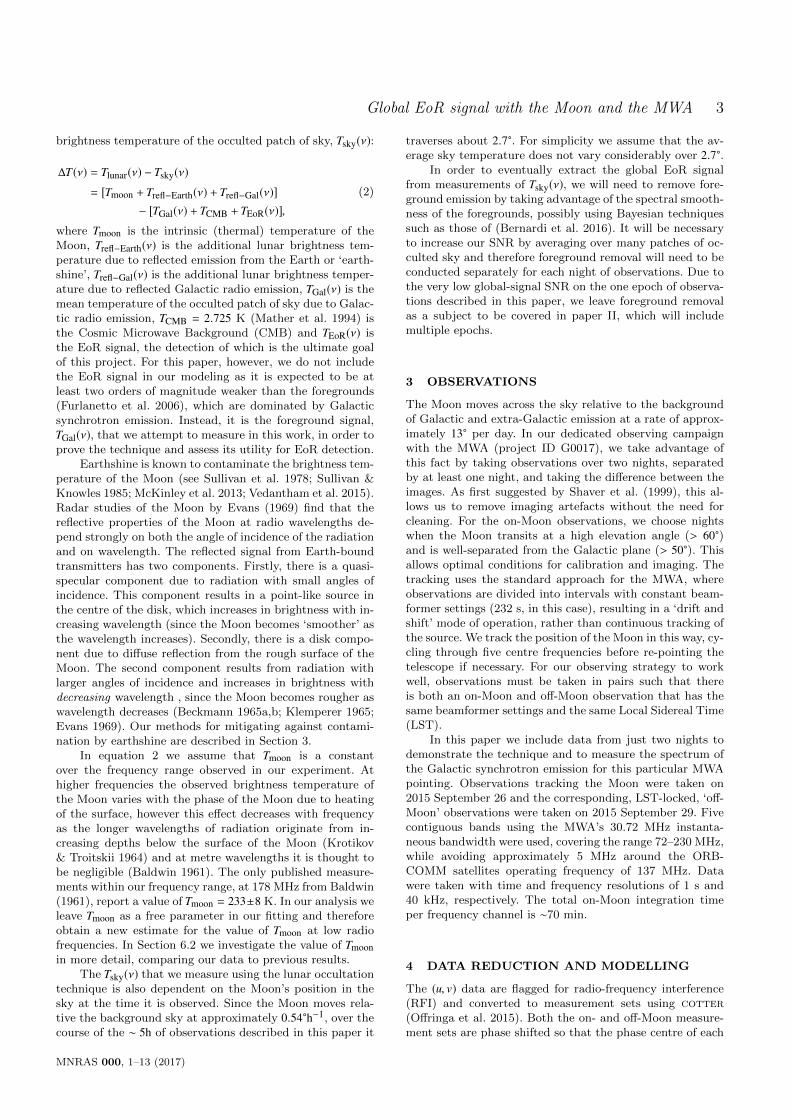
brightness temperature of the occulted patch of sky, Tsky(ν):
∆T(ν) = Tlunar(ν) − Tsky(ν)= [Tmoon + Trefl−Earth(ν) + Trefl−Gal(ν)]
− [TGal(ν) + TCMB + TEoR(ν)],(2)
where Tmoon is the intrinsic (thermal) temperature of theMoon, Trefl−Earth(ν) is the additional lunar brightness tem-perature due to reflected emission from the Earth or ‘earth-shine’, Trefl−Gal(ν) is the additional lunar brightness temper-ature due to reflected Galactic radio emission, TGal(ν) is themean temperature of the occulted patch of sky due to Galac-tic radio emission, TCMB = 2.725 K (Mather et al. 1994) isthe Cosmic Microwave Background (CMB) and TEoR(ν) isthe EoR signal, the detection of which is the ultimate goalof this project. For this paper, however, we do not includethe EoR signal in our modeling as it is expected to be atleast two orders of magnitude weaker than the foregrounds(Furlanetto et al. 2006), which are dominated by Galacticsynchrotron emission. Instead, it is the foreground signal,TGal(ν), that we attempt to measure in this work, in order toprove the technique and assess its utility for EoR detection.
Earthshine is known to contaminate the brightness tem-perature of the Moon (see Sullivan et al. 1978; Sullivan &Knowles 1985; McKinley et al. 2013; Vedantham et al. 2015).Radar studies of the Moon by Evans (1969) find that thereflective properties of the Moon at radio wavelengths de-pend strongly on both the angle of incidence of the radiationand on wavelength. The reflected signal from Earth-boundtransmitters has two components. Firstly, there is a quasi-specular component due to radiation with small angles ofincidence. This component results in a point-like source inthe centre of the disk, which increases in brightness with in-creasing wavelength (since the Moon becomes ‘smoother’ asthe wavelength increases). Secondly, there is a disk compo-nent due to diffuse reflection from the rough surface of theMoon. The second component results from radiation withlarger angles of incidence and increases in brightness withdecreasing wavelength , since the Moon becomes rougher aswavelength decreases (Beckmann 1965a,b; Klemperer 1965;Evans 1969). Our methods for mitigating against contami-nation by earthshine are described in Section 3.
In equation 2 we assume that Tmoon is a constantover the frequency range observed in our experiment. Athigher frequencies the observed brightness temperature ofthe Moon varies with the phase of the Moon due to heatingof the surface, however this effect decreases with frequencyas the longer wavelengths of radiation originate from in-creasing depths below the surface of the Moon (Krotikov& Troitskii 1964) and at metre wavelengths it is thought tobe negligible (Baldwin 1961). The only published measure-ments within our frequency range, at 178 MHz from Baldwin(1961), report a value of Tmoon = 233±8 K. In our analysis weleave Tmoon as a free parameter in our fitting and thereforeobtain a new estimate for the value of Tmoon at low radiofrequencies. In Section 6.2 we investigate the value of Tmoonin more detail, comparing our data to previous results.
The Tsky(ν) that we measure using the lunar occultationtechnique is also dependent on the Moon’s position in thesky at the time it is observed. Since the Moon moves rela-tive the background sky at approximately 0.54°h−1, over thecourse of the ∼ 5h of observations described in this paper it
traverses about 2.7°. For simplicity we assume that the av-erage sky temperature does not vary considerably over 2.7°.
In order to eventually extract the global EoR signalfrom measurements of Tsky(ν), we will need to remove fore-ground emission by taking advantage of the spectral smooth-ness of the foregrounds, possibly using Bayesian techniquessuch as those of (Bernardi et al. 2016). It will be necessaryto increase our SNR by averaging over many patches of oc-culted sky and therefore foreground removal will need to beconducted separately for each night of observations. Due tothe very low global-signal SNR on the one epoch of observa-tions described in this paper, we leave foreground removalas a subject to be covered in paper II, which will includemultiple epochs.
3 OBSERVATIONS
The Moon moves across the sky relative to the backgroundof Galactic and extra-Galactic emission at a rate of approx-imately 13° per day. In our dedicated observing campaignwith the MWA (project ID G0017), we take advantage ofthis fact by taking observations over two nights, separatedby at least one night, and taking the difference between theimages. As first suggested by Shaver et al. (1999), this al-lows us to remove imaging artefacts without the need forcleaning. For the on-Moon observations, we choose nightswhen the Moon transits at a high elevation angle (> 60°)and is well-separated from the Galactic plane (> 50°). Thisallows optimal conditions for calibration and imaging. Thetracking uses the standard approach for the MWA, whereobservations are divided into intervals with constant beam-former settings (232 s, in this case), resulting in a ‘drift andshift’ mode of operation, rather than continuous tracking ofthe source. We track the position of the Moon in this way, cy-cling through five centre frequencies before re-pointing thetelescope if necessary. For our observing strategy to workwell, observations must be taken in pairs such that thereis both an on-Moon and off-Moon observation that has thesame beamformer settings and the same Local Sidereal Time(LST).
In this paper we include data from just two nights todemonstrate the technique and to measure the spectrum ofthe Galactic synchrotron emission for this particular MWApointing. Observations tracking the Moon were taken on2015 September 26 and the corresponding, LST-locked, ‘off-Moon’ observations were taken on 2015 September 29. Fivecontiguous bands using the MWA’s 30.72 MHz instanta-neous bandwidth were used, covering the range 72–230 MHz,while avoiding approximately 5 MHz around the ORB-COMM satellites operating frequency of 137 MHz. Datawere taken with time and frequency resolutions of 1 s and40 kHz, respectively. The total on-Moon integration timeper frequency channel is ∼70 min.
4 DATA REDUCTION AND MODELLING
The (u, v) data are flagged for radio-frequency interference(RFI) and converted to measurement sets using cotter(Offringa et al. 2015). Both the on- and off-Moon measure-ment sets are phase shifted so that the phase centre of each
MNRAS 000, 1–13 (2017)
4 B. McKinley et al.
LST-locked pair of observations is at the coordinates of theMoon’s position during the observation. The data are thencalibrated using calibrate, developed by Offringa et al.(2016), and a sky model generated from multi-frequencyradio data with the Positional Update and Matching Al-gorithm (puma; Line et al. 2017). Dirty images in instru-mental polarisation are produced using wsclean (Offringaet al. 2014). We use uniform weighting to avoid contami-nation from large-scale structure and increase our angularresolution for characterisation of quasi-specular earthshine.Although using uniform weighting does reduce the MWAsensitivity, on the scales associated with the Moon it doesnot have a significant effect. Using natural weighting for theimaging was trialled and found not to have a large impacton our results, apart from increasing the size of the errorbars in the final spectrum.
We use an image size of 2048 × 2048 pixels, covering a∼17° field of view and having a bandwidth of 1.28 MHz.The synthesised beam size ranges from a full-width-half-maximum (FWHM) of approximately 6 arcmin at the low-est frequency to 2 arcmin at the highest frequency. To sim-plify the modelling process which is to follow, the same pixelsize of 0.0085° (0.′51) is used across the full frequency range.The images are primary-beam corrected and converted toStokes images using pbcorrect (Offringa et al. 2016) andthe MWA primary beam model of Sokolowski et al. (2017).To check for poorly calibrated images, a simple root-mean-square (rms) threshold check is made on each image. If themeasured rms of a patch of the image close to, but not in-cluding, the Moon is below a specified threshold then theLST-locked on-Moon and off-Moon Stokes I image pairs aredifferenced and saved. A point spread function (PSF) imageis also produced at each frequency for each observation.
The ionosphere may have a strong impact on globalEoR experiments, due primarily to frequency-dependent ab-sorption and emission that can corrupt the redshifted 21 cmsignal (Vedantham et al. 2014; Datta et al. 2016). However,Sokolowski et al. (2015a) have shown that these effects mayaverage to zero over long integrations, hence our approachto observe over many nights. We therefore do not considerthese effects further in this paper. Refractive ionosphericeffects, however, are particularly problematic for our exper-iment, which relies upon making difference images betweentwo nights with potentially different ionospheric conditions.The ionospheric conditions over the MWA have been studiedby Jordan et al. (2017) who find that 74% of MWA observa-tions can be classified as having little to no active ionosphericactivity. The data selected for this paper were chosen fromsuch a quiet night, where ionospheric effects can effectivelybe ignored. This can be seen by the minimal mis-subtractionof radio sources in our difference images (see Fig. 1, panelsA and D).
We implement a modelling procedure, building uponthe work of Vedantham et al. 2015, to estimate and iso-late reflected earthshine and recover the flux density of theMoon’s disk. Vedantham et al. (2015) assume specular re-flection for earthshine and model the Moon’s total emissionas a disk component and a point-source component due toearthshine. We introduce a more sophisticated model of theearthshine that more accurately captures the Moon’s reflec-tive properties.
We employ a two-step earthshine-mitigation process. In
the first step we follow Vedantham et al. (2015), but replacethe point-source model of earthshine with a mask of 5 × 8pixels (2.5 × 4 arcmin) elongated along the RA axis. This isto account for two effects which broaden the quasi-specularcomponent of the earthshine. The first is the angular broad-ening as described by Vedantham et al. (2015), who calculatethat the broadening would have an rms width of 3.86′ basedon an rms slope for the lunar surface of 14°, as estimatedby Daniels (1963a). The value used for the rms slope, how-ever, is incorrect because Daniels (1963a) did not account forthe diffuse component of the reflections in their analysis. In-stead, we use the revised value of 6.8° for the rms slope of theMoon’s surface (Daniels 1963b). The second broadening ef-fect is due to the Moon’s motion against the sky backgroundover the course of each 4-min observation, which smears thequasi-specular component of the earthshine across the RAdirection. Our model can be expressed as:
D = (sdiskM + sspecB) ∗ P + N, (3)
where D is the matrix of dirty difference image brightnessvalues, M is a mask representing the disk of the Moon (hav-ing a value of 1 within the Moon’s diameter and 0 elsewhere),B is the mask representing the broadened, quasi-specularcomponent of the earthshine, P is the PSF of the telescopeand N is noise. The variables sdisk and sspec are the brightnessvalues of the disk component and the quasi-specular reflec-tion component of our Moon model, respectively, in units ofJy/pixel.
We solve for sdisk and sspec using the maximum likeli-hood estimation employed by Vedantham et al. (2015). Thetotal integrated flux densities for the disk component, Sdisk,and the quasi-specular component, Sspec, are then calculatedby multiplying sdisk and sspec by their respective masks andsumming over all pixels.
In Fig. 1 we show the resulting images from the mod-elling process, averaged over 16 observations, for the 1.28-MHz frequency channel centred on 200 MHz. Panel A showsthe average difference image, Panel B shows the average re-constructed disk component of the model (convolved withthe telescope PSF), Panel C shows the average reconstructedpoint-like source of quasi-specular earthshine (convolvedwith the telescope PSF) and Panel D shows the averageresidual image (D = A − B − C). In Fig. 2 we show crosssections through the images in Fig 1, along the RA axis, inorder to give a clearer picture of how well the RFI mitigationis performing.
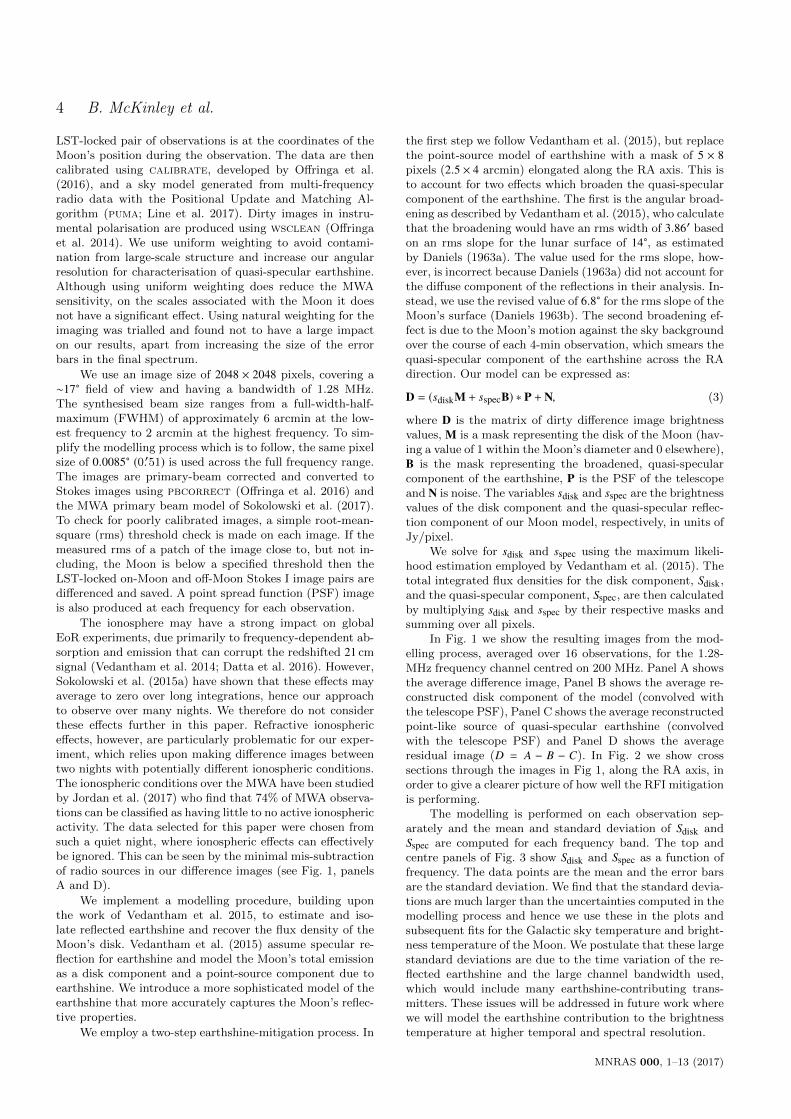
The modelling is performed on each observation sep-arately and the mean and standard deviation of Sdisk andSspec are computed for each frequency band. The top andcentre panels of Fig. 3 show Sdisk and Sspec as a function offrequency. The data points are the mean and the error barsare the standard deviation. We find that the standard devia-tions are much larger than the uncertainties computed in themodelling process and hence we use these in the plots andsubsequent fits for the Galactic sky temperature and bright-ness temperature of the Moon. We postulate that these largestandard deviations are due to the time variation of the re-flected earthshine and the large channel bandwidth used,which would include many earthshine-contributing trans-mitters. These issues will be addressed in future work wherewe will model the earthshine contribution to the brightnesstemperature at higher temporal and spectral resolution.
MNRAS 000, 1–13 (2017)

Global EoR signal with the Moon and the MWA 5
Figure 1. Images resulting from the Moon modelling process, averaged over 16 observations, for the 1.28 MHz frequency channel centredon 200 MHz. Panel A: Average difference image. Panel B: Average reconstructed disk model of the Moon (convolved with the telescope
PSF). Panel C: Average reconstructed quasi-specular earthshine (convolved with the telescope PSF). Panel D: Average residual image
(D = A− B −C). All images are shown on the same angular scale.
A clear feature of both of these plots is the large spikeof emission between 88-110 MHz. In both cases, this featureis due to emission from Earth in the FM radio band (seeMcKinley et al. 2013) being reflected by the Moon in both aquasi-specular (in the case of Sspec) and diffuse (in the caseof Sdisk) fashion. The large error bars in the region domi-nated by earthshine correspond to a large spread betweenvalues computed for the different observations. This is likelydue to the time variability of the earthshine, which is ex-pected to fluctuate over the course of the night as differenttransmitters on Earth move into and out of the line of sightof the Moon.
As discussed in Section 2, the contaminating earthshineconsists of two components; a quasi-specular component rep-
resented by Sspec and a diffuse component which we labelSdiffuse. The flux density of the Moon, Sm(ν), which we re-quire to solve equation 1, can therefore be expressed as:
Sm(ν) = Sdisk(ν) − Sdiffuse(ν). (4)
In the second step of the earthshine mitigation pro-cess we aim to determine the ratio of the diffuse to quasi-specular earthshine components across the entire frequencyband, Re(ν), so that we can remove the diffuse component ofthe earthshine from the disk flux density and obtain Sm(ν)using equation 4.
We combine equations 31 and 32 of Evans (1969) tocompute the frequency dependence of the ratio between thediffuse and quasi-specular components of the earthshine,
MNRAS 000, 1–13 (2017)

6 B. McKinley et al.
Figure 2. Cross-sections through the centres of the images shown in Fig. 1, along the RA axis. Panel A: Cross-section through theaverage difference image. Panel B: Cross-section through the average reconstructed disk model of the Moon (convolved with the telescope
PSF). Panel C: Cross-section through the average reconstructed quasi-specular earthshine (convolved with the telescope PSF). Panel D:Cross-section through the average residual image. All plots are shown on the same y-axis brightness scale.
Re(ν) and obtain:
Re(ν) =(
Sdiffuse(ν)Sspec(ν)
)= Aν0.58, (5)
where Sdiffuse(ν) is the flux density of the disk componentof the earthshine, Sspec(ν) is the flux density of the quasi-specular component of the earthshine, ν is frequency in MHzand A is a proportionality constant.
Combining equations 4 and 5, we can obtain Sm(ν) by:
Sm(ν) = Sdisk(ν) − Re(ν)Sspec(ν). (6)
The bright, reflected emission in the FM radio band isactually of benefit to us at this point, as it allows us to di-rectly measure the proportionality constant A in equation 5with a high SNR. We determine A by measuring Sdiffuse(ν)and Sspecular(ν) in the middle of the FM band at 100 MHz.We find Sdiffuse(ν = 100) by first fitting a line to Sdisk(ν) toestimate the contribution of Sm(ν) and then subtracting theestimate of Sm(ν = 100) from Sdisk(ν = 100). We then calcu-late A by:
A =Sdiffuse(ν = 100)Sspec(ν = 100) (100)−0.58. (7)
At this point we can obtain Sm(ν) by applying equa-tion 6 to the measured spectrum, however this is not partic-ularly useful for 21-cm cosmology as it does not reduce the
size of the error bars on Sm(ν). Instead, we re-run the mod-elling procedure and use our previously-computed values ofRe(ν) to remove the diffuse component of the earthshine foreach observation before calculating the mean and standarddeviation at each frequency. In doing this we effectively re-move the diffuse component of the RFI and the errors as-sociated with its time variability. The final RFI-correctedmeasurements of Sm(ν) are shown in the bottom panel ofFig. 3.
5 RESULTS AND ANALYSIS
5.1 Reflected Galactic Emission
Having measured the flux density of the Moon’s disk and re-moved the contaminating earthshine emission, we can nowproceed to determining the average background sky temper-ature using equation 2. We must first, however, calculate theadditional contribution to the Moon’s brightness tempera-ture due to the reflection of Galactic emission, Trefl−Gal(ν).
At these frequencies the Moon has an albedo of 0.07(Evans 1969), which means that there is a significant amountof Galactic radio emission that is reflected by the Moon’sdisk. We use ray tracing to calculate the expected reflectedGalactic emission, using the positions and orientations of
MNRAS 000, 1–13 (2017)
Global EoR signal with the Moon and the MWA 7
Sdisk(𝜈)
Sspec(𝜈)
Sm(𝜈)
Figure 3. Measurements of the integrated flux density for three components of our Moon and earthshine model. Data points are the
mean of the measurements from multiple observations at each frequency and the error bars are the standard deviation. Top panel: Fluxdensity of the disk component of our Moon model Sdisk(ν), resulting from the first stage of our earthshine-mitigation process. Centre panel:
Flux density of the quasi-specular component of the earthshine Sspec(ν), resulting from the first stage of our earthshine-mitigation process.
Bottom panel: The final estimate of the intrinsic flux density of the Moon Sm(ν), after removal of the diffuse earthshine component inthe second stage of our earthshine mitigation process, using equation 6. A colour version of this figure is available in the online article.
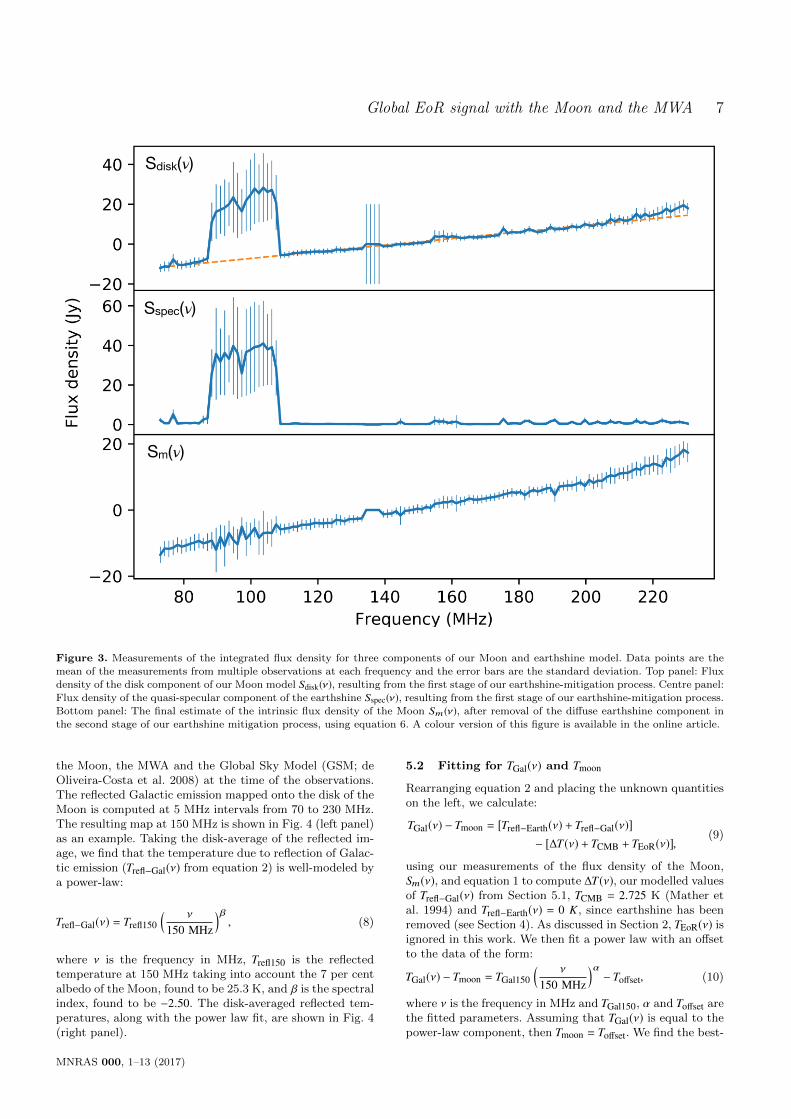
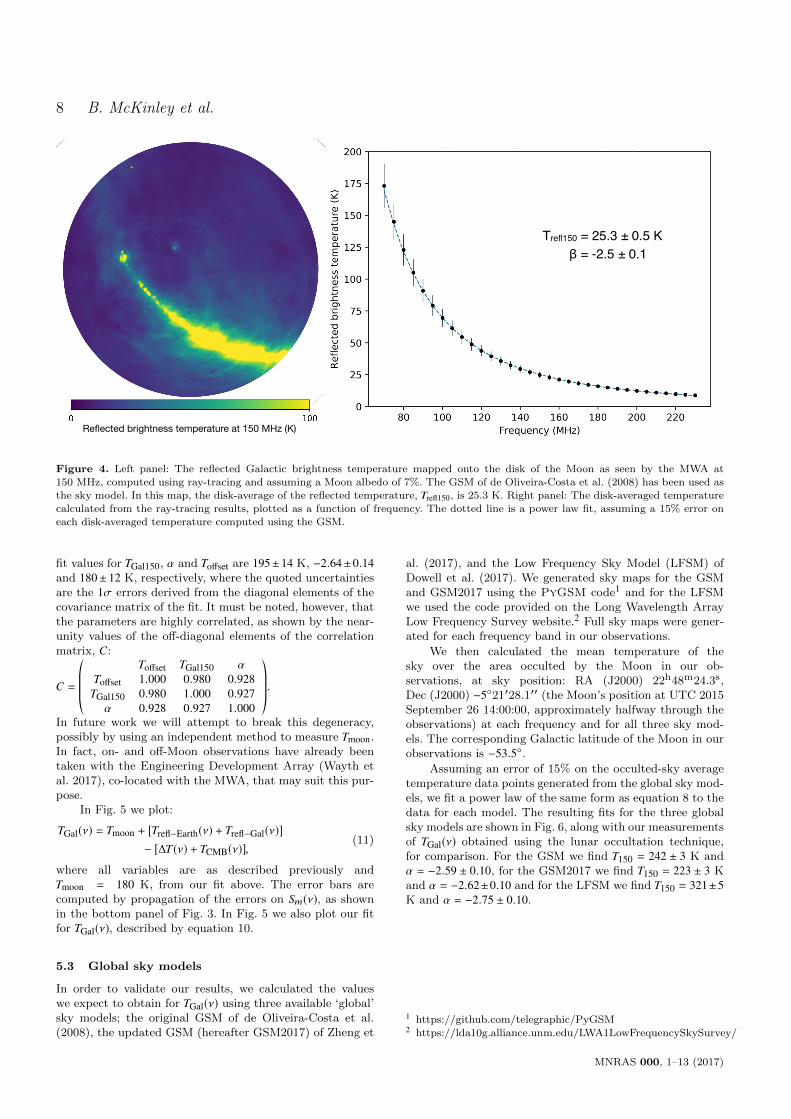
the Moon, the MWA and the Global Sky Model (GSM; deOliveira-Costa et al. 2008) at the time of the observations.The reflected Galactic emission mapped onto the disk of theMoon is computed at 5 MHz intervals from 70 to 230 MHz.The resulting map at 150 MHz is shown in Fig. 4 (left panel)as an example. Taking the disk-average of the reflected im-age, we find that the temperature due to reflection of Galac-tic emission (Trefl−Gal(ν) from equation 2) is well-modeled bya power-law:
Trefl−Gal(ν) = Trefl150( ν
150 MHz
)β, (8)
where ν is the frequency in MHz, Trefl150 is the reflectedtemperature at 150 MHz taking into account the 7 per centalbedo of the Moon, found to be 25.3 K, and β is the spectralindex, found to be −2.50. The disk-averaged reflected tem-peratures, along with the power law fit, are shown in Fig. 4(right panel).
5.2 Fitting for TGal(ν) and Tmoon
Rearranging equation 2 and placing the unknown quantitieson the left, we calculate:
TGal(ν) − Tmoon = [Trefl−Earth(ν) + Trefl−Gal(ν)]− [∆T(ν) + TCMB + TEoR(ν)],
(9)
using our measurements of the flux density of the Moon,Sm(ν), and equation 1 to compute ∆T(ν), our modelled valuesof Trefl−Gal(ν) from Section 5.1, TCMB = 2.725 K (Mather etal. 1994) and Trefl−Earth(ν) = 0 K, since earthshine has beenremoved (see Section 4). As discussed in Section 2, TEoR(ν) isignored in this work. We then fit a power law with an offsetto the data of the form:
TGal(ν) − Tmoon = TGal150( ν
150 MHz
)α− Toffset, (10)
where ν is the frequency in MHz and TGal150, α and Toffset arethe fitted parameters. Assuming that TGal(ν) is equal to thepower-law component, then Tmoon = Toffset. We find the best-
MNRAS 000, 1–13 (2017)
8 B. McKinley et al.
Reflected brightness temperature at 150 MHz (K)
Trefl150 = 25.3 ± 0.5 K β = -2.5 ± 0.1
Figure 4. Left panel: The reflected Galactic brightness temperature mapped onto the disk of the Moon as seen by the MWA at150 MHz, computed using ray-tracing and assuming a Moon albedo of 7%. The GSM of de Oliveira-Costa et al. (2008) has been used as
the sky model. In this map, the disk-average of the reflected temperature, Trefl150, is 25.3 K. Right panel: The disk-averaged temperature
calculated from the ray-tracing results, plotted as a function of frequency. The dotted line is a power law fit, assuming a 15% error oneach disk-averaged temperature computed using the GSM.
fit values for TGal150, α and Toffset are 195±14 K, −2.64±0.14and 180± 12 K, respectively, where the quoted uncertaintiesare the 1σ errors derived from the diagonal elements of thecovariance matrix of the fit. It must be noted, however, thatthe parameters are highly correlated, as shown by the near-unity values of the off-diagonal elements of the correlationmatrix, C:
C =©«
Toffset TGal150 α
Toffset 1.000 0.980 0.928TGal150 0.980 1.000 0.927α 0.928 0.927 1.000
ª®®®¬.In future work we will attempt to break this degeneracy,possibly by using an independent method to measure Tmoon.In fact, on- and off-Moon observations have already beentaken with the Engineering Development Array (Wayth etal. 2017), co-located with the MWA, that may suit this pur-pose.
In Fig. 5 we plot:
TGal(ν) = Tmoon + [Trefl−Earth(ν) + Trefl−Gal(ν)]− [∆T(ν) + TCMB(ν)],
(11)
where all variables are as described previously andTmoon = 180 K, from our fit above. The error bars arecomputed by propagation of the errors on Sm(ν), as shownin the bottom panel of Fig. 3. In Fig. 5 we also plot our fitfor TGal(ν), described by equation 10.
5.3 Global sky models
In order to validate our results, we calculated the valueswe expect to obtain for TGal(ν) using three available ‘global’sky models; the original GSM of de Oliveira-Costa et al.(2008), the updated GSM (hereafter GSM2017) of Zheng et
al. (2017), and the Low Frequency Sky Model (LFSM) ofDowell et al. (2017). We generated sky maps for the GSMand GSM2017 using the PyGSM code1 and for the LFSMwe used the code provided on the Long Wavelength ArrayLow Frequency Survey website.2 Full sky maps were gener-ated for each frequency band in our observations.
We then calculated the mean temperature of thesky over the area occulted by the Moon in our ob-servations, at sky position: RA (J2000) 22h48m24.3s,Dec (J2000) −521′28.1′′ (the Moon’s position at UTC 2015September 26 14:00:00, approximately halfway through theobservations) at each frequency and for all three sky mod-els. The corresponding Galactic latitude of the Moon in ourobservations is −53.5.
Assuming an error of 15% on the occulted-sky averagetemperature data points generated from the global sky mod-els, we fit a power law of the same form as equation 8 to thedata for each model. The resulting fits for the three globalsky models are shown in Fig. 6, along with our measurementsof TGal(ν) obtained using the lunar occultation technique,for comparison. For the GSM we find T150 = 242 ± 3 K andα = −2.59 ± 0.10, for the GSM2017 we find T150 = 223 ± 3 Kand α = −2.62±0.10 and for the LFSM we find T150 = 321±5K and α = −2.75 ± 0.10.
1 https://github.com/telegraphic/PyGSM2 https://lda10g.alliance.unm.edu/LWA1LowFrequencySkySurvey/
MNRAS 000, 1–13 (2017)

Global EoR signal with the Moon and the MWA 9
TGal150 = 195 ± 14 K 𝛼 = -2.64 ± 0.14
Tmoon = 180 ± 12 K
Figure 5. The Galactic sky temperature, TGal(ν), at the position of the Moon as measured with the MWA using the lunar occultation
technique. The dashed orange line is a power-law fit to the data. A colour version of this figure is available in the online article.
6 DISCUSSION
6.1 Measurement of the Galactic spectral index
The most precise measurement of the Galactic synchrotronforeground in our observed radio-frequency range is that ofMozdzen et al. (2017) using EDGES. At high Galactic lati-tudes matching our experiment they find a Galactic spectralindex of α = −2.62±0.02. Our result for the Galactic spectralindex of −2.64 ± 0.14 is consistent with the EDGES result(and the previous EDGES result of Rogers & Bowman 2008),given the large uncertainties in our measurements. Howeverit is not a clean comparison, since the area of sky covered bythe EDGES beam is very large, covering a significant frac-tion of the entire sky, compared to our local measurementof the sky occulted by the Moon.
The best comparison to make is with respect to thethree global sky models used to predict the measured skytemperature in Section 5.3. We find that our spectral-indexvalue of α = −2.64± 0.14 is consistent with the best-fit spec-tral index for the GSM model of α = −2.59 ± 0.10 and forthe GSM2017 of α = −2.62 ± 0.10 (see Fig. 6). The LFSM,however, greatly over-predicts the steepness of the spectral
index and the temperature at 150 MHz. Our results are alsoconsistent with the spectral index value (computed between45 MHz and 408 MHz) of Guzman (2011), who combine theirown data with the map of Haslam et al. (1975) to producea spectral-index map that shows a value of around −2.55 atthe position of our Moon observations.
In the only other experiment to use the lunar occulta-tion technique, Vedantham et al. (2015) found that a steeperspectral index of α = −2.9 was the best fit to their data, at alower frequency range of between 35 and 80 MHz with LO-FAR. This steep spectral index is unexpected, particularlybecause their observations were at a low Galactic latitudeof around −10, where the Galactic synchrotron emissionis expected to have a flatter spectral index of around −2.4(de Oliveira-Costa et al. 2008; Vedantham et al. 2015). Thiscould possibly be due to unaccounted-for diffuse earthshine,but the uncertainties in the measurements of Vedantham etal. (2015) were also high due to problematic sidelobe sourcesin their data.
MNRAS 000, 1–13 (2017)

10 B. McKinley et al.
T150gsm2017 = 223 ± 3 K 𝛼gsm2017 = -2.62 ± 0.10
Figure 6. Global sky model predictions for the mean brightness temperature of the occulted patch of sky using the GSM (de Oliveira-Costa et al. 2008)), the GSM2017 (Zheng et al. 2017) and the LFSM (Dowell et al. 2017). The broken lines are fits to the data generated
from each model assuming an error of 15% on each point and using a simple power-law model. The unbroken line with error bars is
our measured Galactic sky temperature reproduced from Fig. 5 for comparison. A colour version of this figure is available in the onlinearticle.
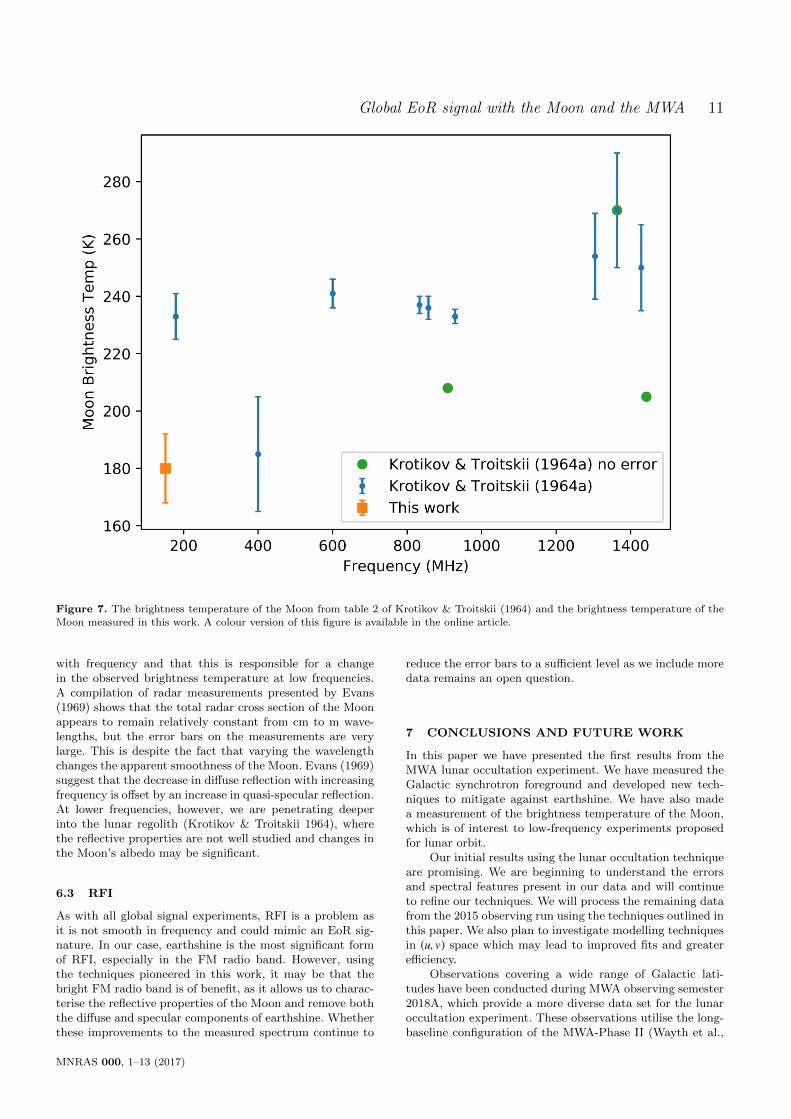
6.2 Measurement of Tmoon(ν)
In a comprehensive review, Krotikov & Troitskii (1964)report measured values of Tmoon at wavelengths between0.13 cm and 168 cm. In Fig. 7 we plot our measurement ofTmoon (with frequency taken to be in the middle of our bandat 150 MHz), along with the values published in table 2 ofKrotikov & Troitskii (1964) that are below 1.5 GHz. Ourvalue appears low compared to others, however it should benoted that there are few measurements at low frequencies(only one, Baldwin 1961, in our observing band) and thatall of the measurements have large systematic errors, oftennot reflected in the quoted uncertainties.
For example, the Baldwin (1961) measurement at178 MHz makes use of an interferometer and therefore relieson an accurate knowledge of the mean sky temperature atthe position of the Moon. The sky temperatures used arederived from those of Turtle & Baldwin (1962) and Turtleet al. (1962b). Uncertainties of 10%, plus a zero-level uncer-tainty of ±15 K, are claimed by Turtle & Baldwin (1962),
while Turtle et al. (1962b), who claim uncertainties in theiroverall sky temperature and zero-level calibration of a fewK, use an antenna with a very large beamwidth (15° in RAand 44° in DEC), so their measurements cannot be easilycompared to the local temperature at the Moon’s positionin the sky.
Such systematic errors are present in many of the ref-erences quoted by Krotikov & Troitskii (1964), with mostTmoon measurements relying on the sky temperature beingknown. This degeneracy between the mean sky temperatureand the Moon temperature will also be problematic for newspace-based experiments such as DARE and DSL, which aimto use the Moon as a shield to protect them from terrestrialRFI, as they seek to measure the global signal from the DarkAges through to the EoR. New, low-frequency measurementsof the Moon’s brightness temperature such as ours, will bebeneficial to these experiments as they plan and refine theircalibration and imaging strategies.
It is also possible that the albedo of the Moon changes
MNRAS 000, 1–13 (2017)
Global EoR signal with the Moon and the MWA 11
Figure 7. The brightness temperature of the Moon from table 2 of Krotikov & Troitskii (1964) and the brightness temperature of the
Moon measured in this work. A colour version of this figure is available in the online article.
with frequency and that this is responsible for a changein the observed brightness temperature at low frequencies.A compilation of radar measurements presented by Evans(1969) shows that the total radar cross section of the Moonappears to remain relatively constant from cm to m wave-lengths, but the error bars on the measurements are verylarge. This is despite the fact that varying the wavelengthchanges the apparent smoothness of the Moon. Evans (1969)suggest that the decrease in diffuse reflection with increasingfrequency is offset by an increase in quasi-specular reflection.At lower frequencies, however, we are penetrating deeperinto the lunar regolith (Krotikov & Troitskii 1964), wherethe reflective properties are not well studied and changes inthe Moon’s albedo may be significant.
6.3 RFI
As with all global signal experiments, RFI is a problem asit is not smooth in frequency and could mimic an EoR sig-nature. In our case, earthshine is the most significant formof RFI, especially in the FM radio band. However, usingthe techniques pioneered in this work, it may be that thebright FM radio band is of benefit, as it allows us to charac-terise the reflective properties of the Moon and remove boththe diffuse and specular components of earthshine. Whetherthese improvements to the measured spectrum continue to
reduce the error bars to a sufficient level as we include moredata remains an open question.
7 CONCLUSIONS AND FUTURE WORK
In this paper we have presented the first results from theMWA lunar occultation experiment. We have measured theGalactic synchrotron foreground and developed new tech-niques to mitigate against earthshine. We have also madea measurement of the brightness temperature of the Moon,which is of interest to low-frequency experiments proposedfor lunar orbit.
Our initial results using the lunar occultation techniqueare promising. We are beginning to understand the errorsand spectral features present in our data and will continueto refine our techniques. We will process the remaining datafrom the 2015 observing run using the techniques outlined inthis paper. We also plan to investigate modelling techniquesin (u, v) space which may lead to improved fits and greaterefficiency.
Observations covering a wide range of Galactic lati-tudes have been conducted during MWA observing semester2018A, which provide a more diverse data set for the lunaroccultation experiment. These observations utilise the long-baseline configuration of the MWA-Phase II (Wayth et al.,
MNRAS 000, 1–13 (2017)

12 B. McKinley et al.
in preparation), allowing us to map the quasi-specular earth-shine at higher angular resolution.
Future progress depends upon processing more dataand further refining our techniques to effectively model fore-ground and reflected emission within our frequency range.The reflective behaviour of the Moon at low frequencies isnot well studied and this will require particular attention.We must also develop techniques to break the degeneracybetween the sky temperature and the Moon temperaturein our fitting procedure. The prospects for measuring theredshifted 21-cm signal from the EoR and Cosmic Dawn us-ing the lunar occultation technique with the MWA dependupon solving these key issues. We will report our progressin subsequent papers in this series.
ACKNOWLEDGMENTS
This scientific work makes use of the Murchison Radio-astronomy Observatory, operated by CSIRO. We acknowl-edge the Wajarri Yamatji people as the traditional owners ofthe Observatory site. Support for the operation of the MWAis provided by the Australian Government (NCRIS), undera contract to Curtin University administered by AstronomyAustralia Limited. We acknowledge the Pawsey Supercom-puting Centre, which is supported by the Western Australianand Australian Governments. BM is funded by a Discov-ery Early Career Researcher grant from the ARC (projectnumber DE160100849). We acknowledge that the Bentleycampus of the Curtin University of Technology, upon whichmost of this paper was written, is located on the land ofthe Noongar people. The Centre for All-Sky Astrophysics(CAASTRO) is an Australian Research Council Centre ofExcellence, funded by grant CE110001020. Parts of this re-search were supported by the Australian Research CouncilCentre of Excellence for All Sky Astrophysics in 3 Dimen-sions (ASTRO 3D), through project number CE170100013.CMT is supported under the Australian Research Council’sDiscovery Early Career Researcher funding scheme (projectnumber DE140100316). GB acknowledges support from theRoyal Society and the Newton Fund under grant NA150184.This work is based on the research supported in part by theNational Research Foundation of South Africa (grant No.103424).
REFERENCES
Baldwin J. E., 1961, MNRAS, 122, 513
Barkana R., 2018, Nature, 555, 71
Beardsley A. P., et al., 2016, ApJ, 833, 102
Beckmann P., 1965a, Journal of Geophysical Research, 70, 2345
Beckmann P., 1965b, IEEE Transactions on Antennas and Prop-agation, vol. , p. 384-388 (1965)
Bernardi G., McQuinn M., Greenhill L. J., 2015, ApJ, 799, 90
Bernardi G., Zwart J. T. L., Price D., et al., 2016, MNRAS, 461,
2847
Boonstra A.-J., et al., 2016, Discovering the Sky at the Longest
Wavelengths (DSL), IEEE AC 2015, pp. 1-20
Bowman J. D., Rogers A. E. E., 2010, Nature, 468, 796
Bowman J. D., Cairns I., Kaplan D. L., et al., 2013, PASA, 30,
31
Bowman J. D., Rogers A. E. E., Monsalve R. A., Mozdzen T. J.,
Mahesh N., 2018, Nature, 555, 67
Burns J. O., et al., 2012, Advance in Space Research, 49, 433
Cohen A., Fialkov A., Barkana R., Lotem M., 2017, MNRAS, 472,1915
Daniels F. B., 1963a, J. Geophys. Res., 68, 449
Daniels F. B., 1963b,
Datta A., Bradley R., Burns, J. O., Harker G., Komjathy A.,
Lazio T. J. W., 2016, ApJ, 831, 6
DeBoer D. R., et al., 2017, Publications of the Astronomical So-ciety of the Pacific, 129, 045001
de Oliveira-Costa A., Tegmark M., Gaensler B. M., Jonas J., Lan-decker T. L., Reich P., 2008, MNRAS, 388, 247
Dowell J., Taylor G. B., Schinzel F. K., Kassim N. E., Stovall K.,
2017, MNRAS, 469, 4537
Dewdney P., bij de Vaate J.-G., Cloete K., Gunst A., Hall D.,
McCool R., Roddis N., Turner W., 2010, SKA Memo 130:
SKA Phase I: Preliminary system description
Evans J. V., 1969, ARA&A, 7, 201
Furlanetto, S. R., Oh, S. P., Briggs, F. H., 2006, PhR, 433, 181
Guthrie D. v., 1947, Popular Astronomy, 55, 200
Guzman A. E., May J., Alvarez H., Maeda K., 2011, A&A, 525,
138
Haslam C. G. T., Cooke D. J., Day G. A., Wilson W. E., Graham
D. A., Wielebinski R., Cleary, M. N., 1975, PASA, 2, 331
Jordan C. H., et al., 2017, MNRAS, 471, 3974
Klemperer W. K., 1965, Journal of Geophysical Research, 70,
3798
Koopmans L., et al., 2015, Advancing Astrophysics with the
Square Kilometre Array (AASKA14), p. 1
Krotikov V. D., Troitskii V. S., 1964, Soviet Physics Uspekhi, 6,841
Line J. L. B., Webster R. L., Pindor B. et al., 2017, PASA, 34, 3
Mather J. C., et al., 1994, ApJ, 420, 439
McKinley B., et al., 2013, AJ, 145, 23
Monsalve R. A., Rogers A. E. E., Bowman, J. D., Mozdzen T. J.,2017, ApJ, 835, 49
Monsalve R. A., Rogers A. E. E., Bowman J. D., Mozdzen T. J.,
2017, ApJ, 847, 64
Mozdzen T. J., Bowman J. D., Monsalve R. A., Rogers A. E. E.,
2016, MNRAS, 455, 3890
Mozdzen T. J., Bowman J. D., Monsalve R. A., Rogers A. E. E.,2017, MNRAS, 464, 4995
Offringa A. R., et al., 2014, MNRAS, 444, 606
Offringa A. R., et al., 2016, MNRAS, 458, 1057
Offringa et al., 2015, PASA, 32, 008
Parsons A. R., et al., 2014, ApJ, 788, 106
Patil A. H., et al., 2017, ApJ, 838, 65
Patra N., Subrahmanyan R., Raghunathan A., Udaya Shankar
N., 2013, Exp. Astron., 36, 319
Pober J. C., et al., 2014, ApJ, 782, 66
Presley M. E., Liu, A., Parsons, A. R. 2015, ApJ, 809, 18
Pritchard J. R., Loeb A., 2010, Phys. Rev. D, 82, 023006
Rhodes B. C., 2011, ascl.soft12014R
Rogers A. E. E., Bowman J. D., 2008, AJ, 136, 641
Bowman J. D., Rogers A. E. E., Hewitt J., 2008, ApJ, 676, 1
Shaver P. A., Windhorst R. A., Madau P., de Bruyn A. G., 1999,
A&A, 345, 380
Singh S., Subrahmanyan, R., Udaya Shankar N., Raghunathan,
A., 2015, ApJ, 815, 88
Singh S., et al., 2017a, ApJ 845, L12
Singh S., et al., 2017b, arXiv:171111281S
Sokolowski M., et al., 2015a, ApJ, 813, 18
Sokolowski M., et al, 2015b, PASA, 32, 4
Sokolowski M., et al, 2017, PASA, 34, 62
Sullivan W. T., Brown S., Wetherill C., 1978, Sci, 199, 377
Sullivan W. T., Knowles S. H., 1985, in IAU Symp. 112, The
Search for Extraterrestrial Life: Recent Developments, ed. M.D. Papagiannis (Dordrecht: Reidel), 327
Tingay S. J., et al., 2013, PASA, 30, 7
MNRAS 000, 1–13 (2017)

Global EoR signal with the Moon and the MWA 13
Turtle A. J., Baldwin J. E., 1962a, MNRAS, 124, 459
Turtle A. J., Pugh J. F., Kenderdine S., Pauliny-Toth I. I. K.,
1962, MNRAS, 124, 297van Haarlem, M. P., 2013, A&A, 556, 2
Vedantham H. K., et al., 2014, MNRAS, 437, 1056
Vedantham H. K., et al., 2015, MNRAS, 450, 2291Voytek T. C., Natarajan A., Jauregui Garcıa J. M., Peterson J.
B., Lopez-Cruz O., 2014, ApJ, 782, L9Wayth R., et al., 2017, PASA, 34, 34
Zheng, H., et al., 2017, MNRAS, 464, 3486
This paper has been typeset from a TEX/LATEX file prepared by
the author.
MNRAS 000, 1–13 (2017)