Background This report summarizes research to understand consumer comprehension and opinions of...
13
Data Privacy Day 2013 Survey Results Prepared for Microsoft Corporation by Ipsos MediaCT
-
Upload
christian-pierce -
Category
Documents
-
view
215 -
download
0
Transcript of Background This report summarizes research to understand consumer comprehension and opinions of...

Data Privacy Day 2013 Survey ResultsPrepared for Microsoft Corporation by Ipsos MediaCT

Background
This report summarizes research to understand consumer comprehension and opinions of online privacy protection. This research was conducted by Ipsos MediaCT.
Study markets
Data source
Sample size Audience Fieldwork dates
USAOnline
omnibus panel
• Total of 1015 interviews • Adults aged 18 or older November 15-18, 2012

Executive Summary
• Forty-five percent say they feel they have little or no control over the personal information companies gather about them while they are browsing the Web or using online services such as photo sharing, travel or gaming.
• Thirty-two percent report they always consider a company’s privacy reputation, track record and policies when choosing which websites to visit or services to use.
• When consumers have questions about protecting their privacy, most equally consult friends and family and a website’s privacy statement (39% and 39% respectively) followed by a company’s privacy policy (29%).
• When it comes to the most trusted sources of privacy information, consumers trust friends and family most (33%) followed by industry privacy or consumer organizations (25%) and a website’s privacy statement (22%).
No Control
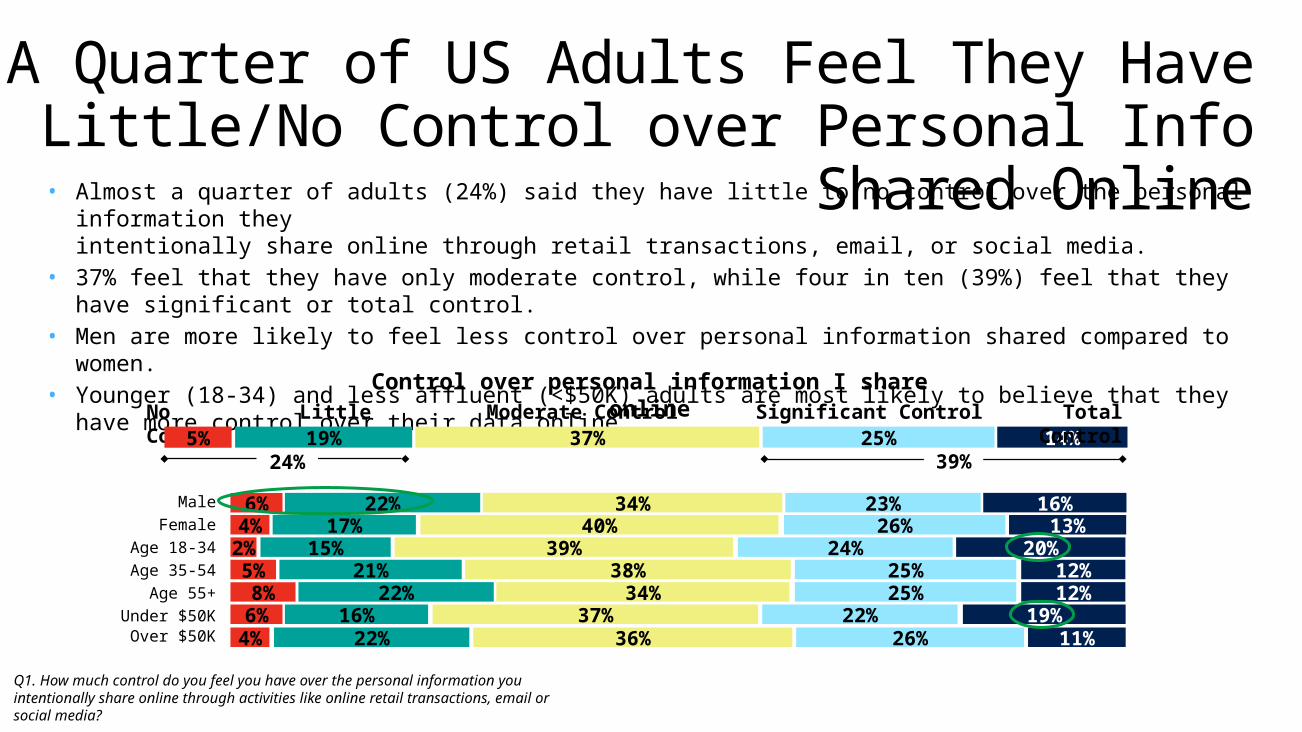
A Quarter of US Adults Feel They Have Little/No Control over Personal Info Shared
Online• Almost a quarter of adults (24%) said they have little to no control over the personal information they intentionally share online through retail transactions, email, or social media.
• 37% feel that they have only moderate control, while four in ten (39%) feel that they have significant or total control.
• Men are more likely to feel less control over personal information shared compared to women.• Younger (18-34) and less affluent (<$50K) adults are most likely to believe that they have more control
over their data online.Control over personal information I share
online
Q1. How much control do you feel you have over the personal information you intentionally share online through activities like online retail transactions, email or social media?
Little Control 14%25%37%19%5%
Moderate Control Total Control
MaleFemale
Age 18-34Age 35-54
Age 55+Under $50KOver $50K
16%23%34%22%6%13%26%40%17%4%
20%24%39%15%2%12%25%38%21%5%12%25%34%22%8%
19%22%37%16%6%11%26%36%22%4%
24% 39%
Significant Control

Half of US Adults Feel They Have Little/No Control over Personal Info Collected Online• Nearly half of US adults surveyed (45%) feel they have little or no control over the personal
information companies gather from them online.
• Those aged 35-54 and 55+ are among those who are most likely to say they have little control or no control over the data companies gather from their online activities. Consistent with their feelings about control of data shared voluntarily, younger (18-35) and less affluent (<$50K) adults are most likely to believe that they have more control.
Control over information gathered by companies
Q2. How much control do you feel you have over the personal information companies gather while you are browsing the web or using online services such as photo sharing, travel, gaming, shopping, etc.?
9%12%34%33%12%
MaleFemale
Age 18-34Age 35-54
Age 55+Under $50KOver $50K
10%13%32%31%14%8%11%35%35%11%
15%15%38%26%6%6%10%35%36%13%6%12%29%37%17%
12%13%32%31%11%6%12%35%35%13%
No Control
Little Control
Moderate Control Total
45% 21%
Sig. Control

Full Time Part Time Not Emp. Retired
40% 44%39% 36%
Understanding How to Protect Privacy Online Varies by Age
Q6. How well do you understand how to protect your privacy online?
Male Female
41% 38%
Under $50K Over $50K
42% 38%
• Less than half of US adults (40%) “mostly” or “totally understand” how to protect themselves online.
• Aligning with the perception of control over their data online, older adults (55+) are the least likely (30%) while younger users (18-34) are the most likely (50%) to understand of how to protect their privacy online.
18-34 35-54 55+
50%40%
30%
Understand How to Protect Privacy Online
11%29%40%17%4%No Idea Minimally Moderately
UnderstandTotallyMostly Understand
20% 40%
Mostly or Totally Understand How to Protect Privacy Online

Most Actively Protect Their Privacy Online
• The vast majority of US adults (85%) have taken steps to protect their online privacy, most commonly by deleting cookies (65%). Many have also opted out of targeted advertising (44%), uninstalled an app (41%), or confirmed or changed their browser setting to request that websites don’t track them (39%).
• Older respondents (55+) are least likely to delete cookies, uninstall an app, or confirm or change browser settings and change to a different website or online service.
Q9. Which of the following actions, if any, have you taken to help protect your privacy online?
Deleted cookies
Opted out of targeted advertising
Uninstalled an app
Confirmed or changed browser settings
Stopped using online service
Changed to a different website/service
None
68%
41%
48%
45%
21%
23%
13%
68%
48%
47%
41%
25%
24%
15%
59%
43%
28%
30%
18%
14%
18%
Actions to Protect Privacy by Age
55+ 35-54 18-34
65%
44%
41%
39%
21%
20%
15%

A Third of Adults Always Consider PrivacyIssues when Choosing an Online Service
• While over half of adults (54%) sometimes consider privacy reputation, track record or policies when choosing which websites to visit or online services to use, a third (32%) always do so.
• Men are more likely then women (16% vs. 11%) to say that they never take a company’s privacy reputation into consideration when choosing which websites and online services to use.
Yes, always; 32%
Yes, some-times; 54% No, never; 13%
Consider a Company’s Privacy Issueswhen Choosing Online Services to Use
Male Female
30% 35%
54% 55%
16% 11%
Consider a Company’s Privacy Issueswhen Choosing Online Services to Use
by Gender
Yes, Always Yes, Sometimes No, Never
Q3. Do you consider a company’s privacy reputation, track record or policies when choosing which websites to visit or which online services to use - such as, photo sharing, travel, gaming, shopping, etc.?
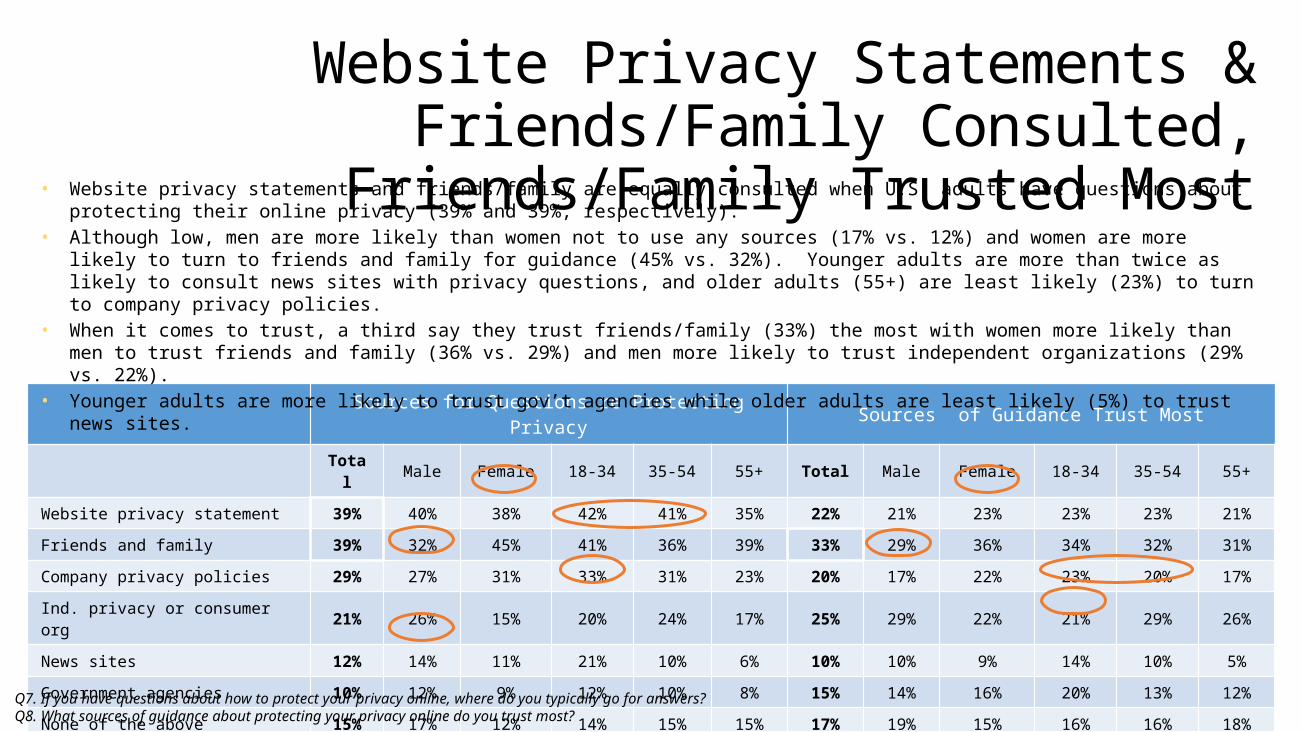
Sources for Questions re Protecting Privacy Sources of Guidance Trust Most
Total Male Female 18-34 35-54 55+ Total Male Female 18-34 35-54 55+
Website privacy statement 39% 40% 38% 42% 41% 35% 22% 21% 23% 23% 23% 21%
Friends and family 39% 32% 45% 41% 36% 39% 33% 29% 36% 34% 32% 31%
Company privacy policies 29% 27% 31% 33% 31% 23% 20% 17% 22% 23% 20% 17%
Ind. privacy or consumer org 21% 26% 15% 20% 24% 17% 25% 29% 22% 21% 29% 26%
News sites 12% 14% 11% 21% 10% 6% 10% 10% 9% 14% 10% 5%
Government agencies 10% 12% 9% 12% 10% 8% 15% 14% 16% 20% 13% 12%
None of the above 15% 17% 12% 14% 15% 15% 17% 19% 15% 16% 16% 18%
Website Privacy Statements & Friends/Family Consulted, Friends/Family
Trusted Most
Q7. If you have questions about how to protect your privacy online, where do you typically go for answers? Q8. What sources of guidance about protecting your privacy online do you trust most?
• Website privacy statements and friends/family are equally consulted when U.S. adults have questions about protecting their online privacy (39% and 39%, respectively).
• Although low, men are more likely than women not to use any sources (17% vs. 12%) and women are more likely to turn to friends and family for guidance (45% vs. 32%). Younger adults are more than twice as likely to consult news sites with privacy questions, and older adults (55+) are least likely (23%) to turn to company privacy policies.
• When it comes to trust, a third say they trust friends/family (33%) the most with women more likely than men to trust friends and family (36% vs. 29%) and men more likely to trust independent organizations (29% vs. 22%).
• Younger adults are more likely to trust gov’t agencies while older adults are least likely (5%) to trust news sites.

Appendix

Respondent Profile
Men 49% Women51%
Gender
<$50K $50K+
42%
58%
Household Income
18-34 35-54 55 or older
31%
37%
32%
Age 32% 35%
20%13%
Education Level

Respondent Profile
Married Single Divorced or separated
Domestic partner
Widowed
55%
26%
10%6% 3%
Marital Status
Caucasian African American Other
84%
7% 9%
Ethnicity
Empl. f
ull-t
ime
Empl. p
art-t
ime
Retire
d
Unem
ploy
ed
Homem
aker
Self-
employ
ed
Stud
ent
Other
39%
11%17%
11% 9% 6% 6% 10%
Employment
Children <18, 25%
No children < 18, 75%
Presence of Children

To learn more about what Microsoft is doing to help protect your privacy visit: microsoft.com/yourprivacy
© 2013. Microsoft Corporation. All rights reserved. This material is provided for informational purposes only.
Microsoft makes no warranties, express or implied.