BACKGROUND - centralbank.go.ke · response rate to the July 2018 Survey was 68 percent ... • The...
14
Transcript of BACKGROUND - centralbank.go.ke · response rate to the July 2018 Survey was 68 percent ... • The...
| 1 MPC MARKET PERCEPTIONS SURVEY - JULY 2018
2 | MPC MARKET PERCEPTIONS SURVEY - JULY 2018
CONTENTS
BACKGROUND ……………………...........……………………….....................................................................4
SURVEY METHODOLOGY…………………...........……………………….....................................................................4
HIGHLIGHTS OF THE SURVEY ………………… ……………....……………...….........................................4
INFLATION EXPECTATIONS……………………………………….………………............................................5
EXCHANGE RATE EXPECTATIONS ………………………………………………..........................................6
PRIVATE SECTOR CREDIT GROWTH EXPECTATIONS……………..………………...........................................8
ECONOMIC GROWTH EXPECTATIONS ………………………………………………......................................10
OPTIMISM ON THE ECONOMY....……………………………………………………...........................................12
| 3 MPC MARKET PERCEPTIONS SURVEY - JULY 2018
CENTRAL BANK OF KENYA MARKET PERCEPTIONS SURVEYS
The Central Bank of Kenya (CBK) undertakes a Market Perceptions Survey every two months, prior to the Monetary Policy Committee (MPC) meeting, to gauge the expectations of banks and non-bank private sector firms on selected economic indicators. The survey covers all commercial and microfinance banks, as well as a sample of non-bank private sector firms.
The non-bank private firms are sampled from major towns across the country including Nairobi, Mombasa, Kisumu, Eldoret, Nakuru, Nyeri and Meru, and are representative of sectors that account for about 70 percent of Kenya’s GDP. The sectors covered by the survey include agriculture, mining and quarrying, manufacturing, electricity and water, trade, hotels and restaurants, transport and communications, real estate, building and construction, finance and insurance, and health.
Sensitization engagements with respondents are conducted on annual basis to facilitate a better understanding of the survey questions, to enhance the quality of responses, and to increase the response rate in all the regions covered.

4 | MPC MARKET PERCEPTIONS SURVEY - JULY 2018
1. BACKGROUND
The July 2018 MPC Market Perceptions Survey was conducted in the first three weeks of the month. The Survey sought market expectations with regard to overall inflation, exchange rate of the Kenya Shilling against the U.S. Dollar, private sector credit growth, and economic growth. It also assessed the impact of the March 2018 MPC decision to lower of the Central Bank Rate (CBR), and the levels of optimism on economic growth prospects and improvement in the business environment over the next two months (July-August 2018), and over the next 12 months (July 2018 to June 2019). The expectations on economic growth prospects also included an analysis of forward hotel bookings over the next four months (July to October 2018).
This report provides a summary of the analyses of the responses to the Survey from commercial and microfinance banks (MFBs), and a sample of non-bank private sector firms. The report also gives the factors that the respondents considered as reasons behind their expectations.
2. SURVEY METHODOLOGY
The Survey was administered through questionnaires sent, through email and hard copy, to the Chief Executives of 378 private sector firms comprising of 40 operating commercial banks, 1 mortgage finance institution, 13 micro-finance banks, and 324 non-bank private firms including 45 hotels. The overall response rate to the July 2018 Survey was 68 percent of the sampled institutions. The respondents comprised of all the 40 commercial banks, 1 mortgage finance institution, all the 13 micro-finance banks, 35 hotels, and 167 non-bank private sector firms.
The Survey questionnaires were completed by either Chief Executive Officers, Finance Directors, or other senior officers from the sampled institutions who
have knowledge on the economy and the business environment.
The expectations from commercial and micro-finance banks are compiled using weighted averages based on the market share of the institution. Responses from the non-bank private firms are aggregated using simple averages.
3. HIGHLIGHTS OF THE SURVEY
The July 2018 MPC Market Perceptions Survey showed that:
• Inflation expectations for the next 2 months (July and August 2018) and over the next 12 months were well anchored within the target range (2.5 to 7.5 percent).
• The exchange rate of the Kenya Shilling against the U.S. Dollar was expected to remain stable with a strengthening bias in July and August 2018.
• Private sector credit growth was expected to improve on account of both demand and supply factors. There were mixed perceptions across banks on the expected impact of the March 2018 MPC decision to lower the CBR, on the expected private sector credit growth.
• Banks and non-bank private firms revised their economic growth expectations for 2018 upwards relative to the May 2018 Survey.
• There was sustained optimism on the economic growth prospects and improvement in the business environment going forward.

| 5 MPC MARKET PERCEPTIONS SURVEY - JULY 2018
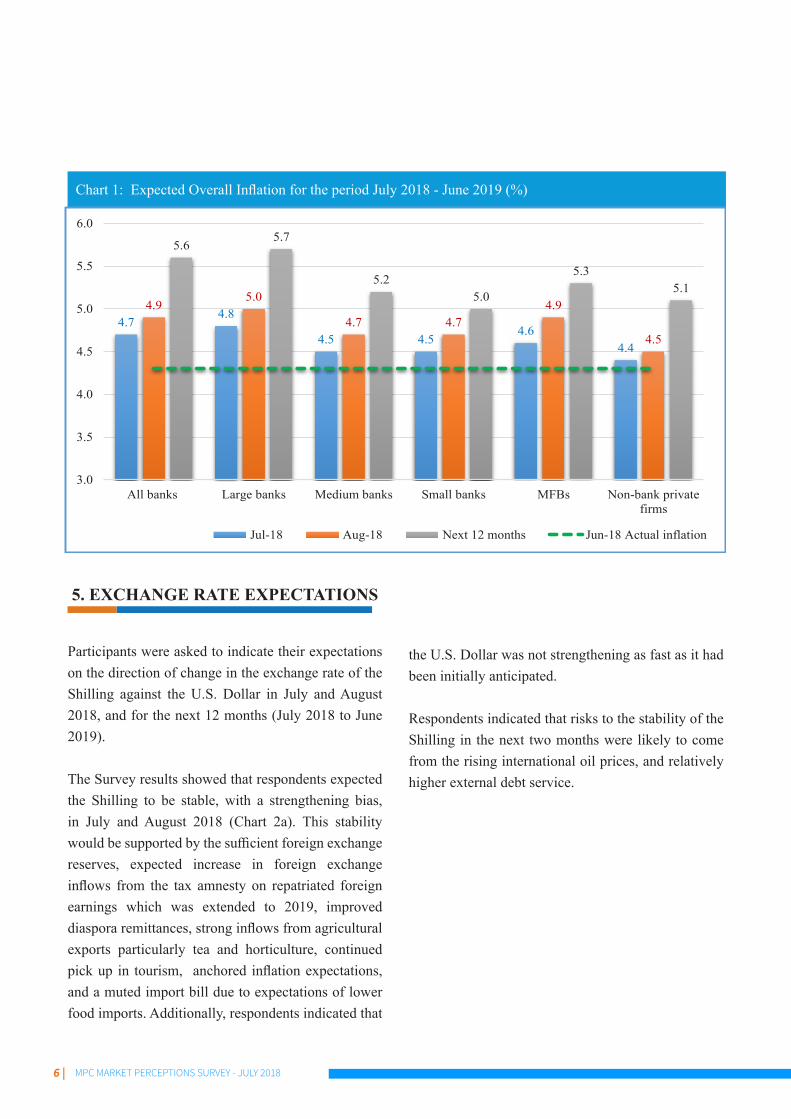
4. INFLATION EXPECTATIONS
Participants in the Survey were asked to give their expectation of overall inflation rates for July and August 2018, and for the next 12 months (July 2018 – June 2019).
All respondents expected overall inflation for the next 2 months (July and August 2018) to remain within the target range of 2.5 to 7.5 percent (Table 1). However, respondents expected a marginal increase in inflation during this period due to the tax measures pronounced in
The Survey showed that banks and non-bank private sector firms expected overall inflation to remain within the target range over the next 12 months - July 2018 to June 2019 - (Chart 1).
Nevertheless, respondents expected a moderate increase in inflation in the period, largely driven by some of the tax measures announced in the FY2018/19 Budget including the impact of VAT on fuel from September 2018, and the reintroduction of VAT on food items such as wheat flour, maize flour and bread,
the FY2018/19 Government Budget; temporary supply shocks emanating from the crackdown on contraband goods including sugar, the effect of the ban on logging on charcoal prices, and the rise in international oil prices and consequent upward pressure on domestic fuel prices. Inflation was, however, expected to remain low (below 5 percent) during the period largely due to expectations of lower food prices as a result of improved weather conditions.
which were previously zero-rated. Respondents also expected a pick up in consumption as private sector credit growth increases to exert moderate upward pressure on inflation. Despite the expected impact of these factors, inflation was expected to remain within the target range mainly supported by lower food prices.
Survey Month Expected Inflation for:
Large banks
Medium banks
Small banks
All banks (weighted by size of bank)
MFBsNon-bank
private firms
Jul 2017 Jul-Aug 2017 9.8 10.2 10.3 10.0 10.4 10.1
Sep 2017 Sep-Oct 2017 7.7 7.7 8.3 7.6 8.0 8.2
Nov 2017 Nov-Dec 2017 5.9 5.8 5.9 5.9 5.5 5.7
Jan 2018 Jan-Feb 2018 5.5 5.1 4.9 5.3 5.0 5.0
Mar 2018 Mar-Apr 2018 4.4 4.8 4.6 4.5 4.6 4.8
May 2018 May-Jun 2018 4.2 3.9 3.7 4.1 3.9 3.8
Jul 2018 Jul-Aug 2018 4.9 4.6 4.6 4.8 4.8 4.4
Table 1. Expected Overall Inflation over the next 2 Months (%)
6 | MPC MARKET PERCEPTIONS SURVEY - JULY 2018
5. EXCHANGE RATE EXPECTATIONS
Participants were asked to indicate their expectations on the direction of change in the exchange rate of the Shilling against the U.S. Dollar in July and August 2018, and for the next 12 months (July 2018 to June 2019).
The Survey results showed that respondents expected the Shilling to be stable, with a strengthening bias, in July and August 2018 (Chart 2a). This stability would be supported by the sufficient foreign exchange reserves, expected increase in foreign exchange inflows from the tax amnesty on repatriated foreign earnings which was extended to 2019, improved diaspora remittances, strong inflows from agricultural exports particularly tea and horticulture, continued pick up in tourism, anchored inflation expectations, and a muted import bill due to expectations of lower food imports. Additionally, respondents indicated that
the U.S. Dollar was not strengthening as fast as it had been initially anticipated.
Respondents indicated that risks to the stability of the Shilling in the next two months were likely to come from the rising international oil prices, and relatively higher external debt service.
Chart 1: Expected Overall Inflation for the period July 2018 - June 2019 (%)
4.74.8
4.5 4.54.6
4.4
4.95.0
4.7 4.74.9
4.5
5.65.7
5.25.0
5.35.1
3.0
3.5
4.0
4.5
5.0
5.5
6.0
All banks Large banks Medium banks Small banks MFBs Non-bank privatefirms
Jul-18 Aug-18 Next 12 months Jun-18 Actual inflation

| 7 MPC MARKET PERCEPTIONS SURVEY - JULY 2018
confidence, expected pickup in tourism, a stable inflation rate, and prospects for oil exports.
A large proportion of banks, on the other hand, expected a marginal weakening of the Shilling against the USD in the next 12 months on account of moderate pressure on the current account as oil prices fluctuate, increased imports with the pick up in business activities, relatively high external debt service, and rising interest rates in the U.S.
The Survey showed mixed expectations by banks and the non-bank private sector firms on the direction of change in the exchange rate over the next 12 months (Chart 2b).
Particularly, the Survey showed that 62 percent of the non-bank private sector firms expected the Shilling to either strengthen or remain stable in the next 12 months supported by increased inflows from tea, coffee, and horticultural exports, a favourable political and economic environment, increased inflows due to the extended period of the tax amnesty, improved investor
Commercial Banks (%)
Non-Bank Private Firms (%)
Non-Banks Private Firms (%)
Commercial Banks (%)
strengthen20%
stable65%
weaken15% strengthen
23%
stable68%
weaken9%
Chart 2a: Expected direction of the KSh/USD Exchange Rate – July to August 2018 (%)
Chart 2b: Expected direction of the KSh/USD Exchange Rate – July 2018 to June 2019
strengthen20%
stable20%
weaken60%
strengthen28%
stable34%
weaken38%

8 | MPC MARKET PERCEPTIONS SURVEY - JULY 2018
6.2 Impact of the March 2018 MPC Decision to Lower the Central Bank Rate (CBR)
Commercial banks were asked to indicate the impact of the March 2018 MPC decision on their direction of lending to the private sector.
The lowering of the CBR, the first change in CBR since the enactment of the interest rate capping law, evoked different perceptions across bank tiers with re-gard to their expected direction of lending (Chart 3b).The Survey showed that more than half of the banks
Chart 3a: Expectations on Private Sector Credit growth for 2018(%)
6.1 Growth in Private Sector Credit in 2018
Commercial banks were asked to indicate their expect-ed increase in lending in the year 2018. The Survey showed that banks expected to increase their lending in 2018 relative to the 4.3 percent growth attained in June 2018 (Chart 3a).
Banks indicated that the expected increase in credit growth will be tied to economic growth and was also subject to strict appraisal of applications in view of the
interest rate capping law. The higher expectations of credit growth at the beginning of 2018 were explained by the expectation of a review of the interest rate caps law earlier in the year. The subsequent downward revisions in the March, May and July 2018 Surveys were attributed to delayed payment of contractors by the central and county governments, reluctance to lend due to exposure to non-performing loans, availability of lower risk alternative investments such as govern-ment securities, and the inability to effectively price risk due to the interest rate caps.
6. PRIVATE SECTOR CREDIT GROWTH EXPECTATIONS
14.9 14.5 14.0
20.9
10.0 10.08.6
14.6
10.3 10.69.2
11.4
8.6 8.97.4
9.5
0.0
5.0
10.0
15.0
20.0
25.0
All banks Large banks Medium banks Small banks
(%)
January 2018 Survey March 2018 SurveyMay 2018 Survey July 2018 SurveyActual Credit growth in June 2018
(55 percent) did not expect to change their expect-ed growth in credit to the private sector in 2018 rel-ative to the previous Surveys. These banks attributed their expectations to the need to minimize exposure to non-performing loans, the limitation of the interest rate capping regime to risk pricing, and the availability of alternative investment channels in the market. The banks also indicated that the magnitude of the CBR reduction was relatively small to cause a significant adjustment in lending, or restructuring of the existing loans. Additionally, 3 banks indicated that they ex-pected to reduce their lending in 2018 citing no room

| 9 MPC MARKET PERCEPTIONS SURVEY - JULY 2018
for absorbing provisions on lending with the reduced margins under the interest rate capping regime, and reluctance to lend due to exposure to higher non-per-forming loans. However, the Survey showed that 38 percent of the
Chart 3b: Impact of the Lowering of the CBR in March 2018 on Private Sector Credit Growth (No. of banks)
113
5
51
1
15
4
13
0
5
10
15
20
Large banks Medium banks Small banks
Significant Increase
Moderate increase
Marginal Increase
Marginal Decline
Moderate decline
Significant decline
No change
banks expected to increase lending following the re-duction of the CBR in March 2018. The banks attribut-ed this to expected increase in demand for credit by the private sector, economic recovery, and an improved business environment.
6.3 Demand for Credit by the Non-Bank Private Sector
The July 2018 Survey showed significant demand for credit by the private sector across key sectors of the economy (Chart 3c). Respondents in the real estate and construction, and agriculture (particularly horti-culture) sectors expected to increase their bank bor-rowing in 2018 largely for expansion purposes. The other sectors expected to increase their borrowing in order to improve their products, refurbish, upgrade, expand and increase competition.
There was consensus among respondents that the re-duction in the CBR in March 2018 was an incentive to increased borrowing, especially for the smaller players in the market. However, respondents indicat-ed that a raft of regulatory fees and many conditions
Chart 3c: Expected Increase in Demand for Private Sector Credit across Selected Sectors (%)
20.0
13.0
8.0
30.0
18.0
0.0
5.0
10.0
15.0
20.0
25.0
30.0
35.0
Agriculture Manufacturing Trade Real estate, andBuilding andconstruction
Tourism
(%)
and requirements set by banks, particularly after the introduction of interest rate capping, had discouraged borrowers from seeking funding from the banks.
10 | MPC MARKET PERCEPTIONS SURVEY - JULY 2018
7. ECONOMIC GROWTH EXPECTATIONS
Banks and non-bank private sector firms (including hotels) were requested to indicate their expected eco-nomic growth rate in 2018.
The Survey showed that banks and non-bank private sector firms revised their growth expectations for 2018 upwards relative to the previous surveys (Ta-ble 2). Respondents expected economic growth to be supported by a strong rebound in agriculture due to favourable weather conditions, completion of in-frastructure projects, increased Government spend-ing on the Big 4 priority projects, growth in tourism, prospects of oil exports, increased business invest-
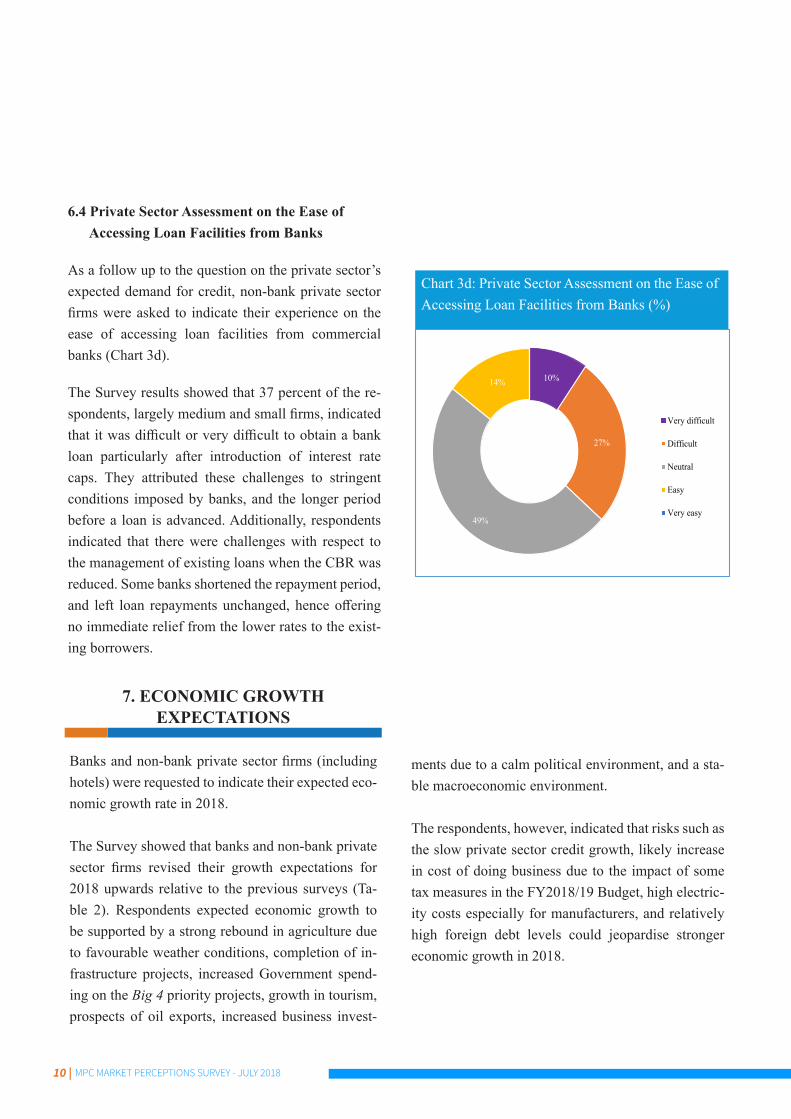
6.4 Private Sector Assessment on the Ease of Accessing Loan Facilities from Banks
As a follow up to the question on the private sector’s expected demand for credit, non-bank private sector firms were asked to indicate their experience on the ease of accessing loan facilities from commercial banks (Chart 3d).
The Survey results showed that 37 percent of the re-spondents, largely medium and small firms, indicated that it was difficult or very difficult to obtain a bank loan particularly after introduction of interest rate caps. They attributed these challenges to stringent conditions imposed by banks, and the longer period before a loan is advanced. Additionally, respondents indicated that there were challenges with respect to the management of existing loans when the CBR was reduced. Some banks shortened the repayment period, and left loan repayments unchanged, hence offering no immediate relief from the lower rates to the exist-ing borrowers.
Chart 3d: Private Sector Assessment on the Ease of Accessing Loan Facilities from Banks (%)
10%
27%
49%
14%
Very difficult
Difficult
Neutral
Easy
Very easy
ments due to a calm political environment, and a sta-ble macroeconomic environment.
The respondents, however, indicated that risks such as the slow private sector credit growth, likely increase in cost of doing business due to the impact of some tax measures in the FY2018/19 Budget, high electric-ity costs especially for manufacturers, and relatively high foreign debt levels could jeopardise stronger economic growth in 2018.

| 11 MPC MARKET PERCEPTIONS SURVEY - JULY 2018
Chart 4. Expectations on Economic Growth by Respondent Sectors for 2018 (%)
The economic growth expectations by respondents across sectors were also strong (Chart 4). The tourism sector was upbeat about growth prospects as it looked forward to the peak season. Respondents in the sector expected a strong performance of the sector in 2018 due to the wildebeest migration, the expected com-mencement of direct flights to and from the U.S., the resumption of direct flights by Air France to Nairobi,
Table 2. Expectations on Economic Growth (%)
5.4
5.5
5.3
5.3
5.5
5.1
5.4
5.3
5.5
5.6
5.5
5.9
5.6
6.2
5.5
5.5
5.6
5.6
5.7
5.9
6.1
6.1
6.1
6.3
5.0 5.2 5.4 5.6 5.8 6.0 6.2 6.4
Banks
Finance and Insurance (excl. banks)
Agriculture
Real Estate, Building and Construction
Manufacturing
Trade
Tourism (Incl. Hotels)
Transport
Jul 2018 Survey May 2018 Survey March 2018 Survey
and the prevailing political stability. Similarly, the manufacturing sector cited growing investor confi-dence, improving credit conditions, the focus by the Government on manufacturing as one of the Big 4 agendas, and the conducive business environment as factors that will support growth in the industry in 2018. Strong growth is also expected in the transport and trade sectors.
Survey Month Large banks
Medium banks
Small banks
All banks (weighted by size
of bank)MFBs Non-bank
private firms
Jan-2018 5.5 5.5 5.4 5.5 5.6 5.4
Mar-2018 5.4 5.3 5.4 5.4 5.5 5.4
May-2018 5.5 5.6 5.4 5.5 5.6 5.6
July-2018 5.5 5.6 5.8 5.6 5.6 5.9

12 | MPC MARKET PERCEPTIONS SURVEY - JULY 2018
8. OPTIMISM ON THE ECONOMY
8.1. Economic Prospects and Improvement in the Business Environment
Banks and non-bank private sector firms were asked to indicate their levels of optimism on the country’s economic prospects and improvements in the business environment going forward. The Survey showed sustained optimism on the economic prospects by banks and non-bank private sector firms in 2018 (Chart 5a and 5b).
Banks attributed their optimism to the recovery in agriculture due to favourable weather conditions, improved business environment, renewed business confidence, pick up in private sector economic activ-ity, increased foreign investments, the implementa-tion of the Big 4 agenda, likely review of the interest rate capping law which is expected to stimulate credit growth, the stable macroeconomic environment, po-litical stability, and the enhanced fight against corrup-tion. Risks to this optimism, according to the banks, included uncertainties with regard to the interest rate capping law amendment, delays by county and central government to settle pending bills, exposure to high non-performing loans, the likely impact of some of the tax measures in the FY2018/19 on the cost of do-ing business, and concerns over higher external debt service.
Similarly, non-bank private sector firms cited the completion of key infrastructural projects, the targeted support for the Big 4 agenda, macroeconomic stability, cheaper credit due to lower interest rates, improved performance of the agriculture sector due to improved weather conditions, prospects for oil exports, improved investor confidence, fight against corruption and political stability as the main factors influencing their
Chart 5a: Optimism by Banks on Economic Pros-pects and Improvement in the Business Environ-ment Going Forward (%)
Chart 5b: Optimism by Non-Bank Private Firms on Economic Prospects and Improvement in the Busi-ness Environment Going Forward (%)
30 27 25
70 73 70
2.5 2.5
0
10
20
30
40
50
60
70
80
90
100
Mar 2018 Survey May 2018 Survey Jul 2018 Survey
Very Optimistic Somewhat optimistic No Change Somewhat Pessimistic
4432 28
4860 62
8 6 72 3
0
10
20
30
40
50
60
70
80
90
100
Mar 2018 Survey May 2018 Survey Jul 2018 Survey
Very Optimistic Somewhat optimistic No Change Somewhat pessimistic
levels of optimism. Risks to the optimistic outlook included some of the tax measures in the FY2018/19 Budget, and concerns on the impact of corruption on realization of the Government’s development goals, and external debt levels.

| 13 MPC MARKET PERCEPTIONS SURVEY - JULY 2018
Chart 6a: Forward Hotel Bookings in the July 2018 Survey (percent of total capacity)
Chart 6b: Forward Hotel Bookings in the July 2017 Survey (percent of total capacity)
8.2 Forward Hotel Bookings
Hotels were requested to provide the levels of month-ly forward bookings for the period July to October 2018, expressed as a percentage of their total capaci-ty. A comparison of forward bookings in 2018 (Chart 6a) with those in July 2017 (Chart 6b), showed a no-table increase in the monthly bookings. Respondents attributed the increase to the July to mid September peak tourism holiday season due to the wildebeest mi-
48.753.1 54.9 57.1
74.0
100.0
86.0
70.0
50.0 47.555.0
60.0
20.0
30.0
40.0
50.0
60.0
70.0
80.0
90.0
100.0
Jul Aug Sep Oct
Mean Maximum Median
43.536.3 38.2
42.3
62.067.0
72.0 69.0
45.0
33.437.5
41.0
20.0
30.0
40.0
50.0
60.0
70.0
80.0
90.0
100.0
Jul Aug Sep Oct
Mean Maximum Median
gration, more favourable weather conditions in the country compared to the hot and humid summers in the northern hemisphere, and the calm political environment in 2018 compared to 2017.

14 | MPC MARKET PERCEPTIONS SURVEY - JULY 2018