Background informal technical document on techniques to ...
36
Background informal technical document on techniques to reduce pollutant emissions from cement production and determination of their costs TFTEI background informal technical document December 2020 Prepared by Citepa (TFTEI Techno-Scientific Secretariat) Nadine Allemand Etienne Feutren
Transcript of Background informal technical document on techniques to ...
Background informal technical document on techniques to reduce pollutant emissions from
cement production and determination of their costs
TFTEI background informal technical document
December 2020
Prepared by Citepa (TFTEI Techno-Scientific Secretariat)
Nadine Allemand
Etienne Feutren
TFTEI – Cement – December 2020 2
Background informal technical document on techniques to reduce pollutant emissions from
cement production and determination of their costs
December 2020
For more information
TFTEI Techno-Scientific Secretariat
Nadine Allemand (head of the secretariat)
Etienne Feutren
Citepa
42 Rue de Paradis
75010 Paris
Acknowledgments:
Nikos NIKOLAKAKOS, CEMBUREAU
Katharina FALLMANN, Brigitte WINTER – Austrian Environment Agency (Umweltbundesamt)
Maja BERNICKE - German Environment Agency (Umweltbundesamt)
TFTEI – Cement – December 2020 3
Content
Content............................................................................................................................... 3
List of tables ....................................................................................................................... 4
List of figures ..................................................................................................................... 5
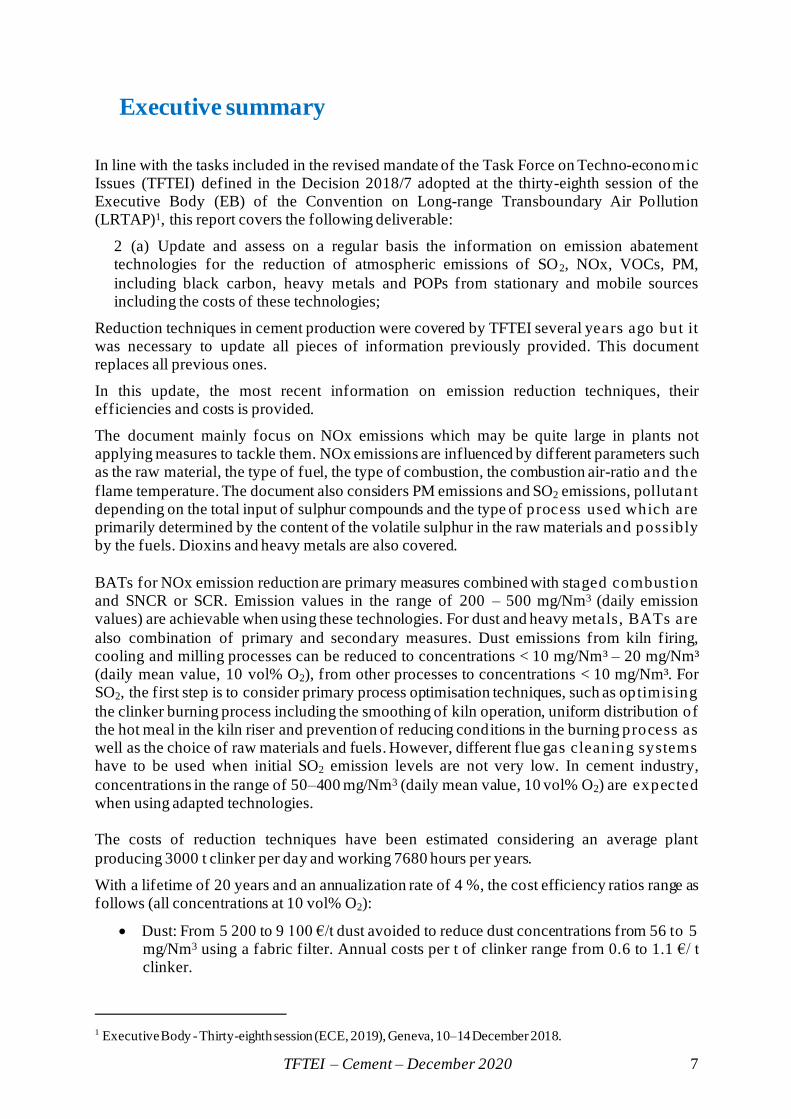
List of abbreviations and acronyms ..................................................................................... 6
Executive summary ............................................................................................................ 7
1. Introduction ................................................................................................................ 9
2. General information on the activity .............................................................................. 9
3. Emissions of pollutants from cement production and emission limit values (ELVs) in the
Protocols .......................................................................................................................... 10
4. Best available techniques ........................................................................................... 13
NOx ......................................................................................................................... 13
Dust and heavy metals................................................................................................... 17
SO2 ......................................................................................................................... 18
Dioxins......................................................................................................................... 19
5. Definition of reference installation/process and costs .................................................. 20
6. Summary of costs for emission reduction ................................................................... 21
Dust ......................................................................................................................... 21
NOx ......................................................................................................................... 22
SO2 ......................................................................................................................... 24
7. Annex 1 – Hypotheses used for estimation of costs of dust emission reduction techniques
................................................................................................................................. 26
8. Annex 2 – Hypotheses used for estimation of costs of NOx emission reduction
techniques ........................................................................................................................ 28
9. Annex 3 - Method and hypotheses used for estimation of costs of SO2 emission reduction
techniques ........................................................................................................................ 30
10. Annex 4 – Principles of costs estimation .................................................................... 33
Principles of the cost estimation..................................................................................... 33
Composition of Costs .................................................................................................... 33
Investment .................................................................................................................... 33
Operating Costs ............................................................................................................ 34
Adaptation to temporal differences ................................................................................ 34
11. Bibliography ............................................................................................................. 35
TFTEI – Cement – December 2020 4
List of tables
Table 1: Production of cement for some EU countries (Mt cement) [1] ............................... 10
Table 2: NOx limit values from cement plants according to annex V of the Gothenburg Protocol [5] ............................................................................................................... 11
Table 3: Dust limit values from cement plants according to annex V of the Gothenburg Protocol [5] ............................................................................................................... 11
Table 4: Limit values for dust and heavy metals according to the Aarhus Protocol amended [6]............................................................................................................................. 12
Table 5: BAT-associated emission levels for NOx from the flue-gases of kiln firing and/or preheating/precalcining processes in the cement industry [24]..................................... 16
Table 6: BAT-associated emission levels for NH3 when SNCR is used [24] ....................... 17
Table 7: Limit values for dust and heavy metals according to [7] ........................................ 18
Table 8: BAT-associated emission levels for metals from the flue gases firing processes..... 18
Table 9: BAT-associated emission levels for SO2 [24] ....................................................... 19
Table 10: Size of the reference installation......................................................................... 20
Table 11: Investments and operational costs to reduce dust emissions by FF ....................... 21
Table 12: Total annual costs and cost efficiency ratio for a FF in a plant of 3 000 t clinker/day ................................................................................................................................. 21
Table 13: Costs to reduce NOx emissions by SNCR in a plant of 3 000 t clinker/day [23] ... 22
Table 14: Total annual costs and cost efficiency ratio for a SNCR in a plant of 3 000 t clinker/day ................................................................................................................ 22
Table 15: Costs to reduce NOx emissions by SCR in a plant of 3 000 t clinker/day [23] ...... 22
Table 16: Total annual costs and cost efficiency ratio for a SCR in a plant of 3 000 t clinker/day ................................................................................................................ 23
Table 17: Key results for NOx abatement in the EU cement sector according to ECOFYS [9] ................................................................................................................................. 23
Table 18: Costs to reduce SO2 emissions by absorbent addition in a plant of 3 000 t clinker /day .......................................................................................................................... 24
Table 19: Total annual costs and cost efficiency ratio for adorbant addition in a plant of 3000 t clinker /day ............................................................................................................... 24
Table 20: Costs to reduce SO2 emissions by WFGD in a plant of 3000 t clinker /day........... 24
Table 21: Total annual costs and cost efficiency ratio for adorbant addition in a plant of 3 000 t clinker/day .............................................................................................................. 25
Table 21: Chemical Engineering Plan Cost Index [19] ....................................................... 34
TFTEI – Cement – December 2020 5
List of figures
Figure 1: SNCR efficiency according to the temperature [11] ............................................. 14
Figure 2: Evolution of plants equipped with SNCR and other techniques in Europe ([12] and CEMBUREAU information) ..................................................................................... 15
Figure 3: Capabilities of different techniques to reduce NOx emissions in cement plants [11] (MSC: multi-stage combustion) ................................................................................. 16
TFTEI – Cement – December 2020 6
List of abbreviations and acronyms
AGP Amended Gothenburg Protocol
BAT Best available techniques
BAT AELs BAT Associated Emission Levels
CaO Quicklime
Ca(OH)2 Slaked lime
Ca/S Ratio Calcium/Sulphur
CEIP EMEP Centre on Emission Inventories and Projections
CLRTAP Convention on Long-range Transboundary Air Pollution
CO Carbon monoxide
ECE Economic Commission for Europe
EGTEI Expert Group on Techno Economic Issues
ELV Emission limit values
EMEP European Monitoring and Evaluation Programme
FF Fabric filter
HCl Hydrogen chloride
HF Hydrogen fluoride
MSC Multi-stage combustion
NH3 Ammonia
NOx Nitrogen oxides
PCB Polychlorinated biphenyls
PCDD Polychlorinated dibenzo-p-dioxins
PCDF Polychlorinated dibenzofurans
SCR Selective Catalytic Reduction
SNCR Selective Non-Catalytic Reduction
SO2 Sulphur dioxide
TFTEI Task Force on Techno Economic Issues
TOC Total organic compounds
TSP Total suspended Particulates (equivalent to dust used in the report)
UBA Umweltbundesamt
UNECE United Nation Economic Commission for Europe
VOC Volatile organic compounds
TFTEI – Cement – December 2020 7
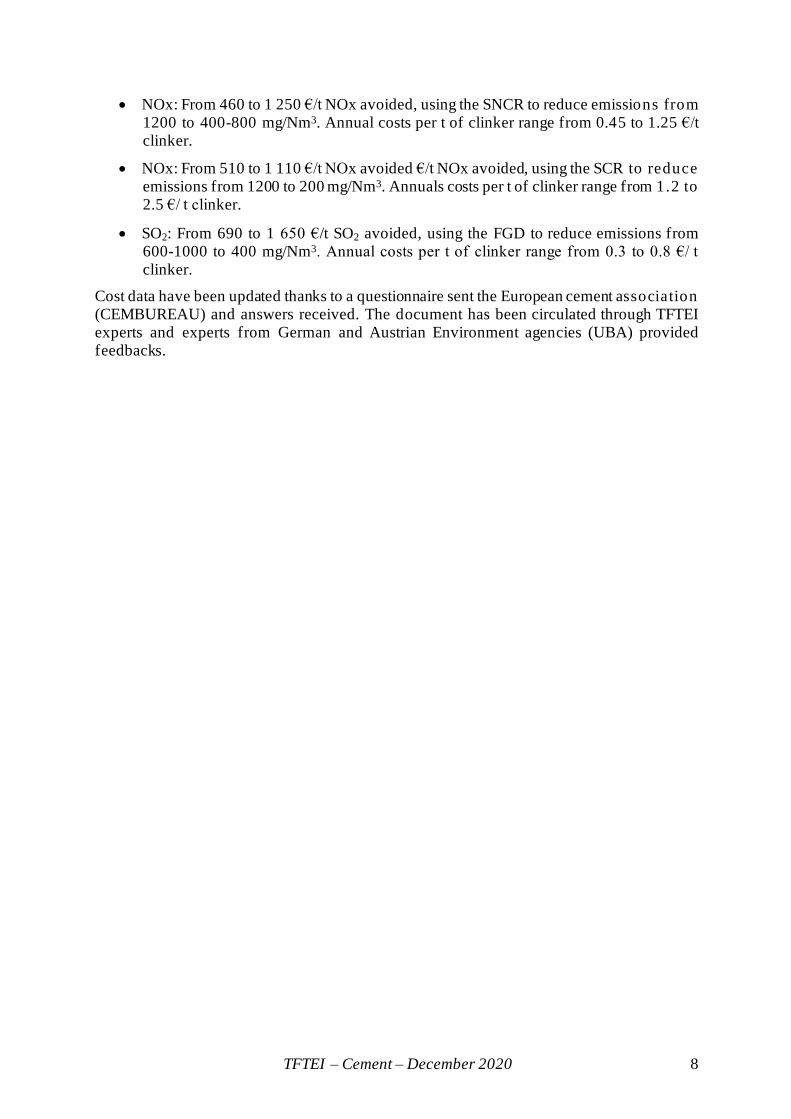
Executive summary
In line with the tasks included in the revised mandate of the Task Force on Techno-economic Issues (TFTEI) defined in the Decision 2018/7 adopted at the thirty-eighth session of the Executive Body (EB) of the Convention on Long-range Transboundary Air Pollution (LRTAP)1, this report covers the following deliverable:
2 (a) Update and assess on a regular basis the information on emission abatement technologies for the reduction of atmospheric emissions of SO2, NOx, VOCs, PM,
including black carbon, heavy metals and POPs from stationary and mobile sources including the costs of these technologies;
Reduction techniques in cement production were covered by TFTEI several years ago but it was necessary to update all pieces of information previously provided. This document replaces all previous ones.
In this update, the most recent information on emission reduction techniques, their efficiencies and costs is provided.
The document mainly focus on NOx emissions which may be quite large in plants not applying measures to tackle them. NOx emissions are influenced by different parameters such as the raw material, the type of fuel, the type of combustion, the combustion air-ratio and the
flame temperature. The document also considers PM emissions and SO2 emissions, pollutant depending on the total input of sulphur compounds and the type of process used which are primarily determined by the content of the volatile sulphur in the raw materials and possibly by the fuels. Dioxins and heavy metals are also covered.
BATs for NOx emission reduction are primary measures combined with staged combustion and SNCR or SCR. Emission values in the range of 200 – 500 mg/Nm3 (daily emission values) are achievable when using these technologies. For dust and heavy metals, BATs are
also combination of primary and secondary measures. Dust emissions from kiln firing, cooling and milling processes can be reduced to concentrations < 10 mg/Nm³ – 20 mg/Nm³ (daily mean value, 10 vol% O2), from other processes to concentrations < 10 mg/Nm³. For SO2, the first step is to consider primary process optimisation techniques, such as optimising
the clinker burning process including the smoothing of kiln operation, uniform distribution of the hot meal in the kiln riser and prevention of reducing conditions in the burning process as well as the choice of raw materials and fuels. However, different flue gas cleaning systems have to be used when initial SO2 emission levels are not very low. In cement industry,
concentrations in the range of 50–400 mg/Nm3 (daily mean value, 10 vol% O2) are expected when using adapted technologies. The costs of reduction techniques have been estimated considering an average plant
producing 3000 t clinker per day and working 7680 hours per years.
With a lifetime of 20 years and an annualization rate of 4 %, the cost efficiency ratios range as follows (all concentrations at 10 vol% O2):
• Dust: From 5 200 to 9 100 €/t dust avoided to reduce dust concentrations from 56 to 5 mg/Nm3 using a fabric filter. Annual costs per t of clinker range from 0.6 to 1.1 €/ t clinker.
1 Executive Body - Thirty-eighth session (ECE, 2019), Geneva, 10–14 December 2018.
TFTEI – Cement – December 2020 8
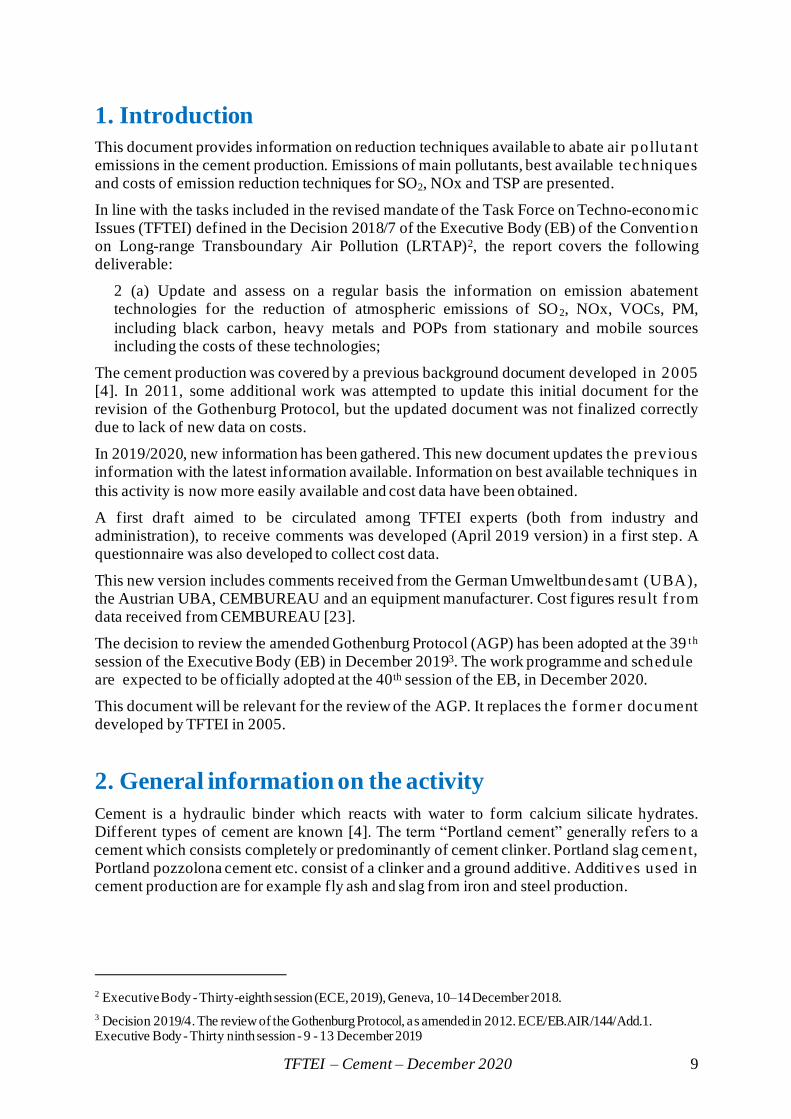
• NOx: From 460 to 1 250 €/t NOx avoided, using the SNCR to reduce emissions from 1200 to 400-800 mg/Nm3. Annual costs per t of clinker range from 0.45 to 1.25 €/t clinker.
• NOx: From 510 to 1 110 €/t NOx avoided €/t NOx avoided, using the SCR to reduce emissions from 1200 to 200 mg/Nm3. Annuals costs per t of clinker range from 1.2 to 2.5 €/ t clinker.
• SO2: From 690 to 1 650 €/t SO2 avoided, using the FGD to reduce emissions from 600-1000 to 400 mg/Nm3. Annual costs per t of clinker range from 0.3 to 0.8 €/ t clinker.
Cost data have been updated thanks to a questionnaire sent the European cement association (CEMBUREAU) and answers received. The document has been circulated through TFTEI experts and experts from German and Austrian Environment agencies (UBA) provided feedbacks.
TFTEI – Cement – December 2020 9
1. Introduction
This document provides information on reduction techniques available to abate air pollutant emissions in the cement production. Emissions of main pollutants, best available techniques and costs of emission reduction techniques for SO2, NOx and TSP are presented.
In line with the tasks included in the revised mandate of the Task Force on Techno-economic Issues (TFTEI) defined in the Decision 2018/7 of the Executive Body (EB) of the Convention on Long-range Transboundary Air Pollution (LRTAP)2, the report covers the following deliverable:
2 (a) Update and assess on a regular basis the information on emission abatement technologies for the reduction of atmospheric emissions of SO2, NOx, VOCs, PM,
including black carbon, heavy metals and POPs from stationary and mobile sources including the costs of these technologies;
The cement production was covered by a previous background document developed in 2005 [4]. In 2011, some additional work was attempted to update this initial document for the revision of the Gothenburg Protocol, but the updated document was not finalized correctly due to lack of new data on costs.
In 2019/2020, new information has been gathered. This new document updates the previous information with the latest information available. Information on best available techniques in
this activity is now more easily available and cost data have been obtained.
A first draft aimed to be circulated among TFTEI experts (both from industry and administration), to receive comments was developed (April 2019 version) in a first step. A questionnaire was also developed to collect cost data.
This new version includes comments received from the German Umweltbundesamt (UBA), the Austrian UBA, CEMBUREAU and an equipment manufacturer. Cost figures result f rom data received from CEMBUREAU [23].
The decision to review the amended Gothenburg Protocol (AGP) has been adopted at the 39 t h session of the Executive Body (EB) in December 20193. The work programme and schedule are expected to be officially adopted at the 40th session of the EB, in December 2020.
This document will be relevant for the review of the AGP. It replaces the f ormer document developed by TFTEI in 2005.
2. General information on the activity
Cement is a hydraulic binder which reacts with water to form calcium silicate hydrates. Different types of cement are known [4]. The term “Portland cement” generally refers to a cement which consists completely or predominantly of cement clinker. Portland slag cement, Portland pozzolona cement etc. consist of a clinker and a ground additive. Additives used in cement production are for example fly ash and slag from iron and steel production.
2 Executive Body - Thirty-eighth session (ECE, 2019), Geneva, 10–14 December 2018.
3 Decision 2019/4. The review of the Gothenburg Protocol, as amended in 2012. ECE/EB.AIR/144/Add.1. Executive Body - Thirty ninth session - 9 - 13 December 2019
TFTEI – Cement – December 2020 10
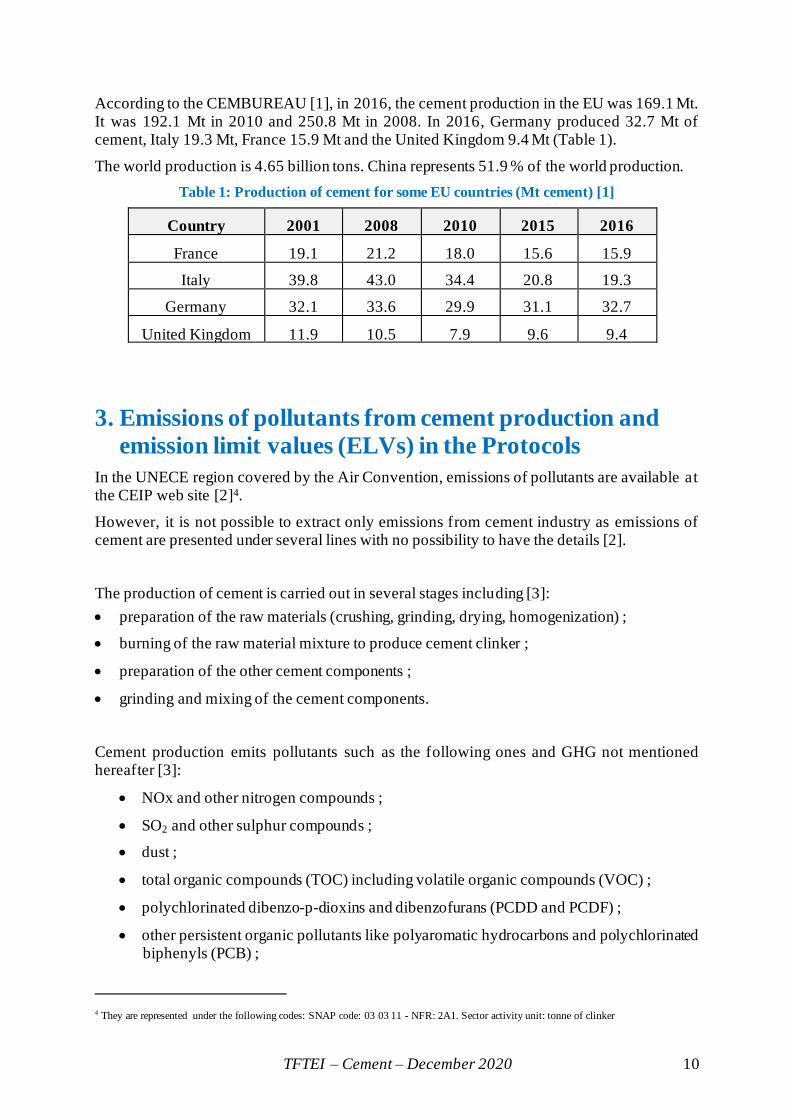
According to the CEMBUREAU [1], in 2016, the cement production in the EU was 169.1 Mt. It was 192.1 Mt in 2010 and 250.8 Mt in 2008. In 2016, Germany produced 32.7 Mt of cement, Italy 19.3 Mt, France 15.9 Mt and the United Kingdom 9.4 Mt (Table 1).
The world production is 4.65 billion tons. China represents 51.9 % of the world production.
Table 1: Production of cement for some EU countries (Mt cement) [1]
Country 2001 2008 2010 2015 2016
France 19.1 21.2 18.0 15.6 15.9
Italy 39.8 43.0 34.4 20.8 19.3
Germany 32.1 33.6 29.9 31.1 32.7
United Kingdom 11.9 10.5 7.9 9.6 9.4
3. Emissions of pollutants from cement production and
emission limit values (ELVs) in the Protocols
In the UNECE region covered by the Air Convention, emissions of pollutants are available at the CEIP web site [2]4.
However, it is not possible to extract only emissions from cement industry as emissions of cement are presented under several lines with no possibility to have the details [2].
The production of cement is carried out in several stages including [3]:
• preparation of the raw materials (crushing, grinding, drying, homogenization) ;
• burning of the raw material mixture to produce cement clinker ;
• preparation of the other cement components ;
• grinding and mixing of the cement components.
Cement production emits pollutants such as the following ones and GHG not mentioned hereafter [3]:
• NOx and other nitrogen compounds ;
• SO2 and other sulphur compounds ;
• dust ;
• total organic compounds (TOC) including volatile organic compounds (VOC) ;
• polychlorinated dibenzo-p-dioxins and dibenzofurans (PCDD and PCDF) ;
• other persistent organic pollutants like polyaromatic hydrocarbons and polychlorinated biphenyls (PCB) ;
4 They are represented under the following codes: SNAP code: 03 03 11 - NFR: 2A1. Sector activity unit: tonne of clinker
TFTEI – Cement – December 2020 11
• metals and their compounds, including mercury (Hg) and its compounds ;
• hydrogen fluoride (HF) ;
• hydrogen chloride (HCl) ;
• carbon monoxide (CO) ;
• ammonia (NH3) as ammonia slip from NOx-abatement with SNCR or SCR.
In the scope of this background document, developed in context of the UNECE Air Convention and its Protocols, a focus is given on SO2, NOx, dust, heavy metals (Hg, Pb and Cd) and PCDD/DF.
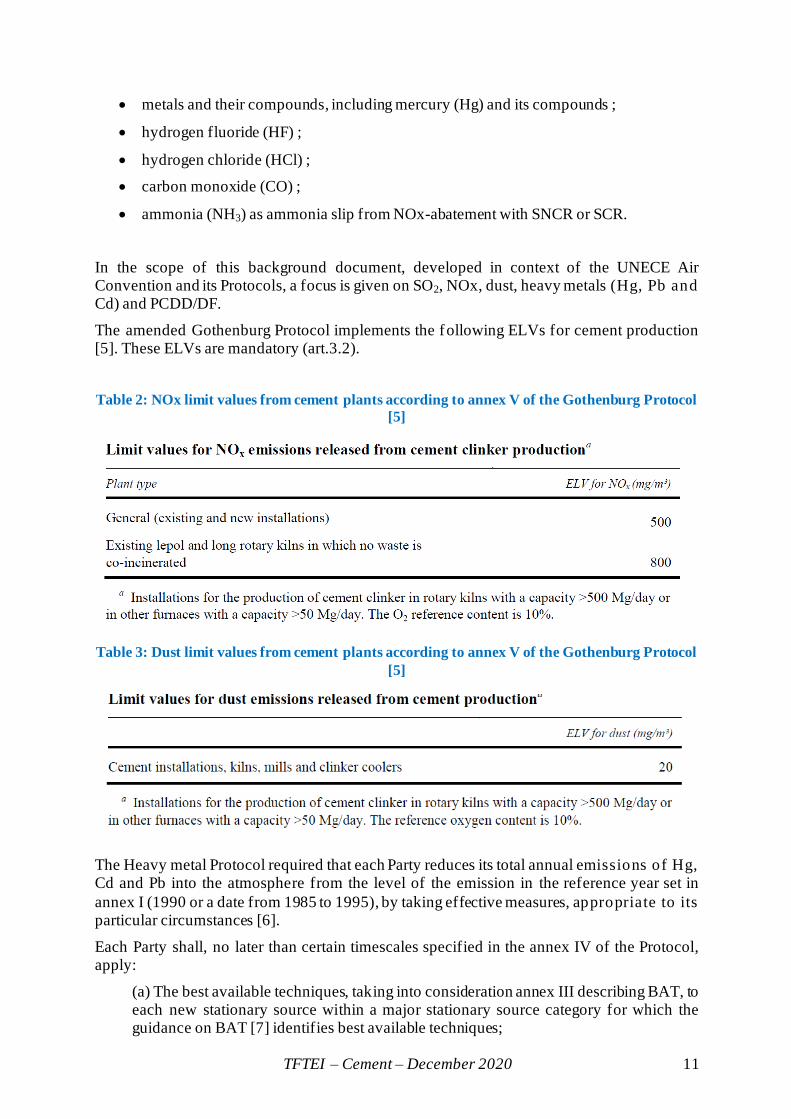
The amended Gothenburg Protocol implements the following ELVs for cement production [5]. These ELVs are mandatory (art.3.2).
Table 2: NOx limit values from cement plants according to annex V of the Gothenburg Protocol
[5]
Table 3: Dust limit values from cement plants according to annex V of the Gothenburg Protocol
[5]
The Heavy metal Protocol required that each Party reduces its total annual emissions of Hg, Cd and Pb into the atmosphere from the level of the emission in the reference year set in
annex I (1990 or a date from 1985 to 1995), by taking effective measures, appropriate to its particular circumstances [6].
Each Party shall, no later than certain timescales specified in the annex IV of the Protocol, apply:
(a) The best available techniques, taking into consideration annex III describing BAT, to each new stationary source within a major stationary source category for which the guidance on BAT [7] identifies best available techniques;
TFTEI – Cement – December 2020 12
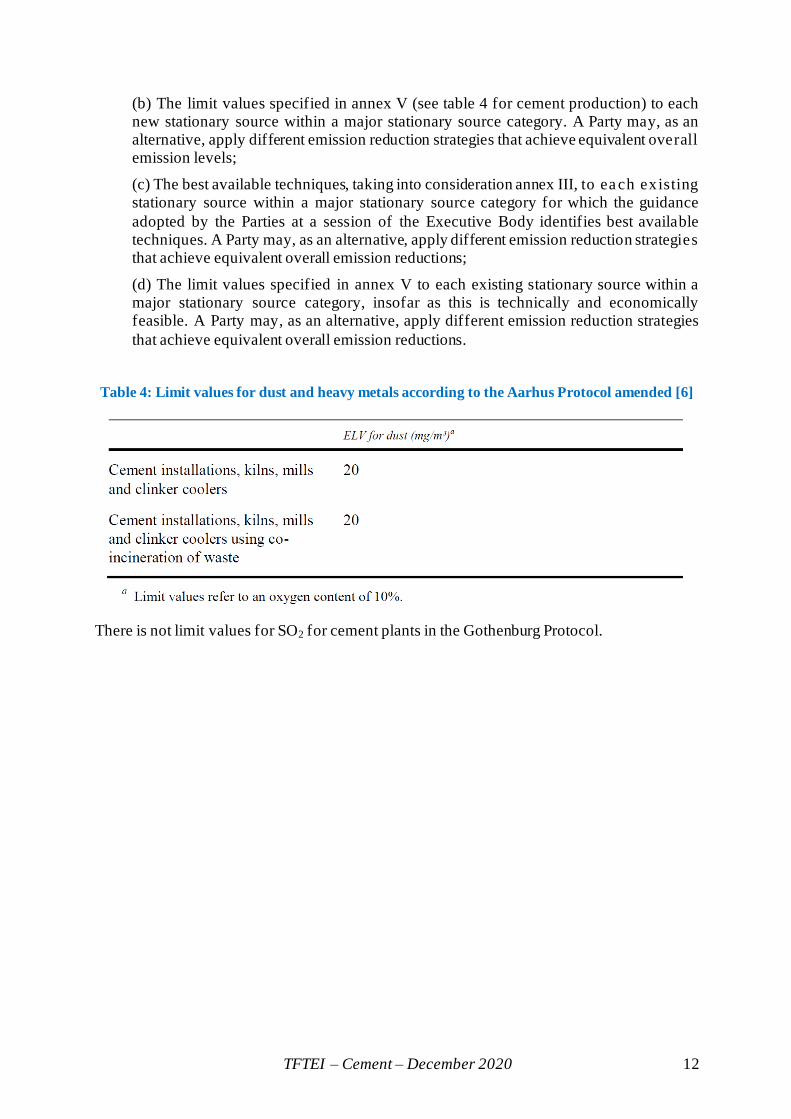
(b) The limit values specified in annex V (see table 4 for cement production) to each new stationary source within a major stationary source category. A Party may, as an alternative, apply different emission reduction strategies that achieve equivalent overall emission levels;
(c) The best available techniques, taking into consideration annex III, to ea ch existing stationary source within a major stationary source category for which the guidance
adopted by the Parties at a session of the Executive Body identifies best available techniques. A Party may, as an alternative, apply different emission reduction strategies that achieve equivalent overall emission reductions;
(d) The limit values specified in annex V to each existing stationary source within a major stationary source category, insofar as this is technically and economically feasible. A Party may, as an alternative, apply different emission reduction strategies
that achieve equivalent overall emission reductions.
Table 4: Limit values for dust and heavy metals according to the Aarhus Protocol amended [6]
There is not limit values for SO2 for cement plants in the Gothenburg Protocol.
TFTEI – Cement – December 2020 13
4. Best available techniques
NOx
In cement production, NOx emissions are influenced by different parameters such as the raw material, the type of fuel, the type of combustion, the combustion air-ratio and the flame
temperature. Thus, to reduce NOx emissions, several measures can be implemented [8].
Primary measures:
Among primary measures, flame cooling, low NOx burners, staged combustion, mid kiln firing and addition of mineralizers to the raw material are the main techniques used in cement
plants [8]:
(a) Flame cooling can be achieved by an addition of water to the fuel or directly to the flame. It lowers the temperature and so limits NOx formation;
(b) The addition of mineralizers, such as fluorine, to the raw material enables also the reduction of the sintering zone temperature and thus NOx formation.;
(c) Low NOx burners enable to reduce NOx emissions during combustion processes. Combustion with low NOx burner consists in a cold combustion with an internal or external flue gas recirculation. NOx reductions up to 35 % are achievable in successful installations and emission levels of 500–1000 mg/Nm3 in the raw waste gases have been reported with the use of this technology (the BAT Associated Emission Levels for NOx
from the flue gases of kiln firing and/or preheating/precalcining in the cement industry are given in Table 5 [3]);
(d) In staged combustion, the first combustion stage takes place in the rotary kiln . The second combustion stage is a burner at the kiln inlet; it decomposes nitrogen oxides generated in the first stage. In the third combustion stage the fuel is fed into the calciner with an amount of tertiary air. This system reduces the generation of NOx from the fuel,
and also decreases the NOx coming out of the kiln. In the fourth and final combustion stage, the remaining tertiary air is fed into the system as 'top air' for residual combustion. Staged firing technology can in general only be used with kilns equipped with a precalciner;
(e) Mid-kiln firing is applied in long wet or dry kilns. It creates a reducing zone by injecting fuel at an intermediate point in the kiln system. In some installations using this
technique, NOx reductions of 20–40% have been achieved [3].
As presented in reference [12], the optimum conditions for NOx prevention are frequently in conflict with the best setting for the kiln operations. There are also limits to this approach mainly due to the formation of CO and SO2 emissions. As a general rule, primary measures cannot guarantee the achievement of emission limits as low as 500 mg/Nm3 at 10% O2, daily average.
Primary measures are efficient, nevertheless secondary measures such as Selective Non-Catalytic Reduction (SNCR) or Selective Catalytic Reduction (SCR) need to be used to
achieve larger NOx emission reductions.
SNCR
Among the secondary measures, SNCR is the main technique considered in cement plants [12]. In SNCR, the conversion rate of around 60 to 80% is obtained with a stoichiometry ratio of 1.2 to 1.8 [3]. An efficiency of 30 to 50% requires a stoichiometry of 0.5 to 0.9. The
TFTEI – Cement – December 2020 14
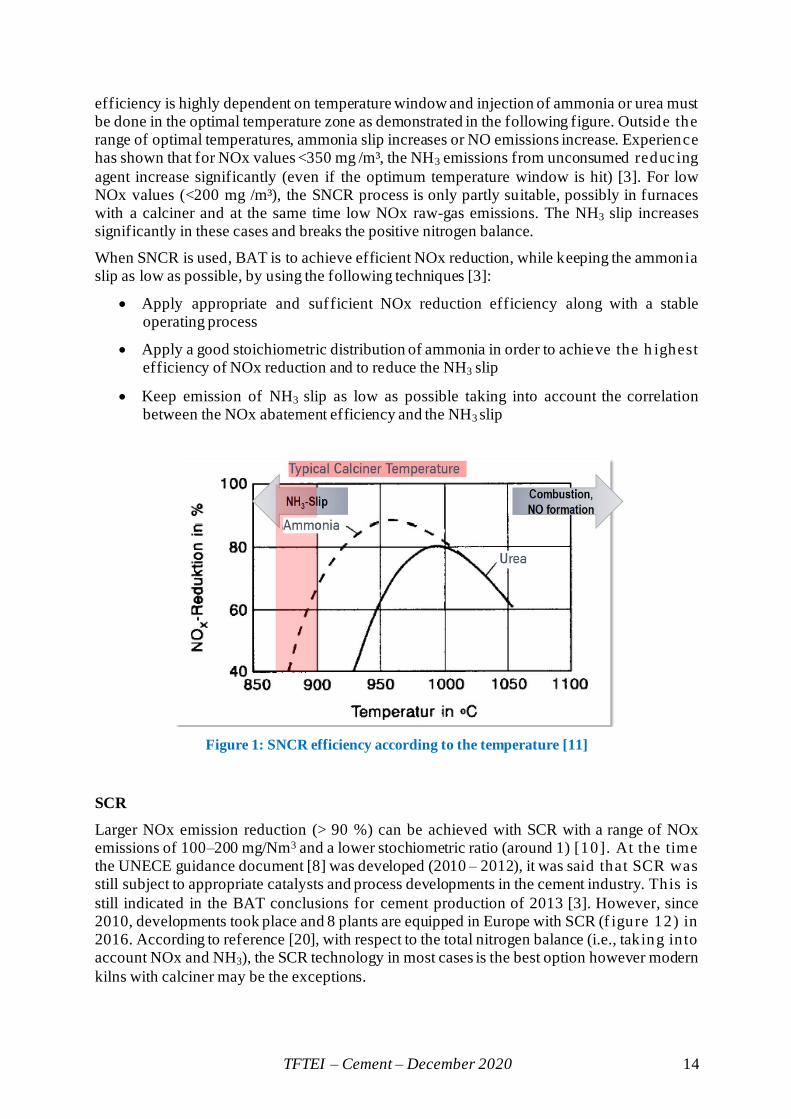
efficiency is highly dependent on temperature window and injection of ammonia or urea must be done in the optimal temperature zone as demonstrated in the following figure. Outside the range of optimal temperatures, ammonia slip increases or NO emissions increase. Experience has shown that for NOx values <350 mg /m³, the NH3 emissions from unconsumed reducing
agent increase significantly (even if the optimum temperature window is hit) [3]. For low NOx values (<200 mg /m³), the SNCR process is only partly suitable, possibly in furnaces with a calciner and at the same time low NOx raw-gas emissions. The NH3 slip increases significantly in these cases and breaks the positive nitrogen balance.
When SNCR is used, BAT is to achieve efficient NOx reduction, while keeping the ammonia slip as low as possible, by using the following techniques [3]:
• Apply appropriate and sufficient NOx reduction efficiency along with a stable operating process
• Apply a good stoichiometric distribution of ammonia in order to achieve the h ighest efficiency of NOx reduction and to reduce the NH3 slip
• Keep emission of NH3 slip as low as possible taking into account the correlation between the NOx abatement efficiency and the NH3 slip
Figure 1: SNCR efficiency according to the temperature [11]
SCR
Larger NOx emission reduction (> 90 %) can be achieved with SCR with a range of NOx emissions of 100–200 mg/Nm3 and a lower stochiometric ratio (around 1) [10]. At the time the UNECE guidance document [8] was developed (2010 – 2012), it was said that SCR was still subject to appropriate catalysts and process developments in the cement industry. This is
still indicated in the BAT conclusions for cement production of 2013 [3]. However, since 2010, developments took place and 8 plants are equipped in Europe with SCR (f igure 12) in 2016. According to reference [20], with respect to the total nitrogen balance (i.e., taking into account NOx and NH3), the SCR technology in most cases is the best option however modern
kilns with calciner may be the exceptions.
TFTEI – Cement – December 2020 15
Two systems exist, low dust configuration between a dedusting unit and stack, and high dust configuration between a preheater and a dedusting unit. Low dust exhaust gas systems require the reheating of the exhaust gases after dedusting [3].
TiO2 and V2O5 catalysts are most often used at temperature of ~300°C in which ammonia solution has been evaporated. Two or more layers of catalyst bricks are located after the pre -heater outlet (high-dust) or as a tail-end system after the process filter (low-dust). The catalyst
must always be adapted to the exhaust gas-specific situation in individual cases [20]. The catalyst lifetime ranges within 5 to 6 years [3], depending on the respective system configuration. High-dust catalysts are likely to be replaced faster than low-dust catalysts. To prevent catalyst deactivation, SO2 concentrations must be kept as low as possible [12].
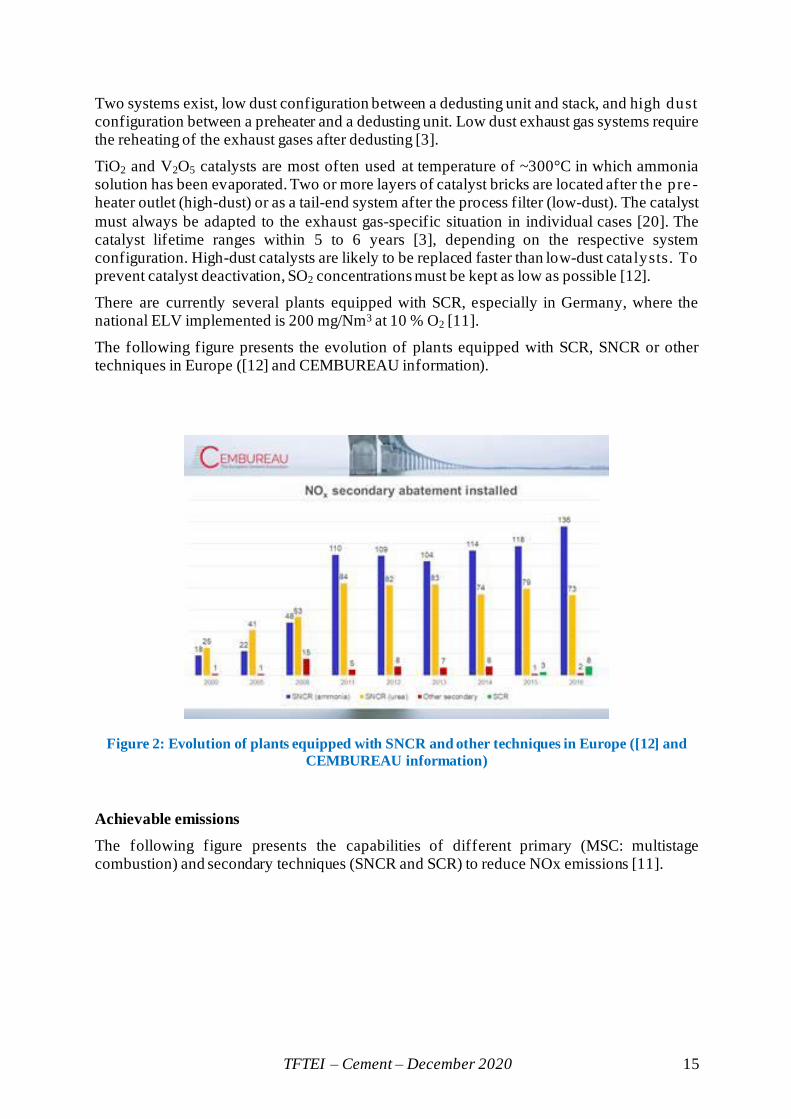
There are currently several plants equipped with SCR, especially in Germany, where the national ELV implemented is 200 mg/Nm3 at 10 % O2 [11].
The following figure presents the evolution of plants equipped with SCR, SNCR or other techniques in Europe ([12] and CEMBUREAU information).
Figure 2: Evolution of plants equipped with SNCR and other techniques in Europe ([12] and
CEMBUREAU information)
Achievable emissions
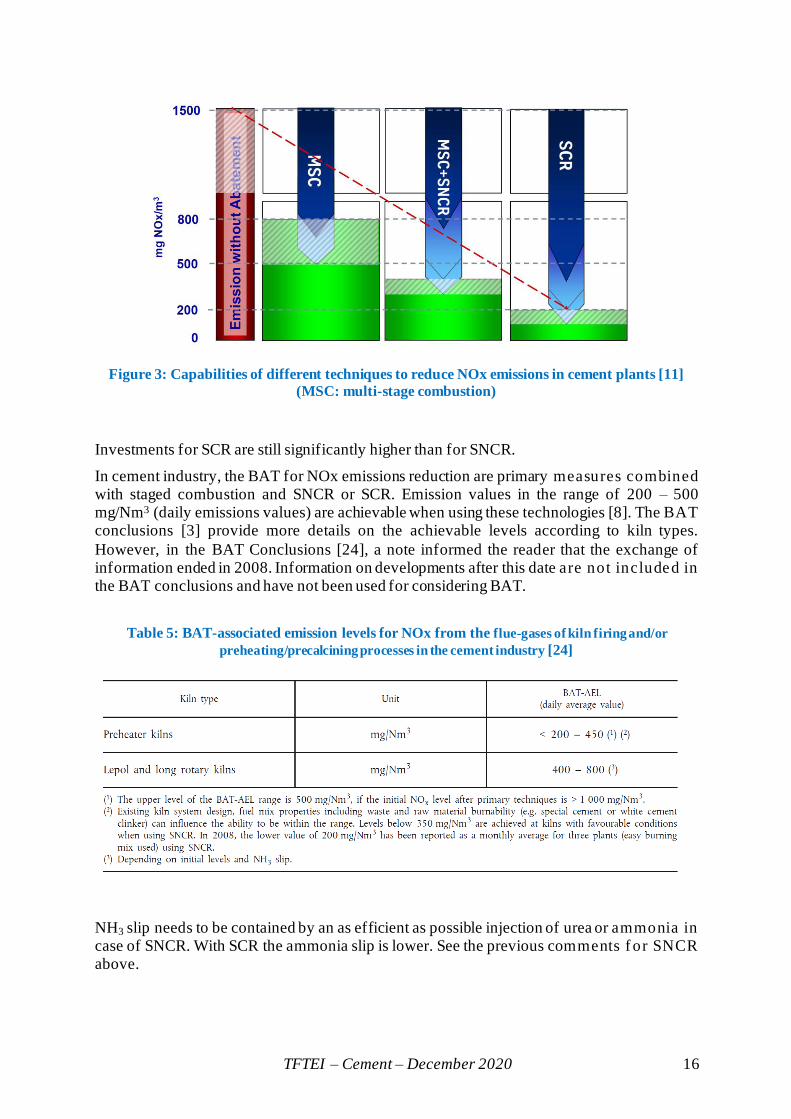
The following figure presents the capabilities of different primary (MSC: multistage combustion) and secondary techniques (SNCR and SCR) to reduce NOx emissions [11].
TFTEI – Cement – December 2020 16
Figure 3: Capabilities of different techniques to reduce NOx emissions in cement plants [11]
(MSC: multi-stage combustion)
Investments for SCR are still significantly higher than for SNCR.
In cement industry, the BAT for NOx emissions reduction are primary measures combined with staged combustion and SNCR or SCR. Emission values in the range of 200 – 500 mg/Nm3 (daily emissions values) are achievable when using these technologies [8]. The BAT conclusions [3] provide more details on the achievable levels according to kiln types.
However, in the BAT Conclusions [24], a note informed the reader that the exchange of information ended in 2008. Information on developments after this date are not included in the BAT conclusions and have not been used for considering BAT.
Table 5: BAT-associated emission levels for NOx from the flue-gases of kiln firing and/or
preheating/precalcining processes in the cement industry [24]
NH3 slip needs to be contained by an as efficient as possible injection of urea or ammonia in case of SNCR. With SCR the ammonia slip is lower. See the previous comments f or SNCR above.
TFTEI – Cement – December 2020 17
Table 6: BAT-associated emission levels for NH3 when SNCR is used [24]
In Germany [20], the emission limit value (NH3-slip + raw material-related emissions) is 30 mg / m³. Exceptions for higher limits are possible if these higher values are due to the composition of the raw materials.
Dust and heavy metals
BAT for the manufacturing of cement regarding dust and heavy metals emissions requires the combination of the following general primary measures [7] :
• A smooth and stable kiln process. Therefore, monitoring and measurement of process parameters and emissions on a regular basis is important;
• Careful selection and control of substances entering the kiln; if available selection of raw materials and fuels with low contents of sulphur, nitrogen, chlorine, metals (especially mercury) and volatile organic compounds should be preferred;
• Use of a quality assurance system to control the characteristics of wastes to be used as raw material and/or fuel for constant quality and other physical and chemical criteria. Relevant parameters for any waste to be used as raw material and/or fuel should be
controlled;
• Use of effective dust removal measures/techniques like fabric filters (FF) (with multiple compartments and “burst bag detectors”) or electrostatic precipitator (ESP) (with fast measuring and control equipment to minimize the number of carbon monoxide trips).
• Minimization or reduction of dust emissions from diffuse sources, through the use of the following measures and techniques:
(i) Minimization/prevention of dust emissions from diffuse sources;
(ii) Measure techniques for dusty operations;
(iii) Bulk storage area measures/techniques.
To reduce direct dust emissions from crushers, mills and dryers, FF are mainly used, whereas kiln and clinker cooler waste gases are controlled by ESP or FF.
Dust emissions from kiln firing, cooling and milling processes can be reduced to concentrations < 10 mg/Nm³ – 20 mg/Nm³ (daily mean value, 10 vol% O2), from other
processes to concentrations < 10 mg/Nm³ [7]. The EU BAT Conclusions for cement production [24] gives the same figures for kilns, just indicating that when FF or new and upgraded ESPs are applied, the lower limit is achieved.
TFTEI – Cement – December 2020 18
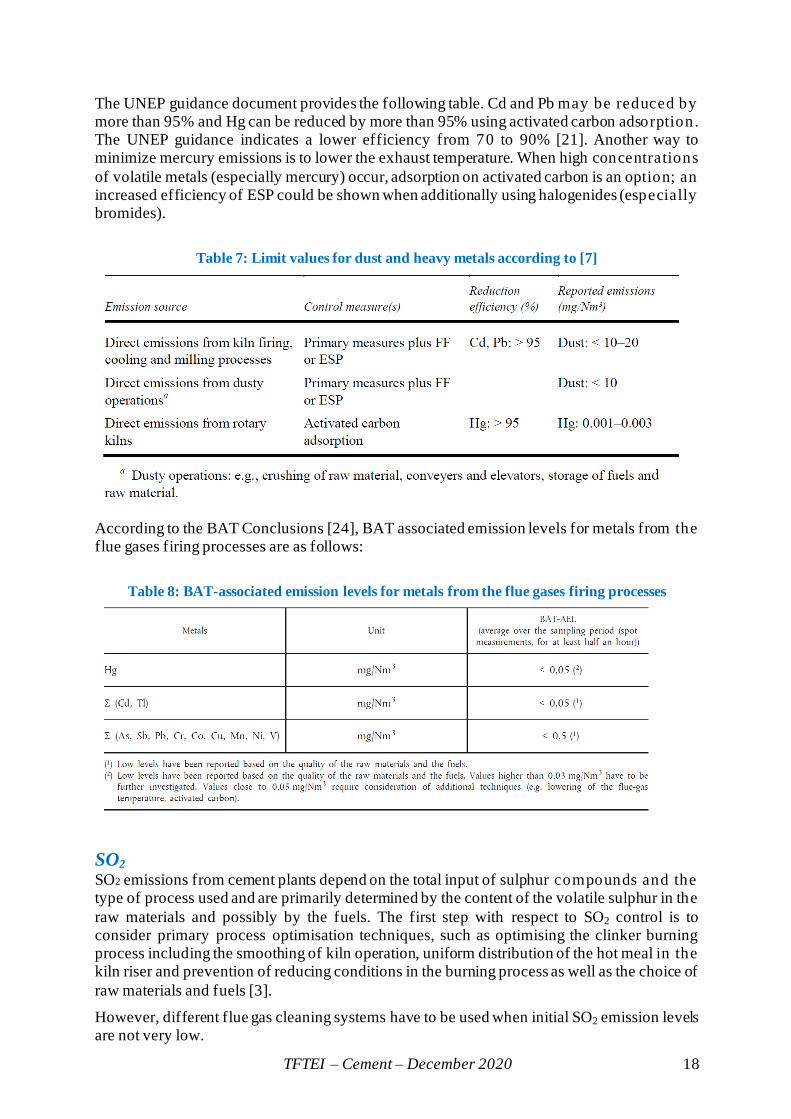
The UNEP guidance document provides the following table. Cd and Pb may be reduced by more than 95% and Hg can be reduced by more than 95% using activated carbon adsorption. The UNEP guidance indicates a lower efficiency from 70 to 90% [21]. Another way to minimize mercury emissions is to lower the exhaust temperature. When high concentrations
of volatile metals (especially mercury) occur, adsorption on activated carbon is an option; an increased efficiency of ESP could be shown when additionally using halogenides (especially bromides).
Table 7: Limit values for dust and heavy metals according to [7]
According to the BAT Conclusions [24], BAT associated emission levels for metals from the flue gases firing processes are as follows:
Table 8: BAT-associated emission levels for metals from the flue gases firing processes
SO2 SO2 emissions from cement plants depend on the total input of sulphur compounds and the type of process used and are primarily determined by the content of the volatile sulphur in the
raw materials and possibly by the fuels. The first step with respect to SO2 control is to consider primary process optimisation techniques, such as optimising the clinker burning process including the smoothing of kiln operation, uniform distribution of the hot meal in the kiln riser and prevention of reducing conditions in the burning process as well as the choice of
raw materials and fuels [3].
However, different flue gas cleaning systems have to be used when initial SO2 emission levels are not very low.

TFTEI – Cement – December 2020 19
• The addition of absorbents such as slaked lime (Ca(OH)2), quicklime (CaO) or activated fly ash with high CaO content can be added to the raw materials or injected in the flue gas and can absorb a portion of the SO2.
• In flue gases, this injection can be carried out in dry or wet form. The use of Ca(OH) 2 based absorbents with a high specific surface area and high porosity is recommended. The low reactivity of these absorbents implies to apply a Ca/S molar ratio of between
3 and 6 in cases of dry process.
• In particular cases, when emissions cannot be lowered by other abatement techniques, wet scrubbing can be among the BAT for desulphurization. In wet scrubbing technologies, the flue gas is first de-dusted then cleaned by an atomized solution of alkali compounds. SO2 reacts with this absorbent to form different by-products, which
can be upgraded as sulphuric acid, sulphur, gypsum or scrubbing agent. A SO2 reduction of more than 90% can be expected.
The BAT AELs can be met by applying absorbent addition or wet scrubber.
Regarding the absorbent addition it should be taken into account that the cost of absorbents implies increasing operational costs for increasing SO2 concentrations, so that this measure might not be cost effective anymore for initial SO2 emissions levels above 1 200 mg/m³.
In cement industry, concentrations in the range of 50–400 mg/Nm3 are expected when using adapted technologies. The following table gives an overview of BAT assoc iated emission levels for SO2 for cement manufacturing according to reference [24].
Table 9: BAT-associated emission levels for SO2 [24]
Dioxins
Limitations of emissions are carried out by a series of good practices considered as BAT such as [3]:
• Carefully selecting and controlling of kiln inputs (raw materials), i.e., chlorine, copper and volatile organic compounds
• Carefully selecting and controlling kiln inputs (fuels), i.e. chlorine and copper
• Limiting/avoiding the use of wastes which contain chlorinated organic materials
• Avoid feeding fuels with a high content of halogens (e.g. chlorine) in secondary firing
• Stop co-incinerating waste for operations such as start-ups and/or shutdowns
The use of SCR also reduces PCDD/F [22].
TFTEI – Cement – December 2020 20
Emissions of PCDD/F from the flue-gases of the kiln firing processes can be contained f rom <0,05 – 0,1 ng PCDD/ F I-TEQ/Nm3, as the average over the sampling period (6 – 8 hours) [24].
5. Definition of reference installation/process and costs
According to the methodology set up by the former EGTEI expert group, costs are tentatively defined using a bottom-up approach as much as possible. Costs are defined considering one or several reference installations, considered to be representative of the activity. For cement, it
was proposed by the ad-hoc working group set up in 2003 [4] to use one reference installation for the whole cement sector and not to take into account the different processes (wet, dry…).
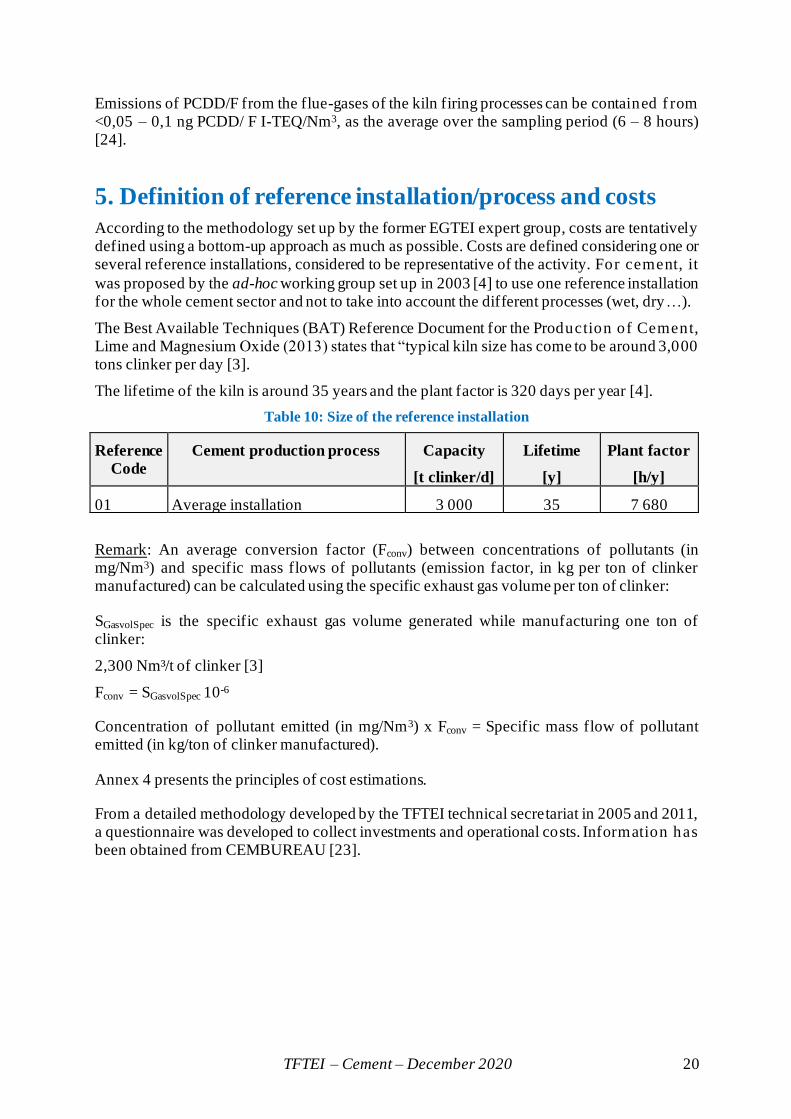
The Best Available Techniques (BAT) Reference Document for the Production of Cement, Lime and Magnesium Oxide (2013) states that “typical kiln size has come to be around 3,000 tons clinker per day [3].
The lifetime of the kiln is around 35 years and the plant factor is 320 days per year [4].
Table 10: Size of the reference installation
Remark: An average conversion factor (Fconv) between concentrations of pollutants (in mg/Nm3) and specific mass flows of pollutants (emission factor, in kg per ton of clinker manufactured) can be calculated using the specific exhaust gas volume per ton of clinker:
SGasvolSpec is the specific exhaust gas volume generated while manufacturing one ton of clinker:
2,300 Nm³/t of clinker [3]
Fconv = SGasvolSpec 10-6
Concentration of pollutant emitted (in mg/Nm3) x Fconv = Specific mass flow of pollutant emitted (in kg/ton of clinker manufactured).
Annex 4 presents the principles of cost estimations.
From a detailed methodology developed by the TFTEI technical secretariat in 2005 and 2011, a questionnaire was developed to collect investments and operational costs. Information has been obtained from CEMBUREAU [23].
Reference
Code
Cement production process Capacity
[t clinker/d]
Lifetime
[y]
Plant factor
[h/y]
01 Average installation 3 000 35 7 680
TFTEI – Cement – December 2020 21
6. Summary of costs for emission reduction
In order to update the cost data, a questionnaire was developed by the technical secretariat to collect updated investments and operational costs. Information has been obtained from CEMBUREAU [23].
The following tables summarize costs for dust, NOx and SO2 abatement techniques. The details and assumptions are presented respectively in annexes I to III for each pollutant.
Dust
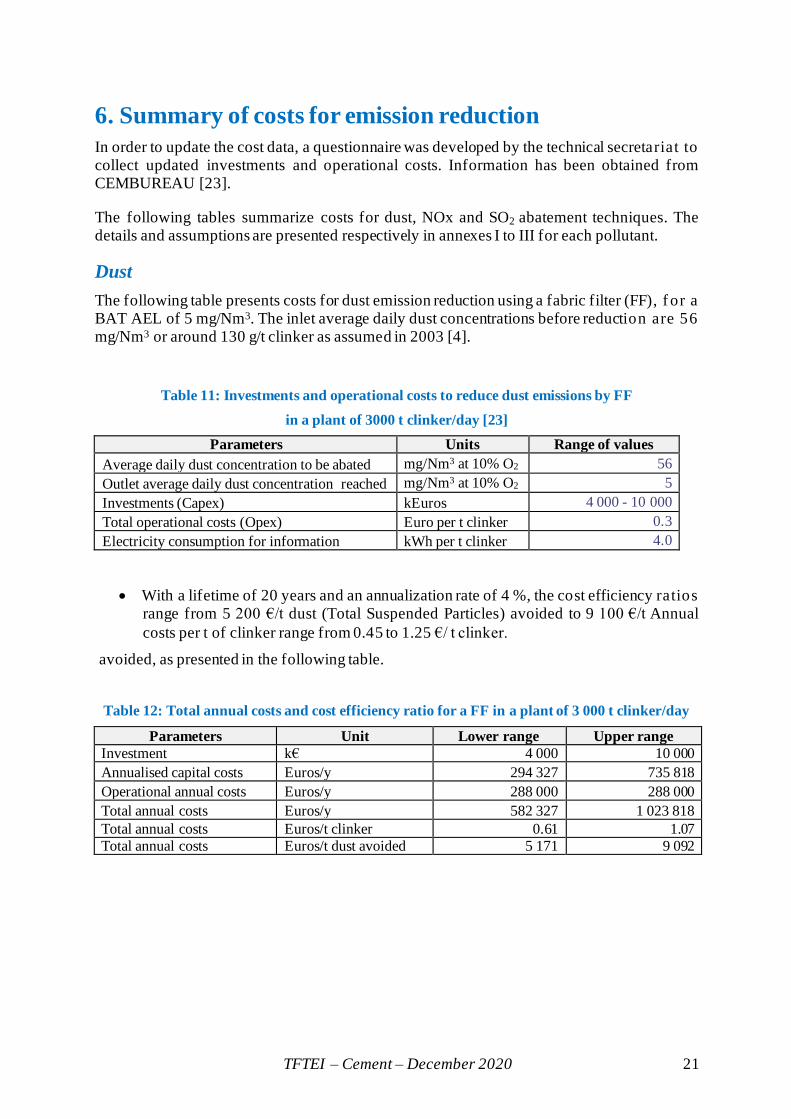
The following table presents costs for dust emission reduction using a fabric filter (FF), f or a BAT AEL of 5 mg/Nm3. The inlet average daily dust concentrations before reduction are 56 mg/Nm3 or around 130 g/t clinker as assumed in 2003 [4].
Table 11: Investments and operational costs to reduce dust emissions by FF
in a plant of 3000 t clinker/day [23]
Parameters Units Range of values
Average daily dust concentration to be abated mg/Nm3 at 10% O2 56
Outlet average daily dust concentration reached mg/Nm3 at 10% O2 5
Investments (Capex) kEuros 4 000 - 10 000
Total operational costs (Opex) Euro per t clinker 0.3
Electricity consumption for information kWh per t clinker 4.0
• With a lifetime of 20 years and an annualization rate of 4 %, the cost efficiency ratios range from 5 200 €/t dust (Total Suspended Particles) avoided to 9 100 €/t Annual
costs per t of clinker range from 0.45 to 1.25 €/ t clinker.
avoided, as presented in the following table.
Table 12: Total annual costs and cost efficiency ratio for a FF in a plant of 3 000 t clinker/day
Parameters Unit Lower range Upper range
Investment k€ 4 000 10 000
Annualised capital costs Euros/y 294 327 735 818
Operational annual costs Euros/y 288 000 288 000
Total annual costs Euros/y 582 327 1 023 818
Total annual costs Euros/t clinker 0.61 1.07
Total annual costs Euros/t dust avoided 5 171 9 092
TFTEI – Cement – December 2020 22
NOx
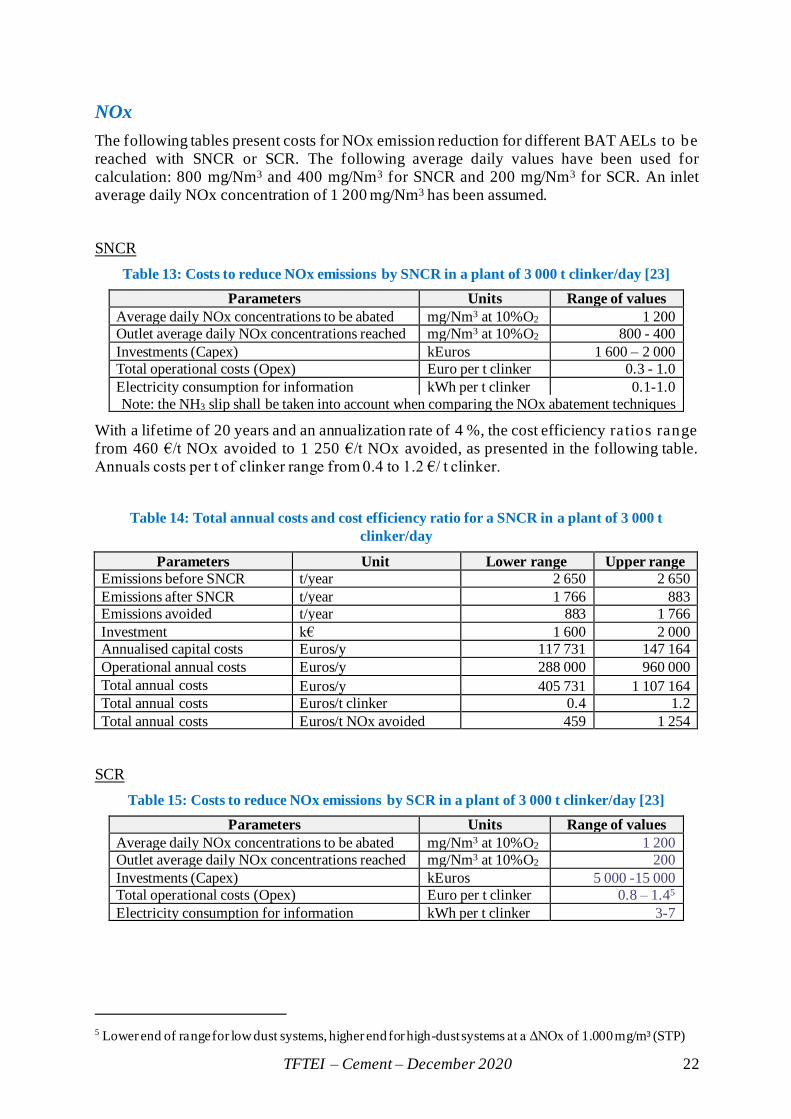
The following tables present costs for NOx emission reduction for different BAT AELs to be reached with SNCR or SCR. The following average daily values have been used for calculation: 800 mg/Nm3 and 400 mg/Nm3 for SNCR and 200 mg/Nm3 for SCR. An inlet average daily NOx concentration of 1 200 mg/Nm3 has been assumed.
SNCR
Table 13: Costs to reduce NOx emissions by SNCR in a plant of 3 000 t clinker/day [23]
Parameters Units Range of values
Average daily NOx concentrations to be abated mg/Nm3 at 10%O2 1 200
Outlet average daily NOx concentrations reached mg/Nm3 at 10%O2 800 - 400
Investments (Capex) kEuros 1 600 – 2 000
Total operational costs (Opex) Euro per t clinker 0.3 - 1.0
Electricity consumption for information kWh per t clinker 0.1- 1.0
Note: the NH3 slip shall be taken into account when comparing the NOx abatement techniques
With a lifetime of 20 years and an annualization rate of 4 %, the cost efficiency ratios range from 460 €/t NOx avoided to 1 250 €/t NOx avoided, as presented in the following table. Annuals costs per t of clinker range from 0.4 to 1.2 €/ t clinker.
Table 14: Total annual costs and cost efficiency ratio for a SNCR in a plant of 3 000 t
clinker/day
Parameters Unit Lower range Upper range
Emissions before SNCR t/year 2 650 2 650
Emissions after SNCR t/year 1 766 883
Emissions avoided t/year 883 1 766
Investment k€ 1 600 2 000
Annualised capital costs Euros/y 117 731 147 164
Operational annual costs Euros/y 288 000 960 000
Total annual costs Euros/y 405 731 1 107 164
Total annual costs Euros/t clinker 0.4 1.2
Total annual costs Euros/t NOx avoided 459 1 254
SCR
Table 15: Costs to reduce NOx emissions by SCR in a plant of 3 000 t clinker/day [23]
Parameters Units Range of values
Average daily NOx concentrations to be abated mg/Nm3 at 10%O2 1 200
Outlet average daily NOx concentrations reached mg/Nm3 at 10%O2 200
Investments (Capex) kEuros 5 000 -15 000
Total operational costs (Opex) Euro per t clinker 0.8 – 1.45
Electricity consumption for information kWh per t clinker 3-7
5 Lower end of range for low dust systems, higher end for high-dust systems at a ΔNOx of 1.000 mg/m³ (STP)
TFTEI – Cement – December 2020 23
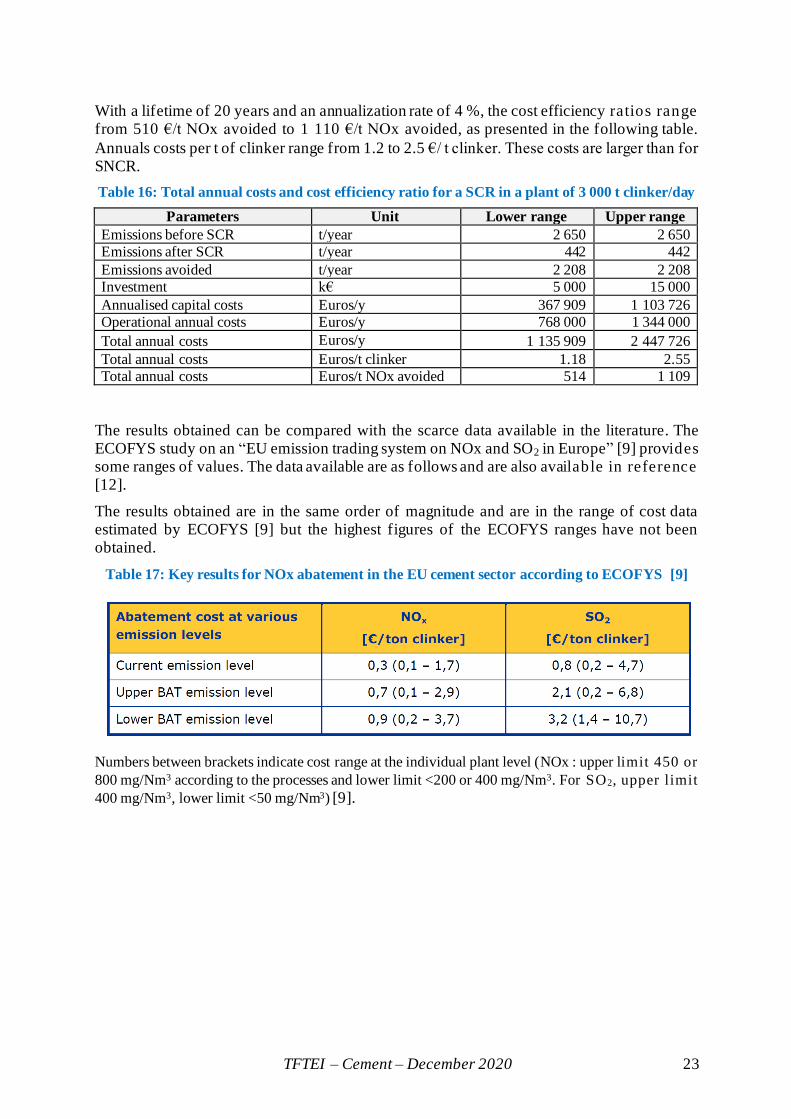
With a lifetime of 20 years and an annualization rate of 4 %, the cost efficiency ratios range from 510 €/t NOx avoided to 1 110 €/t NOx avoided, as presented in the following table.
Annuals costs per t of clinker range from 1.2 to 2.5 €/ t clinker. These costs are larger than for SNCR.
Table 16: Total annual costs and cost efficiency ratio for a SCR in a plant of 3 000 t clinker/day
Parameters Unit Lower range Upper range
Emissions before SCR t/year 2 650 2 650
Emissions after SCR t/year 442 442
Emissions avoided t/year 2 208 2 208
Investment k€ 5 000 15 000
Annualised capital costs Euros/y 367 909 1 103 726
Operational annual costs Euros/y 768 000 1 344 000
Total annual costs Euros/y 1 135 909 2 447 726
Total annual costs Euros/t clinker 1.18 2.55
Total annual costs Euros/t NOx avoided 514 1 109
The results obtained can be compared with the scarce data available in the literature. The ECOFYS study on an “EU emission trading system on NOx and SO2 in Europe” [9] provides some ranges of values. The data available are as follows and are also available in reference [12].
The results obtained are in the same order of magnitude and are in the range of cost data estimated by ECOFYS [9] but the highest figures of the ECOFYS ranges have not been obtained.
Table 17: Key results for NOx abatement in the EU cement sector according to ECOFYS [9]
Numbers between brackets indicate cost range at the individual plant level (NOx : upper limit 450 or
800 mg/Nm3 according to the processes and lower limit <200 or 400 mg/Nm3. For SO2, upper limit
400 mg/Nm3, lower limit <50 mg/Nm3) [9].
TFTEI – Cement – December 2020 24
SO2
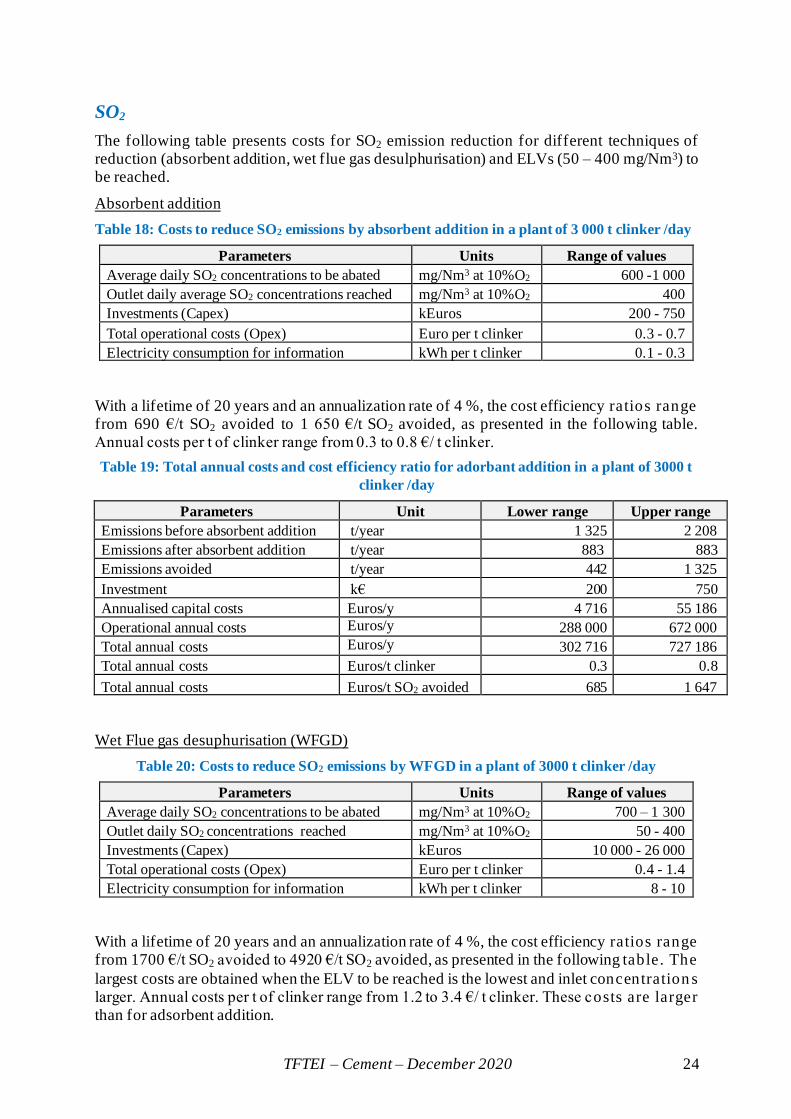
The following table presents costs for SO2 emission reduction for different techniques of reduction (absorbent addition, wet flue gas desulphurisation) and ELVs (50 – 400 mg/Nm3) to be reached.
Absorbent addition
Table 18: Costs to reduce SO2 emissions by absorbent addition in a plant of 3 000 t clinker /day
Parameters Units Range of values
Average daily SO2 concentrations to be abated mg/Nm3 at 10%O2 600 -1 000
Outlet daily average SO2 concentrations reached mg/Nm3 at 10%O2 400
Investments (Capex) kEuros 200 - 750
Total operational costs (Opex) Euro per t clinker 0.3 - 0.7
Electricity consumption for information kWh per t clinker 0.1 - 0.3
With a lifetime of 20 years and an annualization rate of 4 %, the cost efficiency ratios range from 690 €/t SO2 avoided to 1 650 €/t SO2 avoided, as presented in the following table. Annual costs per t of clinker range from 0.3 to 0.8 €/ t clinker.
Table 19: Total annual costs and cost efficiency ratio for adorbant addition in a plant of 3000 t
clinker /day
Parameters Unit Lower range Upper range
Emissions before absorbent addition t/year 1 325 2 208
Emissions after absorbent addition t/year 883 883
Emissions avoided t/year 442 1 325
Investment k€ 200 750
Annualised capital costs Euros/y 4 716 55 186
Operational annual costs Euros/y 288 000 672 000
Total annual costs Euros/y 302 716 727 186
Total annual costs Euros/t clinker 0.3 0.8
Total annual costs Euros/t SO2 avoided 685 1 647
Wet Flue gas desuphurisation (WFGD)
Table 20: Costs to reduce SO2 emissions by WFGD in a plant of 3000 t clinker /day
Parameters Units Range of values
Average daily SO2 concentrations to be abated mg/Nm3 at 10%O2 700 – 1 300
Outlet daily SO2 concentrations reached mg/Nm3 at 10%O2 50 - 400
Investments (Capex) kEuros 10 000 - 26 000
Total operational costs (Opex) Euro per t clinker 0.4 - 1.4
Electricity consumption for information kWh per t clinker 8 - 10
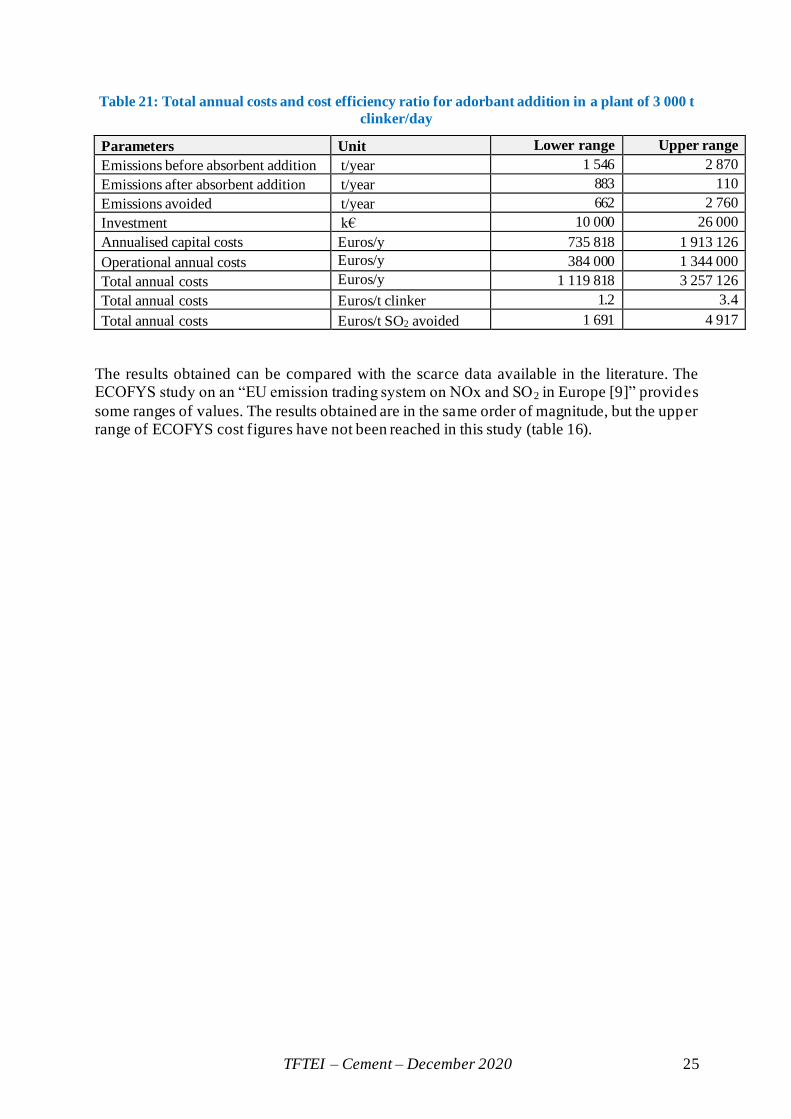
With a lifetime of 20 years and an annualization rate of 4 %, the cost efficiency ratios range from 1700 €/t SO2 avoided to 4920 €/t SO2 avoided, as presented in the following table. The
largest costs are obtained when the ELV to be reached is the lowest and inlet concentration s larger. Annual costs per t of clinker range from 1.2 to 3.4 €/ t clinker. These costs are larger than for adsorbent addition.
TFTEI – Cement – December 2020 25
Table 21: Total annual costs and cost efficiency ratio for adorbant addition in a plant of 3 000 t
clinker/day
Parameters Unit Lower range Upper range
Emissions before absorbent addition t/year 1 546 2 870
Emissions after absorbent addition t/year 883 110
Emissions avoided t/year 662 2 760
Investment k€ 10 000 26 000
Annualised capital costs Euros/y 735 818 1 913 126
Operational annual costs Euros/y 384 000 1 344 000
Total annual costs Euros/y 1 119 818 3 257 126
Total annual costs Euros/t clinker 1.2 3.4
Total annual costs Euros/t SO2 avoided 1 691 4 917
The results obtained can be compared with the scarce data available in the literature. The ECOFYS study on an “EU emission trading system on NOx and SO2 in Europe [9]” provides
some ranges of values. The results obtained are in the same order of magnitude, but the upper range of ECOFYS cost figures have not been reached in this study (table 16).
TFTEI – Cement – December 2020 26
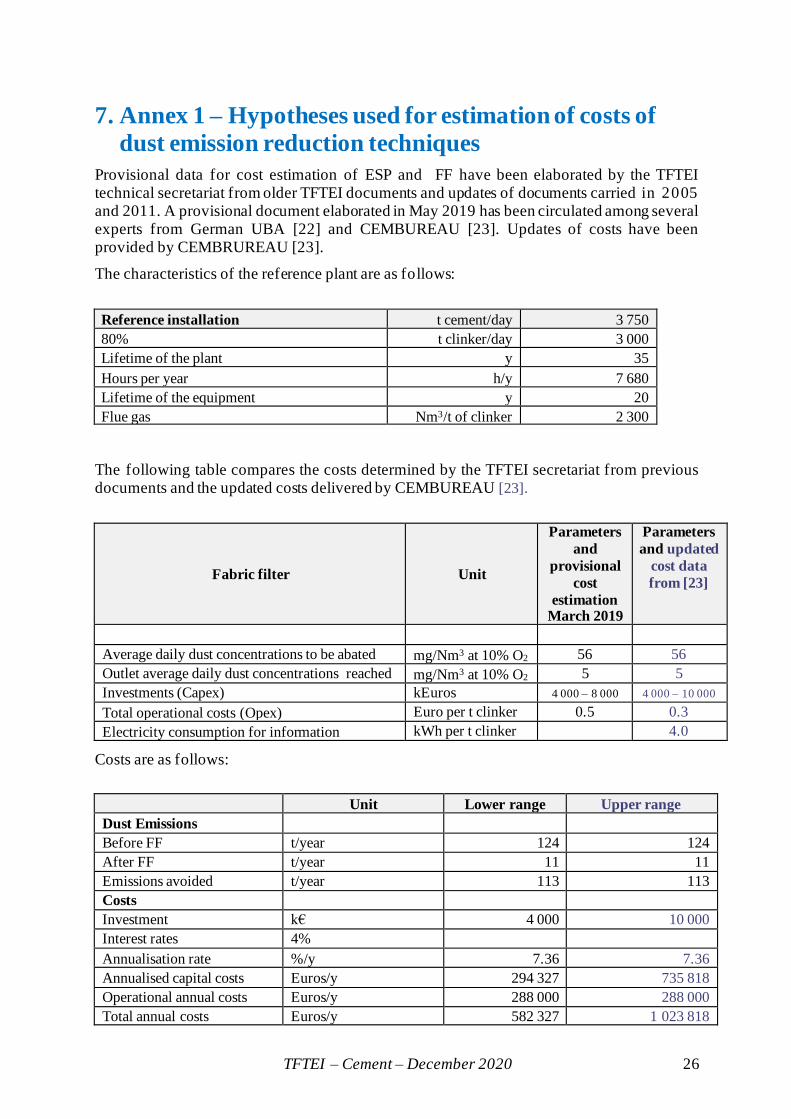
7. Annex 1 – Hypotheses used for estimation of costs of
dust emission reduction techniques
Provisional data for cost estimation of ESP and FF have been elaborated by the TFTEI technical secretariat from older TFTEI documents and updates of documents carried in 2005 and 2011. A provisional document elaborated in May 2019 has been circulated among several experts from German UBA [22] and CEMBUREAU [23]. Updates of costs have been provided by CEMBRUREAU [23].
The characteristics of the reference plant are as follows:
Reference installation t cement/day 3 750
80% t clinker/day 3 000
Lifetime of the plant y 35
Hours per year h/y 7 680
Lifetime of the equipment y 20
Flue gas Nm3/t of clinker 2 300
The following table compares the costs determined by the TFTEI secretariat from previous documents and the updated costs delivered by CEMBUREAU [23].
Fabric filter Unit
Parameters
and
provisional
cost
estimation March 2019
Parameters
and updated
cost data
from [23]
Average daily dust concentrations to be abated mg/Nm3 at 10% O2 56 56
Outlet average daily dust concentrations reached mg/Nm3 at 10% O2 5 5
Investments (Capex) kEuros 4 000 – 8 000 4 000 – 10 000
Total operational costs (Opex) Euro per t clinker 0.5 0.3
Electricity consumption for information kWh per t clinker 4.0
Costs are as follows:
Unit Lower range Upper range
Dust Emissions
Before FF t/year 124 124
After FF t/year 11 11
Emissions avoided t/year 113 113
Costs
Investment k€ 4 000 10 000
Interest rates 4%
Annualisation rate %/y 7.36 7.36
Annualised capital costs Euros/y 294 327 735 818
Operational annual costs Euros/y 288 000 288 000
Total annual costs Euros/y 582 327 1 023 818

TFTEI – Cement – December 2020 27
Unit Lower range Upper range
Total annual costs Euros/t clinker
0.61 1.07
Total annual costs Euros/t dus avoided 5 171 9 092
TFTEI – Cement – December 2020 28
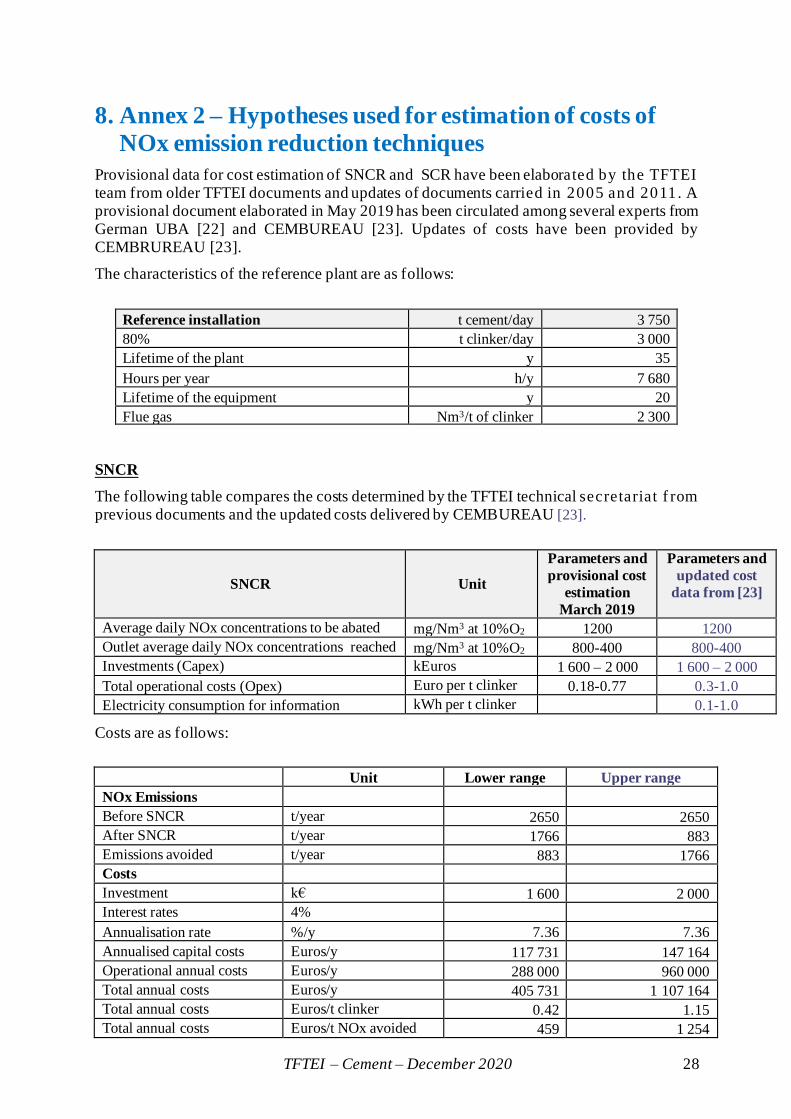
8. Annex 2 – Hypotheses used for estimation of costs of
NOx emission reduction techniques
Provisional data for cost estimation of SNCR and SCR have been elaborated by the TFTEI team from older TFTEI documents and updates of documents carried in 2005 and 2011. A provisional document elaborated in May 2019 has been circulated among several experts from German UBA [22] and CEMBUREAU [23]. Updates of costs have been provided by CEMBRUREAU [23].
The characteristics of the reference plant are as follows:
Reference installation t cement/day 3 750
80% t clinker/day 3 000
Lifetime of the plant y 35
Hours per year h/y 7 680
Lifetime of the equipment y 20
Flue gas Nm3/t of clinker 2 300
SNCR
The following table compares the costs determined by the TFTEI technical secretariat f rom previous documents and the updated costs delivered by CEMBUREAU [23].
SNCR Unit
Parameters and
provisional cost
estimation
March 2019
Parameters and
updated cost
data from [23]
Average daily NOx concentrations to be abated mg/Nm3 at 10%O2 1200 1200
Outlet average daily NOx concentrations reached mg/Nm3 at 10%O2 800-400 800-400
Investments (Capex) kEuros 1 600 – 2 000 1 600 – 2 000
Total operational costs (Opex) Euro per t clinker 0.18-0.77 0.3-1.0
Electricity consumption for information kWh per t clinker 0.1-1.0
Costs are as follows:
Unit Lower range Upper range
NOx Emissions
Before SNCR t/year 2650 2650
After SNCR t/year 1766 883
Emissions avoided t/year 883 1766
Costs
Investment k€ 1 600 2 000
Interest rates 4% Annualisation rate %/y 7.36 7.36
Annualised capital costs Euros/y 117 731 147 164
Operational annual costs Euros/y 288 000 960 000
Total annual costs Euros/y 405 731 1 107 164
Total annual costs Euros/t clinker 0.42 1.15
Total annual costs Euros/t NOx avoided 459 1 254
TFTEI – Cement – December 2020 29
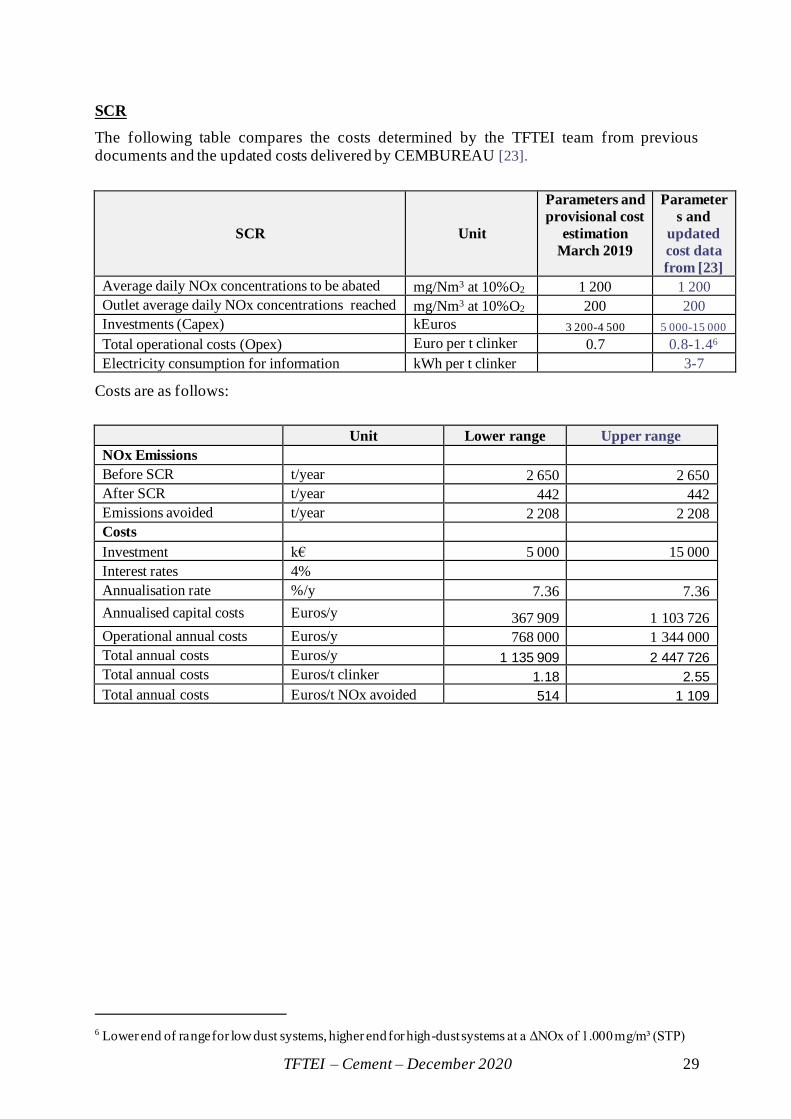
SCR
The following table compares the costs determined by the TFTEI team from previous documents and the updated costs delivered by CEMBUREAU [23].
SCR Unit
Parameters and
provisional cost
estimation
March 2019
Parameter
s and
updated
cost data
from [23]
Average daily NOx concentrations to be abated mg/Nm3 at 10%O2 1 200 1 200
Outlet average daily NOx concentrations reached mg/Nm3 at 10%O2 200 200
Investments (Capex) kEuros 3 200-4 500 5 000-15 000
Total operational costs (Opex) Euro per t clinker 0.7 0.8-1.46
Electricity consumption for information kWh per t clinker 3-7
Costs are as follows:
Unit Lower range Upper range
NOx Emissions
Before SCR t/year 2 650 2 650
After SCR t/year 442 442
Emissions avoided t/year 2 208 2 208
Costs
Investment k€ 5 000 15 000
Interest rates 4% Annualisation rate %/y 7.36 7.36
Annualised capital costs Euros/y 367 909 1 103 726
Operational annual costs Euros/y 768 000 1 344 000
Total annual costs Euros/y 1 135 909 2 447 726
Total annual costs Euros/t clinker 1.18 2.55
Total annual costs Euros/t NOx avoided 514 1 109
6 Lower end of range for low dust systems, higher end for high-dust systems at a ΔNOx of 1.000 mg/m³ (STP)
TFTEI – Cement – December 2020 30
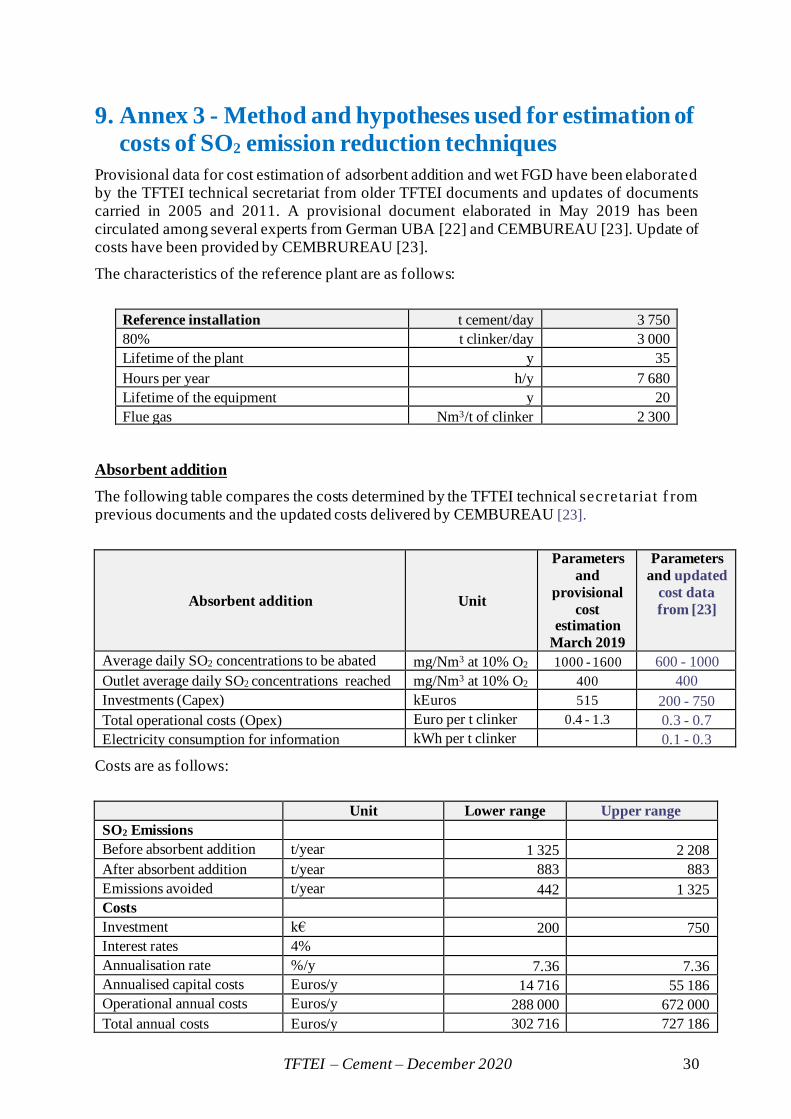
9. Annex 3 - Method and hypotheses used for estimation of
costs of SO2 emission reduction techniques
Provisional data for cost estimation of adsorbent addition and wet FGD have been elaborated by the TFTEI technical secretariat from older TFTEI documents and updates of documents carried in 2005 and 2011. A provisional document elaborated in May 2019 has been circulated among several experts from German UBA [22] and CEMBUREAU [23]. Update of costs have been provided by CEMBRUREAU [23].
The characteristics of the reference plant are as follows:
Reference installation t cement/day 3 750
80% t clinker/day 3 000
Lifetime of the plant y 35
Hours per year h/y 7 680
Lifetime of the equipment y 20
Flue gas Nm3/t of clinker 2 300
Absorbent addition
The following table compares the costs determined by the TFTEI technical secretariat f rom previous documents and the updated costs delivered by CEMBUREAU [23].
Absorbent addition Unit
Parameters
and
provisional
cost estimation
March 2019
Parameters
and updated
cost data
from [23]
Average daily SO2 concentrations to be abated mg/Nm3 at 10% O2 1000 - 1600 600 - 1000
Outlet average daily SO2 concentrations reached mg/Nm3 at 10% O2 400 400
Investments (Capex) kEuros 515 200 - 750
Total operational costs (Opex) Euro per t clinker 0.4 - 1.3 0.3 - 0.7
Electricity consumption for information kWh per t clinker 0.1 - 0.3
Costs are as follows:
Unit Lower range Upper range
SO2 Emissions
Before absorbent addition t/year 1 325 2 208
After absorbent addition t/year 883 883
Emissions avoided t/year 442 1 325
Costs
Investment k€ 200 750
Interest rates 4% Annualisation rate %/y 7.36 7.36
Annualised capital costs Euros/y 14 716 55 186
Operational annual costs Euros/y 288 000 672 000
Total annual costs Euros/y 302 716 727 186
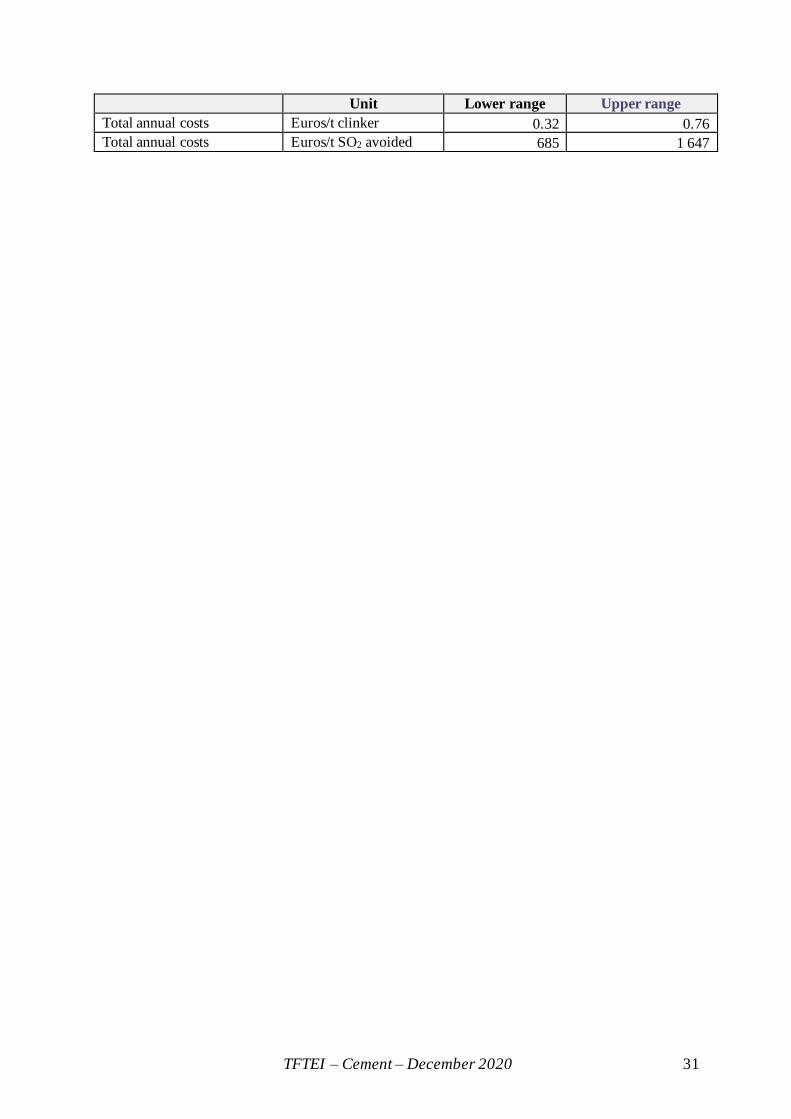
TFTEI – Cement – December 2020 31
Unit Lower range Upper range
Total annual costs Euros/t clinker 0.32 0.76
Total annual costs Euros/t SO2 avoided 685 1 647
TFTEI – Cement – December 2020 32
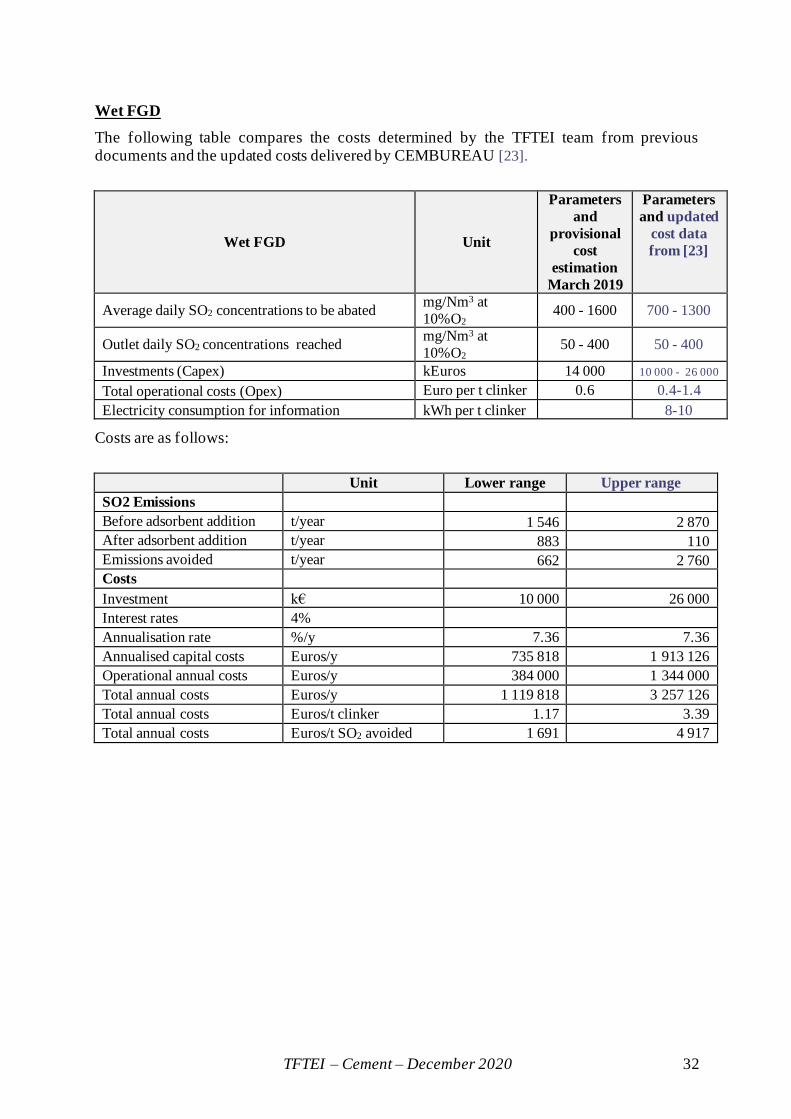
Wet FGD
The following table compares the costs determined by the TFTEI team from previous documents and the updated costs delivered by CEMBUREAU [23].
Wet FGD Unit
Parameters
and
provisional
cost
estimation
March 2019
Parameters
and updated
cost data
from [23]
Average daily SO2 concentrations to be abated mg/Nm3 at
10%O2 400 - 1600 700 - 1300
Outlet daily SO2 concentrations reached mg/Nm3 at
10%O2 50 - 400 50 - 400
Investments (Capex) kEuros 14 000 10 000 - 26 000
Total operational costs (Opex) Euro per t clinker 0.6 0.4-1.4
Electricity consumption for information kWh per t clinker 8-10
Costs are as follows:
Unit Lower range Upper range
SO2 Emissions
Before adsorbent addition t/year 1 546 2 870
After adsorbent addition t/year 883 110
Emissions avoided t/year 662 2 760
Costs
Investment k€ 10 000 26 000
Interest rates 4%
Annualisation rate %/y 7.36 7.36
Annualised capital costs Euros/y 735 818 1 913 126
Operational annual costs Euros/y 384 000 1 344 000
Total annual costs Euros/y 1 119 818 3 257 126
Total annual costs Euros/t clinker 1.17 3.39
Total annual costs Euros/t SO2 avoided 1 691 4 917
TFTEI – Cement – December 2020 33
10. Annex 4 – Principles of costs estimation
Principles of the cost estimation
The methodology developed for estimating costs aims at being as consistent and transparent as possible. To help with comparison of the data, cost components are clearly stated. As far as possible, recommendations of the Reference document on Economic and Cross Media Effects of the European Commission are taken into account [14].
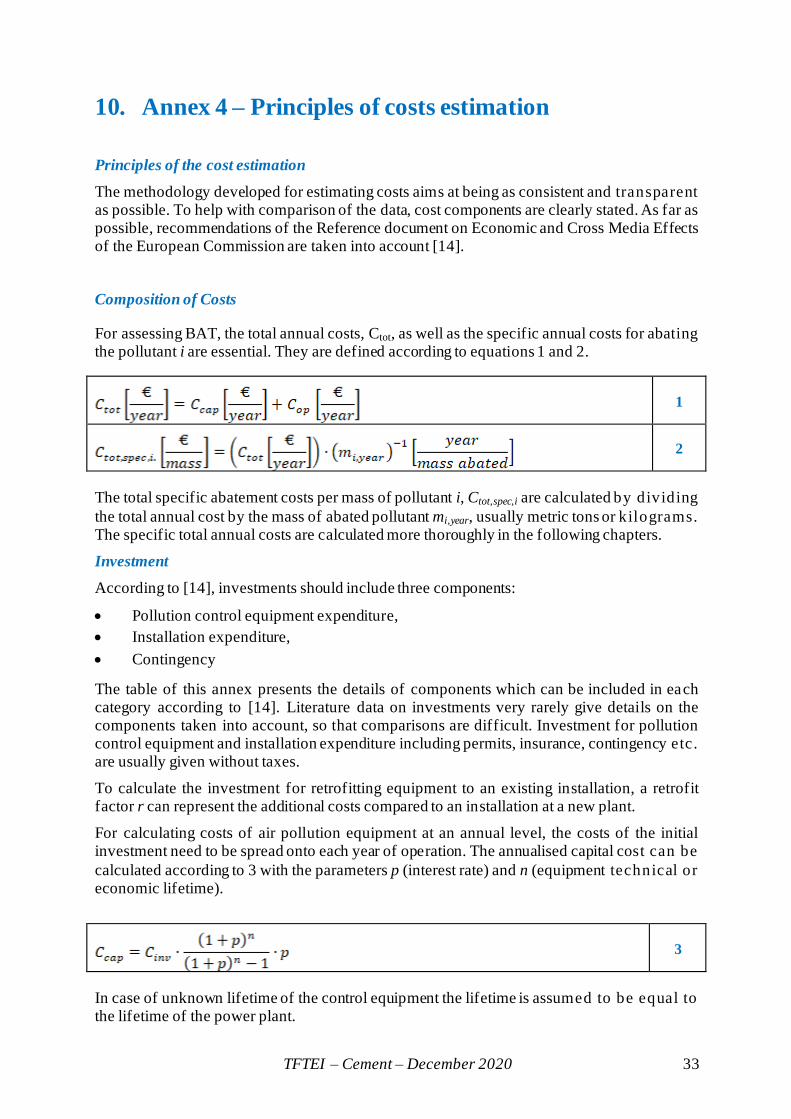
Composition of Costs
For assessing BAT, the total annual costs, Ctot, as well as the specific annual costs for abating the pollutant i are essential. They are defined according to equations 1 and 2.
1
2
The total specific abatement costs per mass of pollutant i, Ctot,spec,i are calculated by dividing
the total annual cost by the mass of abated pollutant mi,year, usually metric tons or kilograms. The specific total annual costs are calculated more thoroughly in the following chapters.
Investment
According to [14], investments should include three components:
• Pollution control equipment expenditure,
• Installation expenditure,
• Contingency
The table of this annex presents the details of components which can be included in each category according to [14]. Literature data on investments very rarely give details on the components taken into account, so that comparisons are difficult. Investment for pollution control equipment and installation expenditure including permits, insurance, contingency etc. are usually given without taxes.
To calculate the investment for retrofitting equipment to an existing installation, a retrofit factor r can represent the additional costs compared to an installation at a new plant.
For calculating costs of air pollution equipment at an annual level, the costs of the initial investment need to be spread onto each year of operation. The annualised capital cost can be
calculated according to 3 with the parameters p (interest rate) and n (equipment technical or economic lifetime).
3
In case of unknown lifetime of the control equipment the lifetime is assumed to be equal to the lifetime of the power plant.
TFTEI – Cement – December 2020 34
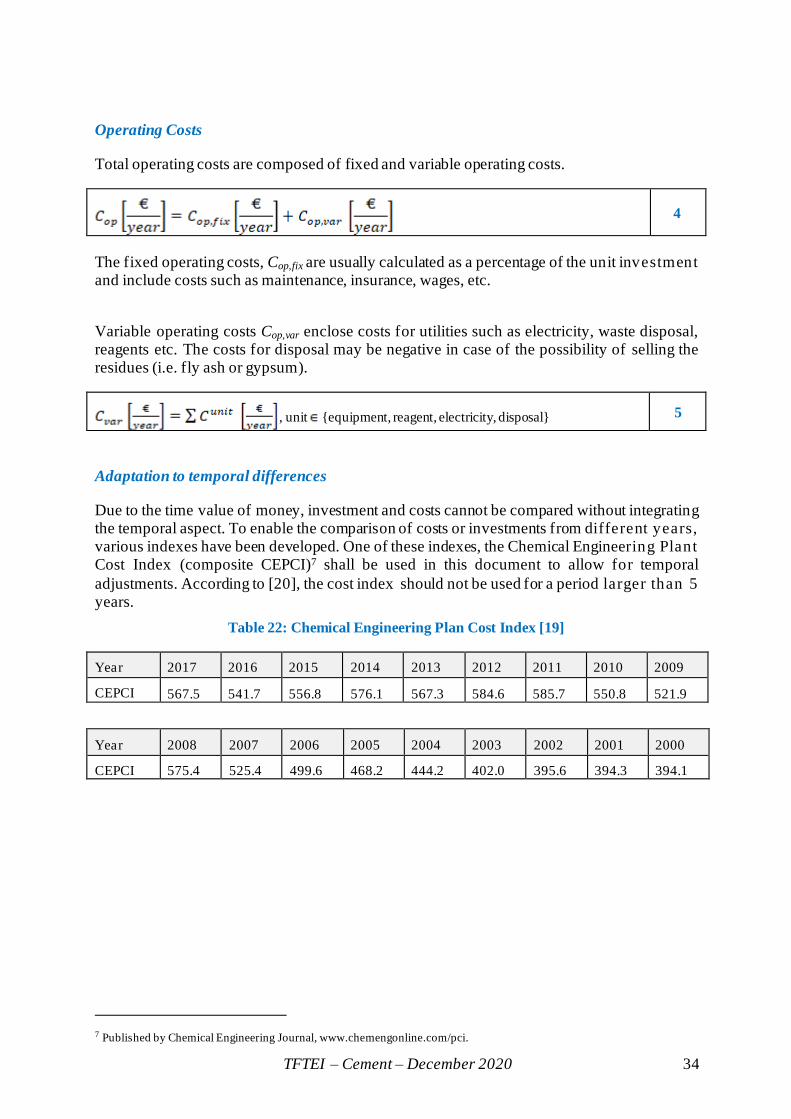
Operating Costs
Total operating costs are composed of fixed and variable operating costs.
4
The fixed operating costs, Cop,fix are usually calculated as a percentage of the unit investment and include costs such as maintenance, insurance, wages, etc.
Variable operating costs Cop,var enclose costs for utilities such as electricity, waste disposal, reagents etc. The costs for disposal may be negative in case of the possibility of selling the residues (i.e. fly ash or gypsum).
, unit {equipment, reagent, electricity, disposal} 5
Adaptation to temporal differences
Due to the time value of money, investment and costs cannot be compared without integrating the temporal aspect. To enable the comparison of costs or investments from different years, various indexes have been developed. One of these indexes, the Chemical Engineering Plant Cost Index (composite CEPCI)7 shall be used in this document to allow for temporal
adjustments. According to [20], the cost index should not be used for a period larger than 5 years.
Table 22: Chemical Engineering Plan Cost Index [19]
Year 2017 2016 2015 2014 2013 2012 2011 2010 2009
CEPCI 567.5 541.7 556.8 576.1 567.3 584.6 585.7 550.8 521.9
Year 2008 2007 2006 2005 2004 2003 2002 2001 2000
CEPCI 575.4 525.4 499.6 468.2 444.2 402.0 395.6 394.3 394.1
7 Published by Chemical Engineering Journal, www.chemengonline.com/pci.
TFTEI – Cement – December 2020 35
11. Bibliography
[1] CEMBUREAU 2019 – Web site accessed on January 2019 https://cembureau.eu/cement-101/key-facts-figures/
[2] CEIP 2019 – Available on http://www.ceip.at/ms/ceip_home1/ceip_home/status_reporting/
[3] Schorcht F. and all, 2013. Best Available Techniques (BAT) Reference Document for the Production of Cement, Lime and Magnesium Oxide.
http://eippcb.jrc.ec.europa.eu/reference/
[4] EGTEI 2003 – Final Background Document on Cement industry, 2003. https://tftei.citepa.org/images/files/voc_emission_reduction_techniques_costs/bd_cement_industry_220803.pdf
[5] Air Convention 2012. Gothenburg Protocol to Abate Acidification, Eutrophication and Ground-level Ozone amended in 2012 https://www.unece.org/env/lrtap/multi_h1.html
[6] Air Convention 2012. Aarhus Protocol on heavy metals available on https://www.unece.org/env/lrtap/hm_h1.html
[7] Air Convention 2012. Guidance document on best available techniques for controlling emissions of heavy metals and their compounds from the source categories l isted in annex II. Document on heavy metals available on
https://www.unece.org/environmental-policy/conventions/envlrtapwelcome/guidance-documents-and-other-
methodological-materials/protocol-on-heavy-metals.html
[8] Air Convention 2012. Guidance document on control techniques for emissions of sulphur, NOx, VOC, and particulate matter (including PM10, PM2.5 and black carbon) from stationary sources. Available on
https://www.unece.org/environmental-policy/conventions/envlrtapwelcome/guidance-documents-and-other-methodological-materials/gothenburg-protocol.html
[9] Wesselink, B. ECOFYS 2010. The ETS paradox. Emissions trad ing for industrial NOx and SO2 in the EU: consequences for the European cement sector. By order of CEMBUREAU, The European Cement Association
[10] Scheuch 2016 Technology for clean air. Innovative SCR technologies for NOx–VOC–CO –Odor reduction
[11] Beilmann R. 2016. NOx in Cement Clinker Production. Formation and Measures to minimize NOx-Emission. Technical Symposium for Reduction of Emissions. June
22nd, 2016 in Lima, Peru.
[12] Cinti G. (Heidelberg Technogy center), Maringolo V. (Cembureau), 2017. Experience on NOx emission reduction in European cement plants. 3rd Annual Meeting of the Task Force on Techno-Economic Issues (TFTEI) – UN-ECE Convention on Long Range Transboundary Air Pollution (LRTAP) Rome, Italy – 20 October 2017.
http://tftei.citepa.org/images/files/2017-10-19-20/12-Giovanni%20Cinti%20-%20NOx%20abatement%20in%20cement.pdf
TFTEI – Cement – December 2020 36
[13] ERICCa_LCP Emission Reduction Investment and Cost Calculation (TFTEI) http://tftei.citepa.org/en/work-in-progress/costs-of-reduction-techniques-for-lcp
[14] European Commission 2006. Reference document on Economic and Cross Media Effects. http://eippcb.jrc.ec.europa.eu/reference/
[15] TFTEI technical Secretariat 2015. Estimation of costs of reduction techniques for LCP methodology. In the scope of TFTEI under the UNECE Air Convention. http://tftei.citepa.org/images/files/2016-02-11/TFTEI_cost_calculation%20methodology_2015_05_28.pdf
[16] Larguier J. ( PROSERGY) 2017. Information provided to Citepa
[17] CITEPA 2019. French national inventory of greenhouse gases and atmospheric pollutant emissions. Specific treatment of information available for cement plants.
[18] Electricity prices for non-household consumers - bi-annual data. Eurostat, value for France, available at : http://appsso.eurostat.ec.europa.eu/nui/show.do?dataset=nrg_pc_205&lang=en
[19] Chemical Engineering Plant Cost Index (CEPCI), 2000-2017
[20] Vatavuk W. 2002. Updating the CE plant cost Index. Chemical Engineering.
[21] UNEP 2016. Guidance on best available techniques and best environmental practices Cement Clinker Production Facilities
[22] Bernike Anja – UBA Germany – Comments on the draft document. April 2019
[23] CEMBUREAU – Answers to the inquiry of the TFTEI technical secretariat. May 2019
[24] Commission implementing Decision of 26 March 2013 establishing the best available techniques (BAT) conclusions under Directive 2010/75/EU of the European Parliament and of the Council on industrial emissions for the production of cement, lime and magnesium oxide