Background Concentrations of Trace and Major Elements in ...

Background Concentrations of InorganicElements in Soils from the Auckland Region
AucklandRegional CouncilTE RAUHITANGA TAIAO

IIIII• Background Concentrations ofI Inorganic Elements in SoilsI from the Auckland RegionIIIIIIIIII
Auckland Regional Council
f Technical Publication No. 153, October 2001,Reprinted April 2002.ISSN1175205XPrinted on recycled paper
IIIIIIIIIIIIIIIIIIiI
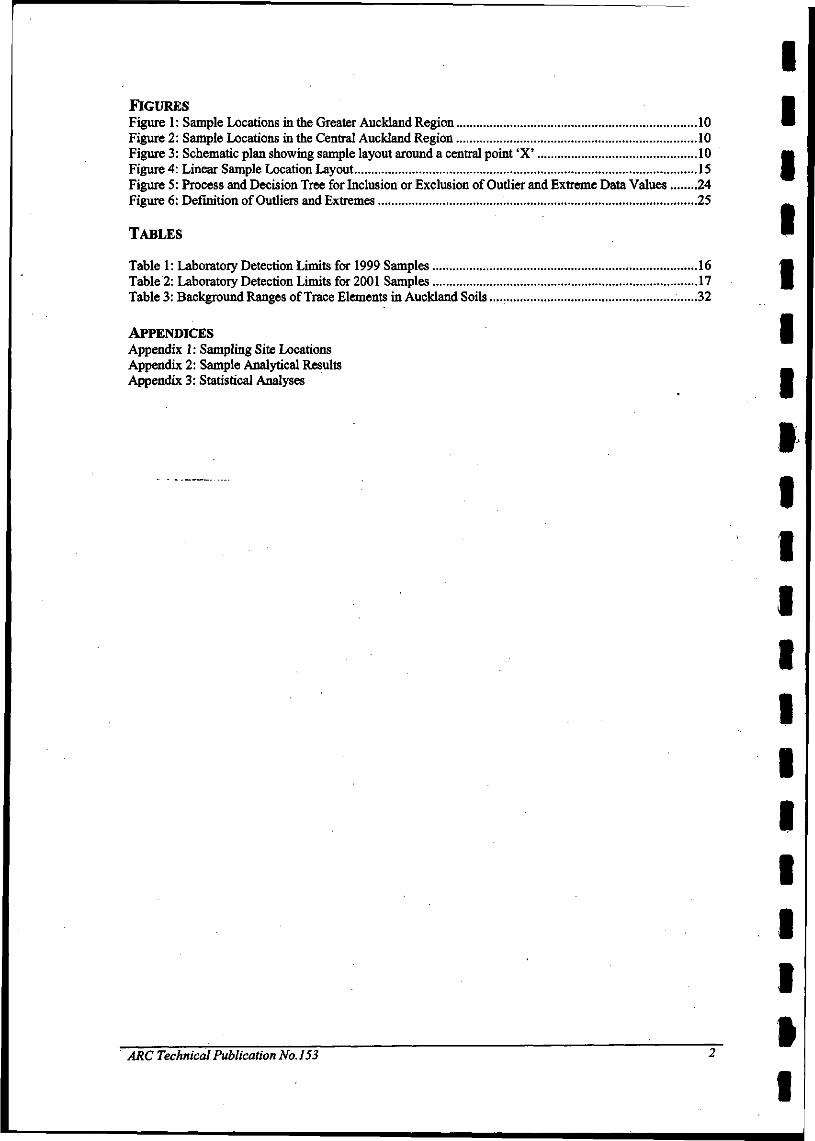
TABLE OF CONTENTS
SUMMARY 31. INTRODUCTION : 5
7.7 Trace Elements in the Environment 51.2 What Does "Background" Mean? 61.3 Why Attempt to Determine Background Levels? 71.4 What is an Appropriate Methodology? 71.5 Background Concentrations and the Auckland Regional Sampling Program 7
2. SAMPLING DESIGN 92.1 Soils 92.2 Sample Collection • 92.3 Sample Preparation and Analysis 752.4 Recommended Standards of Analysis for Comparison to Background Ranges 77
3. RESULTS FROM REGIONAL SOILS 193.1 Analytical Approach 193.2 Statistical Analyses of Elements Within the Major Soil Groups for the Determination ofBackground Ranges 203.3 Arsenic 253.4 Barium 253.5 Boron 253.6 Cadmium 263.7 Chromium 263.8 Cobalt 263.9 Copper 273.10 Lead ; 273.11 Magnesium 273.12 Manganese 273.13 Mercury 283.14 Nickel 283.15 Nitrogen 283.16 Phosphorus 283.17 Potassium 293.18 Sulphur 293.19 Tin 293.20 Vanadium 293.21 Zinc 303.22 Total Organic Carbon 30
4. DISCUSSION 314.1 Volcanic Soils in the Auckland Region 314.2 Volcanic Processes and Potential Impact on Other Soil Types 314.3 The Non-Volcanic Soils Grouping 314.4 Specific Lithologies 314.5 Auckland Region Background Ranges 314.6 Background Soil Concentrations Applicability to Soil Investigations in Auckland. 33
5. RECOMMENDATIONS 356. ACKNOWLEDGEMENTS 357. REFERENCES '. 37
ARC Technical Publication No. 153
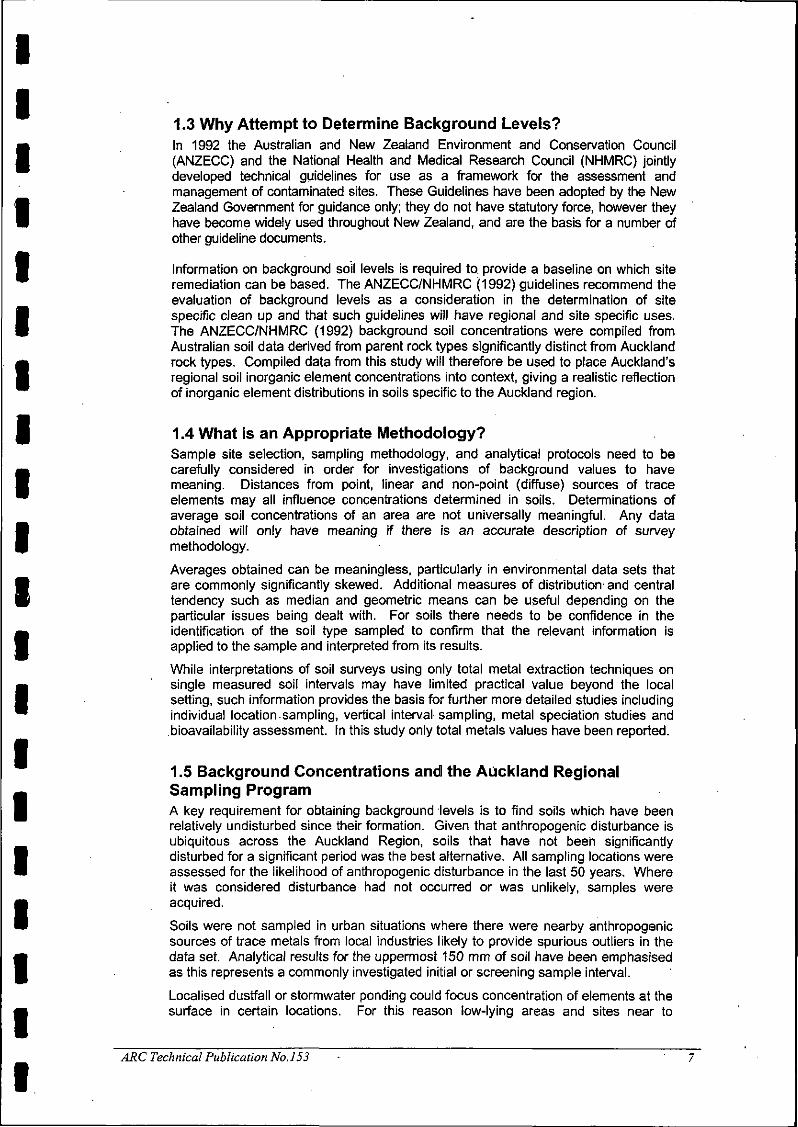
IFIGURES •Figure 1: Sample Locations in the Greater Auckland Region 10 •Figure 2: Sample Locations in the Central Auckland Region 10Figure 3: Schematic plan showing sample layout around a central point 'X' 10 mFigure 4: Linear Sample Location Layout 15 IFigure 5: Process and Decision Tree for Inclusion or Exclusion of Outlier and Extreme Data Values 24Figure 6: Definition of Outliers and Extremes 25
TABLES •
Table 1: Laboratory Detection Limits for 1999 Samples 16 •Table 2: Laboratory Detection Limits for 2001 Samples 17 |Table 3: Background Ranges of Trace Elements in Auckland Soils 32
APPENDICES |Appendix 1: Sampling Site LocationsAppendix 2: Sample Analytical Results _Appendix 3: Statistical Analyses •
ARC Technical Publication No. 153
I
I
1
I
I
I
I
I
I
I
I
I
I

IIIIIII1
IIIIIIII1II
SummaryThe objective of this Auckland Regional Council (ARC) study was to establishbackground total recoverable levels of a number of trace elements in soil samplesfrom major soil groups of the Auckland Region. Soil samples were collected from 91locations in May 1999 from publicly owned rural and urban land on soils derived fromthe major lithological units of the region. In October 2001, to confirm the validity ofoutlier data obtained during the 1999 survey, fifteen of these sites were revisited, andsampled for further analysis.
The survey's design comprised geographically directed near-surface sampling withcategories being based on underlying rock type. Sites were selected to berepresentative of the lithological units, with specific sites chosen based on evidenceof minimal surface disturbance and ease of access. Samples of surficial soils (0-150mm) were collected and analysed by varying methods for total recoverable arsenic(As), barium (Ba), boron (B), cadmium (Cd), chromium (Cr), cobalt (Co), copper (Cu),lead (Pb), magnesium (Mg), manganese (Mn), mercury (Hg), phosphorus (P),potassium (K), nickel (Ni), nitrogen (N), sulphur (S), tin (Sn), vanadium (V), zinc (Zn),and total organic carbon (TOC).
Environmental investigation threshold levels should be related to the local or regionalbackground levels of the elements. Certain environmental investigation thresholdlevels need to be reconsidered for the Auckland context in view of these results. TheAustralian and New Zealand Guidelines for Assessment and Management ofContaminated Sites (ANZECC/NHMRC 1992) recommends the evaluation ofbackground levels as a consideration in the determination of remediation goals. Thedata collected in this survey of total recoverable trace elements in soils of theAuckland Region can be used in this context, with the general background datareported by this study substantiated by site specific information where required.
ARC Technical Publication No. 153

IIIIIIII
ARC Technical Publication No. 153

IIIIIIIIIIIIIIIIIIII
1. Introduction
In the absence of New Zealand-based criteria for determining whether theinvestigation of contaminants in soils is required, there has emerged a reliance on theresponse of overseas authorities'to the management of contaminated land. Thepractice of consultants and health and environmental authorities using offshoreinformation in the absence of New Zealand soil and groundwater quality orbackground standards has resulted in the application of criteria based on soil types,climate, hydrogeology and a groundwater consumption pattern not especially relevantto the New Zealand situation. The promotion and development of a site-specific, risk-based approach to the assessment of the health and environmental effects of soil andgroundwater quality presents the opportunity for the investigation of criteria relevantto New Zealand.
The Resource Management Act, 1991, (RMA) promotes effects-based considerationof environmental quality, prioritising a need to know the background levels and theircorresponding effects, prior to consideration of detected levels and their effects onthe environment or human health. The introduction of appropriate investigation ortrigger levels for contaminants must be carried out with an awareness of backgroundlevels of those contaminants in New Zealand, or sub-regions of the country. Tracemetal levels and some corresponding inorganic trace elements are the mostcommonly studied due to their ease of determination and will form the focus of thisreport.
There is little published specific information on background levels of trace elements inAuckland soils although a large corpus of information resides in University theses,consultancy and soil laboratory archives and various governmental department files.The on-going redevelopment of land and increasing numbers of investigations ofsuspect sites being conducted are describing levels of metals, the significance ofwhich may be difficult to interpret without knowledge of local background values.
The development of a site-specific, risk-based approach to the assessment ofcontaminants in land needs soil criteria relevant to the Auckland context andestablishing background levels of contaminants in soils is basic information requiredfor this task.
1.1 Trace Elements in the EnvironmentConcentrations of trace metals in surface soils are primarily the result of localgeological and soil forming factors. Accumulation or dilution of trace elements withinthe environment occurs due to physical deposition, or other geo- or hydro-chemicalprocesses. Redistribution from subsurface mineral deposits into the surfaceenvironment, commonly associated with urbanisation, agricultural and industrialactivities, has also resulted in the accumulation of these elements in near-surfacesoils and sediments. Historically therefore, human exposure to some trace elementconcentrations in soil would have been lower than those detected today.
The effects of such changes in soil quality and the resulting increase in exposure overlong time-scales are unknown. In considering "background" concentrations of traceelements in soils, particularly heavy metals, we must take note of the variable anddispersed emissions that occur in urbanised areas. Additionally the long half-lives ofuncomplexed metal contaminants in soils must also be considered.
The Auckland urban environment may have levels of heavy metals and othercontaminants that are elevated compared to those found in natural, pristine soils.Any elevated levels tend to be trace element specific, such as the contribution ofvehicle emissions and removal of lead-based paints to lead levels in urban soils.
ARC Technical Publication No. 153

I1.2 What Does "Background" Mean? •There is always a range of concentration values associated with, or typical of an area »for any trace element investigated. The Australian and New Zealand Guidelines forthe Assessment of Management of Contaminated Land (ANZECC/NHMRC, 1992) •define background levels as "ambient levels of a contaminant in the local area of the £site under consideration." Background may be taken to be "pristine" soils unaffectedor relatively so by human activity. Due to the development history of the AucklandRegion, and global transport of contaminants even in the hinterlands, pristine •background areas may be rare. •
The definition of "background level" used in this report is "concentrations of an _element in soils which can not be attributed to any identifiable event or activity other •than normal lithological processes and is considered representative of the levels to be •found wherever relatively undisturbed soil derived from an identifiable parent rockmaterial exists at or near the surface". •
Soils at or near sites known to be contaminated due to nearby activities would be ™excluded as part of this survey regardless of other elements being within"background" concentrations. Decisions as to where point source effects end and •ambient levels begin made in the course of this exercise have been somewhat garbitrary but are based on knowledge of activities and contaminated sites throughoutthe Auckland Region held by the ARC. _
A statistical evaluation of analytical data distributions and characteristics of the soil £that differentiate trace element sources is required in order to comprehensivelyunderstand the meaning of background concentrations. While urban soilconcentrations may have contributions from regional and local urban activities, •elevated rural soil levels are equally likely to arise from incremental additions of soil •amendments as a result of rural activities. Regional scale effects such as leachingdue to acid rain and resultant transport of heavy metals through soil are much less •relevant in New Zealand than in the Northern Hemisphere. Very low, but detectable •levels of trace element deposition do occur from Australia but these are thought to berelatively uniform and are not considered separately.
Background values of heavy metals commonly reflect variations in the composition of J|parent rock material that can be quite localised, e.g. in the Auckland Region theisthmus volcanic field has a naturally high level of nickel, generally exceedingpublished investigation levels. •
Interpretation of ambient soil metal concentration data requires an understanding ofhow sample site selection, sample depth, sample preparation and analyticaltechnique, bias analytical determinations. This is important where a range of •sources, metal species and soil particle size distributions contribute to metal mconcentrations but is beyond the scope of this report.
Geographic scale of an investigation may render studies incomparable from place to Wplace so some account of data distributions should be investigated prior to designing mstudies to determine what levels may be representative of large areas. When soil-type background concentrations are related to specific areas of contaminated land,local background concentrations should also be assessed, where possible.
ARC Technical Publication No.153
I
I
I
I
I
I
IIIIIIIIII1IIIIIIIII
1.3 Why Attempt to Determine Background Levels?In 1992 the Australian and New Zealand Environment and Conservation Council(ANZECC) and the National Health and Medical Research Council (NHMRC) jointlydeveloped technical guidelines for use as a framework for the assessment andmanagement of contaminated sites. These Guidelines have been adopted by the NewZealand Government for guidance only; they do not have statutory force, however theyhave become widely used throughout New Zealand, and are the basis for a number ofother guideline documents.
Information on background soil levels is required to provide a baseline on which siteremediation can be based. The ANZECC/NHMRC (1992) guidelines recommend theevaluation of background levels as a consideration in the determination of sitespecific clean up and that such guidelines will have regional and site specific uses.The ANZECC/NHMRC (1992) background soil concentrations were compiled fromAustralian soil data derived from parent rock types significantly distinct from Aucklandrock types. Compiled data from this study will therefore be used to place Auckland'sregional soil inorganic element concentrations into context, giving a realistic reflectionof inorganic element distributions in soils specific to the Auckland region.
1.4 What is an Appropriate Methodology?Sample site selection, sampling methodology, and analytical protocols need to becarefully considered in order for investigations of background values to havemeaning. Distances from point, linear and non-point (diffuse) sources of traceelements may all influence concentrations determined in soils. Determinations ofaverage soil concentrations of an area are not universally meaningful. Any dataobtained will only have meaning if there is an accurate description of surveymethodology.
Averages obtained can be meaningless, particularly in environmental data sets thatare commonly significantly skewed. Additional measures of distribution and centraltendency such as median and geometric means can be useful depending on theparticular issues being dealt with. For soils there needs to be confidence in theidentification of the soil type sampled to confirm that the relevant information isapplied to the sample and interpreted from its results.
While interpretations of soil surveys using only total metal extraction techniques onsingle measured soil intervals may have limited practical value beyond the localsetting, such information provides the basis for further more detailed studies includingindividual location sampling, vertical interval sampling, metal speciation studies and.bioavailability assessment. In this study only total metals values have been reported.
1.5 Background Concentrations and the Auckland RegionalSampling ProgramA key requirement for obtaining background levels is to find soils which have beenrelatively undisturbed since their formation. Given that anthropogenic disturbance isubiquitous across the Auckland Region, soils that have not been significantlydisturbed for a significant period was the best alternative. All sampling locations wereassessed for the likelihood of anthropogenic disturbance in the last 50 years. Whereit was considered disturbance had not occurred or was unlikely, samples wereacquired.
Soils were not sampled in urban situations where there were nearby anthropogenicsources of trace metals from local industries likely to provide spurious outliers in thedata set. Analytical results for the uppermost 150 mm of soil have been emphasisedas this represents a commonly investigated initial or screening sample interval.
Localised dustfall or stormwater ponding could focus concentration of elements at thesurface in certain locations. For this reason low-lying areas and sites near to
ARC Technical Publication No.153

Isignificant dust generating sites were avoided where possible. Soil organic and clay £matter can intercept and retain trace elements so soil carbon levels were collected forassessment, however particle size analysis was not considered in these studies. _
Contaminant concentrations within soils derived from similar geological parent £materials may show some heterogeneity both within a localised area and over longdistances. Single "point" samples were collected from each site in the 1999 .investigation, giving a range of concentrations within a single soil type across the •Auckland Region. Insufficient samples were collected during the 1999 study to ™delineate the variation within soils at each sampling locality. The purpose of theOctober 2001 investigation was to both re-sample sites where 'outlier' or 'extreme' •concentrations of individual elements were recorded, and to collect additional psamples for analysis to gauge variability of trace element concentrations within alocalised area. —
To further assess the impact of anthropogenic sources on soils sampled as p"background" and undisturbed, a vertical profile of trace element concentrationsshould be established. Stratification of trace elements results from air deposition of ^particulates, which, if present, would be present in higher concentrations in the upper •;•soil layer than lower ones. ;™
ARC Technical Publication No. 153
I
I
I
1
I
I
I
I
I
I
I
I
I

IIIIIII1IIIIIIIIIIII
2. Sampling Design
2.1 SoilsBaseline data for trace element concentrations were determined on 91 undisturbedsoil samples believed to be only minimally contaminated by human activity. Thesewere all collected from Parks, Forests and public lands from the 8 predominant soilgroups in the Auckland Region.
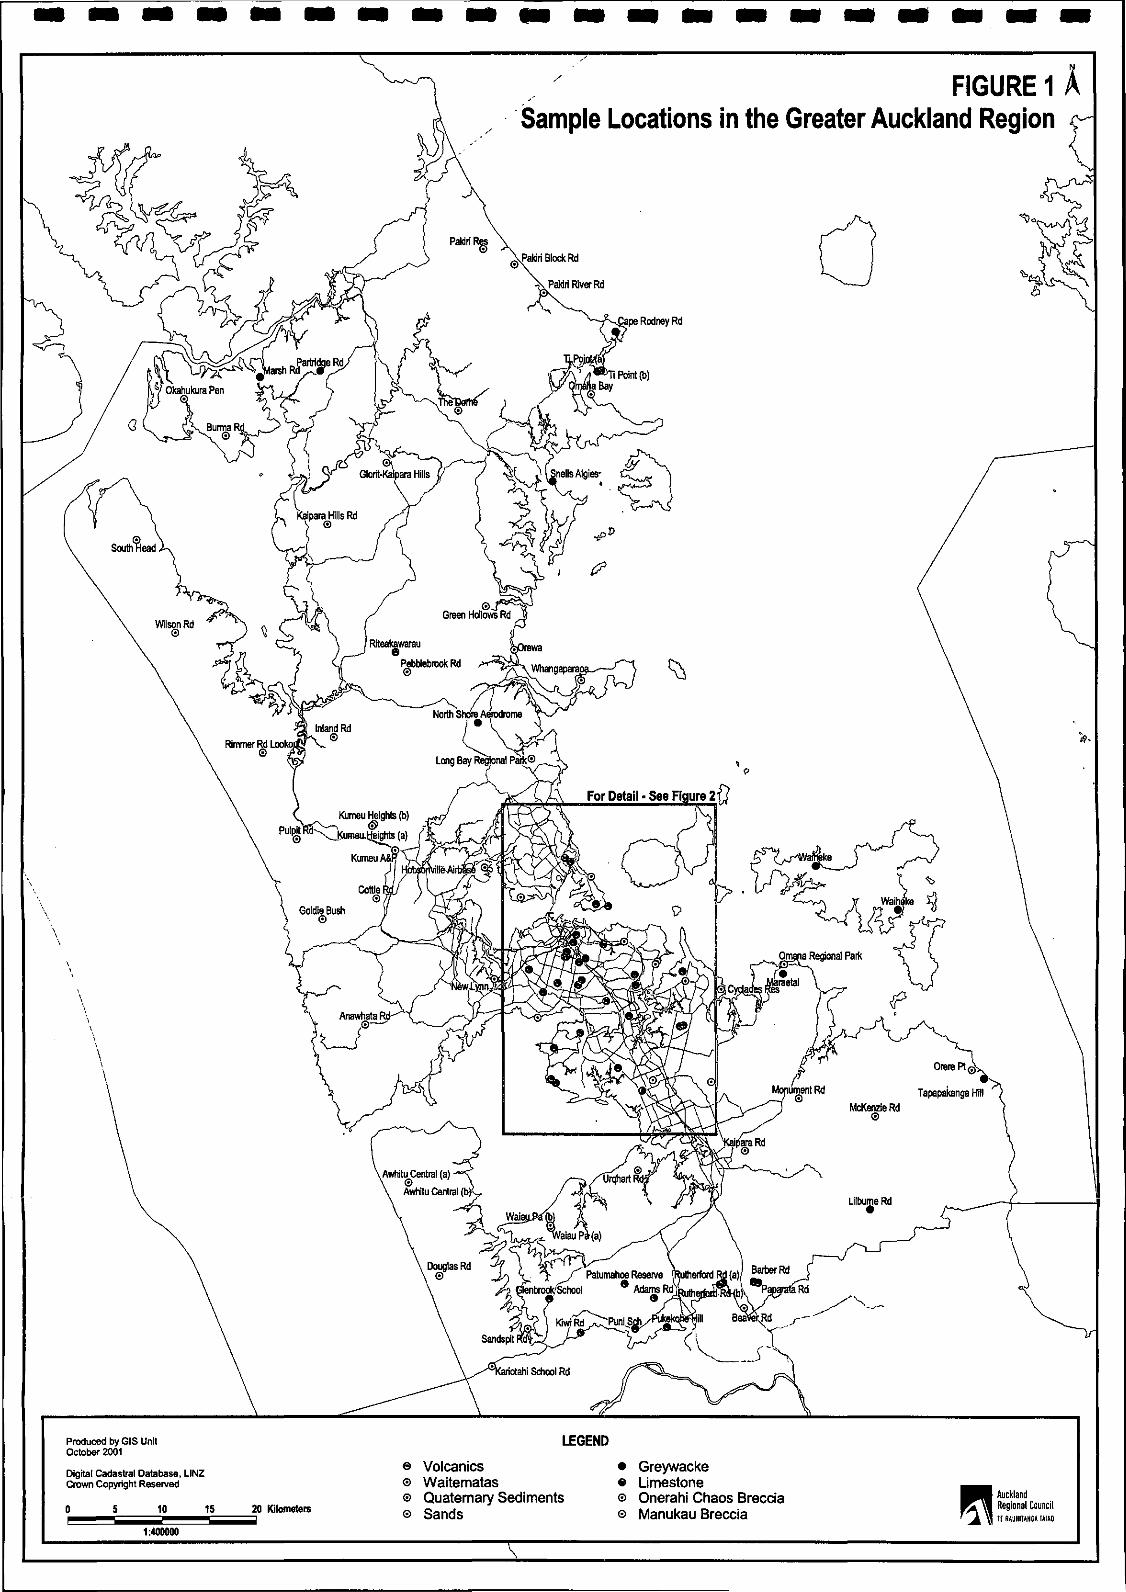
The eight major soil groups are: Volcanic (Isthmus and South Auckland VolcanicFields, as well as one sample from Kerikeri Volcanics at Ti Point), Waitemata GroupFlysch, Quaternary Sedimentary Deposits, Sands, Greywacke, Limestone, OnerahiChaos Breccia and Manukau Breccia. These are commonly recognised names formajor geological units within the Auckland Region and sampling locations wereselected from 1:250,000 Geological Maps of New Zealand assisted by topographicalinformation from NZMS260 series maps.
In 1999, a total of 91 different sites were examined, and at each site a single 150 mmcubic soil monolith was taken at a single point location. Due to budgetary constraintsthe values represent single sample maxima and no statistical confidence could begiven to values obtained. Fifteen selected sites were re-visited in October 2001 toenable the validation of outliers reported in the 1999 data set. To gauge thevariability of trace element concentrations at individual sites, and to gain statisticalconfidence and improve data quality, composite sampling was undertaken. Thevalidation samples comprised four samples from each sampling location, with eachsample consisting of four soil cores over a local area (refer to Section 2.2 for samplecollection methodologies). Exact locations were made with the aid of map co-ordinates. The sampling locations are shown on Figures 1 and 2.
Where practicable, samples were collected on topographic highs where the soilprofile was relatively thin and only weakly developed. Collection of samples in low-lying areas was deliberately avoided as these soils could have higher than normalbackground levels as a result of leaching of trace elements from the surroundinghillsides. Pristine soil sample collection was considered unnecessary andimpracticable given the historic development of the region. The criterion of"estimated greater than 50 years since soil profile disturbance" was subjective butcommonly involved sampling in areas where access by mechanical diggers etc.would be restricted and where vegetation or other indicators suggested this asrealistic. Soil surfaces were observed for signs of disturbance and once a hole hadbeen dug for sampling the soil profile was assessed for signs of disturbance such asinterrupted stratigraphy or anthropogenic inclusions.
2.2 Sample CollectionIn the initial 1999 survey, soil samples were collected from the surface to a depth of150 mm. Soils were commonly dug to approximately 0.5 m at each site to assess thesoil profile. A polyester-coated garden spade was used for digging and all thematerial (0 to 150 mm), including soil adhered to surface grass, was collected anddouble bagged for further preparation at the laboratory.
Soil samples were collected as a monolith by delineating an area of approximately150mm square at the soil surface and excavating, as a single piece where possible,all soil to a depth of 150mm. The resulting monolith, weighing between 1.5 and 3kgwhen bagged, had been only minimally disturbed during excavation and had aminimum of surficial contamination. The spade was double washed and rinsed withclean tap water and allowed to air dry between each sample collection.
ARC Technical Publication No. 153
15 m
II
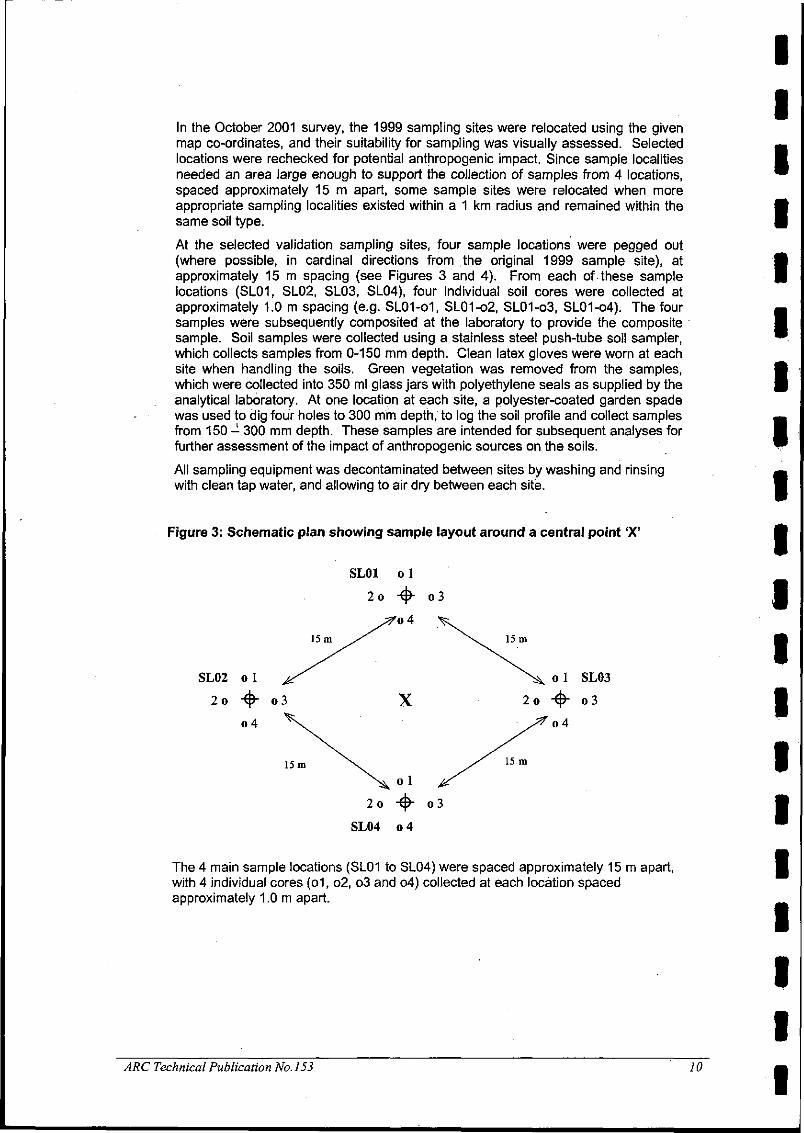
In the October 2001 survey, the 1999 sampling sites were relocated using the givenmap co-ordinates, and their suitability for sampling was visually assessed. Selected «locations were rechecked for potential anthropogenic impact. Since sample localities Ineeded an area large enough to support the collection of samples from 4 locations, ™spaced approximately 15 m apart, some sample sites were relocated when moreappropriate sampling localities existed within a 1 km radius and remained within the •same soil type. |
At the selected validation sampling sites, four sample locations were pegged out(where possible, in cardinal directions from the original 1999 sample site), at ttapproximately 15 m spacing (see Figures 3 and 4). From each of these sample |locations (SL01, SL02, SL03, SL04), four individual soil cores were collected atapproximately 1.0 m spacing (e.g. SL01-01, SL01-o2, SL01-o3, SL01-04). The four •samples were subsequently composited at the laboratory to provide the composite •sample. Soil samples were collected using a stainless steel push-tube soil sampler, *which collects samples from 0-150 mm depth. Clean latex gloves were worn at eachsite when handling the soils. Green vegetation was removed from the samples, ftwhich were collected into 350 ml glass jars with polyethylene seals as supplied by the |analytical laboratory. At one location at each site, a polyester-coated garden spadewas used to dig four holes to 300 mm depth, to log the soil profile and collect samples «from 150 - 300 mm depth. These samples are intended for subsequent analyses for •further assessment of the impact of anthropogenic sources on the soils. ™
All sampling equipment was decontaminated between sites by washing and rinsing ^with clean tap water, and allowing to air dry between each site. •
Figure 3: Schematic plan showing sample layout around a central point 'X' fl
I
I
I
I
I
The 4 main sample locations (SL01 to SL04) were spaced approximately 15 m apart, •with 4 individual cores (o1, o2, o3 and o4) collected at each location spacedapproximately 1.0 m apart.
ARC Technical Publication No.153 10
I
I
I
,s
FIGURE 1 ASample Locations in the Greater Auckland Region
•t,
Riteakawarau
PebblebrookRd©
Long Bay Regional Park©
For Detail • See Figure 2f}
OrerePtgj
Tapapakanga Hill
Awhitu Central (a)
Awhitu Central (
Patumahoe Reserve (Rutherford Rd (a)
AucklandRegional CouncilIE SAUHITAHCA IAIAO
Produced by GIS UnitOctober 2001
Digital Cadastral Database, LINZCrown Copyright Reserved
0 5 102T
1:400000
15 20 Kilometers
© Volcanics© Waitematas© Quaternary Sediments© Sands
• Greywacke® Limestone© Onerahi Chaos Breccia© Manukau Breccia

Lake Pupuke (Killamey Stp^
FIGURE 2 ASample Locations in the Central Auckland Region
flakapuna Grammar
North Head
Mt Albert
/•Auckland Domain (bj
AucMandDoma'nXa).1 ,
Mi-Eden ^M® •
Orakei Baari /
tEden(b) MtE
/ M t J
Three KingsOne Tree Hill (TCLP) (a)
y Cape Horn
Puketutu I
Kepa Bush-park—' 0
Mt Mangere
Mt Smart (TCLR)
-Pt.E
Pt England Res (b)®~
MtWelliiington (TOT
MtRichn
Pigeon Mountain
Highland Pk-©-
Greenmpunt (a) Greenm?'unt (b>
©
Ihumatao (a)
O Ihumatao (b)
hunui Criiter
Mahuteu City
Mclaughlins Mt-' "'
Redoubt Rd©
Produced by GIS UnitOctober 2001
Digital Cadastral Database, LINZCrown Copyright Reserved
4 Kilometers
LEGEND
© Volcanics© Waitematas© Quaternary Sediments© Sands
• Greywacke® Limestone© Onerahi Chaos Breccia© Manukau Breccia
T / /
AucklandRegional CouncilIt RAUHIHNGA TAIAO
IIIIIIIIIIIIIIIIIIII
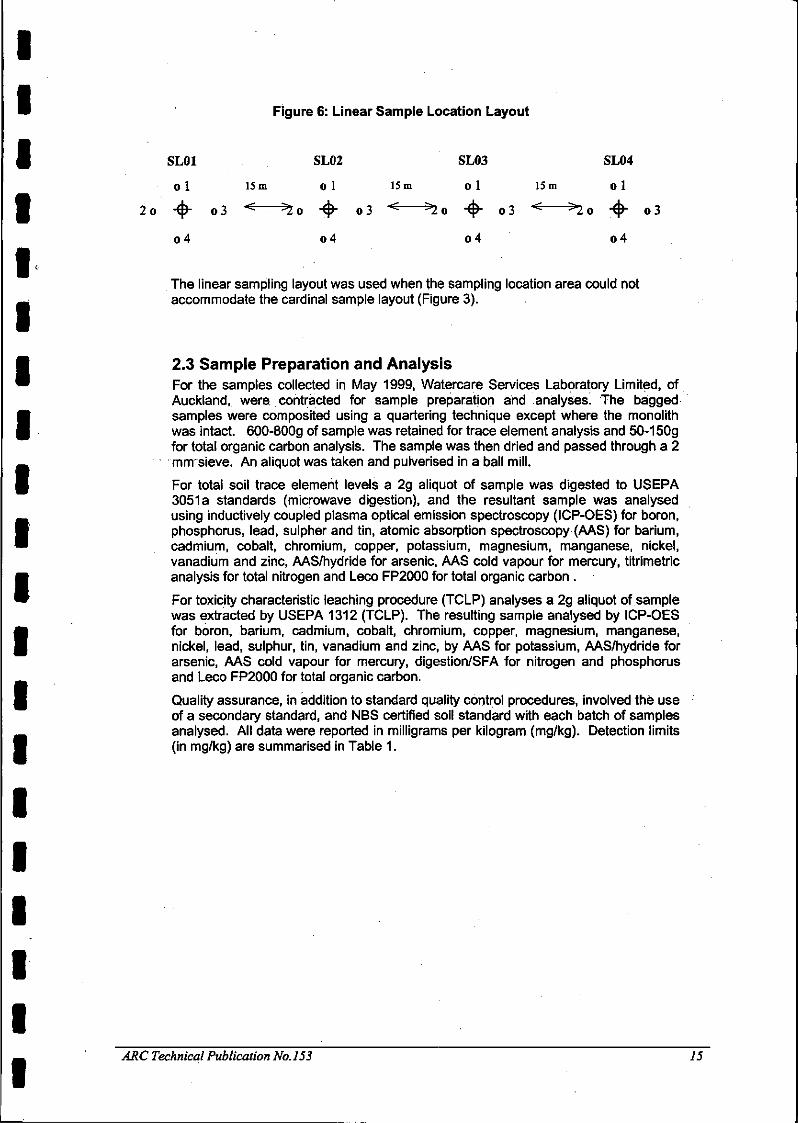
Figure 6: Linear Sample Location Layout
SL01 SL02 SL03 SL04
ol 15m ol 15m ol 15m ol
2o -fy- o3 < ^o -$- o3 ^ ^o -$- o3 ^ ^2 o •$- o3
o 4 o 4 o 4 o 4
The linear sampling layout was used when the sampling location area could notaccommodate the cardinal sample layout (Figure 3).
2.3 Sample Preparation and AnalysisFor the samples collected in May 1999, Watercare Services Laboratory Limited, ofAuckland, were contracted for sample preparation and analyses! The baggedsamples were composited using a quartering technique except where the monolithwas intact. 600-800g of sample was retained for trace element analysis and 50-150gfor total organic carbon analysis. The sample was then dried and passed through a 2mrrrsieve. An aliquot was taken and pulverised in a ball mill.
For total soil trace element levels a 2g aliquot of sample was digested to USEPA3051 a standards (microwave digestion), and the resultant sample was analysedusing inductively coupled plasma optical emission spectroscopy (ICP-OES) for boron,phosphorus, lead, sulpher and tin, atomic absorption spectroscopy (AAS) for barium,cadmium, cobalt, chromium, copper, potassium, magnesium, manganese, nickel,vanadium and zinc, AAS/hydride for arsenic, AAS cold vapour for mercury, titrimetricanalysis for total nitrogen and Leco FP2000 for total organic carbon .
For toxicity characteristic leaching procedure (TCLP) analyses a 2g aliquot of samplewas extracted by USEPA 1312 (TCLP). The resulting sample analysed by ICP-OESfor boron, barium, cadmium, cobalt, chromium, copper, magnesium, manganese,nickel, lead, sulphur, tin, vanadium and zinc, by AAS for potassium, AAS/hydride forarsenic, AAS cold vapour for mercury, digestion/SFA for nitrogen and phosphorusand Leco FP2000 for total organic carbon.
Quality assurance, in addition to standard quality control procedures, involved the useof a secondary standard, and NBS certified soil standard with each batch of samplesanalysed. All data were reported in milligrams per kilogram (mg/kg). Detection limits(in mg/kg) are summarised in Table 1.
ARC Technical Publication No. 153 15

Table 1: Laboratory Detection Limits for 1999 Samples
Parameter (Total Recoverable) Detection Limit (mg/kg)
Arsenic (As)
Barium (Ba)
Boron (B)
Cadmium (Cd)
Chromium (Cr)
Cobalt (Co)
Copper (Cu)
Lead (Pb)
Magnesium (Mg)
Manganese (Mn)
Mercury (Hg)
Nickel (Ni)
Nitrogen (total, N)
Phosphorus (P)
Potassium (K)
Sulpher(S)
Tin (Sn)
Vanadium (V)
Zinc (Zn)
Total Organic Carbon (TOC)
0.025
0.5
3
0.1
1
1.5
1
1.5
5
0.5
0.03
0.7
10
0.5
2
1
1
5
0.15
0.0002%
For the samples collected in the October 2001 survey, RJ Hill Laboratories Ltd, ofHamilton, were contracted for sample preparation and analysis. The samples wereair dried overnight in a forced air oven at 35°C. The dried samples were then handground using a mortar and pestle and passed through a 2 mm sieve. Compositeswere made from individual samples by quartering each sample, then selectingopposite quarters that are placed in a 'composite' tray. The composite is thoroughlymixed before being placed in a container.
Weighed subsamples are digested using US EPA Method 200.2. One gram ofsample plus 7 mL of nitric/hydrochloric/water (1.5:3.5:5) is heated in a water bath at85°C for 45 minutes, made to 20 mL with Type 1 water, filtered or centrifuged and thefiltrate/centrifugate analysed by Inductively Coupled Plasma-Mass Spectrometry(ICP-MS).
The analyses for total sulphur were sub-contracted to SGS, Waihi. Analysis wascarried out by LECO SC32 Sulphur Determinator, high temperature furnace, infra-reddetector, ASTM 4239.
The respective detection limits reported are summarised in Table 2. The analyticalmethods used in the 2001 survey are more commonly used for contaminated landreporting, and the detection limits are well within the thresholds required.
ARC Technical Publication No. 153 16
IIIIIIIIIIIIIIIIIIII
IIIIIIIIIIIIIIIIIIII
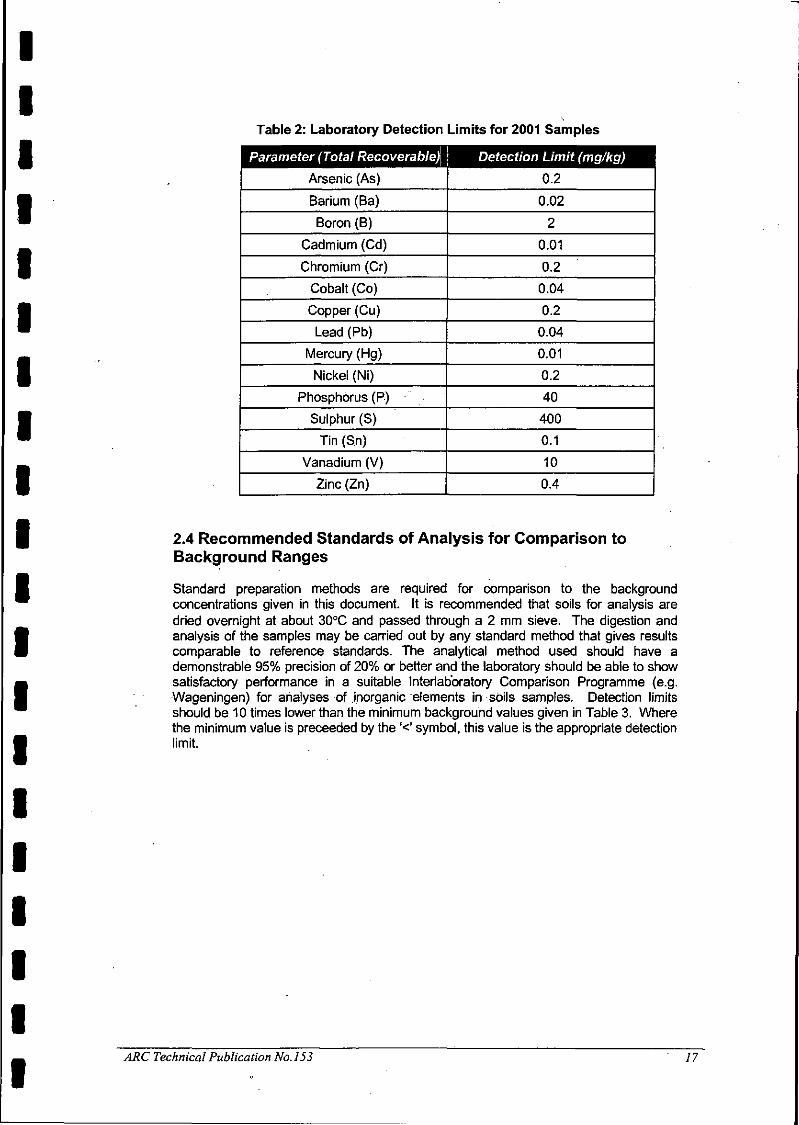
Table 2: Laboratory Detection Limits for 2001 Samples
Parameter (Total Recoverable) Detection Limit (mg/kg)
Arsenic (As)
Barium (Ba)
Boron (B)
Cadmium (Cd)
Chromium (Cr)
Cobalt (Co)
Copper (Cu)
Lead (Pb)
Mercury (Hg)
Nickel (Ni)
Phosphorus (P)
Sulphur (S)
Tin (Sn)
Vanadium (V)
Zinc (Zn)
0.2
0.02
2
0.01
0.2
0.04
0.2
0.04
0.01
0.2
40
400
0.1
10
0.4
2.4 Recommended Standards of Analysis for Comparison toBackground Ranges
Standard preparation methods are required for comparison to the backgroundconcentrations given in this document. It is recommended that soils for analysis aredried overnight at about 30°C and passed through a 2 mm sieve. The digestion andanalysis of the samples may be carried out by any standard method that gives resultscomparable to reference standards. The analytical method used should have ademonstrable 95% precision of 20% or better and the laboratory should be able to showsatisfactory performance in a suitable Interlabbratory Comparison Programme (e.g.Wageningen) for analyses of .inorganic elements in soils samples. Detection limitsshould be 10 times lower than the minimum background values given in Table 3. Wherethe minimum value is preceeded by the '<' symbol, this value is the appropriate detectionlimit.
ARC Technical Publication No.153 17
IIIIIIIIIIIIIIIIII
ARC Technical Publication No. 153 18

IIIIIIIIIIIIIIIIIIII
3. Results from Regional Soils
A list of the sample site locations for each of the eight major soil types is given inAppendix 1, and includes sample identification numbers and NZMS 260 mapreferences for each sample site. A summary of the complete analytical results (i.e. allraw data) for all soil samples is given in Appendix 2.
Identification of statistically outlier and extreme values provides grounds to questionthe representitiveness of those results, and to determine whether these values werelikely to be part of the actual background soils data set, or whether they may havebeen affected by anthropogenic input, and therefore should be excluded from thebackground soils data set.
3.1 Analytical ApproachThe method used for validating soil data and determining background ranges forthese elements is described below. The following are definitions for the data setsobtained and used in this report:
Raw Data Set. The full set of results for all soil samples obtained from all sites fromboth the 1999 and 2001 investigations (included in Appendix 2).
Site Data Set: The total set of data from a single site that was re-sampled in 2001(these sites now have a total of five analyses, 1 from 1999 and 4 from 2001). Thesedata sets were utilised for the purpose of comparing anomalous results obtained inthe 1999 investigation and validating them with the additional results from the samesite obtained in the 2001 investigation.
Partially Evaluated Data Set: The raw data set with values removed which failed thesite data set validation. This data set still includes anomalous results that weresubsequently validated by the 2001 investigation (i.e. 'Special Case' sites) andoutliers and extremes identified in the 1999 investigation where the site in questionwas not revisited. This data set was used to calculate the statistics given in Appendix3. .
Validated Background Soils Data Set: The partially evaluated data set with thestatistical outlier and extreme values above the 'npn-outlier' volcanic range and the'special case' sites removed, to include only those values deemed as background.This data set was summarised to give the background ranges in Table 3.
The principal process used to assess and validate the collected soil data is describedbelow and illustrated in the flow chart given in Figure 5. Details of the statisticalanalysis used, including definition of outlier and extreme values, are given in Section3.2.
A key approach adopted was to include any non-volcanic soil outlier or extremevalues that lay within the non-outlier range for their respective volcanic soils. Thiswas based on:
i) the potential for a component of volcanic ash to occur within any soil type due tothe natural processes of volcanic eruptions, whereby ash is deposited by aerialdistribution, and
ii) that the greatest range of trace element concentrations were frequentlyexhibited by the volcanic soils.
In 2001, re-sampling of outlier and extreme values at sites identified from the 1999data set was undertaken to provided a set of five data points per locality. Thisenabled a site- specific statistical evaluation of site sample variability and anassessment of the validity of these values at the given site.
ARC Technical Publication No.l53 • 19

iii) Assessment of the validity of the identified outliers and extremes to bebackground values, involving:
ARC Technical Publication No. 153 '20
IThe principal steps involved in analysing the soils data set, including the process of Qoutlier and extreme value validation is described below.
i) Site specific verification of the re-sampled sites, using statistical methods to Ivalidate or exclude values. V
ii) Statistical analysis of each trace element within the resultant partially evaluated Adata set to determine the elements' distributions and to identify any remaining •outlier or extreme values within each data set.
Ia) including all non-volcanic outliers and extremes which lie within their
equivalent volcanic soils range.
b) excluding the remaining volcanic soil outliers and extremes that lie outsidethe non-outlier volcanic soils range (except of the major elements K, Mg, N,P, S, TOC)
I
c) tagging the data excluded above for further work or, where relevant,identifying a 'Special Case' locality. •
In some instances, validation testing at sites confirmed elevated concentrations,however, the complete set remained outside expected ranges. This situation was —
identified in volcanic soils at Ti Point (Cr), Mt Smart (Pb, Sn), and the Franklin Basalts •(Sn), and within Awhitu Mineral Sands (Mn, V). It is likely that these concentrations ™are a reflection of the mineralogy of the parent material, although at Mt Smartanthropogenic activities may have had some effect. The values obtained from these Asites have been excluded from the statistical analyses in Appendix 3, and the |resultant background ranges, however it is recognised that soils from these locationsneed to be considered individually. _
It was not considered feasible to place any real confidence on the status of the £outliers or extreme values identified in magnesium, nitrogen, phosphorus, potassium,sulphur or total organic carbon ranges since these are all major earth elements, are _commonly found in soil additives and fertilisers, and total organic carbon is simply a •reflection of the organic matter present in soil. •
3.2 Statistical Analyses of Elements Within the Major Soil Groups *for the Determination of Background Ranges m
To ascertain appropriate background ranges for each trace element, statistical ™analyses were carried out for each data set for 6 of the 8 major soil groups. Due toonly 2 samples being taken for both Onerahi Chaos Breccia and Manukau Breccia Bsoil types, no statistics have been calculated and descriptions do not apply to them 0unless specified. For the purpose of this report, statistics for five of the non-volcanicsoil types have been included individually (Waitematas, Quaternary Sediments, ASands, Greywacke and Limestone), as well as categorised together as 'non-volcanic', •for comparison to volcanic soil types. Where results were less than the limit of ™detection, a value of half the limit of detection was assigned to enable statisticalanalysis. flj
Many statistical methods assume the data sets have a normal distribution. The abilityto undertake distribution analysis of the soils data sets is limited due to the smallsample sizes of the soil type categories. A Shapiro-Wilkes test for normality was flcarried out on the larger volcanic data set for each element analysed. This test |concluded with a 95% probability that each element, with the exception of nitrogenand total organic carbon, was not normally distributed. As environmental data is Moften negatively skewed, a log-normal distribution was then applied to each volcanic . •
I

Figure 5: Process and Decision Tree for Inclusion or Exclusion of Outlier and Extreme Data Values Within the Background Soils Data Set
Trace element range determined for the 8 majorsoil types from 1999 Soil Investigation results
Outliers defined as:Data point value > UBC * OC x (UBV - LBV)
Extreme values defined as:Data point value > UBV + (2 x OC) x (UBV • LBV)
[See Section 3.2]
_L| Review of outlier/extreme values obtained In 1999, (or selection of sites for validation sampling In 2001 [
IObserved that volcanic soil samples obtained frequently exhibited the greatest concentrations andlargest ranges of trace elements. Given the potential for all soil types In the Auckland region to beInfluenced by volcanic ash, values are not considered Invalid If they fall within the volcanic range.
Is the 1999 SoilInvestigation value an'outlier' or 'extreme'
concentration from avolcanic soil?
Does the 'outlier' or 'extreme'value (excluding the volcanic soils
group) fall within the volcanicsoils non-outlier range ?
Retain Value withinPartially Evaluated Data
Set
Revisited site (15 In total) In 2001. Note: some sites withoutliers were not able to be revisited In the 2001 Investigation
Site potentially does not reflectbackground values - remove site
from sample site location list(Appendix 1) and data from RawData Set (Appendix 2) and locate
new sampling location
Does site informationindicate potential for
anthropogenic effects andexhibit'outliers'and'extremes' for many
elements?
Was the sitein questionre-visited?
Resample site and analyse for elements Inquestion.
Results failed site verificationsampling - exclude extremeand/or outliar values from
Partially Evaluated Data Set,but still included In the Raw
Data Set (Appendix 2).
For the set of data now collatedfor each individual site (now 5
concentration values for each),Are any of the values outliers orextremes for the Site Data Set?
Retain non-outlier valuesas part of the PartiallyEvaluated Data Set
Peform new statistical analysis on revisedPartially Evaluated Data Set
Do any outlier or extremevalues (excluding the 'all
non-volcanic soils'group) exist within each
Individual soil type ?
Is the soiltype
volcanic?
Is the outlier or extremevalue an 'outlier' or 'extreme
value when considered aspart of the whole
Non-Volcanic Group?
Does value fall withinthe non-outlier
volcanic range ?
Trace element consideredanomolous
Exclude from Validated Soils DataSet.
Is the excluded traceelement concentrationdata grouped (rather
than a single point) andfrom a single site orspecific lithology?
Future further workrequired to establish
the validity of value toenable Inclusion
within the BackgroundValidated Soils
Data Set
ARC Technical Publication No. 153 21

IIIIIIIIIIIIIIIIIIII
data set, and the Kolmogorov-Smirnov test was performed to determine the"goodness of fit" to a 95% level of confidence. As an alternate method for validatingthe log-normal distribution of the volcanic data, a Shapiro-Wilkes test for normalitywas applied to a log transformation of the original data set. While analyses show thedistribution of most elements in volcanic soils is log-normal, a normal distributionmust be assumed for the other soil types until enough data is collated to proveotherwise.
To identify values obtained from soils that lie outside the expected distribution rangebased on the total sample set, box and whisker plots were constructed (see Appendix3). The median values are represented by the small central box, while the large outerbox represents the 25th to 75* percentile range, and the whiskers represent the 'non-outlier range', which is defined here as 1.5 times the large outer box height (i.e. theinterquartile range, see Figure 6). Values that exceed the expected distribution rangeare referred to as outliers and extreme values.
A data point is deemed to be an outlier if the following conditions hold:
data point value > UBV + OC x (UBV - LBV)
A data point is deemed to be an extreme value if the following conditions hold:
data point value > UBV + (2 x OC) x (UBV - LBV)
where UBV is the upper value of the box in the box plot (i.e. the 75thpercentile);
LBV is the lower value of the box in the box plot (i.e. the 25th percentile); and
OC is the outlier coefficient (1.5 is used for this data set).
A visual interpretation of outlier and extreme values is shown in Figure 6.
This definition of outliers and extremes, calculated using a co-efficient of 1.5, isbought about by the use of the median as the mid-point rather than the mean. If themean were employed, the standard deviation would be used to calculate outlier andextreme values, instead of the interquartile range. Thus the value of 1.5 * theinterquartile range approximates 2 standard deviations (i.e. 97.7%, values abovewhich are 'outliers') and 3 * the interquartile range approximates 3 standarddeviations (i.e. 99.9%, values above which are 'extremes'). The median is used inthis investigation because of the potential non-normal distribution of the data, asdiscussed below.
Outliers and extreme values are measurements that are extremely large or smallrelative to the rest of the data, and therefore are suspected of misrepresenting thepopulation from which they were collected. They may represent analytical orsampling errors, or true elevated values of a distribution (e.g. hotspots), indicatingmore variability in the population than was expected. Not removing true outlier andextreme values, and removing false outlier and extreme values both lead to adistortion of estimates of population parameters.
ARC Technical Publication No. 153 ' 23

Figure 6: Definition of Outliers and Extremes
MEDIAN VALUE
LLJ^— fj)
1 1 1 —
icoCCUJ
O
\UJOz
GCUJ_J
0zOz
UJ
O
2W
trEi
A
A
O
O
\_Q
OOOAA
'
in•_(-
X
Iiq
UBV(75%)
LBV(25%)
Outlier and extreme values require further investigation. It is good practice not todiscard any data based solely on the statistical test. However, if a sound reason isfound to support that the data point is in error or non-representative of background,then the value should be excluded from further analysis. In this investigation, thedata points were excluded when further sampling and analysis from that sample sitecould not validate the outlier or extreme value (indicating possible sampling oranalytical error, or the presence of a 'hotspot'), or when the sample site itself wassuspected of recent disturbances that may have interfered with background elementlevels. The potential for a component of volcanic ash to occur within any soil typehas also been noted as a source of outlier and extreme measurements in these soiltypes, as discussed above.
In the 2001 investigation, not all sites with outlier or extreme values were re-visited,and hence these sites were unable to be validated and evaluated. Where the outliersand extremes were within the non-outlier range for volcanic soils they were includedin the validated background soils data set. As the aim of this investigation is toidentify background concentration ranges for soil types in the Auckland Region,spurious outlier and extreme values were removed from the validated backgroundsoils data set, and tagged for further work.
The outlier and extreme definition given above, and shown in Figure 6 was obtained,and the statistical analyses performed in this investigation, using STATISTICAVersion 6 software developed by Statsoft Inc.
The box and whisker plots in Appendix 3 show the normal distribution spreads for allnon-volcanic soil types, while the volcanic box and whiskers were created using thelog transformed data and then replotted to fit the original concentrations on the y-axis.The log normal transformation has the effect of including what in a normallydistributed data set were outlier and extreme values, within the non-outlier range.
ARC Technical Publication No.153 24
IIIIIIIIIIIIIIIIIIII

IIIIIIIIIIIIIIIIIIII
3.3 ArsenicArsenic concentrations in all soil types in the 1999 survey ranged between 0.41 -17.83 mg/kg. The outlier of 17.83 mg/kg in the Quaternary deposits at Waiau Pa wasresampled in the October 2001 survey, and the sampling site relocated to Waiau PaDomain Reserve. A limited variance between 8.2 and 10.6 mg/kg was obtained fromthe four 2001 samples, indicating the 17.83 mg/kg value as an outlier in the site dataset, and as such the 17.83 value was excluded from the resultant validatedbackground soils data set. It is understood that concentrations of this order havebeen observed in Holocene Sands in the Auckland Region, however to date nosupporting data exists. Therefore the current background range of arsenicconcentrations for all soil types is 0.4-12 mg/kg.
Geometric mean values ranged between 1.65 - 6.51 across all soil types.
Further analyses for arsenic concentrations in sand-derived soil types arerecommended, and also the assessment of the validity of outliers in Waitemata soilsat Cape Horn (11.54 mg/kg) and McKenzie Rd (10.16 mg/kg).
3.4 BariumThe 1999 survey found barium concentrations in all soil types ranged from 8.7 - 803mg/kg. Barium outliers at Auckland Domain (691 mg/kg), Greenmount (786 mg/kg)and Point England Reserve (803 mg/kg) were re-sampled in 2001, and gave bariumconcentrations of between 77 - 112 mg/kg, 128 - 193 mg/kg, and 287 - 325 mg/kgrespectively. The 1999 values have therefore been removed from the validatedbackground soils data set as extreme values, refining, the background range for allsoil types as 8 - 350 mg/kg.
The geometric mean of the volcanic soils is 155 mg/kg, and ranges from 45 - 105mg/kg for the other non-volcanic soil types.
Further work is required to assess the validity of the 313 mg/kg concentrationrecorded in Waitemata Group sediments at McKenzie Rd in the Hunua Ranges.Should this value not be validated, a distinct difference in volcanic and non-volcanicbackground ranges becomes apparent, with volcanic soils ranging from 30 - 350mg/kg, and all other soil types ranging from 8-215 mg/kg.
3.5 BoronThe 1999 survey found boron concentrations in volcanic soils ranged from 2 - 839mg/kg, and in all other soil types ranged from 2-63 mg/kg. To verify the statisticallyextreme concentration detected in the volcanic soil at Paparata Rd in the 1999 survey(839 mg/kg) the site was re-visited in 2001. The four composite samples all recordedboron concentrations of <2 - 3 mg/kg. Therefore the 1999 Paparata Rd result hasbeen removed from the validated background soils data set as an extreme value,resulting in a refined background range for volcanic soils of <2 - 260 mg/kg.
The 1999 boron outlier of 63.3 mg/kg in the Awhitu Sands was also resampled in2001, all four composite samples for this site gave values of 2 mg/kg. The 1999results have therefore been removed from the validated background soils data set,resulting in a refined non-volcanic background range of 2 - 45 mg/kg.
The geometric mean of the volcanic soils is 46 mg/kg, and ranges between 8-17mg/kg for all other soil types.
ARC Technical Publication No. 153 25

II
3.6 CadmiumThirty-six of the 91 soil samples were below the limit of detection for cadmium by the •method employed (i.e. less than 0.1 mg/kg) in the 1999 survey, however cadmium |was detected in at least one sample of each soil type. The range detected in all soiltypes in the 1999 sampling was <0.1 =- 0.8 mg/kg. _
The outlier cadmium concentrations reported at Mt Smart (0.77 mg/kg) and Waiau Pa |(0.5 mg/kg) were resampled in 2001, and reported cadmium concentrations ofbetween 0.27 - 0.48 mg/kg and 0.23 - 0.33 mg/kg, respectively. The 0.77 and 0.5 _mg/kg values were outliers within their respective site data sets, and therefore each •was removed from the validated background soils data set. The refined background ™range for cadmium is <0.1 - 0.65 mg/kg for all soil types.
The geometric mean for volcanic soils is 0.23 mg/kg and 0.07 - 0.14 mg/kg for the •other soil types. ~
Further work could be carried out in the Quaternary Sands at Orere Point to .determine the validity of the 0.46 mg/kg outlier value. •
3.7 Chromium •The 1999 survey found chromium concentrations in volcanic soils ranged from.3 - |286 mg/kg, and in all other soil types ranged from 2 - 149 mg/kg. The maximumrecorded concentrations for chromium in the 1999 survey was from Ti Point Basalt _(286 mg/kg). This site was resampled and concentrations of chromium were reported •at 195-260 mg/kg. When included as part of the volcanic data set, these ™concentrations are outliers/extremes, however, the verification of the chromiumconcentrations in soils at this location likely reflects the Kerikeri Volcanics mineralogy •(with respect to the Auckland Isthmus and South Auckland Volcanic fields). |
The extreme chromium concentration obtained from Waitemata Group soils atMcKenzie Road (149 mg/kg) was unable to be accurately located and re-sampled to •verify the elevated result with respect to the Waitemata Group data set. As this value |exceeds the non-outlier range of concentrations recorded for both non-volcanic andvolcanic soil groups it has been removed from the validated background soils data —set. The refined background range for non-volcanic soils is 2 - 55 mg/kg, while the •background range for volcanic soils (excluding Ti Point/Kerikeri Volcanics) is 3 - 125 ™mg/kg.
The geometric mean for chromium in volcanic soils is 48 mg/kg, and ranged between •7.0-14 mg/kg for the other soil types. •
I
I
3.8 CobaltThe 1999 survey found cobalt concentrations in volcanic soils ranged from 10 - 385mg/kg, and in all other soil types ranged from 0.2 - 55 mg/kg. The cobalt outliers and .extreme values at Paparata Road (385 mg/kg), Smales Quarry (228 mg/kg) and Mt •Eden (223 mg/kg) were resampled in 2001, giving cobalt values of between 10.5- *11.1 mg/kg, 13.5 - 51.8 mg/kg and 33 - 49.4 mg/kg, respectively. The 1999 valueshave therefore all been removed from the validated background soils data set, givinga refined volcanic background range of between 10-170 mg/kg.
The cobalt outlier of 54.4 mg/kg measured in sands at Awhitu in 1999 was resampledin 2001 and returned values of 24.3 - 30.4 mg/kg. The resampling results showedthe value of 54.4 mg/kg to be an outlier of the site data set, and it was thereforeexcluded from the validated background soils data set. The revised backgroundvalues for cobalt in non-volcanic soils is therefore 0.2-35 mg/kg.
The geometric mean for volcanic soils is 48 mg/kg, and ranges between 1.6 - 9.2mg/kg for the other soil types.
ARC Technical Publication No. 153 26

IIIIIIIIIIIIIIIIIIII
3.9 CopperThe 1999 survey found copper concentrations in all soil-types ranged from 20 - 111mg/kg. The copper outliers identified within the volcanic soils at Rutherford Road(111 mg/kg), and sand-derived soils at Awhitu (33 mg/kg) were resampled in 2001.The volcanic soils at Rutherford Rd returned copper values of between 51 -60mg/kg, therefore the 111 mg/kg value has been removed from the validatedbackground soils data set.
The Awhitu sands recorded copper concentrations of 20.2 - 27.1 mg/kg at three ofthe four locations, with one location reporting the highest level detected of 135 mg/kg.The 135 mg/kg concentration from sand-derived soils at Awhitu was removed fromthe validated soils data set as an extreme value, although further work isrecommended to be undertaken to ascertain whether higher background copperlevels specific to the Awhitu sands exist. The refined background range of copperconcentrations for volcanic soils is at 20 - 90 mg/kg, and for all other soil types is 1 -45 mg/kg.
The geometric mean of copper in volcanic soils is 44.5 mg/kg, and ranges from 3.6 -17.2 mg/kg in other soil types.
3.10LeadThe 1999 survey found lead concentrations in all soil types ranged from 0.5 - 1280mg/kg. The outlier lead concentrations reported in Ti Point (1280 mg/kg) and MtSmart (475 mg/kg) and Ihumataq (128 mg/kg) volcanic soils were resampled in the2001 survey, and reported lead concentrations of 13.4 - 15.8 mg/kg, 61.7 - 143mg/kg and 14.3 - 33.7 mg/kg respectively. The 1999 values were therefore removedfrom the validated background soils data set as extreme values.
The 2001 concentrations of 88.5 - 143 mg/kg obtained at Mt Smart are the fourgreatest lead concentrations recorded within volcanic soils. While they are not outlieror extreme values given the log-normal distribution of lead in volcanic soils, it isunclear if these values are specific to the Mt Smart basalts or whether they are aresult of anthropogenic effects. The Mt Smart data has therefore been removed fromthe validated background soils data set, and the background range for lead in all soiltypes shall remain at <1.5 - 65 mg/kg until further works can be conducted. Verticalsoil profiling is recommended at Mt Smart.
The lead concentration reported in the 1999 survey for Awhitu sands was an outliervalue for the sand soil type (31.4 mg/kg). The site was resampled in 2001, andreturned lead concentrations of 15.1 - 38.3 mg/kg at three of the four locations, withone location reporting 538 mg/kg. The 538 mg/kg concentration from sand-derivedsoils at Awhitu was removed from the validated background soils data set as anextreme value.
The geometric mean of lead concentrations ranges between 5.6 - 25 mg/kg in all soiltypes.
3.11 MagnesiumThe 1999 survey found magnesium concentrations in volcanic soils ranged from 190- 76,600 mg/kg, and in all other soil types ranged from 470 - 10,300 mg/kg. Volcanicsoils have a geometric mean of 7024 mg/kg and a 95th percentile of 47,300 mg/kg,while all the other soils have a geometric mean around 1500 mg/kg.
3.12 ManganeseThe 1999 survey found manganese concentrations all soil types ranged from 20 -8500 mg/kg. The outlier of 8496 mg/kg in the sand-derived soils at Awhitu wasresampled in 2001 and returned values of between 3390 - 5890 mg/kg, indicating thepresence of mineral sands at this location. This set of values remain extreme inrelation to the overall concentration of manganese in sand, therefore the manganese
ARC Technical Publication No.l53 27
Ibackground range has been refined to exclude the Awhitu sand data, which appears |to be specific to only this lithology. The revised manganese backgroundconcentration range is 10 - 2,500 mg/kg for all soil types, excluding the Awhitu _sands. ' •
The geometric mean concentration in volcanic soils is 1075 mg/kg, while thegeometric mean concentration ranges from 86-417 mg/kg across the other soil —types. •
Further work could be carried out in the Okahukura Peninsula sand-derived soils todetermine the validity of the extreme manganese value of 1704 mg/kg recorded at _this locality. Should this value not be validated, a difference in volcanic and non- •volcanic background ranges becomes apparent, with volcanic soils ranging from 360 ™- 2,500 mg/kg, and all other soil types ranging from 10 - 1460 mg/kg.
3.13 Mercury ™The 1999 survey found mercury concentrations in all soil types ranged from <0.03 - _2.3 mg/kg. Most soil samples recorded mercury concentrations above the detection •limit of 0.025 mg/kg. The 1999 survey recorded extreme mercury concentrations of ™2.3 mg/kg at One Tree Hill, which was resampled in 2001 and recorded mercuryconcentrations of between 0.08 - 0.11 mg/kg. Hence the 1999 mercury •concentration was removed from the validated background soils data set, confirming |the background range of <0.03 - 0.45 mg/kg in all soil types.
The geometric mean concentration range of mercury for all soil types is 0.07 - 0.2mg/kg. I3.14 Nickel •The 1999 survey found nickel concentrations in volcanic soils ranged from 4 - 320 •mg/kg, and in all other soil types ranged from 0.9 - 35 mg/kg. Concentrations ofnickel are generally higher among the volcanic soils of the Auckland isthmus. •
Although not initially recorded as an anomalous value, the 317 mg/kg nickel ™concentration reported in the 1999 investigation from Mt Smart was removed from thevalidated background soils data set when the 2001 validation testing (for a full suite of •elements) returned nickel concentrations of between 28.7 - 104 mg/kg. J|
The geometric mean for nickel concentrations in volcanic soils is 87 mg/kg, andranges between 2.7 - 9.0 mg/kg in all other soil types. •
3.15 NitrogenThe 1999 survey found total nitrogen concentrations in all soils ranged from 320 - •8430 mg/kg. The geometric mean for nitrogen concentrations ranged from 1375 - ™3200 mg/kg in soil types across the Auckland Region.
Further work could be undertaken to assess the validity of the volcanic outlier of 8422 Img/kg observed at Mt Smart. ™
3.16 Phosphorus gPhosphorus levels in soil samples indicated that there are higher levels in volcanicderived soils than in all other soil types. The 1999 survey found phosphorusconcentrations in volcanic soils is 245 - 3730 mg/kg, and the range for non-volcanicsoil types is 75-1220 mg/kg.
The geometric mean for phosphorus concentrations in volcanic soils is 1180 mg/kg,and ranges between 220 - 530 mg/kg in all other soil types.
Further work could be undertaken to assess the validity of the volcanic outlier of 3729mg/kg observed at Mt Smart.
ARC Technical Publication No.]53 28

IIIIIIIIIIIIIIIIIIII
3.17 PotassiumThe 1999 survey found potassium concentrations in all soil types ranged between226 - 5840 mg/kg, with geometric means of between 713 - 1275 mg/kg.
The extreme potassium concentration of 5840 mg/kg obtained from the Waihekegreywackes soils exceeds the non-outlier range of concentrations recorded for boththe 'all non-volcanic soils group' and the volcanic soils group, and has therefore beenremoved from the validated background soils data set. The refined background rangefor potassium in all soil types is therefore 226 - 3660 mg/kg until further work can beconducted to assess the validity of the 5480 mg/kg extreme value.
3.18 SulphurThe 1999 survey found sulphur concentrations in all soil types ranged from 85 - 2513mg/kg. The geometric mean of sulphur concentrations in soils varied between 333and 740 mg/kg.
To verify the outlier sulphur concentration of 2513 mg/kg reported at Kumeu Heightsin 1999, the site .was resampled in 2001, and returned values of 400 - 500 mg/kg.The 2513 mg/kg value was therefore excluded from the validated background soilsdata set, giving a revised background range of 85 - 2,300 mg/kg for all soil types.
Further work could be undertaken to assess the validity of the volcanic outlier of 2288mg/kg observed at Puhinui Crater.
3.19 TinThe 1999 survey found tin concentrations in all soil types ranged from <0.7 - 11.5mg/kg. Concentrations of tin detected in soils in the Auckland Region were generallylow to below the analytical detection limit (0.7 mg/kg in the 1999 survey). The 1999survey reported an extreme value at Ti Point (411 mg/kg), which was resampled andreported tin concentrations of between 0.8 - 1.0 mg/kg. The 411 mg/kg value wastherefore excluded from the validated background soils data set.
Two site specific sets of outlier and extreme tin values in volcanic soils have beenidentified; four locations within a 5 km radius in the Franklin Basalts (Glenbrook, KiwiRd, Puni and Patumahoe) recorded tin concentrations between 1.85 - 3.44 mg/kg,while tin values obtained from Mt Smart soils in 2001 ranged from 1.8 - 5.5 mg/kg.
The values of 11.5 mg/kg and 7.48 mg/kg obtained from Quaternary sediments atNew Lynn and Hobsonville Airbase respectively, are statistically extreme and outliervalues for their own soil type, and are outside the non-outlier volcanic soils datarange. These values have therefore been removed from the data set, resulting in arefined range of 0.35 - 4 mg/kg for all soil types. Further work could be undertaken toascertain the validity of the extreme values measured at New Lynn and HobsonvilleAirbase.
The geometric mean of tin concentrations ranged between 0.4 - 1.9 mg/kg in all soiltypes.
3.20 VanadiumThe 1999 survey found volcanic soils recorded a wide distribution of vanadiumconcentrations particularly within the Auckland isthmus basalts. South Aucklandbasalts showed limited variance, with concentrations of 147 to 181 mg/kg recorded,compared to a range of 15.6 to 603 mg/kg for all other volcanic samples. The outliervanadium concentrations reported in the Auckland Domain (603 mg/kg) and OneTree Hill (508 mg/kg) volcanic soils were resampled in 2001, and reported vanadiumconcentrations of 50 - 68 mg/kg, and 116 - 137 mg/kg respectively. The 1999values were therefore removed from the validated background soils data set. Therevised background range for vanadium concentrations in volcanic soils is therefore15-370 mg/kg.
ARC Technical Publication No. 153 29
ITo assess the extreme vanadium concentration measured in Awhitu sands (303 •mg/kg) the site was resampled in 2001. Vanadium concentrations were measuredbetween 271 - 320 mg/kg, indicating that the data is valid and possibly lithology _specific. These values are outliers within the sand-derived soil type, and as part of Ithe non-volcanic group as a whole, therefore they were removed from the validated ™background soils data set, resulting in background vanadium concentrations in non-volcanic soil types between 8-160 mg/kg, with the exception of Awhitu (mineral) Asands. g
The geometric mean for vanadium concentrations in volcanic soils was 133 mg/kg,and ranged between 27 - 57 mg/kg in other soil types. •
3.21 ZincA wide distribution of zinc concentrations was recorded in volcanic soils in 1999, •particularly within the Auckland isthmus basalts. South Auckland basalts showed 'limited variance, with concentrations of 70 to 166 mg/kg recorded (althoughPukekohe Hill recorded a concentration of 789 mg/kg), compared to a range of 54 to •1160 mg/kg for all other volcanic samples. The 1999 survey found zinc j|concentrations in all other soil types ranged from 9.2 - 179 mg/kg.
The geometric mean for zinc concentrations in volcanic soils was 252 mg/kg, and •ranged between 18-59 mg/kg in other soil types. . fj
3.22 Total Organic Carbon •The analysis of total organic carbon was undertaken to provide some measure of the ™variability of carbon levels in surficial soils in undisturbed environments of theAuckland region. The identification and assessment of any relationship between •anomalous trace element levels and either elevated or depressed carbon levels is |beyond the scope of this report. The 1999 samples from all soil types recordedvalues of between 0.6-14 % dry weight. _
ARC Technical Publication No.153 30
I
I
I
I
I
I
I
I
I

IIIIIIIIIIIIIIIIIIII
4. Discussion
4.1 Volcanic Soils in the Auckland RegionResults obtained from volcanic soils in the Auckland region indicate that for manyparameters (barium, boron, cadmium, chromium, cobalt, copper, magnesium,manganese, nickel, phosphorus, vanadium and zinc) the distribution of levels of thetrace element is elevated compared to other derived soil types. In addition, thevolcanic centres - Auckland Isthmus (central), Franklin Basalts (south) and KerikeriVolcanics (north), are often geochemically distinct from each other; for example, theelevated chromium concentrations in the Ti Point Basalts, or the low concentrationsand low variance of vanadium distribution in the Franklin Basalts.
4.2 Volcanic Processes and Potential Impact on Other Soil TypesConsideration of each of the soil types as having a distinct geochemical range wouldbe useful in the setting of acceptable background concentrations for the AucklandRegion for a number of parameters. However, due to the geologically young age ofthe volcanic deposits and the explosive nature of their formation, the surficial layer ofother geological deposits (and indeed to greater depths in Holocene Sands andQuaternary Sediments) have the potential to be affected by the presence of airfalltephra. It is therefore recommended that the ranges reported for a given soil type arecompared to the ranges listed for that soil type, however, if exceedences occur withinthat soil type, that consideration be given to the potential for a significant volcaniccomponent within the given soil type.
4.3 The Non-Volcanic Soils GroupingIt is recognised that there is little validity in grouping the non-volcanic soil typestogether, as each of the parent lithologies are potentially chemically very different.However, for the purpose of statistical analysis in this report the grouping is made tocompensate for the small number of samples within each of the non-volcanic soil datasets currently collated. Volcanic soils have a minimum of 33 samples for eachelement, while minimum sample sizes for the non-volcanic soils are as follows:Waitematas (19), Quaternary (12), Sands (12), Greywackes (6), Limestone (4),Onerahi Chaos Breccia (2) and Manukau Breccia (2).
As the number of samples for each of the non-volcanic soil types increases, the 'allnon-volcanic soils' grouping may be reconsidered in favour of ranges for each of thenon-volcanic soil types individually.
4.4 Specific LithologiesValidation testing has confirmed elevated concentrations (above the backgroundranges for their own soil types) of certain elements in the following lithogies: Volcanicderived soils at Ti Point (Cr), Mt Smart (Pb, Sn), and Franklin (Sn), and sand-derivedsoils at Awhitu (Mn, V).
It is likely that these concentrations are a reflection of the mineralogy of the parentmaterial, although at Mt Smart anthropogenic activities may have had some effect.While the values obtained from these sites have been excluded from the statisticalanalyses in Appendix 3, and the resultant background ranges, it is recognised thatsoils from these locations need to be considered individually.
4.5 Auckland Region Background RangesTable 3 summarises the background ranges for trace elements in Auckland soilsbased on the statistical analysis of results from soils analysed in the 1999 and 2001studies. In some cases, a single range is given to include both volcanic and non-
ARC Technical Publication No. 153 : JT

volcanic soil types. When the range of concentrations in volcanic soils is greater thanthat of non-volcanic soils, to the extent that the volcanic median value isapproximately equal to or greater than the non-volcanic soils maximum non-outliervalue, a range for each type (volcanic and non-volcanic) is given.
Table 3: Background Ranges of Trace Elements in Auckland Soils(all values in mg/kg unless otherwise specified)
Element (Total Recoverable) Non-Volcanic Range Volcanic Range
Arsenic (As)
Barium (Ba)
Boron (B)
Cadmium (Cd)
Chromium (Cr)
Cobalt (Co)
Copper (Cu)
Lead (Pb)
Magnesium (Mg)
Manganese (Mn)
Mercury (Hg)
Nickel (Ni)
Nitrogen (total, N)
Phosphorus (P)
Potassium (K)
Sulphur (S)
Tin(Sn)
Vanadium (V)
Zinc (Zn)
Total Organic Carbon (TOC)
0.4-12
8-350
2-45 <2 - 260
<0.1 -0.65
2-55
0.2 - 35
1 - 45
3-125*
10-170
20-90
< 1.5-65*
470-10,300 190-76,600
10-2,500*
<0.03 - 0.45
0.9-35 4-320
300 - 8,500
75-1,220 245 - 3,730
220 - 3,660
85 - 2,300
<0.7-4*
8-160*
9-180
15-370
54-1,160
0.6-14%
2.
Notes:Background ranges for major elements (N, P, S, TOC) include statistical outlier and extremevalues outside the non-outlier volcanic soil range. All other elements do not include valuesobtained that were statistical outliers or extremes outside the non-outlier volcanic soil range.*Work suggests special cases have been found to apply for Ti Point Basalts (Cr), Mt SmartVolcanics (Pb, Sn), Franklin Basalts (Sn), and Awhitu-type Mineral Sands (Mn, V) and as suchthese lithologies need to be considered individually.
The background levels given in Table 3 are the maximum and minimum values fromthe validated background soils data set as determined by statistical analysis of thecurrent set of soil data (raw data) included in Appendix 2. Further investigations andanalysis are ongoing, and the background levels will become refined as more data iscollated. In particular the Greywacke, Limestone, Manukau Breccia and OnerahiChaos Breccia derived soil types require more data to provide for statistical analysisand refinement of their background soil ranges.
ARC Technical Publication No.153 32
IIIIIIIIIIIIIIIIIIII

IIIIIIIIIIIIIIIIIIII
4.6 Background Soil Concentrations Applicability to SoilInvestigations in AucklandWhile the ANZECC/NHMRC (1992) Guidelines proposed setting health-based andenvironmental-based investigation thresholds, they also indicated the need to identifylocal background soil levels of trace elements to provide a suitable context fordecision making. Where soils are investigated and decisions regarding contaminantremoval or trace element treatment are considered readily available regionalbackground soil level information provides a baseline below which levels areacceptable within the region. This data may assist in minimising costly sampling orsoil removal / treatment.
Two means of identification for soils have been used in this study, the identification bygeological map and by excavation of the soil profile as well as the "fingerprint"associated with the limited range of analyses undertaken. In assessing the soils atany location in the Auckland region these should both be undertaken. This allowsidentification of the likely ranges of trace elements for a site from details in this studyas well as comparison of site samples to confirm that soils are, at least in places onor near that location, representative of the soil type described.
ARC Technical Publication No. 153 33

IIIIIIIIIIIIIIIIIIII
5. Recommendations
The ANZECC/NHMRC Guidelines for Assessment and Management ofContaminated Sites recommend the .evaluation of background levels as aconsideration in the determination of clean-up standards. The data collected in thissurvey on trace metals in soils from the Auckland Region can be used in this context.
Environmental investigation threshold levels should be related to the backgroundlevels of the elements. Certain environmental investigation threshold levels mayneed to be reconsidered dependent on the soil terrains investigated in the Aucklandsetting; in particular, those where samples considered to be undisturbed anduncontaminated soil were found to contain total recoverable levels of elements atconcentrations above the currently accepted environmental investigation levels.
Where 'site/Iithology specific' elevated concentrations were observed, further samplesfrom additional sites with soils derived from the same lithologies should be collectedto further validate the consistently elevated concentrations observed there. Thelithologies and elements to be further validated include:
1) Kerikeri Volcanics for chromium;
2) Mt Smart Volcanics for lead and tin;
3) Franklin Basalts for tin; and
4) Holocene Mineral Sands (Awhitu-type) for manganese and vanadium.
In addition the anomalous concentrations observed at the following locations shouldbe resampled and evaluated:
Volcanic soils at Mt Smart for nitrogen and phosphorus, and Puhinui Crater forsulphur;
Awhitu sands for copper and Okahukura sands for manganese;
Waitemata-derived soils at McKenzie Rd in the Hunua Ranges for arsenic,barium and chromium; at Cape Horn for arsenic;
Quaternary sediments at Hobsonville Airbase and New Lynn for tin, and at OrerePoint for cadmium;
Greywacke-derived soils at Waiheke Island for potassium.
At all future sites sampled, it is recommended that a vertical profile of the soilchemistry be established, by collecting a second sample at 150 - 300 mm depth tohelp identify any anthropogenic input to the near-surface soils.
Collection of the above data may be undertaken by either directed surveys or bycollation of independently collected data providing that in the second case the sameor similar sampling and site identification methodologies are utilised.
6. Acknowledgements
The study design, sampling, data analysis and reporting for the 2001 investigationwas conducted by URS New Zealand Ltd, in conjunction with Sharon Vujnovich of theARC. The study design, sampling, data analysis and reporting for the 1999investigation was conducted by Ramon Scoble of the ARC.
This paper has benefited from helpful suggestions from Dr Murray Wallis of URS NewZealand Ltd (formerly Woodward-Clyde (NZ) Ltd), Peter Robinson of Hill LaboratoriesLtd, Terrey Fitzgerald of Watercare Services Ltd and Eddie Grogan of the AucklandRegional Council.
ARC Technical Publication No. 153 . 35

IIIIIIIIIIIIIIIIIIII
7. References
ANZECC / NHMRC (1992) Guidelines for the Assessment and Management ofContaminated Sites, Australian and New Zealand Environment andConservation Council.
Canadian Council of Ministers of the Environment (1999), Canadian EnvironmentalQuality Guidelines.
Patil G.P., Rao, C.R. (editors), Handbook of Statistics Volume 12; EnvironmentalStatistics (1994), Elsevier Science B.V.
Ministry for the Environment and Ministry of Health (June 1997) Health andEnvironmental Guidelines for Selected Timber Treatment Chemicals.
Ministry for the Environment, (2001) Hierarchy and Application of EnvironmentalAcceptance Criteria in New Zealand. Draft Version.
Ministry for the Environment, (June 1999) Guidelines for the Assessing and Managingof Petroleum Hydrocarbon Contaminated Sites in New Zealand.
Ministry for the Environment, (August 1997) Guidelines for Assessing and ManagingContaminated Gasworks Sites in New Zealand.
Ministry of Housing, (1994) Environmental Quality Objectives in the Netherlands.Risk Assessment and Environmental Quality Division Directorate forChemicals, External Safety and Radiation Protection, and Ministry ofHousing, Spatial Planning and the Environment.
National Environment Protection Council (1999) National Environment Protection(Assessment of Site Contamination) Measure.
NZ Government (1991) Resource Management Act Government Printer
Statsoft Inc., (2001), Statistica Version 6, statistical analysis software.
Wageningan SETOC Soils ILCP, Dr V Houba, PO Box 8005, 700 EC, Wageningan,The Netherlands.
United States Environmental Protection Agency (2000), Preliminary Remediation andGoals, Region 9.
United States Environmental Protection Agency (July 2000), Guidance for DataQuality Assessment; Practical Methods for Data Analysis. EPA QA/9.
ARC Technical Publication No. 153 37

APPENDICES
ARC Technical Publication No. 153 39
IIIIIIIIIIIIIIIIIIII
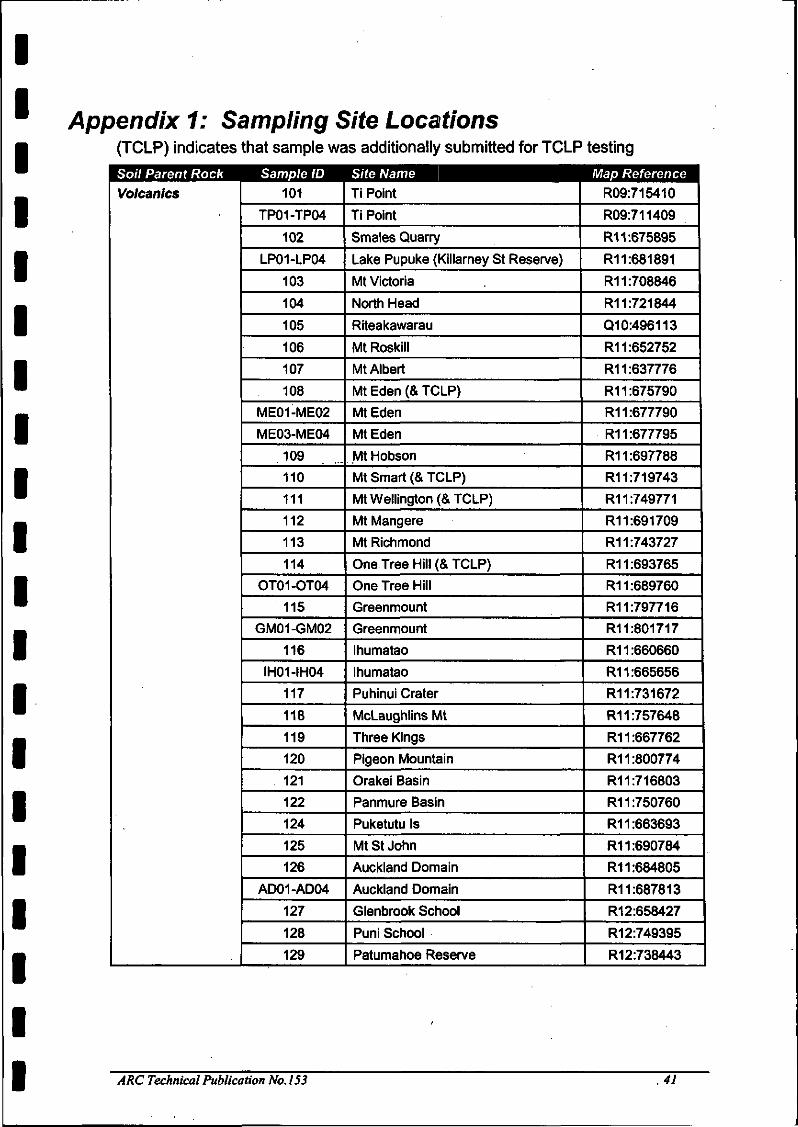
Appendix 1: Sampling Site Locations(TCLP) indicates that sample was additionally submitted for TCLP testing
Soil Parent Rock Sample ID Site Name Map Reference 1
Volcanics 101
TP01-TP04
102
LP01-LP04
103
104
105
106
107
108
ME01-ME02
ME03-ME04
109
110
111
112
113
114
OT01-OT04
115
GM01-GM02
116
IH01-IH04
117
118
119
120
121
122
124
125
126
AD01-AD04
127
128
129
Ti Point
Ti Point
Smales Quarry
Lake Pupuke (Killarney St Reserve)
Mt Victoria
North Head
Riteakawarau
Mt Roskill
Mt Albert
Mt Eden (& TCLP)
Mt Eden
Mt Eden
Mt Hobson
Mt Smart (& TCLP)
Mt Wellington (& TCLP)
Mt Mangere
Mt Richmond
One Tree Hill (& TCLP)
One Tree Hill
Greenmount
Greenmount
Ihumatao
Ihumatao
Puhinui Crater
McLaughlins Mt
Three Kings
Pigeon Mountain
Orakei Basin
Panmure Basin
Puketutu Is
Mt St John
Auckland Domain
Auckland Domain
Glenbrook School
Puni School
Patumahoe Reserve
R09:715410
R09:711409
R1 1:675895
R1 1:681 891
R1 1:708846
R1 1:721 844
010:496113
R1 1:652752
R1 1:637776
R1 1:675790
R1 1:677790
R1 1:677795
R1 1:697788
R1 1:71 9743
R1 1:749771
R1 1:691 709
R1 1:743727
R1 1:693765
R1 1:689760
R1 1:7977 16
R1 1:801 71 7
R1 1:660660
R1 1:665656
R1 1:731 672
R1 1:757648
R1 1:667762
R1 1:800774
R1 1:7 16803
R1 1:750760
R1 1:663693
R1 1:690784
R1 1:684805
R1 1:6878 13
R1 2:658427
R1 2:749395
R1 2:738443
ARC Technical Publication No. 153 .41

Soil Parent Rock Sample ID Site Name Map Reference \Volcanics 130
131
132
133
RR01-RR04
134
PR01-PR04
310
PE01-PE04
Kiwi Rd
Pukekohe Hill
Adams Rd
Rutherford Rd
Rutherford Rd
Paparata Rd
Paparata Rd
Pt England Reserve
Pt England Reserve
R12:691391
R1 2:783397
R1 2:769428
R1 2:843444
R1 2:875445
R1 2:880444
R1 2:839442
R1 1:773785
R1 1:771 782Soil Parent Rock Sample ID Site Name Map Reference \Waitematas 201
202
203
204
205
206
207
KH01-KH04
208
209
KP01-KP04
211
212
213
214
215
216
217
218
219
Pakiri Reserve
Burma Rd
Kaipara Hills Rd
Green Hollows Rd
The Dome
Inland Rd
Kumeu Heights
Kumeu Heights
Whangaparaoa
Long Bay Regional Park
Kauri Point Centennial Park
Cottle Rd
Cape Horn
Kepa Bush Park
Redoubt Rd
Cyclades Reserve
Kaipara Rd
Beaver Rd
McKenzie Rd
Takapuna Grammar
R08:590538
(209:317342
Q09:424248
R1 0:5921 61
R09:563368
Q1 0:430023
Q1 0:473931
Q1 0:471 929
R1 0:693083
R1 0:640000
R1 1:628853
Q1 1:475852
R1 1:646725
R1 1:738806
R1 1:830657
R1 1:841 755
R1 2:866584
R12:865417
311:004621
R1 1:703875Soil Parent Rock Sample ID Site Name Map ReferenceQuaternary
Sediments
301
302
WP01-WP04
303
304
305
306
307
Sandspit Rd
Waiau Pa
Waiau Pa Domain Reserve
Urqhart Rd
Manukau City
Orere Point
Monument Rd
Omana Regional Park
R1 2:635395
R1 2:660501
R1 2:659504
R1 2:752563
R1 1:768659
811:106670
811:923640
811:908782
ARC Technical Publication No. 153 42

IIIIIIIIIIIIIIIIIIII
Soil Parent Rock Sample ID Site Name Map Reference 1Quaternary
Sediments
308
309
311
312
Highland Park
New Lynn
Hobsonville Airbase
Kumeu A&P Showgrounds
R1 1:803764
R1 1:600766
R1 1:590885
Q1 0:495902Soil Parent Rock Sample ID Site Name Map Reference \
Sands 401
402
403
404
405
406
407
408
409
AW01-AW04
410
411
412
South Head
Wilson Rd
Rimmer Rd Lookout
Pulpit Rd
Okahukura Peninsula
Pakiri Block Rd
Pakiri River Rd
Omaha Bay
Awhitu Central
Awhitu Central
Douglas Rd
Kariotahi School Rd
Orewa
Q09:222232
Q1 0:2631 34
Q1 0:355007
Q10:391915
Q09:273381
R08:623522
R09:654492
R09:704385
R1 2:509550
R1 2:509550
R12:541451
R1 2:597355
R1 0:6221 15Soil Parent Rock Sample ID Site Name Map Reference \Greywacke 501
502
503
504
505
506
Cape Rodney Rd
Lilburne Rd
Tapapakanga Hill
Maraetai
Waiheke
Waiheke
R09:730451
812:998521
311:119661
811:907772
511:941887
811:028840Soil Parent Rock Sample ID Site Name Map ReferenceLimestone 601
602
603
604
Marsh Rd
North Shore Aerodrome
Snells Algies
Partridge Rd
Q09:353404
R1 0:583038
R09:663293
(209:417410So/7 Parent Rock Sample ID Site NameOnerahl Chaos
Breccia
Glorit-Kaipara Hills Rd
Pebblebrook RdSo/7 Parent Rock Sample ID Site NameManukau
Breccia 802
Anawhata Rd
Goldie Bush
Map Reference(209:487313
R10:508092Map Reference
Q11:463718
Q11:418830
ARC Technical Publication No. 153 43
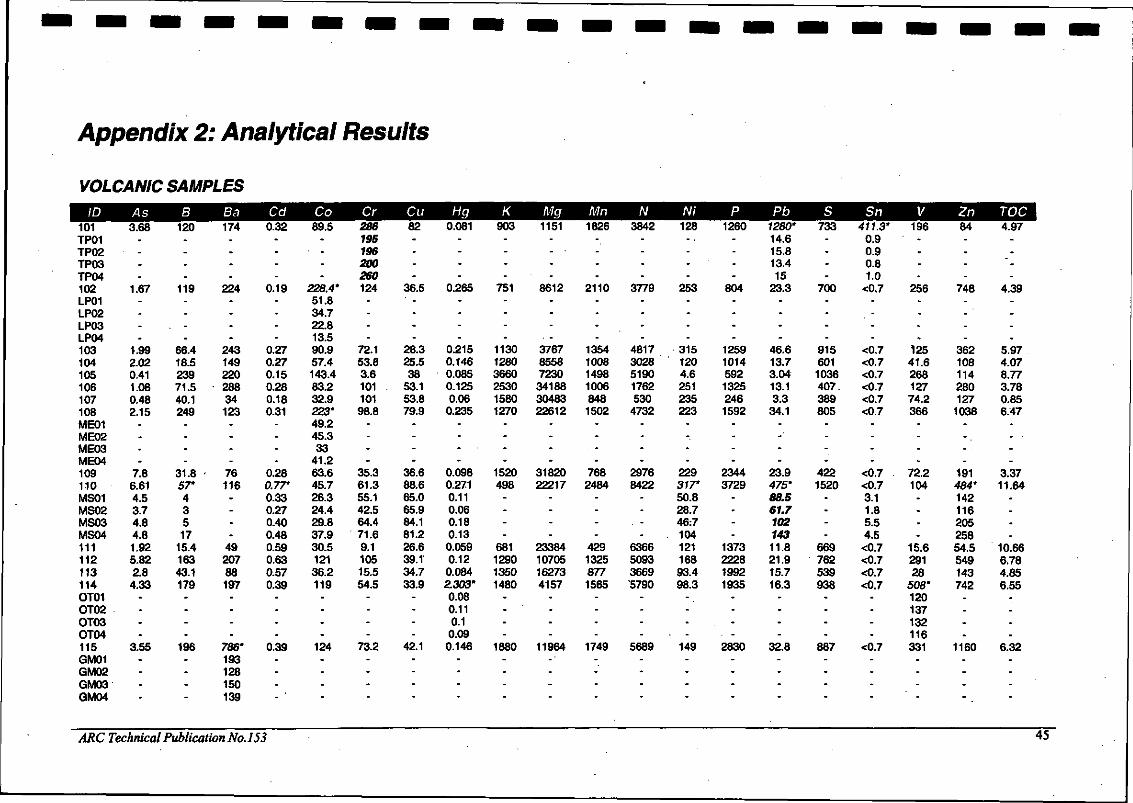
Appendix 2: Analytical Results
VOLCANIC SAMPLES
HD I101TP01TP02TP03TP04102LP01LP02LP03LP04103104105106107108ME01ME02ME03ME04109110MS01MS02MS03MS04111112113114OT01OT02OT03OT04115GM01GM02GM03GM04
^HMK^ H3.68.
•-.
1.67----
1.992.020.411.080.482.15
--..
7.86.614.53.74.84.81.925.822.84.33
----
3.55---
131120----
119--
. -.
66.418.523971.540.1249
----
31.857*43517
15.416343.1179
----
196---
^^^^1174----
224----
24314922028834123
----
76116
--.-
4920788197----
786*193128150139
^Hjf£ l0.32
----
0.19----
0.270.270.150.280.180.31
----
0.280.77*0.330.270.400.480.590.630.570.39
----
0.39---
^^R^^ l89.5-
• ---
228.4*51.834.722.813.590.957.4143.483.232.9223*49.245.333
41.263.645.726.324.429.837.930.512136.2119
----
124---
mm28619S19S200260124----
72.153.83.610110198.8
----
35.361.355.142.564.471.69.110515.554.5
----
73.2---
Mm82----
36.5• -
---
28.325.538
53.153.879.9
----
36.688.665.065.984.181.226.639.134.733.9
----
42.1--
• -
^ Eu5 l0.081
----
0.265----
0.2150.1460.0850.1250.060.235
----
0.0980.2710.110.060.180.130.0590.120.0842.303*0.080.110.10.090.146
---
mm903
----
751----
113012803660253015801270
----
1520498
----
681129013501480
----
1880---
mmm1151
-- --
•8612
---
376785587230341883048322612
----
3182022217
----
2338410705162734157
----
11964- •--
U2Q1826
----
2110----
13541008149810068481502
----
7682484
----
42913258771565
----
1749--'-
mm3842
----
3779---'
48173028519017625304732
----
29768422
--
. --
636650933669'5790
----
5689---
•?/•128
---
253----
3151204.6251235223
----
229317*50.828.746:710412116893.498.3
---
- -149
---
^^^ • ^^^H1260
----
804----
1259101459213252461592
----
23443729
----
1373222819921935
--
.. -2830
---
^^^H1280*14.615.813.415
23.3----
46.613.73.0413.13.3
34.1--'--
23.9475*88.561.710214311.821.915.716.3
----
32.8---
mm733
----
700----
9156011036407389805
----
4221520
----
669762539938
----
887---
Sn411.3*
0.90.90.81.0
<0.7----
<0.7<0.7<0.7<0.7<0.7<0.7
----
<0.7<0.73.11.85.54.5<0.7<0.7<0.7<0.7
----
<0.7---
V196
• ----
256----
12541.626812774.2366
----
72.2104--.-
15.629128
508*120137132116331
---
Zn84----
748.
--
3621081142801271038
-
- •-
191484*14211620525854.5549143742
--.-
1160.--
TOO •4.97
--
"--
4.39.-..
5.974.078.773.780.856.47
-- •--
3.3711.64
--.-
10.666.784.856.55
---.
6.32---
ARC Technical Publication No. 153 45

HEH116IH01IH02IH03IH04117118119120121122124125126AD01AD02AD03AD04127128129130131132133RR01RR02RR03RR04134PR01PR02PR03PR04310PE01PE02PE03PE04
BflM5.29
-.-.
0.694.142.271.994.126,611.931.6
0.62--.-
7.776.856.838.450.782.412.56
----
3.17-
• -.-
3.15.-
. .-
13155.9
-.--
19829.410735.722773
18.781243
----
54.660.961.757.3255190 .157--.-
839*<2233
190.-.-
Ba239----
12315172347142
.3016927969 r11283.877.198.523021620421313297157
----
181----
803*287325304317
Cd0.48
--•--
0.240.210.430.310.150.30.110.270.15
----
<0.10.13^0.1<0. 10.220.120.31
----
0.24----
<0.1----
Co34.7
----
13827.610561.112850
29.193.6134----
23.453.433.534.111416693.1
----
385*11.111
10.610.575.8
----
mm72.5
r
-
-
-
11438.489.146.879.653.139.711067.3
----
13.711.627.214.249.498.480.3
-- '--
64----
40.1----
mSIM28.7
----
75.922.953.251.448.555.137.241.581----
20.651
33.424.957.221.8111*56.751.351
60.346.6
i---
20.8----
msm0.167
----
0.0470.1480.1470.0930.1430.107<0.030.1690.219
---
0.3330.3770.3510.4010.1840.2080.187
----
0.202.
---
0.074----
mm1930
---- .
747128015102110216020801600927978
----
48911501200496735493275----
406----
1900----
mMm3948
---
3779535793379464998133007656417327149923594
----
14191414194175310043281750
----
860--
-4812
----
MtKM2420
.----
106310101321108812179926341436710
----
497675151620944363621480
----
685----
907----
mm5149
----
157735057237339227093730324
32403172
-•• -
--
2678214729042798434711073767
----
4118----
3750.---
•?/•84.1
• ---
1
22741.432020716413795.6223161----
13.611.930.19.717.822.7116
---
107--
•• -57.2
-'---
IEI1086
----
1152901
206825901610336612699721343
----
33336159837611223991812
----
955----
2148.---
msm128*16.833.714.315.411.255.443
19.260.239.613.123.227.4
----
26.252.131
36.921.214.113.4
----
15.4----
17.3...-
•a679----
228849610261593790649475732783
----
753801767742769313775
----
863--.-
670....
Sn<0.7
----
<0.7<0.7<0.7<0.7<0.7<0.7<0.7<0.7<0.7
----
1.853.143.443.13<0.7<0.7<0.7
----
<0.7--..-
<0.7•...
V87.9
• -.
--
3136615532631012823208603*68585057147158150151158155158----
181•----
335...-
Zn547
----
85323542172891336388.3288835
----
70.616610986.178971.470---
•87.5
---.
689....
roc6.56
---- '
1.883.949.473.914.724.431.425.424.56
--
• --
4.582.654.494.227.111.895.4----
5.83-..-
4.76....
ARC Technical Publication No. 153 46

WAITEMATA GROUP SAMPLES
Hj ^ H^ H201 2.63202 4.57203 1.58204 2.48205 1.36206 4.02207 2.12KH01KH02KH03KH04208 1.93209 1.32KP01KP02KP03KP04211 5212 11.54213 2.93214 5.17215 2.29216 1.7217 6.07218 10.16219 3.1
^^^H42.219.214.830.841.123.68.4-.-.
7.44.8.-..
20.85.830.211.58.213.634.237.316.7
Ba1882721895.33081
12.1----
16.18.7----
15.22971587418231.231353
Cd0.250.210.14<0.t0.15<0.1<0.1
-.
-.
<0.1<0.1
--.-
<0.10.14<0.1<0.1<0.1<0.1<0.10.150.17
Co23.6
318.36.25.3 .8.50.2---
0.71----
1.92.426.31.75.35.53.69.318.6
mm208.125
26.338.316.93.7
----
2.22.4----
5.57.640.414.619.84.9149'18.525.4
^•ffff ^^^Bffj ^^^^BA^^^^^BJTM I
35.3 0.113 2730 102615.7 0.18 389 8729.3 0.058 830 309521.8 0.096 2310 511029 0.13 1300 3844
16.8 0.074 3070 36012.2 0.137 520 654.
--.
.4.1 0.071 275 4744 0.131 226 743
7.1 0.066.7 0.064.9 0.075.0 0.0910.8 0.145 348 9047.5 0.092 401 59711.1 0.154 908 158513.9 0.035 2490 23944.6 0.196 724 9512.8 0.049 847 90911.7 0.048 1230 249221.3 0.313 1030 78221.5 0.067 2040 7563
•EBB876376
• 96613333433256----
33842----
28384112113606133586104
mm607432219825141193438441650
----
10831032
---.-
1626236328218051168194453231984644
•?/•
23.23.66.911.715.76.80.93
----
1.52.38
---- .
3.33.4619.511.5122.525.815
34.1
^^^ • ^^^H770454227580482531163----
9276216217185158250309417122137173237824597
^^^16.67.226.087.28
21.13.74
---.
13.910.78.268.347.369.079.6417.625.712.79.82.786.3140.98.9
mm10649024258191532661
2513'500400400400265180.-.-
1145401586103338322168748913
Sn<0.7<0.7<0.71.49<0.7<0.71.87
---.
<0.7<0.70.50.40.40.5
2.11<0.7<0.71.18<0.71.551.8
3.91<0.7
V56.349.361
91.113554.341-.-.
40.321.9....
11433.565.429
63.845.896.710541.3
Zn1064346
98.312357.111.5
--
- -.
16.39.6....
32.224.971.345.528.143.682.368.570.6
TOO •7.93
52.416.434.435.032.44
---.
2.362.05
-...
3.882.674.140.841.7
3.180.634.56.84
QUATERNARY SEDIMENTS
301 3.98302 17.83'WP01 8.2WP02 10.1WP03 10.6WP04 8.3303 6.97304 3.11305 7.07306 1.91307 3.76308 2.75309 6.09311 7.6312 9.11
^^^114.830.6.---
35.217.7219.69
17.612.129.68.7
^^^B179117.---
1989821147.247.1682818342.1
• H l<0.10.5*0.320.230.230.33<0.10.270.46<0.10.15<0.10.150.21<0.1
•jl ^H10.913.4
----
8.817.13.70.52.915.83.45.61.5
mm16.511.5
----8
21.15.43.93.928.17.911.14.8
• ^^^ ••/•' ^^ • ^^ •jYi'B20.5 0.325 1380 241123.7 0.302 447 1417....
27.4 0.337 1510 11728.3 0.11 861 23448.3 0.165 281 6457.6 0.169 777 8474.8 0.107 624 65611.5 0.106 1270 352915.2 0.247 700 111825.7 0.311 906 155517.7 0.421 648 886
•»!•389520
----
150139128483397612399639
mm41275202
----
34620703749272834163101206623276108
•?/•20.210.7
----
12.6115.95.42.723.28.5323.32.8
^^^ • ^^^H6661213
----
454457756363486632350401465
^QjH44.328.7
---.
26.721.319.311.216.412.956.252.622.6
^m8021191
----
12024757224265705625855291178
Sn2.41<0.7.--.
1.52.443.611.211.49<0.711.47'7.48'2.17
V64111.--.
11343.274
34.230.151.841.811833
Zn92.5111.--.
78,763.990
36.928.255.952.196.621
TOO •5.997.45
---.
2.142.654.923.493.893.786.673.7413.96
ARC Technical Publication No.]53 47

SANDS\ ID As B Ba
401 5.33 20.4 81402 8.34 24.1 170403 6.73 39.3 109404 3.4 17.9 47.9405 4.02 23.7 78406 7.44 3.6 13.4407 5.23 3.9 12.2408 3.92 3 11409 5.49 63.3* 202AW01 - 2AW02 - 2AW03 - 2AW04 - 2410 5.09 23.7 55411 7.56 23.6 73.5412 7.22 5.2 30
GREYWACKEI /O As B Ba
501 9.78 20.4 36502 4.74 13.2 178503 6.98 20.2 85.5504 3.91 10.9 63.1505 8.6 21.1 212506 7.01 13.4 181
LIMESTONE1 ID As B Ba
601 1.72 9.7 31.1602 2.3 22.1 120603 1.19 7.5 17604 1.57 10 63
Cd<0.1<0.1<0.1<0.10.180.11<0.1<0.10.22
-.--
<0.1<0.1<0.1
Cd0.12<0.1<0.1<0.10.170.17
Cd0.120.18<0.1<0.1
Co9.96.8
13.68.8
20.91.51.31.6
54.4*28.230.424.329.323.1172.4
Co4.25.22.72.8
31.84.4
Co0.69.30.52.1
IQHiO10.6 8.39.1 8.6
11.6 115.9 2.819.1 10.25.5 1.14.9 1.15.8 2.2
33.1 33.152.3 20.247.4 135' .48.2 26.841.3 27.120.2 7.911.1 17.24.5 3.7
jjQj QI13.3 28.26.1 12.94.8 8.48.5 7.3
23.8 44.812.1 25.6
I3HEB7.9 1.5
10.2 17.13.5 1.38.6 5.1
•>£•£•0.26 8670.296 10500.191 10200.124 3500.12 873<0.03 308<0.03 547<0.03 2590.319 1060
----
0.047 7500.198 676<0.03 436
K9K9<0.03 23800.117 15500.12 448
0.061 13800.104 5840*0.081 3500
•Z3HD10.073 8880.086 9490.063 6010.097 1160
mmm18051328208410202310583802635
2212----
310723241468
•u/f l
11711903843
1182590
2109
^Ku/7^114502487814
1539
KoHBI376 1950101 1069429 2491393 336
1704 199358 92645 150949 538
8496 42243390373040505840544 2265462 362461 1954
HZflHd453 1563337 1776179 558142 1685
1460 732924 3535
HOKI50 1028464 442728 114185 4085
icz i7.19.38.95.611.71.941.942.2118.1
-.--
9.59.63.4
msmm3
5.63
2.726.38.96
msi M2.118.290.943.32
• ^^^^^^ • T^^ l358 .10.4240 12.4548 12.8140 14.2303 9.6611 1.7196 3.04220 <1.5633 31.4
15.138.322.5538'
598 4.14505 12.7281 11.6
j ^H^QI855 26.7233 13.5316 17.8321 13.6471 25.7439 19.1
jjj Hjj ^H177 2.42448 12.6117 6.6260 4.83
D47035854532561810319785
1009-
•..
411787180
El345392349219370448
mm375755607525
Sn V<0.7 68.31 .24 80.3<0.7 95.6<0.7 72.3<0.7 81<0.7 12.2<0.7 9.6<0.7 8.6<0.7 303
320299301271
<0.7 151<0.7 129<0.7 19
Sn V1.5 26.5
1.76 47.72.71 86.10.91 46.4<0.7 17<0.7 14
Sn V<0.7 26.5<0.7 38.40.94 20.6<0.7 27
zn Tocmm95.3 3.4991.7 1.45179 4.3161.8 1.21106 2.2316.6 1.0412.8 2.1210.7 0.85158 5.39
-.-.
78.1 2.6970.4 4.9820.7 2.03
Zn TOC Mm29.8 2.0642.2 2.4243.7 0.9636.1 2.33103 3.8634 4.69
Zn TOC Mm10.5 2.8563.9 4.549.2 2.6817.7 3.2
ONERAHI CHAOS BRECCIA1 ID As B Ba
701 3.03 16.6 78702 4.88 28.7 49.5
MANUKAU BRECCIA1 ID As B Ba
801 1.49 77.8 41802 4.92 184 50.6
Cd0.2<0.1
Cd0.12<0.1
Co10.4<0.2
Co7.42.3
'Results considered anomalous and excluded from
BS^B I11.2 8.610.9 4
DHB94 53.2
13.8 49.5
••£•010.091 18900.099 1580
E9HD10.245 4340.114 1340
mmm23122504'
MM12835315
KOHEH1202 339214 1495
msntmxm117 3543193 1500
I2 B6.62.5
miMM4.965.4
the validated soils data set for statistical purposes. Bold Italic values
• ^^^^^ • ^^^1348 9.13223 13
^mmSEm420 16188 10.8
EH537255
mm767597
Sn V<0.7 14.72.16 37.4
Sn V<0.7 3623.69 506
Zn TOC •36.5 4.6327.2 2.47
Zn TOC Mm143 7.19333 2.91
: considered as lithology specific
ARC Technical Publication No. 153 48
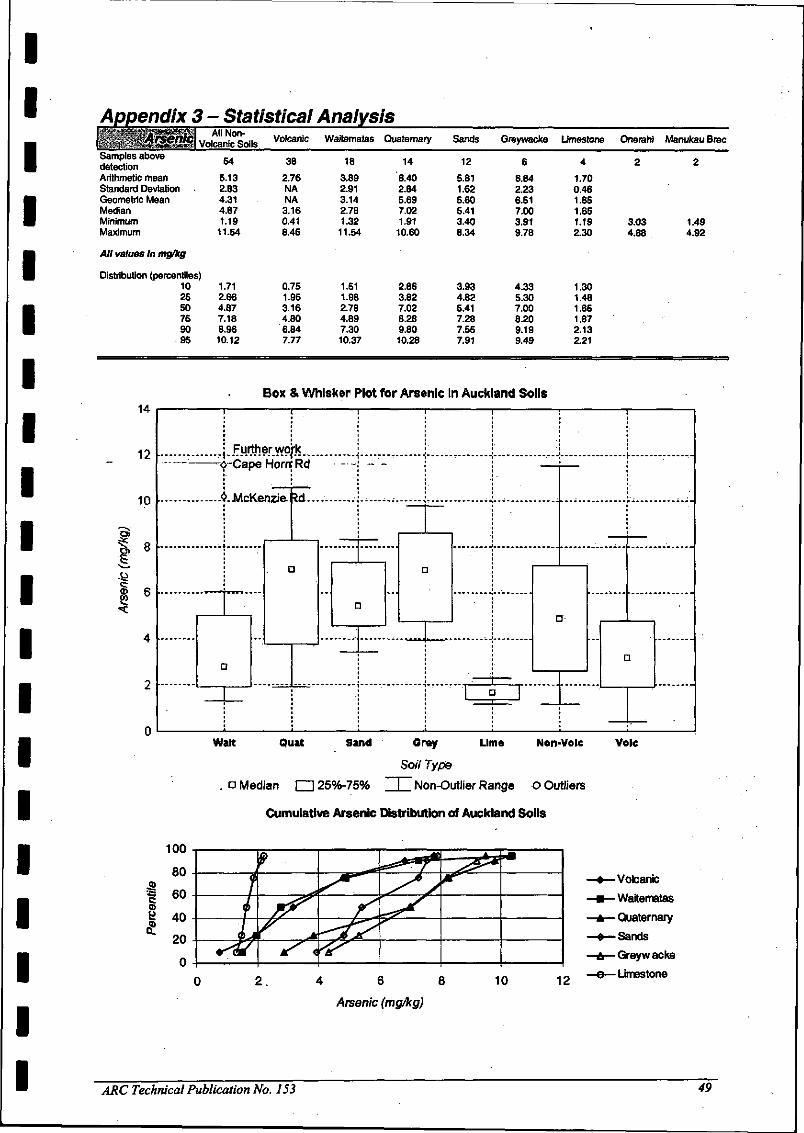
IIIIIIIIIIIIIIIIIIII
Appendix 3 - Statistical Analysis
Samples abovedetectionArithmetic meanStandard DeviationGeometric MeanMedianMinimumMaximum
All Non-Volcanic Soils
54
5.132.834.314.871.1911.54
Volcanic
38
2.76NANA3.160.418.45
Waitematas
18
3.892.913.142.781.3211.54
Quaternary
14
6.402.845.697.021.9110.60
Sands
12
5.811.625.605.413.408.34
Greywacke
6
6.842.236.517.003.919.78
Limestone
4
1.700.461.651.651.192.30
One rah!
2
3.034.88
Manukau Brec
2
1.494.92
All values In mg/kg
Distribution (percentiles)102550759095
1.712.664.877.188.9610.12
0.751.953.164.806.847.77
1.511.982.784.897.3010.37
2.863.827.028.289.8010.28
3.934.825.417.287.557.91
4.335.307.008.209.199.49
1.301.481.651.872.132.21
Box & Whisker Plot for Arsenic In Auckland Soils
14
12
10
.further.wp|k...
o-Cape Horn; Rd
Wait Quat Sand Lime Non-VoleGrey
Soil Type
Non-Outlier Range O Outliers
Vole
. D Median I 125%-75%
Cumulative Arsenic Distribution of Auckland Soils
I
100
80 -
60
4 6 8
Arsenic (mg/kg)
•Volcanic
- Waitematas
- Quaternary
-Sands
-Greywacke
- Limestone
ARC Technical Publication No. 153 49

"-• O»WIUM All Non--' Barium Volcanic SoilsSamples above R1detectionArithmetic mean 90.0Standard Deviation 72.7Geometric Mean 61 .7Median 68Minimum 8.7Maximum 313
All values In mg/kg
Distribution (percentiles)10 1525 3150 6875 14590 19895 212
400
350
300
|> 250
|- 200
1 150
100
50
n
Volcanic Waitematas Quaternary Sands Greywacke Limestone Onerahi ManukauBrec
43 18 11 12 6 4 2 2
154.6 83.5 110.8 73.6 125.9 57.8NA 85.7 70.2 61.3 73.2 45.7150 51.0 89.1 50.1 104.8 44.7157 55.5 98 64.3 131.8 47.134 8.7 28 11 36 17 49.5 41347 313 211 202 212 120 78 50.6
76 14 42 12 50 21114 28 47 26 69 28157 56 98 64 132 47227 92 181 88 180 77298 197 198 164 197 103316 232 205 184 204 111
Box & Whisker Plot for Barium in Auckland Soils
Further work$ McKenzie Road
0I
n
1
1
D
1
: •_!_.
. .T^TTI n
. jD
D
D-. p
— :Walt Quat Sand Grey Lime
Soil Type
Non-Vole Vole
n Median I—125%-75% Non-Outlier Range o Outliers
Cumulative Barium Distribution of Auckland Soils
<D
50 100 150 200
Barium (mg/kg)
250 300 350
- Volcanic
- Waitematas
- Quaternary
- Sands
- Greyw acke
- Limestone
ARC Technical Publication No. 153 50
IIIIIIIIIIIIIIIIIIII

IIIIIIIIIIIIIIIIIIII
§MI|i? prQfj( Volcanl'cSolls Volcanic Waitematas Quaternary Sands Greywacke Limestone Onerahi Manuteu
Samples above _. ...detection M
Arithmetic mean 17.1 45.5Standard Deviation 11.0 NAGeometric Mean 13.0 29.2Median 15.8 60.9Minimum 2 <2Maximum 42.2 255
All values In mg/kg
Distribution (percentiles)10 3.7 3.025 8.5 18.750 15.8 60.975 23.6 16390 33.2 22795 38.0 243
260
240
220
200
180
o> 160
|> 140
1" 120
(§ 100
80
60
40
20
0
18 11 15 6 4 2 2
20.6 18.7 13.1 16.5 12.312.6 9.4 12.1 4.5 6.616.7 16.7 7.6 16.0 11.318.0 17.6 5.2 16.8 9.94.8 8.7 2 10.9 7.5 16.6 77.842.2 35.2 39.3 21.1 22.1 28.7 184
6.9 9.0 - 2.0 12.1 8.29.2 10.9 2.5 13.3 9.218.0 17.6 5.2 16.8 9.930.7 25.3 23.7 20.4 13.038.4 30.6 23.9 20.8 18.541.3 32.9 28.7 20.9 20.3
Box & Whisker Plot for Boron in Auckland Soils
fr— —1 — 1 —Cn •• a
— i — >
Walt Quat
" LT
.
n*
I Y I | £ j u r
D
Sand Grey Lime Non-Vole Vole
D Median I—I 25%-75%
Soil Type
Non-Outlier Range o Outliers
Cumulative Boron Distribution of Auckland Soils
50 100 150
Boron (mg/kg)
200 250
-Volcanic
• Waitematas
- Quaternary
-Sands
-Greywacke
-Limestone
ARC Technical Publication No. 153 51

1\, Cadmium All Non-Volcanic Soils Volcanic Waitematas Quaternary Sands Greywacke Limestone One rah!
ManukauBrec
Samples above .. „detectionArithmetic mean 0.12 0.23Standard Deviation 0.09 NAGeometric Mean 0.09 NAMedian O.OS 0.27Minimum 0.05 0.05Maximum 0.46 0.63
All values In mg/kg
Distribution (percentiles)10 0.05 0.0825 0.05 0.1550 0.05 0.2775 0.17 0.3390 0.23 0.4895 0.29 0.57
0.7
0.6
1
S 0.3"O
80.2
0.1
nn
18 14 12 6
0.10 0.19 0.08 0.100.07 0.13 0.06 0.060.08 0.14 0.07 0.090.05 0.18 0.05 0.0850.05 0.05 0.05 0.050.25 0.46 0.22 0.17
0.05 0.05 0.05 0.050.05 0.05 0.05 0.050.05 6.18 0.05 0.090.15 0.26 0.07 0.160.18 0.33 0.17 0.170.22 0.38 0.20 0.17
Box & Whisker Plot for Cadmium in Auckland
I c
1
•4t
. ....
'
>
'
.
4 2 2
0.100.060.090.0850.05 0.05 0.056.18 0.2 0.12
0.050.050.090.140.160.17
Soils
• i
., — —
-
-
' Further workOrere Poi it
"
\
..., f
L" '
' rL_D I ._
i "" n
i i ii i i
— c
V
it
Wait Quat Sand Grey Lime Non-Vole Vole
So// Type
n Median I 125%-75% I Non-Outlier Range o Outliers A Extremes
Cumulative Cadmium Distribution of Auckland Soils
<D••J3
100
80
60
40
20
0.00 0.10 0.20 0.30 0.40 0.50
Cadmium (mg/kg)
0.60 0.70
- Volcanic
-Waitematas
- Quaternary
-Sands
- Greyw acke
- Limestone
ARC Technical Publication No. 153 52
IIIIIIIIIIIIIIIIIIII
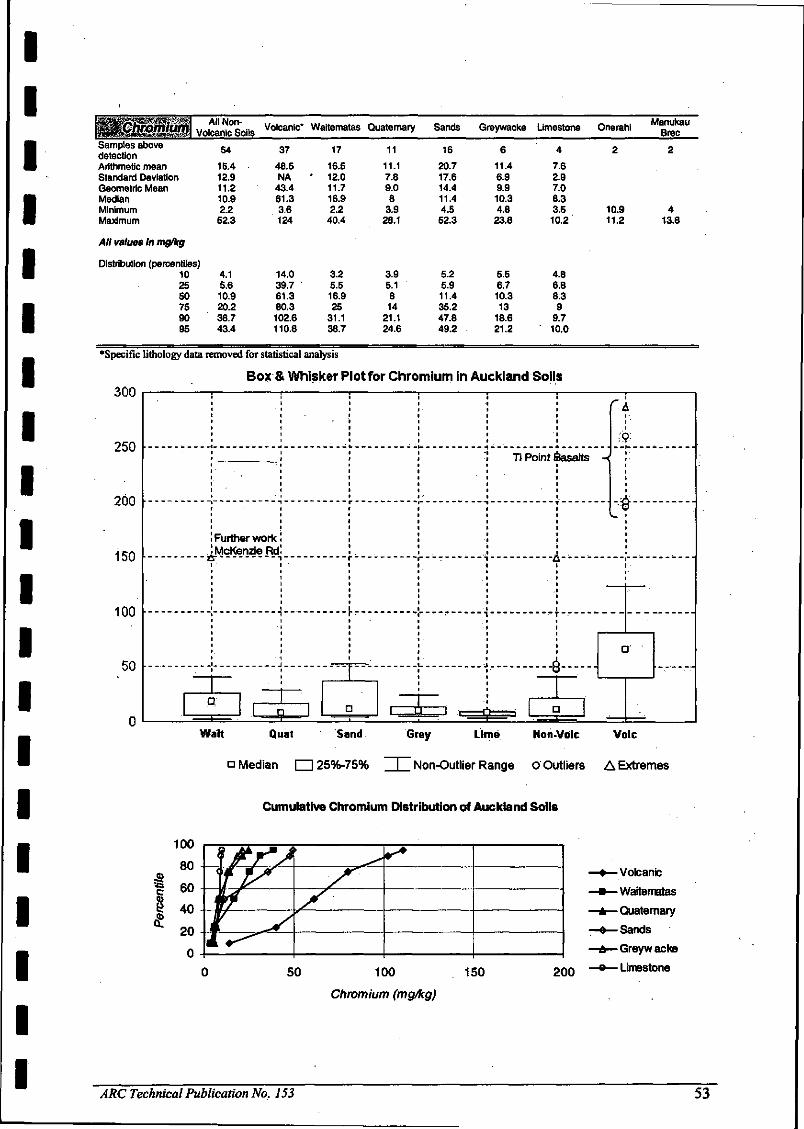
IIIIIIIIIIIIIIIIIIII
Samples abovedetectionArithmetic meanStandard DeviationGeometric MeanMedianMinimumMaximum
All Non-Volcanic Soils
54
15.412.911.210.92.252.3
Volcanic*
37
48.5NA
43.461.33.6124
Waltematas
17
16.5' 12.0
11.716.92.2
40.4
Quaternary
11
11.17.89.08
3.928.1
Sands
16
20.717.614.411.44.552.3
Greywacke
6
11.46.99.910.34.8
23.8
Limestone
4
7.62.97.08.33.510.2
One rani
2
10.911.2
ManukauBrec
2
413.8
All values In mg/kg
Distribution (percentiles)10 4.125 S.650 10.975 20.290 36.795 43.4
14.039.761.380.3102.6110.8
3.25.516.92531.138.7
3.95.181421.124.6
5.25.911.435.247.849.2
5.56.710.31318.621.2
4.86.88.399.710.0
•Specific lithology data removed for statistical analysis
Box & Whisker Plot for Chromium in Auckland Soils300
250
200
150
100
50
•*r
Further workMcKenzie Rd
Ti Point ftasalts -
iA
•a-
Wait Quat Sand Grey Lime Non-Vole Vole
n Median Q25%-75% I Non-Outlier Range o Outliers A Extremes
Cumulative Chromium Distribution of Auckland Soils
100
80<D
•43
50 100
Chromium (mg/kg)
150 200
- Volcanic
- Waitematas
- Quaternary
-Sands
- Greyw acke
- Limestone
ARC Technical Publication No. 153 53

.>*„,' ^Cobalt All Non-Volcanic Soils
Volcanic Waitematas Quaternary Sands Greywacke Limestone Onerahi ManukauBrec
Samples abovedetectionArithmetic meanStandard DeviationGeometric MeanMedianMinimum, Maximum
All values In mgfkg
54
9.49.25.195.40.231.8
47
47.5NA
43.945.710.5166
18
7.868.184.235.30.226.3
11
7.605.925.045.60.517.1
15
14.6110.849.2313.61.3
28.2
6
8.5211.455.344.32.731.8
3.134.181.561.350.59.3
0.210.4
2.37.4
Distribution (percentiles)102550759095
1.12.45.4152429
18.530.245.792126137
0.92.05.39.120.124
1.53.25.6121616
1.54.613.6242930
2.83.24.35
18.525
0.50.61.43.97.18.2
Box & Whisker Plot for Cobalt In Auckland Soils
5
COo6
IOU
1fil"l
•i/in
19D
mn
or-)
fin
40
Ol-lzu
n
c
I c
i
—3 I
1
c
- —
i 1
—
— i
c
1
]
L
" r
r
i
t==i r1^!
i 1
c!
c]
c]
Walt Quat Sand Grey Lime Non-Vole Vole
Soil Type
n Median 25%-75% Non-Outlier Range o Outliers A Extremes
Cumulative Cobalt Distribution of Auckland Soils
100
50 100
Cobalt (mg/kg)
150
-Volcanic
- Waitematas
- Quaternary
-Sands
- Greyw acke
- Limestone
ARC Technical Publication No. 153 54
IIIIIIIIIIIIIIIIIIII

IIIIIIIIIIIIIIIIIIII
fgl-£i>plSamples abovedetectionArithmetic meanStandard DeviationGeometric MeanMedianMinimumMaximum
All values In mgfkg
All Non-Volcanic Soils
58
13.110.19.39.81.1
44.8
Volcanic
42
44.5NA
43.548.520.688.6
1
Waitematas
22
11.79.08.98.42.235.3
Quaternary
11
15.58.0013.515.24.827.4
Sands
15
12.110.47.58.61.1
33.1
Greywacke
6
21.214.517.219.37.344.8
Limestone Onerahl
4 2
6.37.43.63.31.3 417.1 8.6
ManukauBrec
2
49.553.2
Distribution (percentiles)102550759095
2.65.09.8
20.427.229.6
24.933.948.557.28182
4.04.98.416.121.828.6
7.68.315.222.125.726.6
1.53.38.618.727.028.9
7.99.519.327.636.540.7
1.41.53.38.113.515.3
Box & Whisker Plot for Copper In Auckland Soils
pi
CD
!
Q>'43
100
80
60
Walt Quat Sand Grey Lime Non-Vole Vole
So// Type
n Median O25%-75% I Non-Outlier Range o Outliers A Extremes
Cumulative Copper Distribution of Auckland Soils
- Volcanic
-Waitematas
- Quaternary
-Sands
-Greywacke
- Limestone20 40 60
Copper (mg/kg)
80 100
ARC Technical Publication No. 153 55
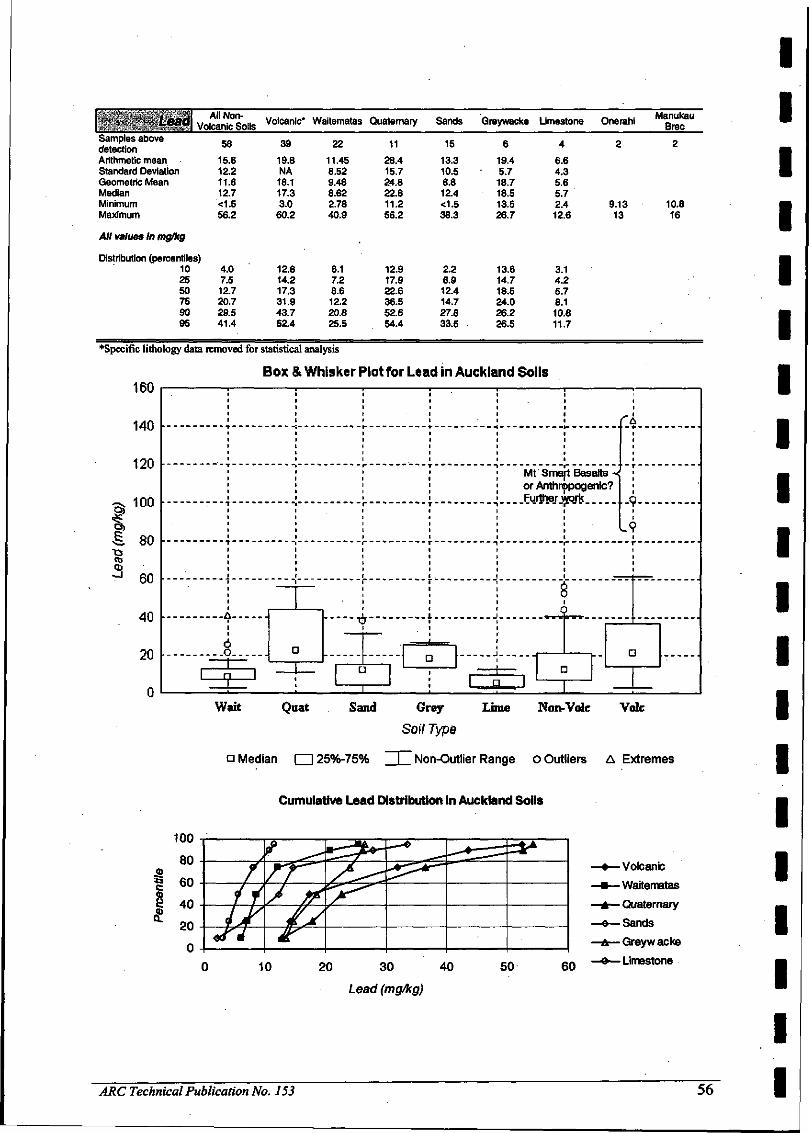
• / -: , •' Lead All Non-Volcanic Soils Volcanic* Waitematas Quaternary Sands Greywacke Limestone Onerahi Manukau
BrecSamples abovedetectionArithmetic meanStandard DeviationGeometric MeanMedianMinimumMaximum
All values In mg/kg
Distribution (percentiles)
58
15.612.211.612.7<1.556.2
39
19.8NA18.117.33.060.2
22
11.458.529.488.622.7840.9
1128.415.724.822.611.256.2
15
13.310.58.812.4<1.538.3
6
19.45.718.718.513.526.7
6.64.35.65.72.412.6
9.1313
10.816
102550759095
4.07.512.720.729.541.4
12.814.217.331.943.752.4
6.17.28.612.220.825.5
12.917.922.636.552.654.4
2.26.912.414.727.833.5
13.614.718.524.026.226.5
3.14.25.78.110.811.7
•Specific lithology data removed for statistical analysis
Box & Whisker Plot for Lead in Auckland Soils
IUU
140
120
r°-§, 80
aj^ 60
40
20
n
i
>
\iI rji I
o
11
\iXT
O--] D [
: I c
Mt'Smaor AnthnFurther v
_
t Basalts -ipogenic?vork f
^C
i
,— n1 1 |
•- C
i
3
!
]
20
Wait Quat Sand Grey Lime Non-Vole Vole
Soil Type
o Median I 125%-75% I Non-Outlier Range o Outliers A Extremes
Cumulative Lead Distribution in Auckland Soils
- Volcanic
• Waitematas
- Quaternary
-Sands
• Greyw acke
-Limestone10 20 30 40
Lead (mg/kg)
50 60
ARC Technical Publication No. 153 56
IIIIIIIIIIIIIIIIIIII

IIIIIIIIIIIIIIIIIIII
' f/Maj ium All Non-Volcanic Soils
Volcanic Waitematas Quaternary Sands Greywacke Limestone One rani ManukauBrec
Samples abovedetectionArithmetic meanStandard DeviationGeometric MeanMedianMinimumMaximum
All values In mg/kg
Distribution (percentiles)
51 34 18 11 12
190517681457141747410261
7024NA6206858519476564
260127001683126847410261
1507904
1302.3611726453529
1640796144416375833107
1300594118511775902109
1572690145814958142487
23122504
12835315
102550759095
6458451417233435294477
104633538585225133407045693
6378051268347558467968
6568671172195024112970
6529661637223723232676
7179251177172320062058
100512911495177622032345
Box & Whisker Plot for Magnesium in Auckland Soilsouuuu
70000
60000
oJ•§, 50000£
1 40000'55<D
| 30000§
20000
10000
0
fI,
-
•
I n I r-==l1
•
•
.
'
'
:
A
Walt Quat Sand Grey Lime Non-Vole
0
Vole
a Median 25%-75%
Soil Type
Non-Outlier Range o Outliers A Extremes
Cumulative Magnesium Distribution of Auckland Soils
10000 20000 30000
Magnesium (mg/kg)
40000 50000
-Volcanic
-Waitematas
- Quaternary
-Sands
-Greywacke
• Limestone
ARC Technical Publication No. 153 57

Volcanic Waitematas Quaternary Sands* Greywacke Limestone Onerahi
Samples abovedetectionArithmetic meanStandard DeviationGeometric MeanMedianMinimumMaximum
All values In mg/kg
Distribution (percentiles)
50
364460190308131704
34
1075NA105610763622484
32534915923313
1121
11
364395210284391391
11
384479201376451704
6
5835144173951421460
157206866828464
141202
117193
102550759095
39603084609281270
5357871075150120102214
3257233382903989
39902844596121002
49603764465441124
16121939580611921326
354568180350407
*Specific lithology data removed for statistical analysis
Box & Whisker Plot for Manganese in Auckland Soils
ouuu
8000
7000
6000
5000
4000
3000
2000
1000
0I t
• •
a i
i , _
i$o
i
4
A
>'
L-A
'
. Puillier.wi^ Okahukua
1
---if-- -
1 a I
-
.
-.
rkPeninsular
; .b
t
•
1
•
:j_
^
4AL.
^Avvhitu
...I... . .T^D 1
-•
rSands
L
rc]:• : , . - -_.
_J ;
Wait Qiiat Sand Grey Lime Non-Vole Vole
Soit.Type
Median d]25%-75% I Non-Outlier Range o Outliers A Extremes
Cumulative Manganese Distribution in Auckland Soils
- Volcanic
- Waitematas
- Quaternary
-Sands
- Greyw acke
- Limestone
500 1000 1500
Manganese (mg/kg)
2000 2500
ARC Technical Publication No. 153 58
IIIIIIIIIIIIIIIIIIII

IIIIIIIIIIIIIIIIIIII
^ / /Mercury All Non-Volcanic Soils
Volcanic Waitematas Quaternary Sands Greywacke Limestone Onerahi ManukauBrec
Samples abovedetectionArithmetic meanStandard DeviationGeometric MeanMedianMinimumMaximum
55
0.130.100.100.107<0.030.421
41
0.13NANA
0.143<0.030.401
22
0.110.060.090.0910.0350.313
11
0.240.110.210.2470.1060.421
12
0.130.120.070.122<0.030.319
6
0.080.040.070.093<0.030.12
4
0.08<0.030.080.080.0630.097
2
0.0910.099
2
0.1140.245
All values in mg/kg
Distribution (percentiles)"102550759095
0.0400.0650.1070.1750.3070.321
0.0600.0900.1430.2020.2710.351
0.0500.0620.0910.1360.1770.195
0.1070.1380.2470.3180.3370.379
0.0130.0130.1220.2140.2920.306
0.0370.0660.0930.1140.1190.119
0.0660.0710.0800.0890.0940.095
"where values are less than the analytical detection limit of 0.03 mg/kg, a value of half that was used (0.015 mg/kg) for statistical purposes
Box & Whisker Plot for Mercury in Auckland Soils\J**\J
. • •
O oc
l«~5 0 20Q)
iO 'tC
0 -1 r>. ID
.05
n nn
0
, . _ _ „ i _
D
ii!
c3
j
D
1.
1 o |
s
ri
cj
Walt Quat Sand Grey Lime Non-Vole Vole
Soil Type
Median [Z]25%-75% I Non-Outlier Range o Outliers
Cumulative Mercury Distribution of Auckland Soils
100
o>
40
20
0.0 0.1 0.2
Mercury (mg/kg)
0.3 0.4
- Volcanic- Waitematas
- Quaternary
-Sands
•Greywacke
- Limestone
ARC Technical Publication No. 153 59

~< *'< - Nickel w i?H °2L-u Volcanic Waitematas Quaternary Sands Greywacke Limestone Onerahi ^T"^8"*. " > , volcanic oous orec
SoSnabOV6 51 38 18 11 12 6 4 2 2Arithmetic mean 9.4 87.3 11.1 11.5 7.4 8.3 3.7Standard Deviation 7.9 NA 9.6 7.6 4.8 9.2 3.2Geometric Mean 6.5 73.9 7.2 9.1 5.9 5.6 2.7Median 7.1 118 9.2 10.7 8 4.3 2.7Minimum 0.9 4.6 0.9 2.7 1.9 2.7 0.9 2.5 4.96Maximum 34.1 v 320 34.1 23.3 18.1 26.3 8.3 6.6 5.4
All values In mg/kg
Distribution (percentiles)10 2.1 16.4 2.1 2.8 2.0 2.9 1.325 3.0 47.7 3.3 5.7 3.1 3.0 1.850 7.1 118 9.2 10.7 8.0 4.3 2.775 11.9 219 15.5 16.4 9.5 8.1 4.690 23.2 252 24.0 23.2 11.5 17.6 6.895 24.6 315 27.0 23.3 14.6 22.0 7.5
350
300
250
"SiH 200
1 150ig
100
50
0
Box & Whisker Plot for Nickel In Auckland Soils
i
1 n 1 1 E_
.•
3 1 r-H?
<;
_
;>hi 1 -*
ii
i
•
•
n•
i
8—f-
Walt Quat Sand Grey Lime Non-Vole
Sort Type
n Median [Z]25%-75% I Non-Outlier Range o Outliers
Cumulative Nickel Distribution in Auckland Soils
Vole
~~ \$f
fin III/
n c
^^
^
n M
^^
"\r\ M
-"^
=n 01
^^^
•\n r>t
» •
:r> 11
— *
tn 11
• Volcanic
— • — Waitematas
A Quaternary
0 Sands
—A— Greywacke
-n — e — Limestone
Nickel (mg/kg)
ARC Technical Publication No. 153 60
IIIIIIIIIIIIIIIIIIII
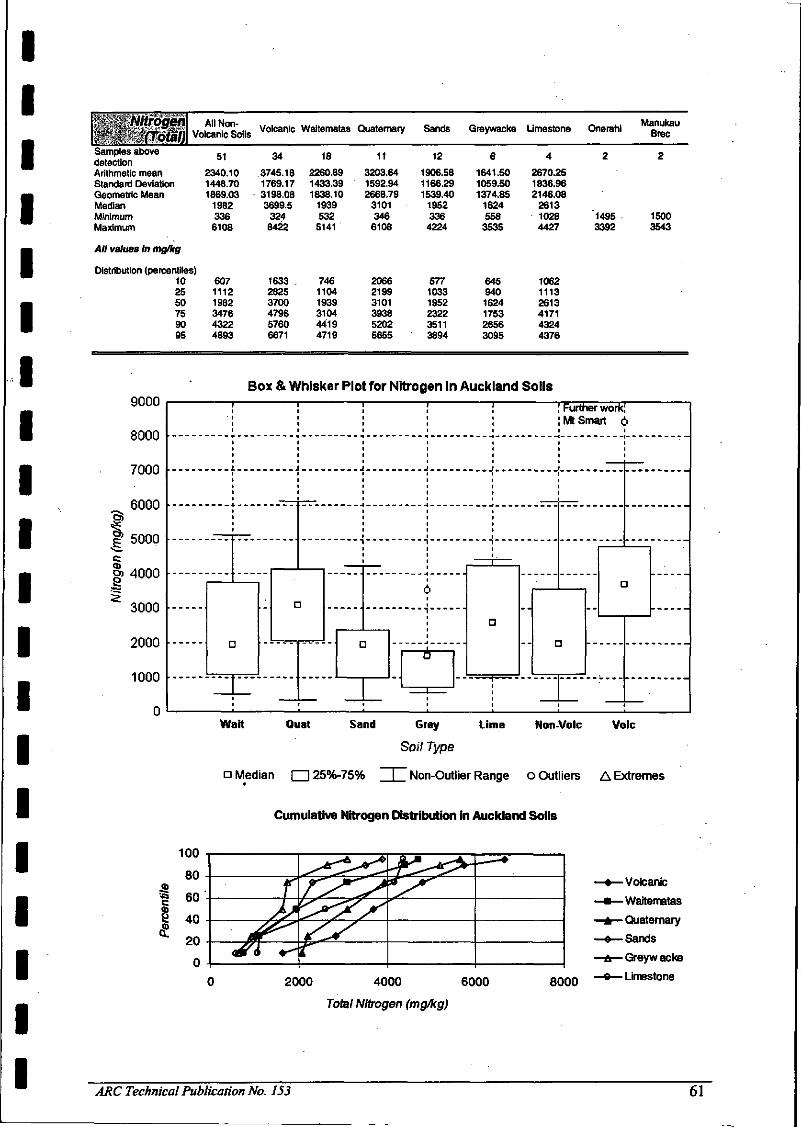
IIIIIIIIIIIIIIIIIIII
^ -Nitrogen
Samples abovedetectionArithmetic meanStandard DeviationGeometric MeanMedianMinimumMaximum
All Non-Volcanic Soils
51
2340.101448.701869.03
19823366108
Volcanic
34
3745.181769.173198.083699.5
3248422
Waitematas
18
2260.891433.391838.10
19395325141
Quaternary
11
3203.641592.942668.79
31013466108
Sands
12
1906.581166.291539.40
1952336
4224
Greywacke
6
1641.501059.501374.85
1624558
3535
Limestone
4
2670.251836.962146.08
261310284427
One rani
2
14953392
ManukauBrec
2
15003543
All values In mgfkg
Distribution (percentiles)102550759095
60711121982347643224893
163328253700479657606671
74611041939310444194719
206621993101393852025655
57710331952232235113894
6459401624175326563095
106211132613417143244376
9000
8000
7000
6000
5000
4000
3000
2000
1000
Box & Whisker Plot for Nitrogen In Auckland Soils
Further workjMt Smart
Wait Quat
100
Sand Grey Lime Non-Vole Vole
Soil Type
n Median O25%-75% I Non-Outlier Range o Outliers A Extremes
Cumulative Nitrogen Distribution in Auckland Soils
- Volcanic
-Waitematas
- Quaternary
-Sands
- Greyw acke
- Limestone2000 4000 6000
Total Nitrogen (mg/kg)
8000
ARC Technical Publication No. 153 61
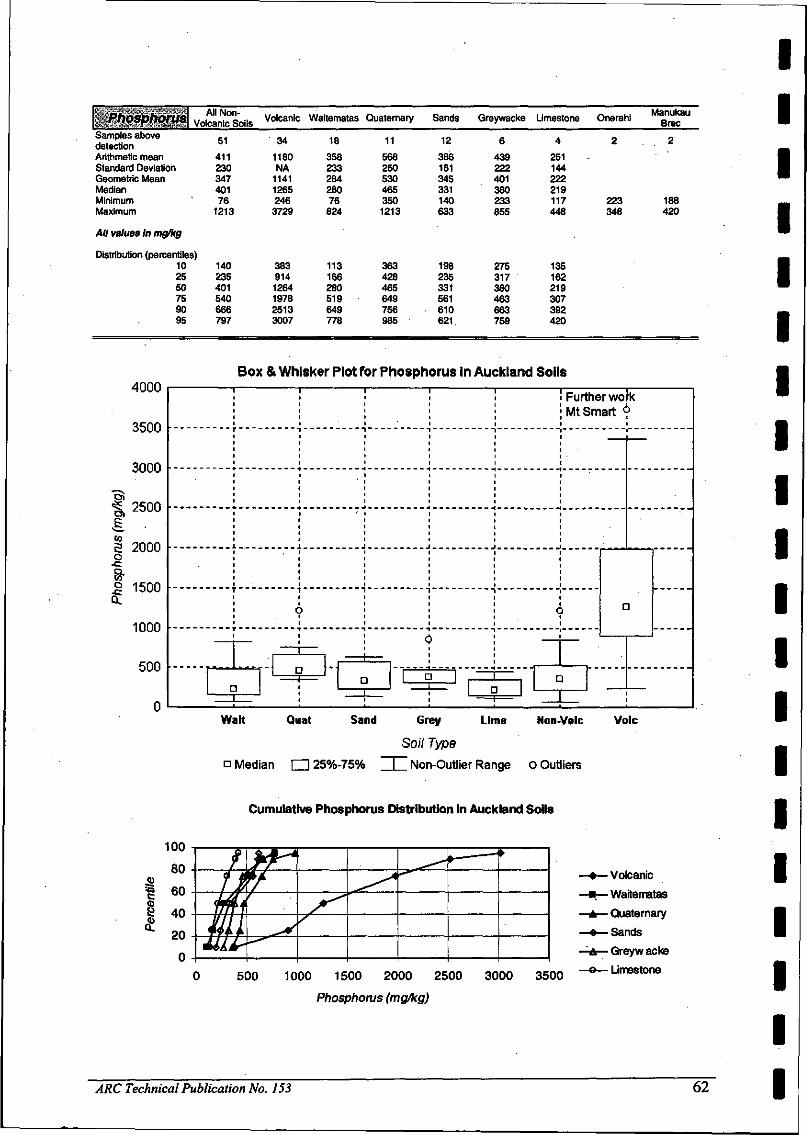
, PhosphorusAll Non-
Volcanic SoilsVolcanic Waitematas Quaternary Sands Greywacke Limestone Onerahi
ManukauBrec
Samples abovedetectionArithmetic meanStandard DeviationGeometric MeanMedianMinimumMaximum
All values In mg/kg
Distribution (percentiles)102550759095
51 34 18 11 12 6 4 2 . 2
411 1180 358 568 386 439 251230 NA 233 250 181 222 144347 1141 284 530 345 401 222401 1265 280 465 331 380 21976 246 76 350 140 233 117 223 188
1213 3729 824 1213 633 855 448 348 420
140 383 113 363 198 275 135235 914 166 428 235 317 162401 1264 280 465 331 380 219540 1978 519 649 561 463 307666 2513 649 756 610 663 392797 3007 778 985 621. 759 420
Box & Whisker Plot for Phosphorus In Auckland Soils.innn
•annn
"3•12500
to
o-c8-° 1500
CL
innn
500
n
c
|
5
— i —
D 'L_ " 1
'
— i1 —
D
— ! —1 c
c
Further workMt Smart *
•
.
i
l_ i ~ ' i o° — 1 — !
Wait Quat Sand Grey Lime Non-Vole Vole
Soil Type
n Median I 125%-75% I Non-Outlier Range o Outliers
Cumulative Phosphorus Distribution in Auckland Soils
500 1000 1500 2000 2500 3000 3500
Phosphorus (mg/kg)
- Volcanic
- Waitematas
- Quaternary
-Sands
- Greyw acke
- Limestone
ARC Technical Publication No. 153 62
IIIIIIIIIIIIIIIIIIII
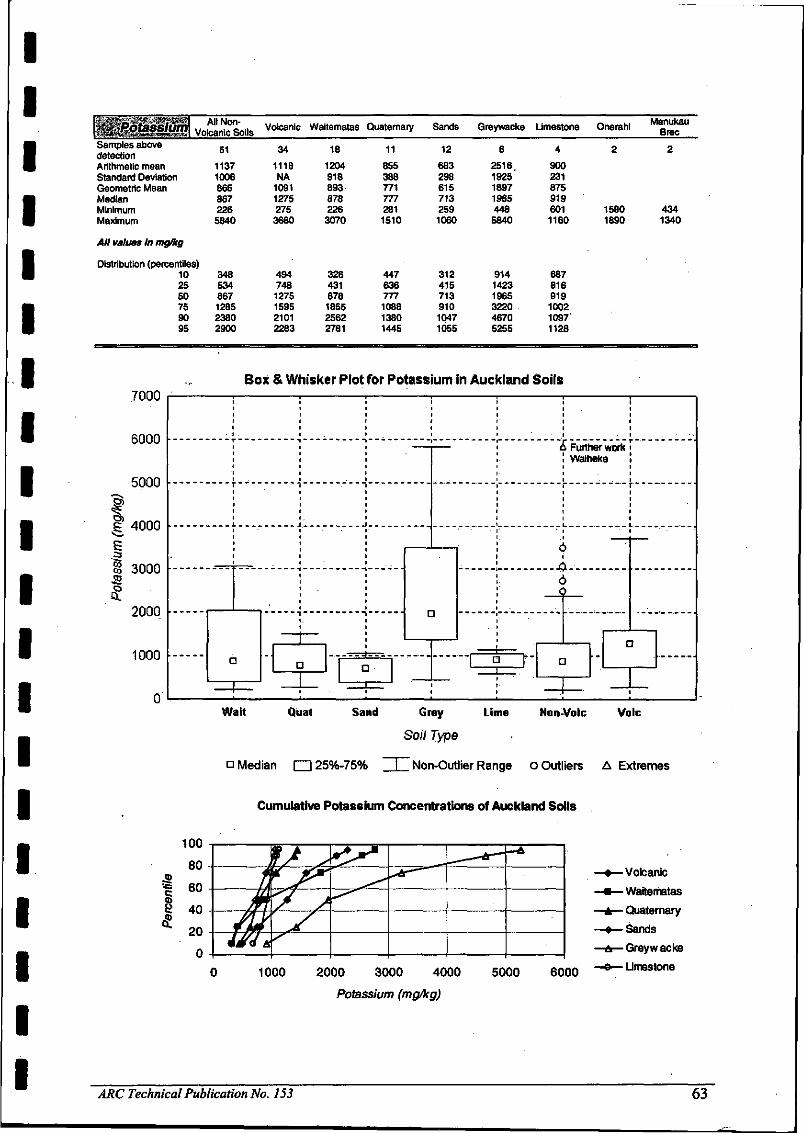
IIIIIIIIIIIIIIIIIIII
All Non-Volcanic Soils Volcanic Waitematas Quaternary Sands Greywacke Limestone One rani Manukau
BrecSamples abovedetectionArithmetic meanStandard DeviationGeometric MeanMedianMinimumMaximum
All values In mg/kg
51
113710068658672265840
34
1118NA109112752753660
18
12049188938782263070
11
8553887717772811510
12
6832986157132591060
6
25161925189719654485840
9002318759196011160
15801890
4341340
Distribution (percentiles)102550759095
348534867128523802900
4947481275159521012283
326431878185525622781
447636777108813801445
31241571391010471055
91414231965322046705255
687816919100210971128
Box & Whisker Plot for Potassium in Auckland Soils(UUU
6000
5000
i 4000
I% 30003§.
2000
1000
n
D
1
- •— ir—
D
,,,.— -j
D
1
•
D
i
i
i
—"i D r-
i
cf
.L Further work
VWalheke.
>•i60
D
— -1
•-
r
.'
D
i
Wait Quat
100
Sand Grey Lime Non-Vole Vole
Soil Type
D Median d]25%-75% I Non-Outlier Range o Outliers A Extremes
Cumulative Potassium Concentrations of Auckland Soils
- Volcanic
- Waitematas
- Quaternary
-Sands
- Greyw acke
- Limestone1000 2000 3000 4000
Potassium (mg/kg)
5000 6000
ARC Technical Publication No. 153 63

Sti/#u*fSamples abovedetectionArithmetic meanStandard DeviationGeometric MeanMedianMinimumMaximum
All Non-
50
565.74331.81467.72
50085
1532
Volcanic
34
740NA -7317583132288
Waitematas
17
621.88401.11490.90
5861031532
Quaternary
11
749.27301.64699.40
5854261202
Sands
12
424.00281.51333.10384.5
851009
Greywacke
6
353.8375.98345.92359.5219448
Limestone
4
565.50158.71548.06
566375755
Onerahi
2
255537-
ManukauBrec
2
597767
All values In trig/kg
Distribution (percentiles]10 18025 34650 50075 753.2590 1072.195 1185.15
43765475884810331545
175.23225869021096.41222.4
475545.558599011911196.5
110.7192.75384.5563.25770.1886.9
282346359.5386.5420434
420487.5ceoODD644710.6732.8
Box & Whisker Plot for Sulphur In Auckland Soils
2200
-•c
800
400
Further work A•Buhimif Crater- -
Wait Quat Sand Grey Lime Non-Vole Vole
Soil Type
n Median Q25%-75% 1 Non-Outlier Range o Outliers A Extremes
Cumulative Sulphur Distribution in Auckland Soils
100
80i
I
20
- Waitematas
- Quaternary
- Sands
- Greyw acke
500 1000
Sulphur (mgfltg)
1500 2000
IIIIIIIIIIIIIIII
ARC Technical Publication No. 153 64
II
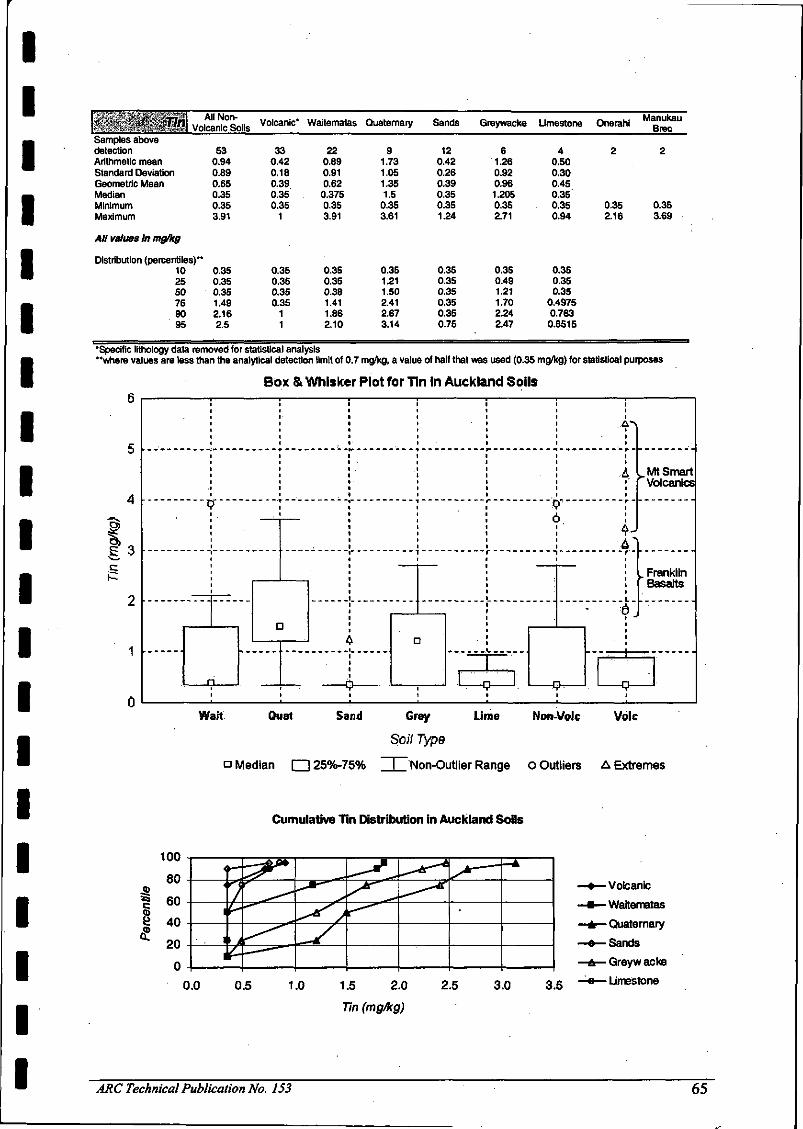
IIIIIIIIIIIIIIIIIIII
•^"m^TftSamples abovedetectionArithmetic meanStandard DeviationGeometric MeanMedianMinimumMaximum
All Non-Volcanic Soils
530.940.890.650.350.353.91
Volcanic*
330.420.180.390.350.35
1
Waitematas
220.890.910.620.3750.353.91
Quaternary
91.731.051.351.5
0.353.61
Sands
120.420.260.390.350.351.24
Greywacke
61.260.920.961.2050.352.71
Limestone
40.500.300.450.350.350.94
One rah!
2
0.352.16
ManukauBrec
2
0.353.69
All values In mg/kg
Distribution (percentiles)"102550759095
0.350.350.351.492.162.5
0.350.350.350.3511
0.350.350.381.411.862.10
0.351.211.502.412.673.14
0.350.350.350.350.350.75
0.350.491.211.702.242.47
0.350.350.350.49750.7630.8515
'Specific lithology data removed for statistical analysis"where values are less than the analytical detection limit of 0.7 mg/kg, a value of half that was used (0.35 mg/kg) for statistical purposes
Box & Whisker Plot for Tin In Auckland SoilsD
4
I,•5..g
•i
n
t,
c
f
3
C]
/
.
r•h
.
\
• .,..i....1
1 r?
V
r
fi,
3
i•
,L
{i
i
.
r
,->
,
\ j
"'
.Mt SmartVolcanics
K FranklinBasalts
100
0.0
Wait Quat Sand Grey Lime Non-Vole Vole
So// Type
n Median I 125%-75% I Non-Outlier Range o Outliers A Extremes
Cumulative Tin Distribution in Auckland Soils
- Volcanic
-Waitematas
- Quaternary
•Sands
- Greyw acke
- Limestone0.5 1.0 1.5 2.0
Tin (mg/kg)
2.5 3.0 3.5
ARC Technical Publication No. 153 65
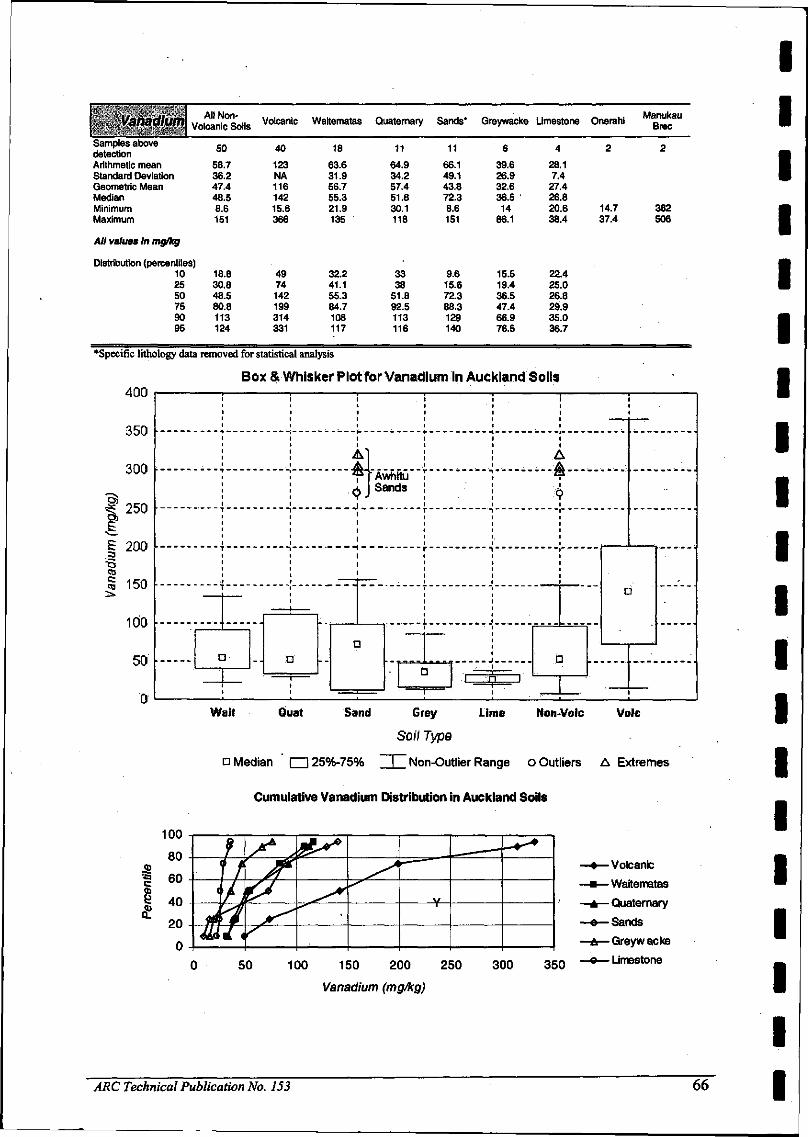
' „ Vanadium.' j"Samples abovedetectionArithmetic meanStandard DeviationGeometric MeanMedianMinimumMaximum
All Non-Volcanic Soils
50
58.736.247.448.58.6151
Volcanic
40
123NA11614215.6366
Waitematas
18
63.631.956.755.321.9135
Quaternary
11
64.934.257.451.830.1118
Sands*
11
66.149.143.872.38.6151
Greywacke
6
39.626.932.636.514
86.1
Limestone
4
28.17.4
27.426.820.638.4
Onerahi
2
14.737.4
ManukauBrec
2
362506
All values In mg/kg
Distribution (percentiles)102550759095
18.830.848.580.8113124
4974142199314331
32.241.155.384.7108117
333851.892.5113116
9.615.672.388.3129140
15.519.436.547.466.976.5
22.425.026.829.935.036.7
•Specific lithology data removed for statistical analysis
Box & Whisker Plot for Vanadium in Auckland Soils'HJtuI
350
300
H 25°.§
E 200'•6«t>| 150
100
50
n
D
i
--
-i—
G
;
--
Axal
.
Mjsa rAwhFtu
Sands
n
•'
L .- J
•u i^l"""" ;
J. i n i
A£.
A
?r-
.
' D
-
D
Wait Quat Sand Grey Lime Non-Vole Vole
Soil Type
n Median I 125%-75% I Non-Outlier Range o Outliers A Extremes
Cumulative Vanadium Distribution in Auckland Soils
•Volcanic
- Waitematas
- Quaternary
-Sands
- Greyw acke
- Limestone100 150 200 250
Vanadium (mg/kg)
300 350
ARC Technical Publication No. 153 66
IIIIIIIIIIIIIIIIIIII

IIIIIIIIIIIIIIIIIIII
.-Svii-Mf f'tSm^WMlzimfi-^ri-f > *'4(KivjL-.\ Jt'f'j? '&&'''; v 'V-.i'"'1-'' - f-s ..'.-iv Vj't
.. ,AI' ^°o~ ,, Volcanic Waitematas Quaternary Sands Greywacke Limestone Onerahl Ma£^ u
VOICantC OO1IS DrBC
Samples abovedetectionArithmetic meanStandard DeviationGeometric MeanMedianMinimumMaximum
All values In mg/kg
Distribution (percentiles)102550759095
1200
1000
800
1H 600
N400
200
0
51
58.739.145.352.19.2179
12.828.252.186.2106117
3 8 1 8 1 1 1 2 6 4 2 2
252 54.3 66.1 75.1 48.1 25.3NA 33.1 30.0 55.5 27.4 26.0233 43.7 58.7 52.3 43.7 18.2247 45.8 63.9 74.3 39.2 14.154.5 9.6 21 10.7 29.8 9.2 27.2 1431160 123 111 179 103 63.9 36.5 333
80 14.9 28.2 13.2 31.9 9.6110 29.1 44.5 19.7 34.5 10.2246 45.8 63.9 74.3 39.2 14.1654 71.1 91.3 98.0 43.3 29.3840 100.6 96.6 152.8 73.4 50.0931 108.6 103.8 167.5 88.2 57.0
Box & Whisker Plot for Zinc in Auckland Soilsn
L
6
p1
A
I _ I /
D I ° =£>•* I r
i
D_ p
i — I o | — I —-i ' 1 ' •
Walt Quat Sand Gray Lime Non-Vole Vole
Soil Type
D Median d]25%-75% I Non-Outlier Range O Outliers A Extremes
Cumulative Zinc Distribution in Auckland Soils
<bfi
100
80
60
40
20
200 400 600
Zinc (mg/kg)
800 1000
- Volcanic
-Waitematas
- Quaternary
-Sands
- Greyw acke
- Limestone
ARC Technical Publication No. 153 67
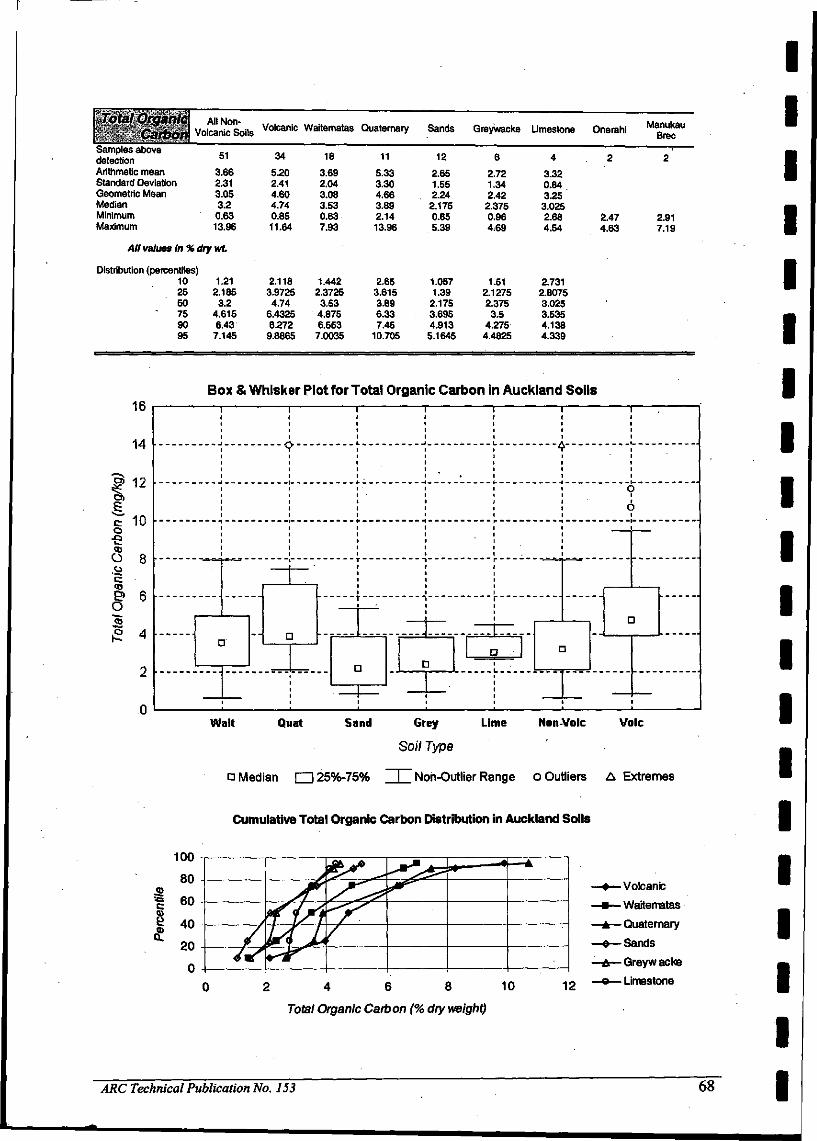
Total Organic/' : Carbon
All Non-Volcanic Soils Volcanic Waitematas Quaternary Sands Greywacke Limestone One rani Manukau
Brec
Samples abovedetection bn
Arithmetic mean 3.66Standard Deviation 2.31Geometric Mean 3.05Median 3.2Minimum 0.63Maximum 13.96
34
5.202.414.604.740.85
1 8 1 1 1 2 6 4 2 2
3.69 5.33 2.65 2.72 3.322.04 3.30 1.55 1.34 0.843.08 4.66 2.24 2.42 3.253.53 3.89 2.175 2.375 3.0250.63 2.14 0.85 0.96 2.68 2.47 2.91
11.64 7.93 13.96 5.39 4.69 4.54 4.63 7.19
All values in%drywt.
Distribution (percentiles)10 1 2125 2.18550 3.275 4.61590 6.4395 7.145
2.118 1.442 2.65 1.057 1.51 2.7313.9725 2.3725 3.615 1.39 2.1275 2.80754.74 3.53 3.89 2.175 2.375 3.025
6.43258.272
4.875 6.33 3.695 3.5 3.5356.553 7.45 4.913 4.275 4.138
9.8865 7.0035 10.705 5.1645 4.4825 4.339
Box & Whisker Plot for Total Organic Carbon in Auckland Soils
14
"oj 4*)_>^ i f-
^ 100-s8 8.0
g> 6^
"3 <4\~. t
n
J ' Y" ' '
C
~^
o
1
••
r ~
_T±- -
o1
61
. •"•
r — n
G D
n n ! .
i i 1 1
Walt Quat Sand Grey Lime Non-Vole Vole
Soil Type
n Median Q25%-75% I Non-Outlier Range o Outliers A Extremes
Cumulative Total Organic Carbon Distribution in Auckland Soils
on
AH
40 -
on
t
y/is1 «
y
ftfUl*Jr5 ,
»&r „
^^
/
<\ 1
-~^
^
: <
•*r ""
3 1n -i
• Volcanic
—•—Waitematas
—A — Quaternary
0 Sands
—A — Grey w ac ke
n — e — Limestone
Total Organic Carbon (% dry weight)
ARC Technical Publication No. 153 68
IIIIIIIIIIIIIIIIIIII