Backcalculation and sensitivity of NDT to temperature...
8
Backcalculation and sensitivity of NDT to temperature variations in flexible pavements Dieter Stolle & Anastasia Nezhentseva McMaster University, Hamilton, Ontario, Canada Gabriel Sedran In-Depth Geotechnical Inc., Hamilton, Ontario, Canada ABSTRACT The Light Weight Deflectometer is a smaller version of the Falling Weight Deflectometer, which is used to evaluate pavement-subgrade systems. Given the limited information obtained from the LWD, difficulties with back-calculation of properties exist. It is shown that elastostatic back-calculation provides a stiffness, which combined with the dynamic impedance of the Mindlin plate model allows one to estimate an effective subgrade modulus and elastic modulus of pavement or an equivalent asphalt thickness. Based on in-situ and simulated data, the sensitivity of the LWD test to variable properties and temperature is addressed. RÉSUMÉ Le Déflectomètre à Masse Léger (DML) est une version réduite de Déflectomètre à Masse Tombante utilisée pour évaluer le système de l’infrastructure des chaussées. Étant donné que les informations obtenues à partir du DML sont limitées, le retro-calcul des propriétés existe. Il est montré que le retro-calcul élastostatique donne une rigidité, qui combinée avec l’impédance dynamique obtenue à partir du modèle de la plaque de Mindlin, permet l’estimation du module effective de l’infrastructure, le module élastique des chaussées ou une épaisseur équivalente de l’enrobée. Sur la base des données in-situ et simulées, la sensibilité du test de LD vis-à-vis les variations des propriétés et de la température est examinée. 1 INTRODUCTION Non-destructive test (NDT) techniques are important for estimating the integrity of pavement structures, as well as for determining the in-situ layer characteristics of pavement-subgrade systems. Given that mechanical properties of the pavement-subgrade layers are not uniform and depend on such factors as moisture content, temperature within pavement structure, and state of stress, one must accept that the back-calculated characteristics are system parameters that merely reflect the state of the system and may not correspond to actual properties. An important goal of research in the interpretation of NDT data has been to develop techniques that allow the engineer to estimate system parameters that more closely represent the values of the actual system characteristics such as elastic modulus. The Falling Weight Deflectometer (FWD) has been popular for evaluating pavement-subgrade integrity. In the recent past, the Light Weight Deflectometer (LWD) has received increasing attention for the quality control of pavements. Both devices are based on measuring the response of a pavement to an impact load, which basically occurs by dropping a weight onto a plate. On the other hand, “state-of-the-practice” algorithms are mostly based on elastostatic models that do not reflect real dynamic response of a pavement to impact loading. An additional, important restriction is that the interpretation of test data is more reliable for new pavements than for pavements that contain flaws such as cracks, ruts and potholes. Not accurately taking into account flaws leads to systematic errors in interpretation of data. On a positive note, since highway engineers are primarily interested in keeping track of the deterioration of strength and stiffness of pavement-subgrade systems an exact determination of system properties is not always necessary. The objectives of this paper are to develop an approach that maximizes the information that one can extract from a LWD test and to compare its ability to capture in-situ properties relative to that of the FWD test. An important consideration is the influence of temperature on back-calculated parameters. 2 THEORETICAL BACKGROUND The LWD is a scaled-down version of the falling weight deflectometer. It has a smaller load range and shorter load duration when compared to the FWD. In principle, for perfect elastic systems, one should be able to back- calculate similar system parameters from data generated by each device. On the other hand, since the FWD excites a larger volume of the pavement-subgrade system, in practice predictions by the two devices may be very different owing to the heterogeneity and pressure 111
Transcript of Backcalculation and sensitivity of NDT to temperature...

Backcalculation and sensitivity of NDT to
temperature variations in flexible pavements Dieter Stolle & Anastasia Nezhentseva McMaster University, Hamilton, Ontario, Canada Gabriel Sedran In-Depth Geotechnical Inc., Hamilton, Ontario, Canada ABSTRACT The Light Weight Deflectometer is a smaller version of the Falling Weight Deflectometer, which is used to evaluate pavement-subgrade systems. Given the limited information obtained from the LWD, difficulties with back-calculation of properties exist. It is shown that elastostatic back-calculation provides a stiffness, which combined with the dynamic impedance of the Mindlin plate model allows one to estimate an effective subgrade modulus and elastic modulus of pavement or an equivalent asphalt thickness. Based on in-situ and simulated data, the sensitivity of the LWD test to variable properties and temperature is addressed. RÉSUMÉ Le Déflectomètre à Masse Léger (DML) est une version réduite de Déflectomètre à Masse Tombante utilisée pour évaluer le système de l’infrastructure des chaussées. Étant donné que les informations obtenues à partir du DML sont limitées, le retro-calcul des propriétés existe. Il est montré que le retro-calcul élastostatique donne une rigidité, qui combinée avec l’impédance dynamique obtenue à partir du modèle de la plaque de Mindlin, permet l’estimation du module effective de l’infrastructure, le module élastique des chaussées ou une épaisseur équivalente de l’enrobée. Sur la base des données in-situ et simulées, la sensibilité du test de LD vis-à-vis les variations des propriétés et de la température est examinée. 1 INTRODUCTION Non-destructive test (NDT) techniques are important for estimating the integrity of pavement structures, as well as for determining the in-situ layer characteristics of pavement-subgrade systems. Given that mechanical properties of the pavement-subgrade layers are not uniform and depend on such factors as moisture content, temperature within pavement structure, and state of stress, one must accept that the back-calculated characteristics are system parameters that merely reflect the state of the system and may not correspond to actual properties. An important goal of research in the interpretation of NDT data has been to develop techniques that allow the engineer to estimate system parameters that more closely represent the values of the actual system characteristics such as elastic modulus.
The Falling Weight Deflectometer (FWD) has been popular for evaluating pavement-subgrade integrity. In the recent past, the Light Weight Deflectometer (LWD) has received increasing attention for the quality control of pavements. Both devices are based on measuring the response of a pavement to an impact load, which basically occurs by dropping a weight onto a plate. On the other hand, “state-of-the-practice” algorithms are mostly based on elastostatic models that do not reflect real dynamic response of a pavement to impact loading. An additional, important restriction is that the
interpretation of test data is more reliable for new pavements than for pavements that contain flaws such as cracks, ruts and potholes. Not accurately taking into account flaws leads to systematic errors in interpretation of data. On a positive note, since highway engineers are primarily interested in keeping track of the deterioration of strength and stiffness of pavement-subgrade systems an exact determination of system properties is not always necessary.
The objectives of this paper are to develop an approach that maximizes the information that one can extract from a LWD test and to compare its ability to capture in-situ properties relative to that of the FWD test. An important consideration is the influence of temperature on back-calculated parameters.
2 THEORETICAL BACKGROUND The LWD is a scaled-down version of the falling weight deflectometer. It has a smaller load range and shorter load duration when compared to the FWD. In principle, for perfect elastic systems, one should be able to back-calculate similar system parameters from data generated by each device. On the other hand, since the FWD excites a larger volume of the pavement-subgrade system, in practice predictions by the two devices may be very different owing to the heterogeneity and pressure
111
sensitivity of layer properties. One could exploit these differences to discriminate between average local and more ‘global’ stiffness characteristics.
The most popular backcalculation techniques for FWD data interpretation are based on analyzing the peak deflections from the load-displacement history of each geophone located at specific offsets. Various algorithms have been developed to determine the layer moduli. Owing to space limitations only those most relevant to the paper are considered. There are two simplified backcalculation approaches for two-layered pavement-subgrade models: elastostatic and elastodynamic approaches; see, e.g., Stolle (1996). Both of them characterize the pavement structure by an equivalent asphalt thickness hp and assume the subgrade layer to be an elastic half-space. Implicit in the approaches is the assumption that only two system parameters must be backcalculated to characterize the integrity of a pavement-subgrade system: effective elastic modulus of subgrade (Es) and equivalent pavement thickness (hp or he). 2.1 Effective Surface Modulus The surface deflection of a pavement is related to the elastic modulus of each layer such that under the load the deflection is due to the straining of all pavement layers and subgrade, while at larger offsets it is mainly the subgrade that deforms with the pavement ‘going along for the ride’. Deflections due to an applied surface load P may be estimated by using the Boussinesq-Odemark approach in which the surface displacement w(r) at offset r is obtained by using
( ) 3
3 1 14 s e
Pw r
E h R Rπ
= +
[1]
where ( )2 21 eR r h= + , and Es and he are effective
subgrade modulus and equivalent thickness of the pavement structure. System parameters Es and he may be evaluated through back-calculation using surface measurements (Stolle and Jung 1992).
An effective asphalt thickness hp of the pavement is approximated by
β= 3s
p e
p
Eh h
E [2]
with β being a constant that is often assumed to be 0.9. The analyses completed in this paper assume a reference value of 4000 MPa for pavement modulus Ep.
Using Boussinesq theory for an elastic halfspace, Jung (1993) suggested that the effect of the pavement can also be captured via the ‘effective or equivalent surface modulus’ ESM
( )ν= ⋅ − ⋅ ⋅2
2( ) (1 ) ( )( )SM
aE r q f r
w r [3]
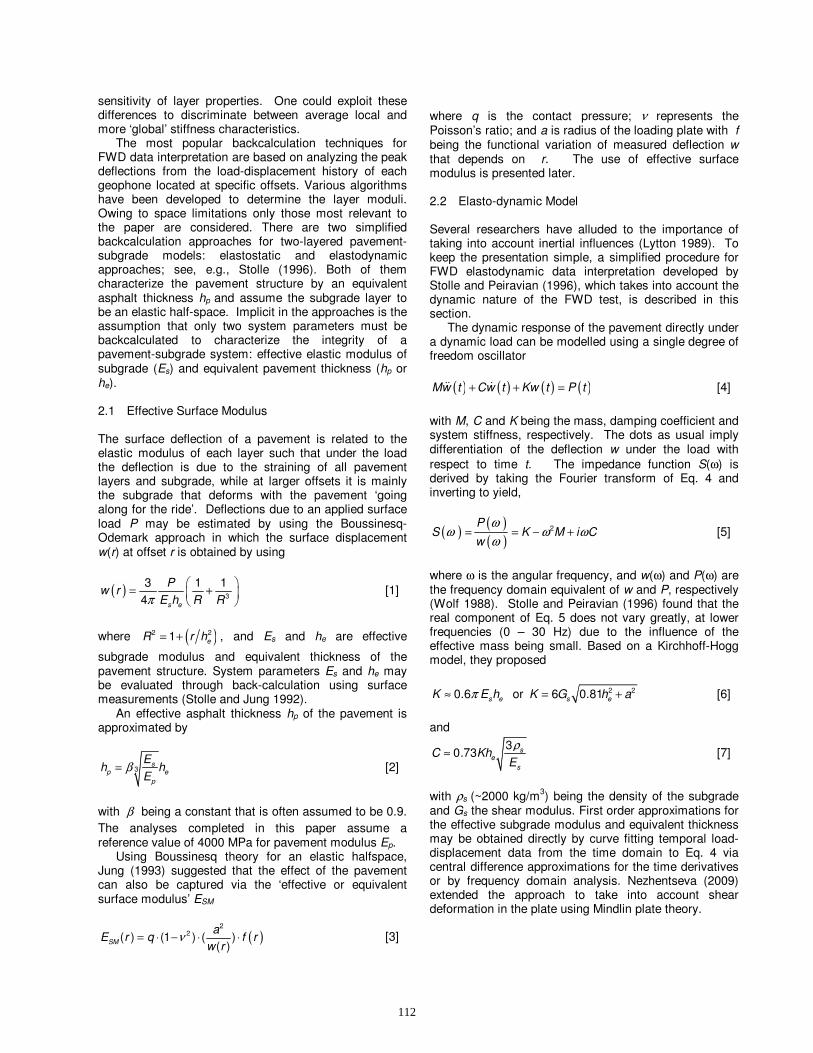
where q is the contact pressure; ν represents the Poisson’s ratio; and a is radius of the loading plate with f being the functional variation of measured deflection w that depends on r. The use of effective surface modulus is presented later. 2.2 Elasto-dynamic Model Several researchers have alluded to the importance of taking into account inertial influences (Lytton 1989). To keep the presentation simple, a simplified procedure for FWD elastodynamic data interpretation developed by Stolle and Peiravian (1996), which takes into account the dynamic nature of the FWD test, is described in this section.
The dynamic response of the pavement directly under a dynamic load can be modelled using a single degree of freedom oscillator
( ) ( ) ( ) ( )Mw t Cw t Kw t P t+ + =&& & [4]
with M, C and K being the mass, damping coefficient and system stiffness, respectively. The dots as usual imply differentiation of the deflection w under the load with respect to time t. The impedance function S(ω) is derived by taking the Fourier transform of Eq. 4 and inverting to yield,
( )( )( )
2PS K M i C
w
ωω ω ω
ω= = − + [5]
where ω is the angular frequency, and w(ω) and P(ω) are the frequency domain equivalent of w and P, respectively (Wolf 1988). Stolle and Peiravian (1996) found that the real component of Eq. 5 does not vary greatly, at lower frequencies (0 – 30 Hz) due to the influence of the effective mass being small. Based on a Kirchhoff-Hogg model, they proposed
0.6 s eK E hπ≈ or = +2 26 0.81s eK G h a [6]
and
30.73 s
e
s
C KhE
ρ≈ [7]
with ρs (~2000 kg/m3) being the density of the subgrade and Gs the shear modulus. First order approximations for the effective subgrade modulus and equivalent thickness may be obtained directly by curve fitting temporal load-displacement data from the time domain to Eq. 4 via central difference approximations for the time derivatives or by frequency domain analysis. Nezhentseva (2009) extended the approach to take into account shear deformation in the plate using Mindlin plate theory.
112

3 SENSITIVITY ANALYSIS
Analyses using both Kirchhoff and Mindlin plate models were performed with various modulus ratios Ep/Es, pavement thicknesses hp and with angular frequencies ω between 0 and 400 rad/s (64 Hz). As mentioned by Peiravian (1994), FWD loading contains frequencies that are usually less than 80 Hz with most energy in the 0 to 25 Hz range. Es was varied from 75 to 250 MPa, Ep- from 1000 to 6000 MPa, and hp from 0.05 to 0.3 m. The computer simulations were performed for the material damping ratio ξ=0.5%. A plot of the normalized imaginary components of dynamic impedance is shown in Figure 1. As one can see, the imaginary components ωC K of the normalized dynamic impedance have an approximate linear relation with respect to khe in the frequency range of interest. The parameter k represents ω sv with vs being the foundation
soil’s shear wave velocity s s sv G ρ= . Radiation
damping related to the wave propagation governs the imaginary component, not the material damping. The linear relationship indicates that the viscous damping of the SDOF model increases with increase of loading frequency ω or equivalent pavement thickness he. Quite a bit of scatter can be noted when khe>2 for both cases. An important observation is the fact that the relation is sensitive to how the pavement is modelled.
Figure 1. Normalized dynamic impedance
As for the real component of a SDOF, the relationship
is quadratic in terms of ω. Up to khe = 2 the normalized real component of dynamic impedance is close to one for the Mindlin plate, but increases quickly when khe>2. This fact shows that the mass of the SDOF system has a small value indicating that inertial effect cannot be properly captured by an equivalent mass M of SDOF oscillator. At high frequencies when the wavelengths become shorter and, thus, most of the energy is not
reaching the subgrade layer, the response is mainly dominated by the pavement properties (Peiravian, 1994).
4 DIMENSIONAL ANALYSIS Given the sensitivity of the dynamic impedance to the pavement model selection, additional synthetic data was generated using finite element analyses based on 8-noded axi-symmetrical elements. The analyses were completed for a = 0.075 and 0.15 m, hp = 0.05 to 0.3 m, Ep = 2000 to 6000 MPa, Es = 75 to 250 MPa and frequencies up to 50 Hz. The boundaries were approximately 4 m away from the load and Poisson’s ratio was maintained constant. The data was then examined within the framework of dimensional analysis (Buckingham 1914). Figures 2 and 3 summarize the findings for ‘quasi-static’ behaviour and the imaginary component of dynamic impedance. An important observation is that the stiffness varies approximately with
the cube root of the modulus ratio ( )p sE E , which is
consistent with the Odemark (1949) transformation. The analysis however shows that the dependency on pa h is
not properly taken into account when using the Odemark-Boussinesq approximation.
Figure 2. Dimensionless groups for static stiffness
113

Figure 3. Dimensionless groups for imaginary component
By examination of Figure 3, it appears that the Mindlin plate theory is more realistic than the Kirchhoff theory with regard to modelling the pavement-system using two layers, given how it captures the trends from the finite element-generated data. Taking into account the scatter, it is neverthelessr clear that the model is more suited as a screening tool to identify more significant changes in system properties. 5 INSITU TEST PROGRAM LWD tests were carried out on four pavement pads, outside the Applied Dynamics Laboratory building at McMaster University during the Fall of 2007. A limited experimental program was also conducted to measure temperature profiles of the pavement-base system during August 2008 over 10 days at 10 minute intervals. Figure 4 shows the test layout as well as a LWD test. Each pad was 60x60 cm square with each having different asphalt-concrete thickness (50, 100, 150 and 200 mm). The location of bedrock near the ADL building is supposed to be a significant distance below the surface. All tests were performed with a Dynatest 3031 LWD according to standard LWD testing procedures with the 150 mm diameter loading plate. For each station 10 drops were made, with full load and displacement histories recorded. The recorded peak load value was approximately 7.8 kN.
Figure 4. Site layout showing base and LWD test set up. Characteristic load and displacement histories are illustrated in Figure 5. As one can observe from this figure, the peak values of load and deflection are shifted as one would expect of the dynamic nature of LWD tests. There is a time lag of about 2-3 ms between the peak load and displacement measured by the central geophone. This time lag is due to inertial effects (radiation damping) typical of FWD and LWD tests. The deflection histories are not symmetrical and the displacement does not return to zero, which would cause problems when performing frequency domain analyses. This is attributed to LWD movement after the peak load. To avoid back-calculation difficulties, the deflection data after approximately 25 ms were eliminated from the analyses, which were performed in the time domain.
Figure 5. Representative load (solid) and displacement
(dashed) histories
Back-calculation analysis was performed by recognizing that ω α= eC K kh where α is the slope, which
was found to be 0.7314 (Peiravian 1994) and 0.4976
114

(Nezhentseva 2009) for Kirchhoff and Mindlin plates, respectively. Time domain analysis, implementing high order finite differences (Chapra and Canale 1988) together with least squares curve fitting, was performed to calculate the parameters M, C and K of the equivalent SDOF systems for all stations after removing the last part of the time-deflection to reduce the effect of any possible problems occurring after the drop of the weight on the loading plate. Table 1 summarizes the results.
Table 1. Summary of back-calculated Parameters
Station K Es hp ha
(kN/m) (MPa) (mm) (mm)
A 27 54 (39) 74 (80) 50
B 43 64 (46) 109 (117) 100
C 60 79 (56) 132 (141) 150
D 65 82 (58) 140 (150) 200
Note: ha = actual thickness; Kirchhoff (Mindlin)
The main observations include: the Kirchhoff plate predicts higher moduli and smaller equivalent asphalt thicknesses when compared to the values obtained from the Mindlin theory; and the back-calculated subgrade modulus appears to increase with pavement thickness. While similar observations have been made, when interpreting FWD data, the LWD back-calculated moduli are more sensitive to pavement thickness than those from FWD tests. This is attributed to the LWD sampling a smaller volume of material. Since the effect of the location of boundaries becomes more important for thicker pavements, this would have had an impact on the findings.
6 TEMPERATURE VARIATIONS It is often assumed that average resilient modulus can be assumed for the asphalt concrete layer. On the other hand, it is well known that the temperature of the asphalt concrete (AC) layer is a key factor affecting the elastic modulus of asphalt concrete. The remainder of the paper addresses the impact of temperature on pavement response for FWD and LWD to find the answers to the following questions: Are the back-calculated subgrade modulus estimates sensitive to surface fluctuations in temperature? How does backcalculated layer stiffness vary as temperature changes in terms of what one measures using the various tests?
The measured temperature variations at 10 mm depth were fit to a sine function, which was used for subsequent analyses; i.e.
( ) T(t) =13sin 6.02 t-12 +28 [8]
where t is the time (hours), starting at 12:00 am. Figure 6 shows good agreement when comparing calibrated function and the field data.
Figure 6. Simulated and measured temperature Finite difference simulations were then completed to study the spatial and temporal temperature fluctuations over time assuming that the temperature stays constant at 600 mm depth (22.5ºC) and specifying the temperature history at the 10 mm location. The objectives of the heat conduction simulations were to determine temperature profiles within the pavement-subgrade structure and to confirm the thermocouple temperature measurements, as well as to obtain a better understanding of the temperature dynamics. Two sets of simulations were performed, one with gravel as base layer and the other with clay to see how sensitive the results would be to differences in thermal properties.
Based on a review of the literature, the thermal diffusivity of asphalt concrete, gravel and clay are 0.4348, 0.4804 and 0.5324 mm2/s, respectively. For details the reader is referred to Nezhentseva (2009). The temperatures in the asphalt concrete were not very sensitive to the thermal properties of the supporting material. Figure 7 shows representative predictions and measured temperature variations with depth for different times of day of the 100 mm thick pavement. Both predictions and measurements provide similar trends. It was observed that the temperature changed quite rapidly in the upper part of the asphalt pavement during the day while it remained almost constant in the underlying layers, which is characteristic for summer conditions.
115

Figure 7. Distribution of temperature with depth. Figure 8 shows simulated variations of elastic modulus over time and depth in the asphalt concrete layer (200 mm thick) using the Ali and Lopez (1996) relation
9.372 0.0361T
pE e − ⋅= [9]
where Ep is the asphalt concrete elastic modulus (MPa) and T is the pavement temperature (°C). It had been found that the modulus variation in the upper 100 mm was insensitive to the thickness of the pavement. At the surface of pavement layer, the elastic modulus reaches its maximum value of 5500 MPa between 8 pm and 12 am and its minimum value of 2700 MPa at noon. Rapid changes of the elastic modulus during the day can be observed within approximately the top 0.07 m. Elastic modulus decreases with depth at night, while in the middle of the day when temperatures reach the highest value (and pavement becomes softer) the elastic modulus values increase with depth.
Figure 8. Daily elastic moduli variations in the AC layer for
200 mm asphalt layer 7 TEMPERATURE EFFECTS Non-isothermal simulations, in which the elastic modulus of the asphalt concrete was non-uniform and depended on surface temperature of pavement layer during the day, were performed to study the effect of temperature changes in pavements on the response of the pavement-subgrade system to loading. The pavement layer was divided into sub-layers 50 mm thick to simplify the model with the representative modulus corresponding to the midpoint of the sub-layer. The variation of the resilient modulus of asphalt concrete layer with depth was calculated according to the Ali and Lopez (1996) relation, corresponding to reference times: 4 am (lowest), 12 pm (highest) and 8 pm (average pavement surface temperatures). The finite element details are presented in Nezhentseva (2009). 7.1 Elastostatic Data Interpretation Backcalculation analysis was performed on the synthetic load-deflection histories corresponding to FWD and LWD simulations to understand how temperature affects the effective surface modulus predictions. The main goal was to identify how sensitive backcalculated Es is to the temperature changes in asphalt concrete for FWD and LWD device loading.
The elastostatic backcalculation approach presented previously was implemented in a FORTRAN computer code developed at McMaster. Effective surface moduli were backcalculated at various offsets using Eq. 3 together with the maximum load and surface displacements. This was done corresponding to hypothetical measurements at various times of the day (4 am, 12pm and 8pm). Representative effective surface modulus profiles are shown in Figure 9 for the cases of 100 and 200 mm thick pavements supported by a 100 MPa subgrade.
The trends for both devices look similar. The figures clearly show that an increase in pavement thickness (hp) affects the growth of the maximum value of effective surface moduli ESM for both devices (at zero offset), as one might expect. Although not shown, a common observation for both devices is that the value of the effective surface modulus ESM increases with an increase in the stiffness of a subgrade layer Es. This is reasonable as the surface modulus at zero offset (r=0) represents the stiffness of the entire pavement-subgrade system. ESM has a higher value at 4 am when the temperature in the AC layer reaches its minimum, while it decreases as the day temperature reaches its peak at noon. The value of effective surface modulus ESM at zero offset corresponding to the LWD was found to be consistently higher than the value predicted by FWD. The LWD and FWD devices excite different volumes of the pavement-subgrade system such that the LWD mostly captures the
116

stiffness of the pavement-base layers, which is higher than that of the subgrade resulting in the higher ESM at zero offset than that of the FWD. Variations of ESM close to the load are significant during the day.
Figure 9 Effective surface modulus for FWD and LWD.
ESM decreases with increase of the distance from a load centre as it begins to represent the stiffness of the lower layer (Jung, 1993). At some point, the ESM changes become negligible forming a single relation. The radial distance (offset) where the effective surface modulus is constant is approximately 400-800 mm for the FWD and 300-600 mm for the LWD. The load plate radius is believed to have some impact on this characteristic distance. According to Stolle and Jung (1992) the distance where Es reaches its minimum value is approximately equal to equivalent thickness he for two-layer approximation. At larger offsets, ESM approaches the value of Es. One observes that the insensitivity of ESM at larger offsets, which indicates that the backcalculated subgrade modulus is not sensitive to temperature fluctuations in the asphalt layer, as one might expect. It is however important to remember that deflections for the LWD are usually not recorded at larger offsets.
Figure 10 shows the back-calculated elastic modulus of subgrade against input Es. Although not perfect, there appears to be a reasonable one-to-one relation. The values corresponding to the LWD are, of course, hypothetical given that displacements are usually not recorded at large offsets.
Figure 10. Minimum back-calculated versus input Es
7.2 Elastodynamic Interpretation
Typical simulated load-deflection histories for FWD measurements are presented in Figure 11. These trends reflect those observed when testing flexible pavements during an average hot summer day when the surface of the asphalt concrete pavement layer attains its minimum at 4 am and maximum temperature at noon. In the present study, time domain analysis was used to evaluate M, C and K corresponding to a SDOF approximation for the FWD and LWD simulations, in which temperature within the asphalt layer varied with depth. M, C and K values were back-calculated using the synthetic load-displacement histories.
The main observations for the stiffness coefficient K were: K increases with an increase of the subgrade modulus Es; K increases with an increase of the pavement thickness ha; and K increases with a decrease of the pavement surface temperature.
117

Figure 11. Deflection history for the various times The main observations for the damping coefficient C were: for a pavement with the same thickness of asphalt concrete layer C decreases with an increase of the subgrade modulus Es; and C increases with an increase of the pavement thickness hp. As the pavement surface temperature increases (which implies decreasing elastic modulus of asphalt concrete Ep) the damping coefficient C decreases. The back-calculation results of C and K for the LWD were more sensitive to temperature and subgrade stiffness changes than those back-calculated from the FWD data. 8 CONCLUDING REMARKS The light weight deflectometer is a portable version of the falling weight deflectometer. The main disadvantage is that it has fewer sensors available to provide information that can be used to estimate the characteristics of a pavement. One way of extracting more information is to make use of the full displacement and load histories. Relations have been developed that allow one to make better use of the measurements.
A limitation of the LWD is the properties that it captures reflect the materials in a much smaller volume than what the FWD is capable of measuring. As a result, the LWD is more susceptible to temperature variation than the FWD. One could, however, take advantage of this characteristic such that both devices could complement one another in order to better identify the system properties. ACKNOWLEDGEMENTS
Funding for this research was provided by the Natural Science and Engineering Research Council of Canada. The testing was performed by JEGEL. REFERENCES Ali H. and Lopez A. 1996. Statistical analysis of
temperature and moisture effects on pavement structural properties based on seasonal monitoring data. Transportation Research Record, 1540:48-55.
Buckingham E. 1914. On physically similar systems; illustrations of the use of dimensional equation, Phys.Rev., 4:345-76.
Chapra S.C., Canale R.P. 1988. Numerical methods for engineers, McGraw-Hill, NY.
Jung F.W. 1993. Deflection basin testing, interpretation and overlay design with the falling weight deflectometer. Research and Development Branch Ontario Ministry of Transportation Report.
Lytton, R.L. 1989. Backcalculation of pavement layer properties. Nondestructive Testing of Pavements and Backcalculation of Moduli, ASTM STP 1026, A.J. Bush III and G.Y.Baladi, Eds., American Society for Testing and Materials, Philadelphia, pp. 7-38.
Nezhentseva, A. 2009. Backcalculation and sensitivity of non-destructive tests to temperature variations in flexible pavements. M.A.Sc. thesis, McMaster University, Hamilton, Ontario, Canada.
Odemark N. 1949. Investigations as to the elastic properties of soil design of pavements according to the theory of elasticity. Staten Vaeginstitut, Stockholm, Sweden.
Peiravian F. 1994. Interpretation of in-situ pavement properties using FWD testing technique, Master of Engineering Thesis, McMaster University, Canada.
Stolle D.F.E. 1996. Comparison of simplified elastostatic and elastodynamic models for falling weight deflectometer data interpretation. Transportation Research Record, 1540:.72-75.
Stolle, D.F.E., Peiravian, F. 1996. Falling weight deflectometer data interpretation using dynamic impedance, Canadian Journal of Civil Engineering, 23:1-8.
Stolle, D.F.E., Jung F.W. 1992. Simplified, rational approach to falling Weight deflectometer data interpretation, Transportation Research Record 1355:82-89.
Ullidtz P. 1987. Pavement analysis. Institute of Roads, Transport and Town Planning, The Technical University of Denmark, Lyngby, Denmark.
Wolf J.P. 1988. Soil-structure interaction analysis in time domain. Prentice-Hall, Inc., Englewood Cliffs, NJ.
118