Back into the Icehouse: The Last 55 Million Years Global Climate Change Since 55 Myr Ago.
109
Back into the Back into the Icehouse: Icehouse: The Last 55 Million The Last 55 Million Years Years Global Climate Change Since 55 Myr Ago
-
Upload
letitia-singleton -
Category
Documents
-
view
215 -
download
0
Transcript of Back into the Icehouse: The Last 55 Million Years Global Climate Change Since 55 Myr Ago.

Back into the Icehouse:Back into the Icehouse:The Last 55 Million YearsThe Last 55 Million Years
Global Climate Change
Since 55 Myr Ago

Evidence From Ice and VegetationEvidence From Ice and Vegetation
• Southern Hemisphere– No evidence for ice on
Antarctica until 25 Mya.• Ice rafted debris in continental
margin coastal sediments• Size of ice has increased
towards the present– Large growth
» 13 Myr ago» 7 7 Myr ago
– Lower Middle Latitudes• Earliest evidence in Andes
– Between 7 and 4 Myr ago

Antarctica TodayAntarctica Today
• An ice sheet as much as 4 km thick covers more than 97% of the continent
• Around the margins mountains protrude through the thinner ice

Fossil EvidenceFossil Evidence
• Nothofagus– Type of beech tree– Found in Antarctica
prior to 40 Myr ago– Disappeared with polar
climate
A modern beech forest at the southern tipof South America

LichensLichens
• The only vegetation found in Antarctic today– Summer meltwater ponds in coastal valleys

Ice in the Northern HemisphereIce in the Northern Hemisphere
• First developed on Greenland– Between 7 and 3 Myr
ago
• 1st glacial evidence in Alaska– High coastal
mountains– About 5 Myr ago

North American and Eurasian North American and Eurasian Ice SheetsIce Sheets
• Appeared 2.7 Myr ago
• Formed and melted in repeated cycles– Maximum size increased after 0.9 Myr ago– Even though ice sheets developed in N.
America 30 million years later than in the southern hemisphere
• Part of the same overall cooling trend

North Polar RegionsNorth Polar Regions• Canadian Arctic 60 Myr ago
(at 80o N)– Palm-like vegetation– Ancestors of modern
alligators

North Polar RegionsNorth Polar Regions
• Cold conditions developed
– Conifer forests of spruce and larch by 20 Myr ago
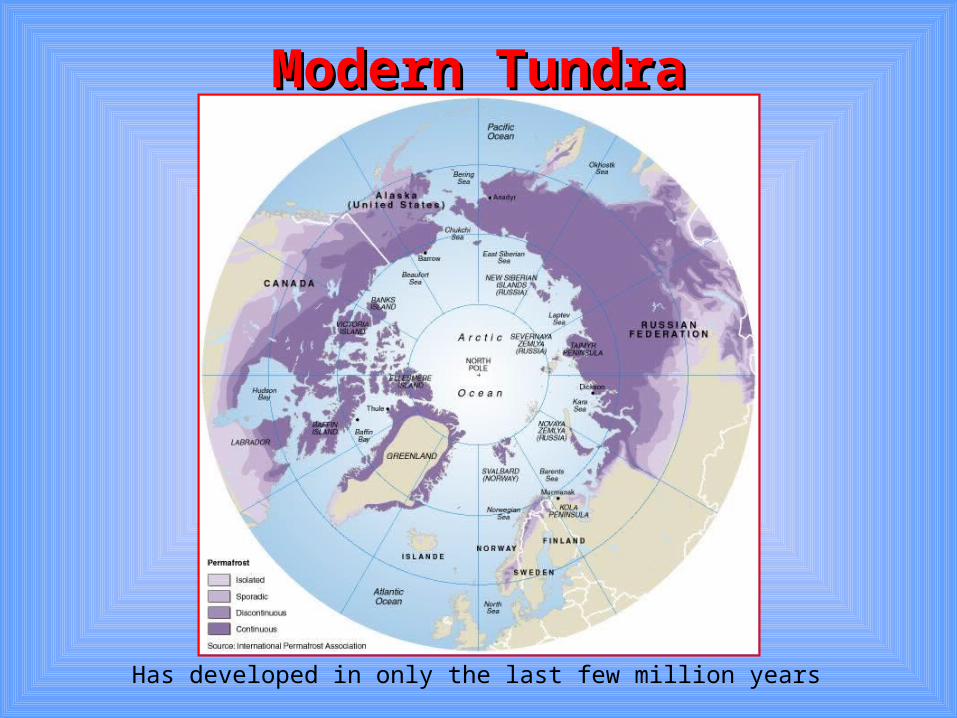
Modern TundraModern Tundra
Has developed in only the last few million years
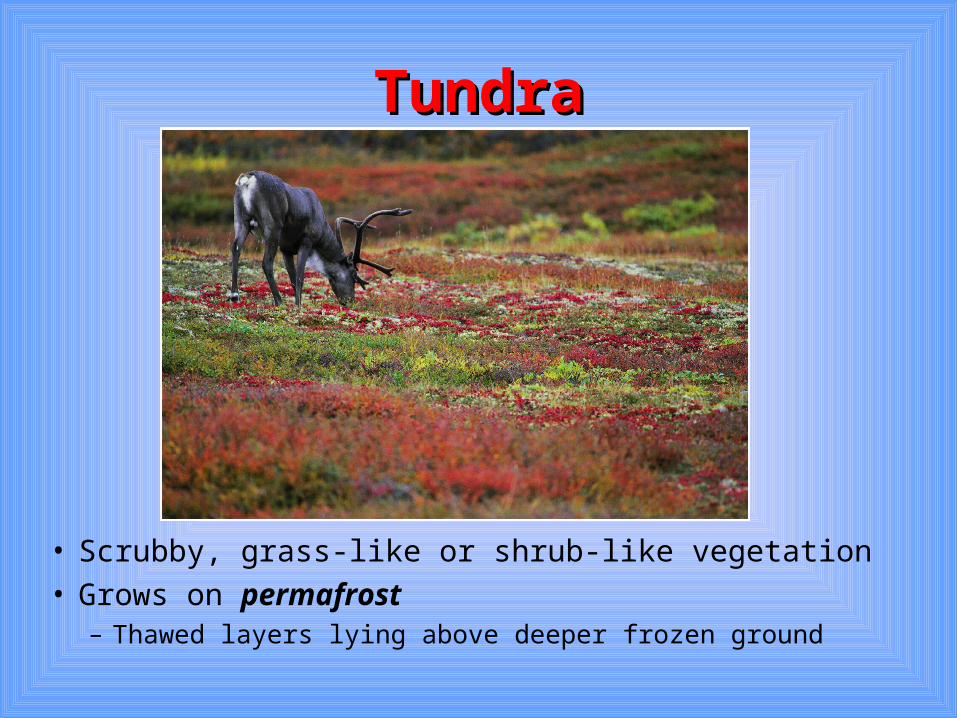
TundraTundra
• Scrubby, grass-like or shrub-like vegetation• Grows on permafrost
– Thawed layers lying above deeper frozen ground

PermafrostPermafrost
Siberia
Alaska

SolifluctionSolifluction
• During the warm season the surface melts and slides downslope over the frozen layer– Creates a hummocky appears

Shapes of Tree LeavesShapes of Tree Leaves
• Can be used to reconstruct climate– Smooth-edged leaves are found in tropics– Jagged-edged leaves grow in colder climates
• Cause is unknown• Leaf-margin evidence in western N. America shows ongoing cooling
over 55 Myr

Cooling in Western N. America Cooling in Western N. America Inferred from Leaf-Margin EvidenceInferred from Leaf-Margin Evidence
• Cooling trend in middle latitudes during the last 55 Myr.
• Punctuated by small short-lived warmings

Oxygen Isotope DataOxygen Isotope Data

Periodic Table of the ElementsPeriodic Table of the Elements

Recall that . . .Recall that . . .
• Atomic Number– Number of protons in the nucleus of an atom– All isotopes of an element have the same
atomic number

Atomic WeightAtomic Weight• Also called atomic mass.• Given in atomic mass units (amu)
– Standard Mass is determined using a neutral atom of carbon-12– It is set at exactly 12 mass units (12 u)– 1 atomic mass unit (amu) = 1/12 of this mass which is 1.66 X 10⁻²⁶ g.
• Also considers the fractional abundance of each isotope.
• Example using chlorine: – Of the two isotopes of Cl, approximately:
• 75% (75.53%) are the lighter isotope chlorine-35 and• 25% (24.47%) are chlorine-37
– Finding the atomic mass(34.969 amu x .7553) + (36.966 amu x .2447) = 35.45 amu

Two Climatically Important Two Climatically Important Isotopes of OxygenIsotopes of Oxygen
O
O
8
8
16
18
Usually written as
Usually written as
O
O
16
18

Isotopes of OxygenIsotopes of Oxygen
• Provide information with regard to temperature
– Oxygen trapped in ice indicates temperature at the time the oxygen was trapped
– Oxygen trapped in shells is an indicator of water temperature

Ocean Water and ForaminiferaOcean Water and Foraminifera
• Foraminifera are marine Protists that secret shells composed of calcite (CaCO3).
• Both isotopes of oxygen exist in seawater although 18O accounts for only about 0.2%.– Both isotopes of oxygen are found in the shells
of forams.– The 18O/16O ratio in the shells provides
information as to the seawater temperature at the time the forams lived.

Two Kinds of Foraminifera Live Two Kinds of Foraminifera Live in Climatically Important Parts in Climatically Important Parts
of the World’s Oceansof the World’s Oceans
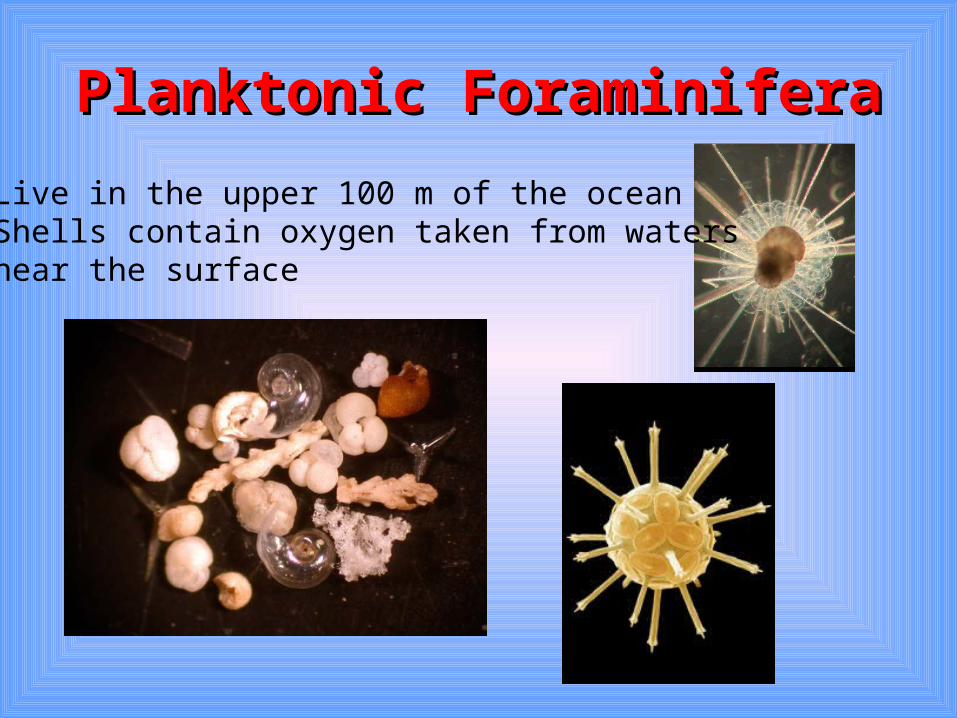
Planktonic ForaminiferaPlanktonic Foraminifera
• Live in the upper 100 m of the ocean• Shells contain oxygen taken from waters near the surface

Benthic ForaminiferaBenthic Foraminifera• Live on the seafloor and within upper layers of sediment• Shells contain oxygen from deep water

Symbols Used . . .Symbols Used . . .
• Parts per thousand is abbreviated as:
• Infinitesimally small change is abbreviated using the lower case Greek letter delta.
/ooo
δ

1818O/O/16160 Measurements0 Measurements• Individual measurements of 18O/160 ratios
– Reported as departures in parts per thousand from a laboratory standard.
– Large amounts of 18O compared to 16O• 18O – enriched (positive δ 18O values)
– Or 16O – depleted
– Small amounts of 18O compared to 16O• More negative δ 18O values• Referred to as 18O – depleted
– Or 16O – enriched

Water Temperature and δ Water Temperature and δ 1818O O Values in Foraminifera ShellsValues in Foraminifera Shells
• As temperature increasesincreases the δ 18O decreasesdecreases– Each 4.2o increase, δ 18O decreases 1 /oo
• Modern Sub-Tropical Oceans (21o C)– Planktonic Foraminifer have δ 18O values of
-1 /oo
• Benthic Foraminifer in cold water (2o C) have δ 18O value of + 3.5 /oo
o
o
o

Oxygen Isotopes and the Hydrologic CycleOxygen Isotopes and the Hydrologic Cycle
• Lighter 16O evaporates more easily from the ocean.• Heavier 18O is more easily removed from the atmosphere
by precipitation– Along coastlines it quickly flows (runoff) back into the ocean
18O18O
+δ18O
-δ18O-δ18O
Isotope FractionationIsotope Fractionation
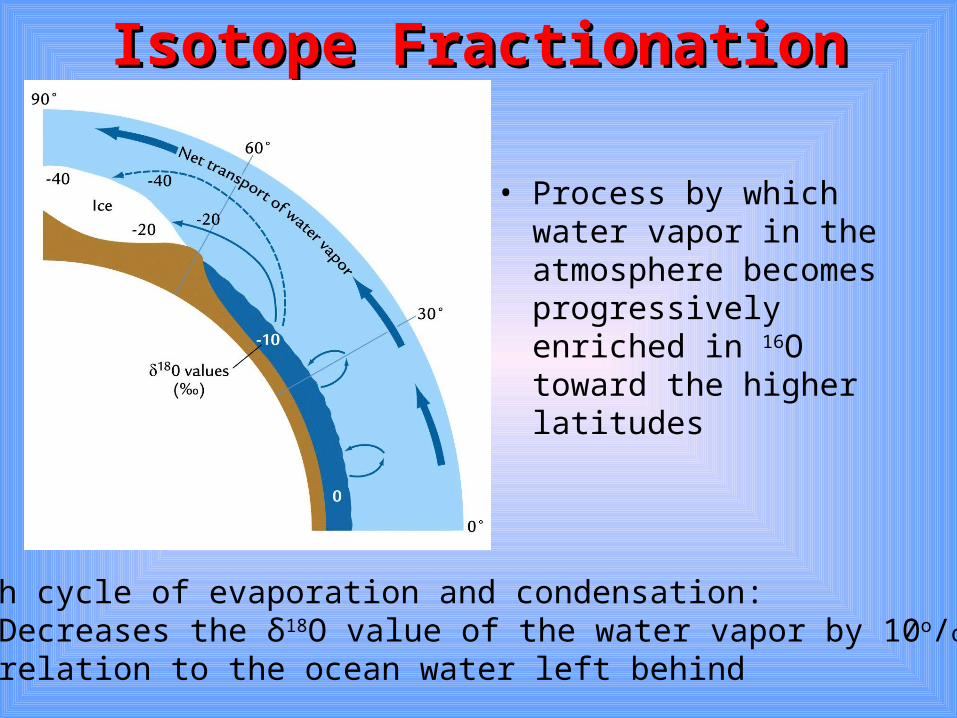
• Process by which water vapor in the atmosphere becomes progressively enriched in 16O toward the higher latitudes
• Each cycle of evaporation and condensation: - Decreases the δ18O value of the water vapor by 10o/oo in relation to the ocean water left behind
On a Growing GlacierOn a Growing Glacier
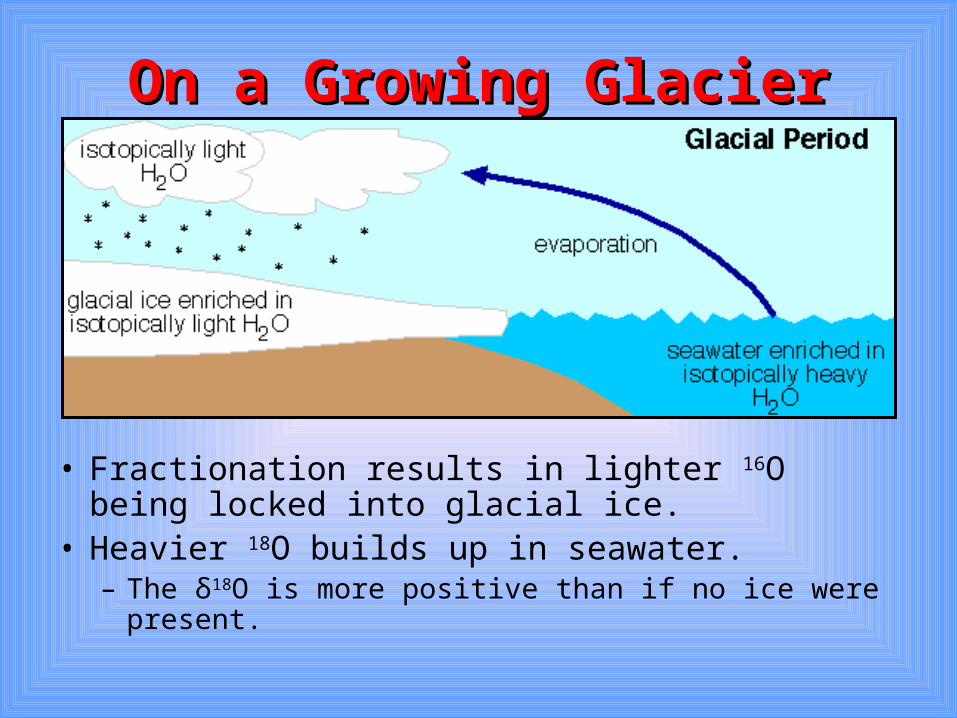
• Fractionation results in lighter 16O being locked into glacial ice.
• Heavier 18O builds up in seawater.– The δ18O is more positive than if no ice were present.

Evidence from Mg/CaEvidence from Mg/Ca
• Ratio of magnesium to calcium in foraminifera shells
• Process of Mg replacing Ca– Depends on water temperature– Ratio increases 8 to 10% for each 1o C
increase in temperature– Linear relationship
• Mg/Ca trend is similar to δ18O “signal”

What if the ice sheets on What if the ice sheets on Antarctica and Greenland melted Antarctica and Greenland melted
over the next 10,000 years?over the next 10,000 years?
And, how would this be recorded in And, how would this be recorded in the shells of planktonic and benthic the shells of planktonic and benthic
foraminifera?foraminifera?
Melting of all Modern-Day IceMelting of all Modern-Day Ice
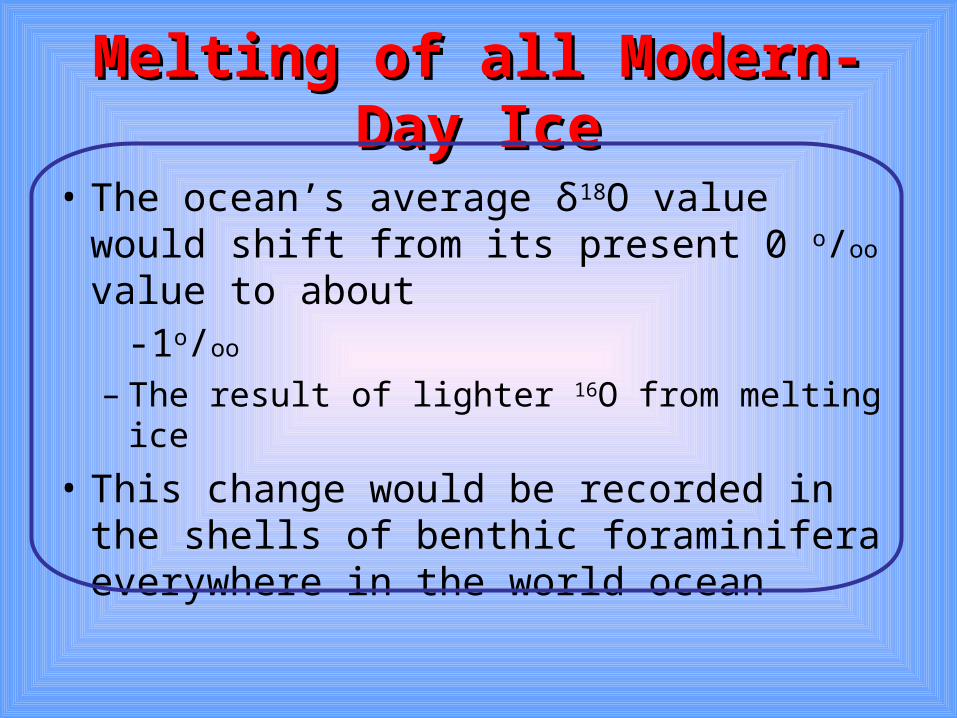
• The ocean’s average δ18O value would shift from its present 0 o/oo value to about
-1o/oo
– The result of lighter 16O from melting ice
• This change would be recorded in the shells of benthic foraminifera everywhere in the world ocean

Possible MisinterpretationPossible Misinterpretation
• Recall that each 4.2o C increase, δ 18O decreases 1 o/oo.
• If in 10,000 years a future climate scientist measured foraminifera shells deposited during this interval and didn’t know about the deglaciation . . .– The -1 o/oo shift would be interpreted as a 4.2o C
warming of the entire world ocean and not as a change in ice volume
Changes in Ocean Changes in Ocean Temperature and in the Temperature and in the
Amount of Water in Ice Sheets Amount of Water in Ice Sheets Must be CombinedMust be Combined

The Equation Used by Climate The Equation Used by Climate Scientists Considers . . .Scientists Considers . . .
• δ 18O measured in foraminifera shells• δ 18O mean value of ocean water at the
time the shells were formed• The equation tells us that measured
changes in the mean δ18O foraminifera are the result of:– Changes in the temperature of the water in
which the shell formed and– Changes in the mean δ18O of the oceans

So, what is the equation?So, what is the equation?
• Don’t worry about it.
• We’re not going to get into the math.
• But, if you must find it look on page 101 of your text!
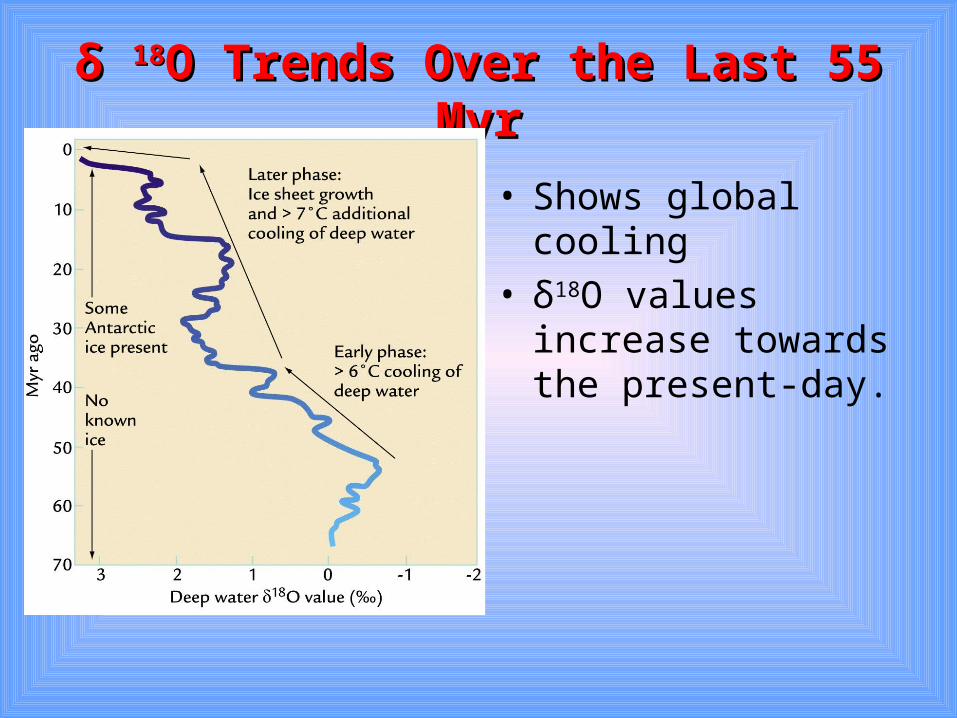
δ δ 1818O Trends Over the Last 55 MyrO Trends Over the Last 55 Myr
• Shows global cooling• δ18O values increase
towards the present-day.

δ δ 1818O Trends Over the Last 55 MyrO Trends Over the Last 55 Myr
• This trend could be a result of:– Cooling of the deep
ocean– Growth of ice sheets
on land– A combination of both
factors
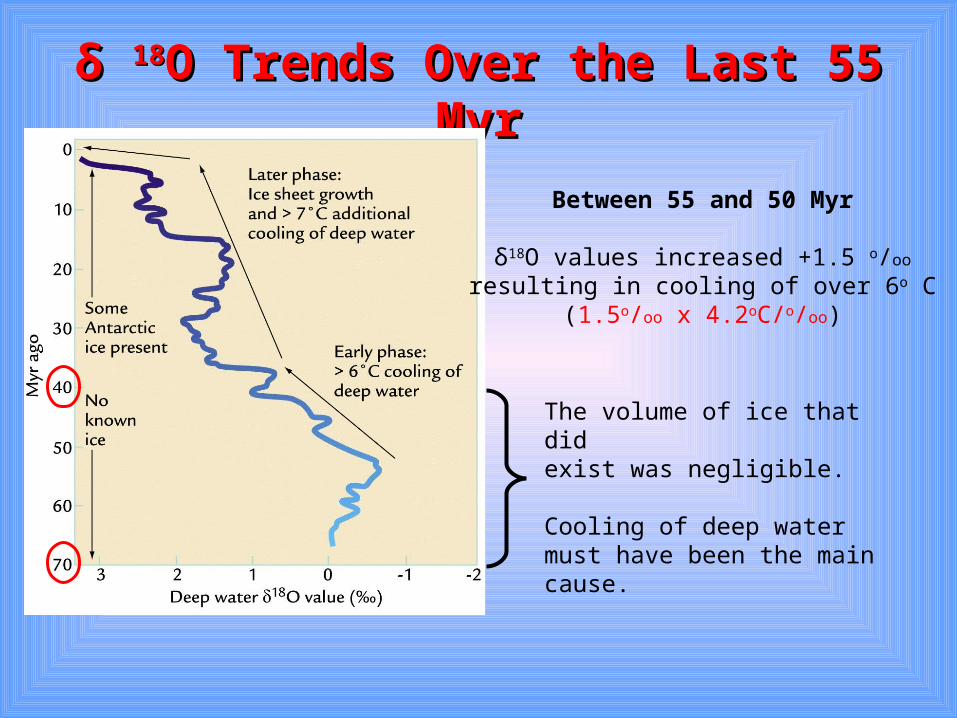
δ δ 1818O Trends Over the Last 55 MyrO Trends Over the Last 55 Myr
The volume of ice that didexist was negligible.
Cooling of deep water must have been the main cause.
Between 55 and 50 Myr
δ18O values increased +1.5 o/oo
resulting in cooling of over 6o C(1.5o/oo x 4.2oC/o/oo)

δ δ 1818O Trends Over the Last 55 MyrO Trends Over the Last 55 Myr
35 Myr
Some ice had appeared on Earth
The volume of ice is unknown.
The composition of the ice is alsounknown.

δ δ 1818O Trends Over the Last 55 MyrO Trends Over the Last 55 MyrPresent
Increase due to a combination of:
• Ice sheet growth • Deep water cooling

Cooling of the Deep OceanCooling of the Deep Ocean
• Between 40 Myr ago and today– Deep ocean δ18O values increased +2.75 o/oo
• About 1 o/oo was due to δ18O deficient ice sheets• Additional cooling (another 7o C) of the deep ocean accounts
for the residual 1.74 o/oo.(1.74o/oo x 4.2o C/o/oo)
• Total deep ocean cooling has been about 14o C– When changes in temperature or ice volume occurred
over the last 35 Myr can’t be determined– Both probably affected δ18O values simultaneously

More Temperate Polar Climates More Temperate Polar Climates 55 Myr Ago55 Myr Ago
• Deep ocean temperatures today average 2o C.• The deep ocean has cooled by at least 14o C in
the last 55 Myr– 55 Myr ago the deep ocean temperature must have
been 16o C.
• Assuming that deep ocean water originated at high latitudes as today– The water originating in polar climates 55 Myr ago
must have been warmer than today • indicating that those climates were much more temperate
than they are today.
Why Did Global Climate Why Did Global Climate Cool Over the Last 55 Myr?Cool Over the Last 55 Myr?

Was it BLAG?Was it BLAG?
• There should be evidence of:– A slowing of global mean seafloor spreading
and subduction rates
– Resulting slower rates of CO2 input into the atmosphere to cause global cooling

Changes in Spreading RatesChanges in Spreading Rates
• The average rate slowed until 15 Myr ago – Consistent with cooling
• Increased in the last 15 Myr– But, ice appeared in the
northern hemisphere in the last 15 Mry
• BLAG may have caused global cooling before 15 Myr ago, but it doesn’t explain the cooling since then.

Was it the Uplift Weathering Was it the Uplift Weathering Hypothesis?Hypothesis?
• Its three main predictions must be verified:– High elevation terrain must be more common
today than in the past 55 Myr.– This high terrain must be causing unusual
amounts of rock fragmentation• This creates more surface area for greater rates of
weathering.
– There must be unusually high rates of chemical weathering.

Prediction 1Prediction 1
Extensive High TerrainExtensive High Terrain
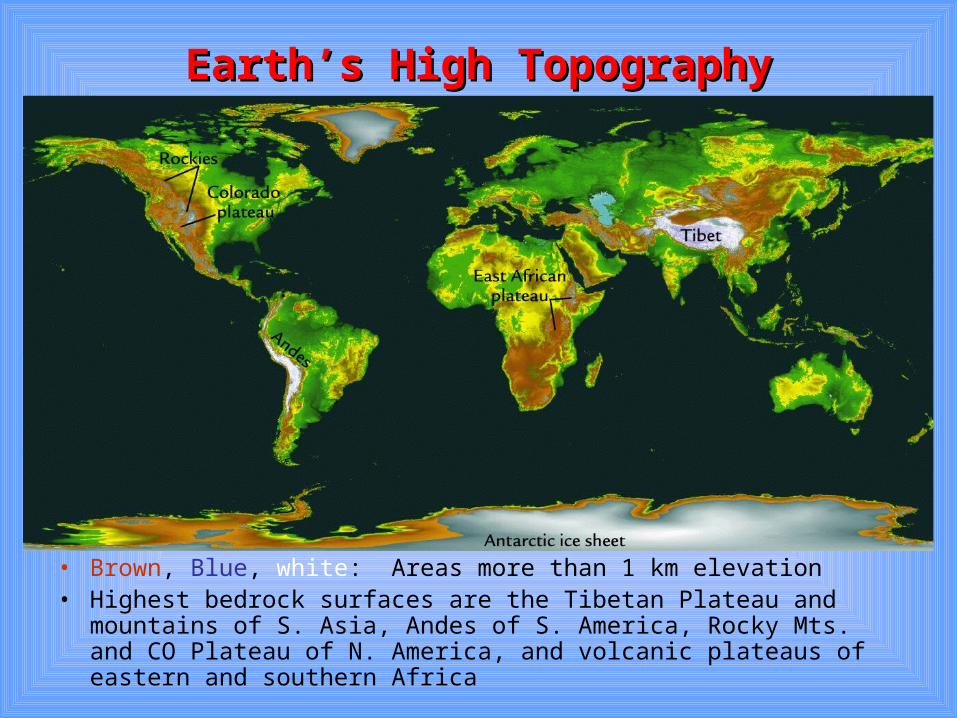
Earth’s High TopographyEarth’s High Topography
• Brown, Blue, white: Areas more than 1 km elevation • Highest bedrock surfaces are the Tibetan Plateau and mountains of
S. Asia, Andes of S. America, Rocky Mts. and CO Plateau of N. America, and volcanic plateaus of eastern and southern Africa

The Tibetan PlateauThe Tibetan Plateau
• Strong evidence for the amount high terrain today being greater than in the past
• Formed by the collision of India with Asia about 55 Myr ago

The Tibetan PlateauThe Tibetan Plateau
• Uplift has occurred since the collision
• No other continental collisions occurred from 100 to 65 Myr ago
• No such massive plateaus existed then or for the preceding 150 Myr

The Himalayan MountainsThe Himalayan Mountains

Most Other High Elevation Most Other High Elevation RegionsRegions
Ocean-Continent ConvergenceOcean-Continent Convergence
(Subduction)(Subduction)

Andes MountainsAndes Mountains
• The modern Andes and the central Altiplano Plateau result from subduction• The western Andes started forming with subduction 100 Myr ago• The Altiplano and eastern Andes were both created in the last 55 Myr from eastward expansion which has increased the total mass of the high Andes.

Uplift in Western N. AmericaUplift in Western N. America
• Subduction has occurred along western North America.• New evidence indicates uplift in a large region in the Rocky
Mountain area was offset by lower of high terrain farther west, near Nevada.
• Other scientists emphasize recent uplift, within the starting about 20 Myr ago.

High Topography in the American WestHigh Topography in the American West

Sierra Nevada MountainsSierra Nevada Mountains

High Topography in the American WestHigh Topography in the American West

Basin and RangeBasin and Range
• Mostly in Nevada• Ranges bordered by normal faults
Sierra Nevada at the western margin has risen along the faults more than 3000 m above the valley to the east

High Topography in the American WestHigh Topography in the American West
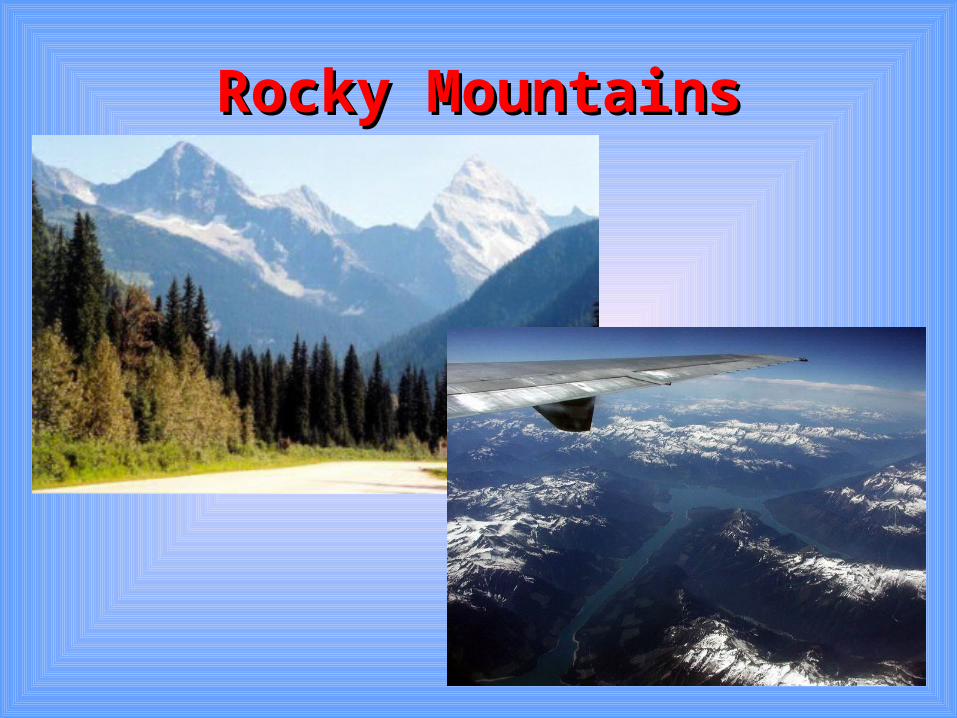
Rocky MountainsRocky Mountains

High Topography in the American WestHigh Topography in the American West
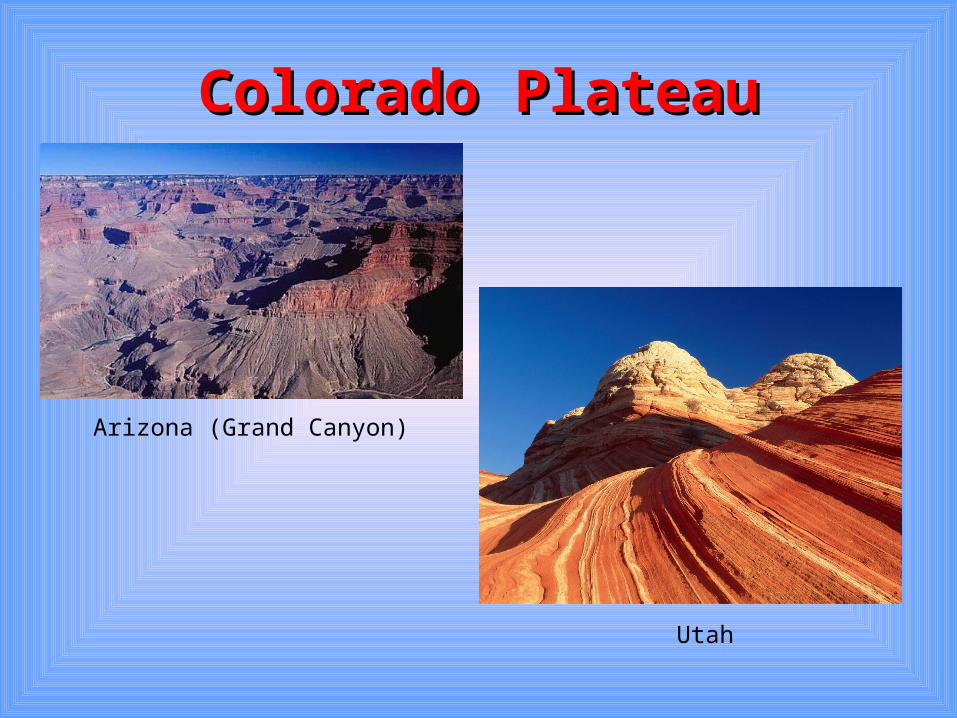
Colorado PlateauColorado Plateau
Arizona (Grand Canyon)
Utah

Low Plateaus in Eastern and Southern AfricaLow Plateaus in Eastern and Southern Africa
• 1 km high plateaus from deep-seated heating that causes broad upward doming and of lava flows.• Seems to have been built in the last 30 Myr.

SummarySummary
• The Massive Tibetan Plateau makes modern topography unusual compared to much of geology history.– This is consistent with the weathering
hypothesis.
• Regions of high youthful terrain also exist along subducting margins.– It’s not confirmed that these are higher than
similar features formed during earlier intervals.

Prediction 2Prediction 2
Unusual Physical WeatheringUnusual Physical Weathering

Sediments From Rivers Deposited in Sediments From Rivers Deposited in OceansOceans
• Provide best evidence of terrestrial erosion
• Today the largest mass of young sediment is found south of the Himalaya Mts. In the Indian Ocean
Rate of sediment influxhas increased tenfold
in the last 40 Myr

Cause of High Sediment InfluxCause of High Sediment Influx
• Southern Himalayan margin of the Tibetan Plateau is has very steep terrain
• The large size of the Tibetan Plateau creates its own weather, including the powerful Asian Monsoons.

Rates of Physical WeatheringRates of Physical Weathering
• Definitive global rates can’t be determined from ocean sediments.– Much of eroded terrestrial sediments are
consumed by subduction– Some sediments are reworked after
deposition• Skews compilations of deposition rates towards
younger ages

SummarySummary• Rapid deposition of huge amounts of Himalayan
sediment– Supports the hypothesis that physical weathering is
stronger today on a global basis than in the past
• This conclusion is unproved due to:– Loss of sediment by subduction into ocean trenches– Assuming subduction is occurring a similar rates as in
the past, erosion rates are probably higher because of the extra sediment from the eroding plateau.

Prediction 2Prediction 2
Unusual Chemical WeatheringUnusual Chemical Weathering

Quantifying Rates of Chemical Quantifying Rates of Chemical WeatheringWeathering
• Amount of ions dissolved and transported by rivers is measured on a regional basis.– Reflects the amount of weathering in each river’s
watershed.
• Measurement Difficulty– Human interference with the natural weathering process– Ions from hydrolysis of silicate rocks and rapid
carbonation of carbonate rocks are difficult to distinguish• Only hydrolysis affects the atmospheric CO2 balance
– It’s difficult to study enough rivers to accurately estimate the global weathering rate.
• Too many rivers contribute to the global total

Inferring Chemical Weathering Rates:Inferring Chemical Weathering Rates:Suspended Sediments in RiversSuspended Sediments in Rivers
• Tibetan-Himalayan complex– Largest concentrations of suspended load– Very high elevations compared to previous intervals

Inferring Chemical Weathering Rates:Inferring Chemical Weathering Rates:Suspended Sediments in RiversSuspended Sediments in Rivers
• Steep slopes with unusually large exposure of fresh rocks– Receive some of the most intense rainfall on Earth, especially the
Tibetan Plateau which itself generates monsoon rains

SummarySummary
• It is inferred that this combination of favorable factors should promote unusually rapid chemical weathering with increased CO2 removal from the atmosphere.
• This is only inference and is not proof.

Was it the Ocean Heat Transport Hypothesis?
Changes in Oceanic Gateways

Oceanic GatewaysOceanic Gateways
• Narrow passages linking major ocean basins– Changes in their configuration alters amount
of seawater exchanged between oceans• Affects the heat and salt carried by seawater
• O-GCMs– Ocean General Circulation Models– Used to study two major gateway changes
during the last 55 Myr

Opening of Ocean Circulation Opening of Ocean Circulation Around AntarcticaAround Antarctica
Drake’s PassageDrake’s Passage
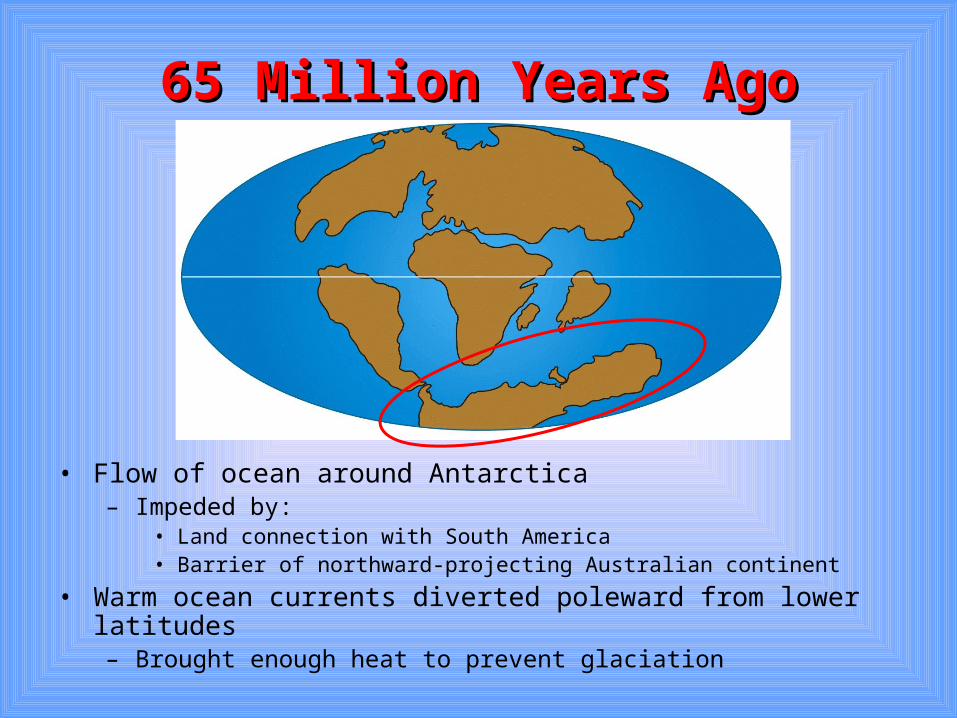
65 Million Years Ago65 Million Years Ago
• Flow of ocean around Antarctica– Impeded by:
• Land connection with South America• Barrier of northward-projecting Australian continent
• Warm ocean currents diverted poleward from lower latitudes– Brought enough heat to prevent glaciation
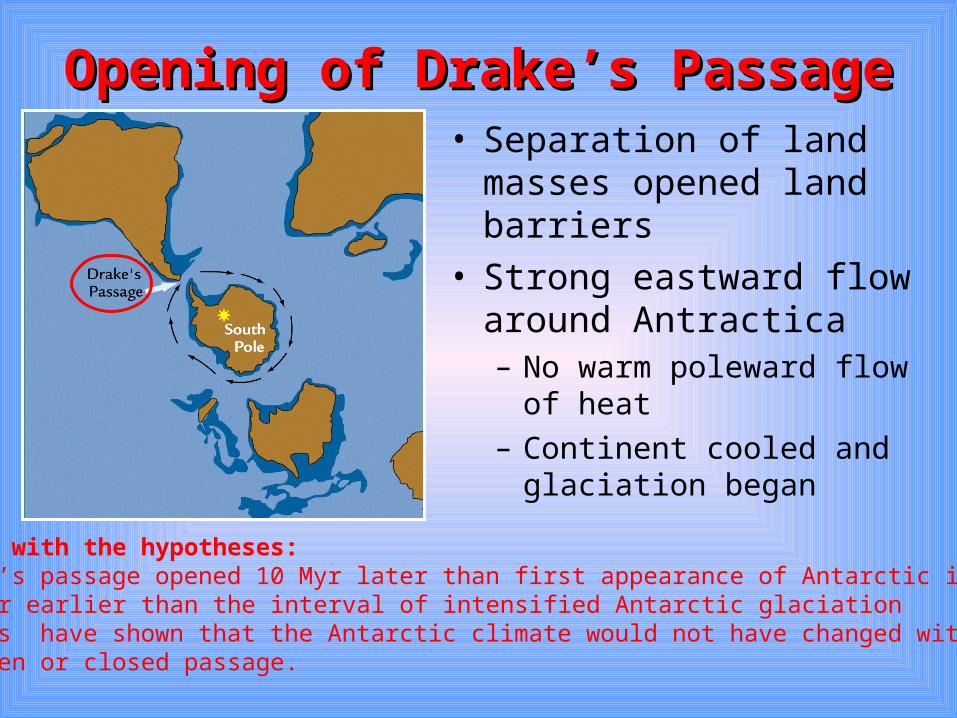
Opening of Drake’s PassageOpening of Drake’s Passage• Separation of land
masses opened land barriers
• Strong eastward flow around Antractica– No warm poleward flow of
heat– Continent cooled and
glaciation beganProblems with the hypotheses:• Drake’s passage opened 10 Myr later than first appearance of Antarctic ice and 10 Myr earlier than the interval of intensified Antarctic glaciation• O-GCMs have shown that the Antarctic climate would not have changed with an open or closed passage.

Closing of the Central Closing of the Central American SeawayAmerican Seaway
Links Two EventsLinks Two Events

Closing of the Central American Closing of the Central American SeawaySeaway
• Closing of the deep ocean passage separating North America and South America– During last 10 Myr– Created the Central
American part of the Cordilleran mountain chain
– Final closure occurred before 4 Myr ago

First large-scale North First large-scale North American glaciation about 2.7 American glaciation about 2.7
Mry AgoMry Ago

Closing of the Isthmus of Closing of the Isthmus of PanamaPanama
• Warm, salty water– Previously driven
out of the tropical Atlantic and into the eastern Pacific by the trade winds
– Redirected towards into the Gulf Stream and towards the high latitudes

Closing of the Isthmus of Closing of the Isthmus of PanamaPanama
• Reduced the extent of sea ice due to increased salinity
• More moisture available to nearby landmasses– Increased evaporation
• Triggered growth of ice sheets as increased moisture precipitated

Contradictions by O-GCMsContradictions by O-GCMs
• While GCMs confirm the prediction – of redirection of warm, salty water northward
in the Atlantic by the closing of the Isthmus
• They indicate that the warmer water would have– Transferred a large amount of heat to the
atmosphere, warming the regions where ice sheets eventually formed
• This would have increased summer melting, opposing conditions needed for glaciation
Comments on the Gateway Comments on the Gateway HypothesesHypotheses
• Differing assumptions reflect disagreements among scientists as to how oceans affect the mass balance of ice sheets
• Neither set of model experiments supports the hypotheses but– GCMs are still at an early stage of development
• Whether or not gateway changes affect climate on a global scale, they definitely alter production and flow of deep and bottom ocean water.

Brief Tectonic-Scale Brief Tectonic-Scale Climate ChangesClimate Changes
• Volcanic Aerosols
• Burial of Organic Carbon

Aerosols from Volcanic Aerosols from Volcanic EruptionsEruptions

Locations of Earth’s VolcanoesLocations of Earth’s Volcanoes
• Earth’s active volcanoes mainly occur in regions of convergent plate boundaries

Plate Boundary MapPlate Boundary Map

Volcanic AerosolsVolcanic Aerosols
Short-term climate cooling due to the blocking of insolation
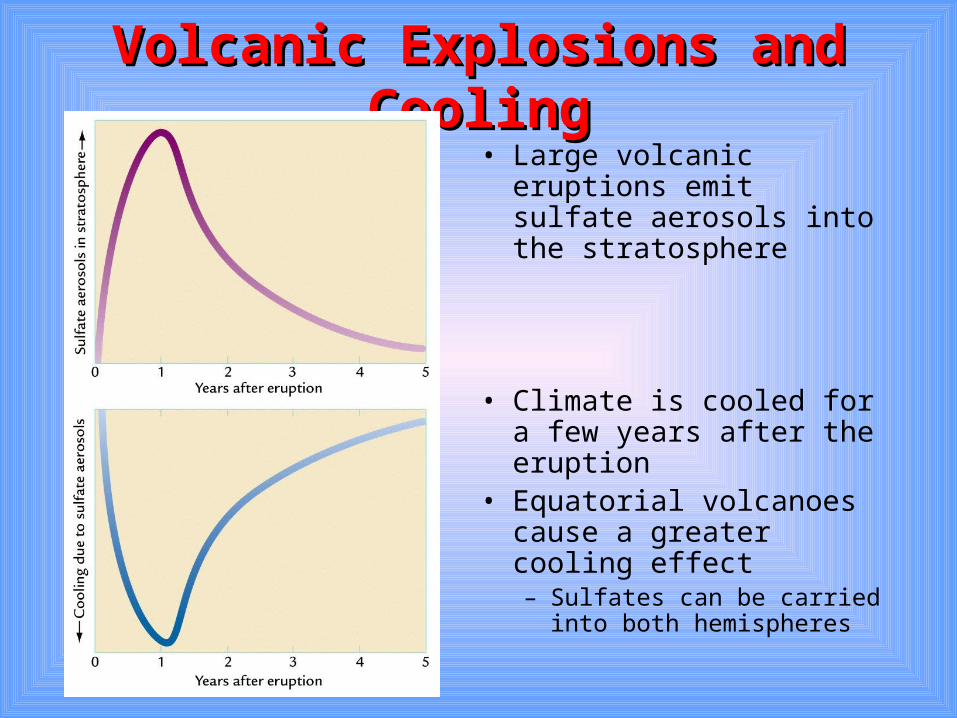
Volcanic Explosions and CoolingVolcanic Explosions and Cooling• Large volcanic eruptions
emit sulfate aerosols into the stratosphere
• Climate is cooled for a few years after the eruption
• Equatorial volcanoes cause a greater cooling effect– Sulfates can be carried into
both hemispheres

Mt. Pinatubo – 1991 EruptionMt. Pinatubo – 1991 Eruption

Cooling After the EruptionCooling After the Eruption

Long-Term Cooling by Long-Term Cooling by Volcanoes?Volcanoes?
• Probably not . . .
• Cooling by volcanic sulfates would eventually be overwhelmed by warming effects of:– Volcanic emissions of CO2 (BLAG Hypothesis)
• Remain in atmosphere longer than sulfates• Effects should dominate over intervals longer than a
century
Burial of Organic CarbonBurial of Organic Carbon
Cooler climate due to less COCooler climate due to less CO22
in the atmospherein the atmosphere

Organic CarbonOrganic Carbon
• Potential to affect climate relatively rapidly
• Large amounts can be quickly buried in the sedimentary record.– This would result in rapid reductions in
atmospheric CO2 levels.

Burial of carbon can be Burial of carbon can be increased by:increased by:

Increase in Oceanic UpwellingIncrease in Oceanic Upwelling
• Stronger winds result in greater upwelling – Could be caused by long- term climate cooling
• Increased carbon production (plankton)• Carbon is buried in coastal sediment when
plankton die, reducing atmospheric CO2 levels.
• Referred to as the Monterey Hypothesis– Large increase in δ18O values 13 Myr ago
• Followed an interval when carbon-rich sediments were deposited in shallow waters around the margins of the Pacific Ocean, including the Monterey coast of CA.

Greater Supply of Carbon-Rich Greater Supply of Carbon-Rich SedimentSediment
• Increased carbon burial in the oceans– Greater supply of carbon eroded from older
terrestrial sedimentary rocks (e.g., in the Himalayas)
• From run-off which eventually becomes buried in sediment

Wetter Climates on Continental Wetter Climates on Continental MarginsMargins
• Flat topography– Favors formation of swampy/marshy
conditions
• Organic matter is formed in swamps and is deposited out into sediment.

Uplift Hypothesis SummaryUplift Hypothesis Summary
Positive v. Negative FeedbackPositive v. Negative Feedback
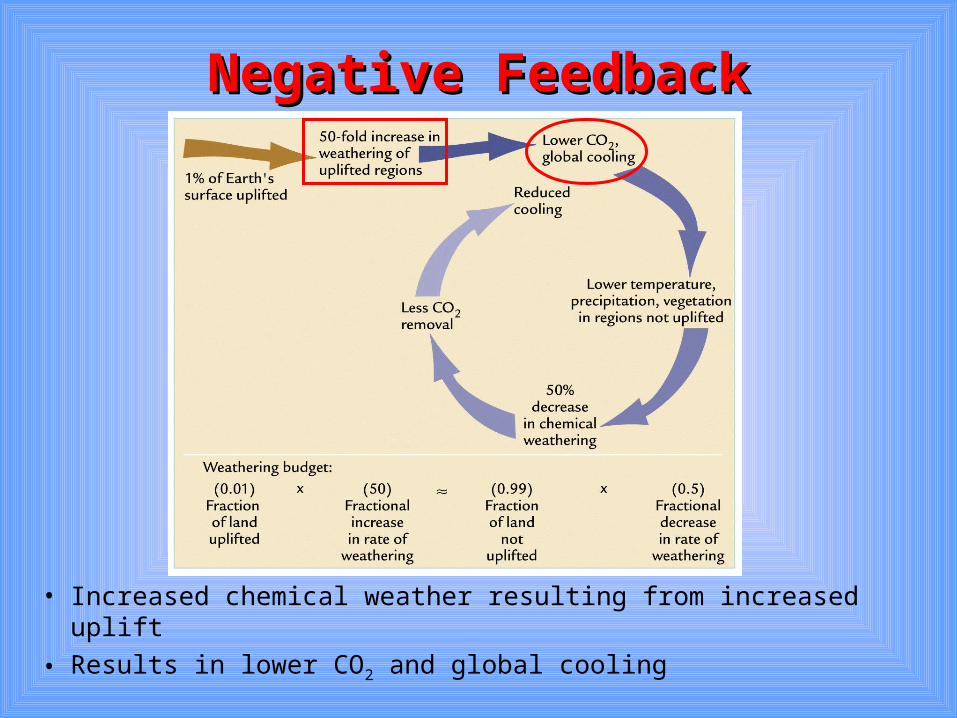
Negative FeedbackNegative Feedback
• Increased chemical weather resulting from increased uplift
• Results in lower CO2 and global cooling

Negative FeedbackNegative Feedback
• Results in lower temperatures, precipitation, and vegetation causing a decrease in chemical weathering

Negative FeedbackNegative Feedback
• Reduction in chemical weathering reduces CO2 removal from the atmosphere– This reduces the initial cooling due to uplift

Positive FeedbackPositive Feedback• Uplift causes increased
weathering resulting in global cooling– Increased glaciers on Earth– Cause increased rock
grinding (weathering and fragmentation)
– More fresh materials increases weathering rates
• Removes even more CO2 from the atmosphere
• Increases global cooling