Bachelor Thesis Project Container Hosts as Virtual...
69
Author: Andreas Aspernäs Author: Mattias Nensén Supervisor: Jacob Lindehoff Semester: VT 2016 Subject: Computer Science Bachelor Thesis Project Container Hosts as Virtual Machines - A performance study
Transcript of Bachelor Thesis Project Container Hosts as Virtual...
Author: Andreas AspernäsAuthor: Mattias NensénSupervisor: Jacob LindehoffSemester: VT 2016Subject: Computer Science
Bachelor Thesis Project
Container Hosts as Virtual Machines- A performance study
Abstract
Virtualization is a technique used to abstract the operating system from the hard-ware. The primary gains of virtualization is increased server consolidation, leadingto greater hardware utilization and infrastructure manageability. Another technologythat can be used to achieve similar goals is containerization. Containerization is anoperating-system level virtualization technique which allows applications to run inpartial isolation on the same hardware. Containerized applications share the sameLinux kernel but run in packaged containers which includes just enough binaries andlibraries for the application to function. In recent years it has become more commonto see hardware virtualization beneath the container host operating systems. An up-coming technology to further this development is VMware’s vSphere Integrated Con-tainers which aims to integrate management of Linux Containers with the vSphere(a hardware virtualization platform by VMware) management interface. With thesetechnologies as background we set out to measure the impact of hardware virtual-ization on Linux Container performance by running a suite of macro-benchmarkson a LAMP-application stack. We perform the macro-benchmarks on three differentoperating systems (CentOS, CoreOS and Photon OS) in order to see if the choice ofcontainer host affects the performance. Our results show a decrease in performancewhen comparing a hardware virtualized container host to a container hosts runningdirectly on the hardware. However, the impact on containerized application perfor-mance can vary depending on the actual application, the choice of operating systemand even the type of operation performed. It is therefore important to consider thesethree items before implementing container hosts as virtual machines.
Keywords: Virtualization, Containerization, Cloud Computing, Container Host,Linux Container, Performance, Virtual Machine, Wordpress, Linux, Apache,MySQL, PHP, CoreOS, Photon OS, VMware, LAMP, Software Container, Docker,Hardware Virtualization, Full Virtualization
PrefaceWe would like to thank our supervisor Jacob Lindehoff for taking the time to reviewand assist our work. Our thanks goes to Linnaeus University for allowing us to use thelaboratory in which our work was conducted. The laboratory has been an invaluable assetfor developing our skills when it comes to virtualization and server infrastructure. Wewould also like to give a shout out to the software companies across the world whichallows universities to use their software for educational purposes.
Contents
1 Introduction 11.1 Background . . . . . . . . . . . . . . . . . . . . . . . . . . . . . . . . . 11.2 Previous research . . . . . . . . . . . . . . . . . . . . . . . . . . . . . . 11.3 Problem formulation . . . . . . . . . . . . . . . . . . . . . . . . . . . . 21.4 Motivation . . . . . . . . . . . . . . . . . . . . . . . . . . . . . . . . . . 31.5 Research Question . . . . . . . . . . . . . . . . . . . . . . . . . . . . . 31.6 Scope/Limitation . . . . . . . . . . . . . . . . . . . . . . . . . . . . . . 31.7 Target group . . . . . . . . . . . . . . . . . . . . . . . . . . . . . . . . . 41.8 Outline . . . . . . . . . . . . . . . . . . . . . . . . . . . . . . . . . . . 4
2 Technical background 52.1 Cloud Computing . . . . . . . . . . . . . . . . . . . . . . . . . . . . . . 52.2 Virtualization . . . . . . . . . . . . . . . . . . . . . . . . . . . . . . . . 5
2.2.1 Hardware Virtualization . . . . . . . . . . . . . . . . . . . . . . 62.2.2 Containerization . . . . . . . . . . . . . . . . . . . . . . . . . . 8
2.3 VMware vSphere . . . . . . . . . . . . . . . . . . . . . . . . . . . . . . 92.4 Photon OS . . . . . . . . . . . . . . . . . . . . . . . . . . . . . . . . . . 92.5 CoreOS . . . . . . . . . . . . . . . . . . . . . . . . . . . . . . . . . . . 102.6 CentOS . . . . . . . . . . . . . . . . . . . . . . . . . . . . . . . . . . . 102.7 Docker . . . . . . . . . . . . . . . . . . . . . . . . . . . . . . . . . . . . 102.8 Apache . . . . . . . . . . . . . . . . . . . . . . . . . . . . . . . . . . . 102.9 Apache JMeter . . . . . . . . . . . . . . . . . . . . . . . . . . . . . . . 112.10 MySQL . . . . . . . . . . . . . . . . . . . . . . . . . . . . . . . . . . . 11
3 Method 123.1 Scientific approach . . . . . . . . . . . . . . . . . . . . . . . . . . . . . 123.2 Method description . . . . . . . . . . . . . . . . . . . . . . . . . . . . . 12
3.2.1 Topology . . . . . . . . . . . . . . . . . . . . . . . . . . . . . . 133.2.2 Prestudy: Hardware I/O Benchmarks . . . . . . . . . . . . . . . 143.2.3 HTTP Requests . . . . . . . . . . . . . . . . . . . . . . . . . . . 143.2.4 SQL Queries . . . . . . . . . . . . . . . . . . . . . . . . . . . . 16
3.3 Method Discussion . . . . . . . . . . . . . . . . . . . . . . . . . . . . . 163.4 Reliability and Validity . . . . . . . . . . . . . . . . . . . . . . . . . . . 17
4 Results and Analysis 184.1 HTTP Requests . . . . . . . . . . . . . . . . . . . . . . . . . . . . . . . 184.2 SQL Queries . . . . . . . . . . . . . . . . . . . . . . . . . . . . . . . . 20
5 Discussion 22
6 Conclusion 236.1 Future research . . . . . . . . . . . . . . . . . . . . . . . . . . . . . . . 25
References 26
A Appendix A: System Documentation 1A.1 Physical Configuration . . . . . . . . . . . . . . . . . . . . . . . . . . . 1A.2 Network Topology . . . . . . . . . . . . . . . . . . . . . . . . . . . . . 2
A.3 Versions . . . . . . . . . . . . . . . . . . . . . . . . . . . . . . . . . . . 3A.4 Prestudy: Hardware Benchmarks . . . . . . . . . . . . . . . . . . . . . . 3A.5 Docker Commands . . . . . . . . . . . . . . . . . . . . . . . . . . . . . 4A.6 PHP Scripts . . . . . . . . . . . . . . . . . . . . . . . . . . . . . . . . . 5
A.6.1 SQL SELECT . . . . . . . . . . . . . . . . . . . . . . . . . . . 5A.6.2 SQL INSERT . . . . . . . . . . . . . . . . . . . . . . . . . . . . 6
B Appendix B: JMeter Results 7B.1 CentOS . . . . . . . . . . . . . . . . . . . . . . . . . . . . . . . . . . . 7B.2 CoreOS . . . . . . . . . . . . . . . . . . . . . . . . . . . . . . . . . . . 13B.3 VMCentOS . . . . . . . . . . . . . . . . . . . . . . . . . . . . . . . . . 19B.4 VMCoreOS . . . . . . . . . . . . . . . . . . . . . . . . . . . . . . . . . 25B.5 VMPhoton . . . . . . . . . . . . . . . . . . . . . . . . . . . . . . . . . . 31
C Appendix C: SQL Query Results 37
1 Introduction
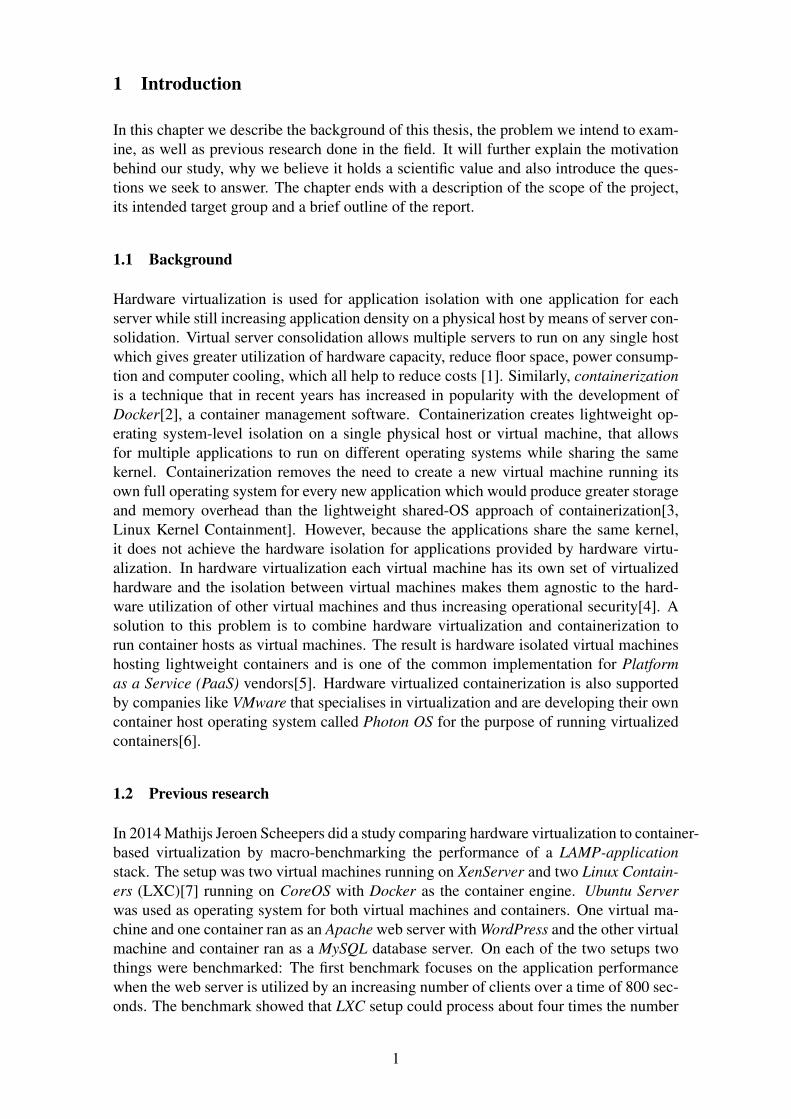
In this chapter we describe the background of this thesis, the problem we intend to exam-ine, as well as previous research done in the field. It will further explain the motivationbehind our study, why we believe it holds a scientific value and also introduce the ques-tions we seek to answer. The chapter ends with a description of the scope of the project,its intended target group and a brief outline of the report.
1.1 Background
Hardware virtualization is used for application isolation with one application for eachserver while still increasing application density on a physical host by means of server con-solidation. Virtual server consolidation allows multiple servers to run on any single hostwhich gives greater utilization of hardware capacity, reduce floor space, power consump-tion and computer cooling, which all help to reduce costs [1]. Similarly, containerizationis a technique that in recent years has increased in popularity with the development ofDocker[2], a container management software. Containerization creates lightweight op-erating system-level isolation on a single physical host or virtual machine, that allowsfor multiple applications to run on different operating systems while sharing the samekernel. Containerization removes the need to create a new virtual machine running itsown full operating system for every new application which would produce greater storageand memory overhead than the lightweight shared-OS approach of containerization[3,Linux Kernel Containment]. However, because the applications share the same kernel,it does not achieve the hardware isolation for applications provided by hardware virtu-alization. In hardware virtualization each virtual machine has its own set of virtualizedhardware and the isolation between virtual machines makes them agnostic to the hard-ware utilization of other virtual machines and thus increasing operational security[4]. Asolution to this problem is to combine hardware virtualization and containerization torun container hosts as virtual machines. The result is hardware isolated virtual machineshosting lightweight containers and is one of the common implementation for Platformas a Service (PaaS) vendors[5]. Hardware virtualized containerization is also supportedby companies like VMware that specialises in virtualization and are developing their owncontainer host operating system called Photon OS for the purpose of running virtualizedcontainers[6].
1.2 Previous research
In 2014 Mathijs Jeroen Scheepers did a study comparing hardware virtualization to container-based virtualization by macro-benchmarking the performance of a LAMP-applicationstack. The setup was two virtual machines running on XenServer and two Linux Contain-ers (LXC)[7] running on CoreOS with Docker as the container engine. Ubuntu Serverwas used as operating system for both virtual machines and containers. One virtual ma-chine and one container ran as an Apache web server with WordPress and the other virtualmachine and container ran as a MySQL database server. On each of the two setups twothings were benchmarked: The first benchmark focuses on the application performancewhen the web server is utilized by an increasing number of clients over a time of 800 sec-onds. The benchmark showed that LXC setup could process about four times the number
1
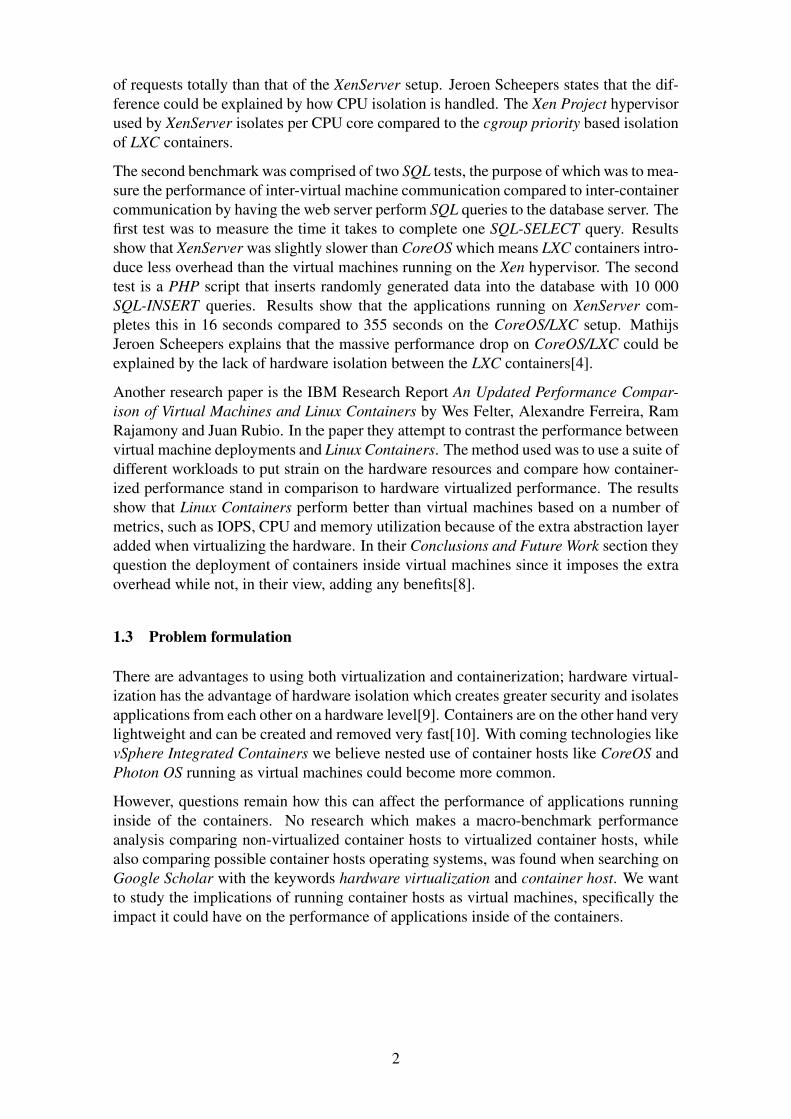
of requests totally than that of the XenServer setup. Jeroen Scheepers states that the dif-ference could be explained by how CPU isolation is handled. The Xen Project hypervisorused by XenServer isolates per CPU core compared to the cgroup priority based isolationof LXC containers.
The second benchmark was comprised of two SQL tests, the purpose of which was to mea-sure the performance of inter-virtual machine communication compared to inter-containercommunication by having the web server perform SQL queries to the database server. Thefirst test was to measure the time it takes to complete one SQL-SELECT query. Resultsshow that XenServer was slightly slower than CoreOS which means LXC containers intro-duce less overhead than the virtual machines running on the Xen hypervisor. The secondtest is a PHP script that inserts randomly generated data into the database with 10 000SQL-INSERT queries. Results show that the applications running on XenServer com-pletes this in 16 seconds compared to 355 seconds on the CoreOS/LXC setup. MathijsJeroen Scheepers explains that the massive performance drop on CoreOS/LXC could beexplained by the lack of hardware isolation between the LXC containers[4].
Another research paper is the IBM Research Report An Updated Performance Compar-ison of Virtual Machines and Linux Containers by Wes Felter, Alexandre Ferreira, RamRajamony and Juan Rubio. In the paper they attempt to contrast the performance betweenvirtual machine deployments and Linux Containers. The method used was to use a suite ofdifferent workloads to put strain on the hardware resources and compare how container-ized performance stand in comparison to hardware virtualized performance. The resultsshow that Linux Containers perform better than virtual machines based on a number ofmetrics, such as IOPS, CPU and memory utilization because of the extra abstraction layeradded when virtualizing the hardware. In their Conclusions and Future Work section theyquestion the deployment of containers inside virtual machines since it imposes the extraoverhead while not, in their view, adding any benefits[8].
1.3 Problem formulation
There are advantages to using both virtualization and containerization; hardware virtual-ization has the advantage of hardware isolation which creates greater security and isolatesapplications from each other on a hardware level[9]. Containers are on the other hand verylightweight and can be created and removed very fast[10]. With coming technologies likevSphere Integrated Containers we believe nested use of container hosts like CoreOS andPhoton OS running as virtual machines could become more common.
However, questions remain how this can affect the performance of applications runninginside of the containers. No research which makes a macro-benchmark performanceanalysis comparing non-virtualized container hosts to virtualized container hosts, whilealso comparing possible container hosts operating systems, was found when searching onGoogle Scholar with the keywords hardware virtualization and container host. We wantto study the implications of running container hosts as virtual machines, specifically theimpact it could have on the performance of applications inside of the containers.
2
1.4 Motivation
We believe combining both hardware virtualization and containerization could potentiallyallow better utilization of the hardware while still be able to provide hardware isolationbetween applications or groups of applications. There is also value in being able to con-solidate all servers unto one infrastructure and today’s containerization clusters only sup-port Linux. In a hardware virtualization infrastructure there’s an option to have Windowsservers running beside container hosts. However, there remains a question on how theperformance of applications could be affected when combing these two technologies, andusing them on different operating systems. These are questions we deem important forany IT-administrators looking to implement these kinds of solutions as a decrease in per-formance could hurt the benefits of using containers inside of virtual machines. Evenif virtual container hosts is a common implementation among PaaS vendors[5] and andtechnologies like vSphere Integrated Containers are being developed, IBM claims in areport that there would be no benefit in running containers inside virtual machines[8] andthe article Why Containers Instead of Hypervisors? by Steven J Vaughan-Nichols[11] ar-gues that containers are better then virtual machines because of greater application densitywhen using containers, particular in application development. As we found no researchinto the subject and find insufficient consensus to rule out the implementation entirely,we believe the implications of using virtual container hosts needs to be further investi-gated.
1.5 Research Question
Based on work by Mathijs Jeroen Scheepers[4] mentioned in Previous Research, serversetups using hardware virtualization is expected to bring additional overhead comparedto letting software containers run on a non-virtualized implementation. The reason be-ing that the hypervisor adds an additional abstraction layer. Making a macro-benchmarkperformance test comparing non-virtualized container hosts to virtualized container hostsby measuring the performance of the applications inside of the containers, the researchquestions we will attempt to answer are as follows:
RQ1 How will containerized application performance be affected by:a) virtualized and non-virtualized container hosts?b) different container host operating system?
1.6 Scope/Limitation
The scope of this thesis project is limited to answering the specific research questionsmentioned in the previous Research Question chapter. Macro-benchmark performancetests will be conducted with the primary goal of comparing how well an Apache andWordpress-application stack runs in containers on CentOS, CoreOS and Photon OS, inboth in a bare metal and virtualized environment. Photon OS will however not run non-virtualized because it is designed for virtualization. When we ask the question How willcontainerized application performance be affected by: b) different container host operat-ing system? we are only interested in seeing the differences. A deeper discussion aboutthe reasons behind the differences is beyond the scope of this thesis project.
3
In our motivation we point out that using virtual container hosts is a common implemen-tation among PaaS vendors as one argument why this is an interesting research, howeverwe are not looking to answer any question to why they are doing to, but rather wouldcould happen when one does.
1.7 Target group
The target group is administrators of virtualization infrastructures and IT-technicians whichare interested in virtualization concepts and/or may be in the process of or are consideringto move from a non-virtualized containerization approach to a hardware virtualized ap-proach of running container hosts. The information we wish to provide is the differencein performance of the two and the performance difference between individual containerhosts.
1.8 Outline
This chapter outlines the different sections of the project report. It will start with thesection Technical Background which aims to give the necessary background informationabout virtualization and technologies used to answer the research questions outlined in thesection Research Questions. Next is the Method section which explains the method usedto answer the research questions. Following the Method section is the Results sectionwhich contains the results of our experiments as described in the Method section, andthe Analysis section which evaluates the results. The report ends with Discussion whichdiscusses our findings, Conclusion where we present our conclusions and Future researchpresent possible areas outside the limit of this thesis project that could be worthy of futureresearch.
4
2 Technical background
This chapter intends to give a description of the technologies used in this thesis project.It also aims to give a theoretical background for the subjects which are addressed in thisreport. The purpose is to give the reader a basic understanding of the technologies andconcepts to create a baseline of discussion.
2.1 Cloud Computing
With evolving network technology and the expansion of the Internet it is now possibleto centralize computing resources, a concept called cloud computing. The National In-stitute of Standards and Technology (NIST) has developed a document defining cloudcomputing. They define cloud computing as "a model for enabling ubiquitous, conve-nient, on-demand network access to a shared pool of configurable computing resources"and describe its essential characteristics. The primary characteristics that NIST describesare the ability for a consumer to provision computer resources with the service provider,the ability to reach resources through network access, the ability to pool resources usinga multi-tenant model, scalability and monitoring of resource usage. Cloud computing canbe available through several different service models. The Software-as-a-Service servicemodel is to deliver application access to users without giving them insight to the underly-ing platform on which the application is running. Another service model is Platform-as-a-Service which lets consumers deploy their own services on the centralized platform butwith no insight into the underlying infrastructure on which the services are running. Thelast service model is Infrastructure-as-a-Service which lets consumers set up their ownvirtual data center with control over operating systems and service deployment. The con-sumer has no control over the underlying cloud infrastructure. [12] Besides the need forthe networking technology enabling access to these resources there has to be somethingenabling the isolation and management of the different resources running in the cloud.One such technology which is widely used is virtualization.
2.2 Virtualization
The virtualization concept is believed to originate in the 1960s and early 1970s. The pio-neers were International Business Machines Corporation, IBM, which spent considerableeffort trying to develop efficient time-sharing technology for their mainframes. Time-sharing enables the computing power of a mainframe to be divided into shares whichcould be distributed to different groups of users[13]. Skipping ahead to the late 1990s,the technology company VMware developed the first virtualization products which couldvirtualize the x86 architecture[14, The Challenges of x86 Hardware Virtualization]. Withx86 virtualization the hardware and operating system was split in two by an abstractionlayer. The abstraction layer allows the operating systems and applications running on thephysical machine to become hardware agnostic and with that comes increased agility andbusiness continuity. Services no longer needs to be taken down for hardware maintenanceor backups because the applications can easily be migrated to other physical hosts orcopied. In a white paper from year 2007 VMware stated it had customers with productionservers which had been running for over three years without downtime[14, Overview ofx86 Virtualization].
5
2.2.1 Hardware Virtualization
Hardware virtualization is a technology which creates an abstraction layer between thehardware and the operating system. It is done by software called hypervisors. Hypervisorscome in different forms but there are two primary types; Type-1 hypervisors and Type-2hypervisors. Type-1 hypervisors are also referred to as bare-metal hypervisors becausethey run directly on the hardware. Examples of Type-1 hypervisors are Microsoft Hyper-V, VMware ESXi and Citrix XenServer. Type-2 hypervisors run on a host operating systemand is therefore come with increased overhead for the virtual machines. Examples ofType-2 hypervisors are VMware Workstation and Oracle VM VirtualBox[15].
The primary functionality of hardware virtualization is to make multiple operating sys-tems and applications runnable in parallel on the same hardware by creating virtual in-stances of the hardware for each virtual machine and thereby make cost savings by in-creasing hardware utilization[4]. The earliest server-side product which managed to dothis was VMware ESX. It used a custom-built kernel called VMkernel which was de-signed to run and manage virtual machine workloads. The VMkernel itself runs a Vir-tual Machine Monitor, VMM, for each virtual machine in the system. The VMM isresponsible for implementing the virtual hardware and to execute the virtual machine.
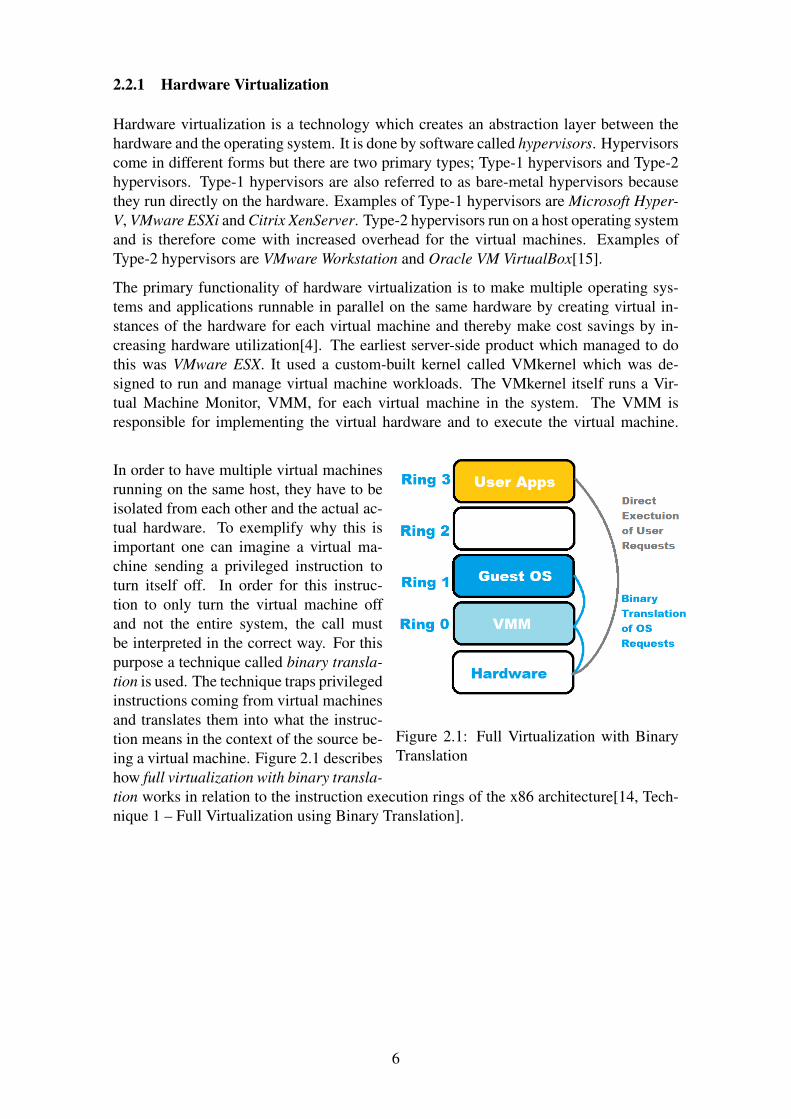
Figure 2.1: Full Virtualization with BinaryTranslation
In order to have multiple virtual machinesrunning on the same host, they have to beisolated from each other and the actual ac-tual hardware. To exemplify why this isimportant one can imagine a virtual ma-chine sending a privileged instruction toturn itself off. In order for this instruc-tion to only turn the virtual machine offand not the entire system, the call mustbe interpreted in the correct way. For thispurpose a technique called binary transla-tion is used. The technique traps privilegedinstructions coming from virtual machinesand translates them into what the instruc-tion means in the context of the source be-ing a virtual machine. Figure 2.1 describeshow full virtualization with binary transla-tion works in relation to the instruction execution rings of the x86 architecture[14, Tech-nique 1 – Full Virtualization using Binary Translation].
6
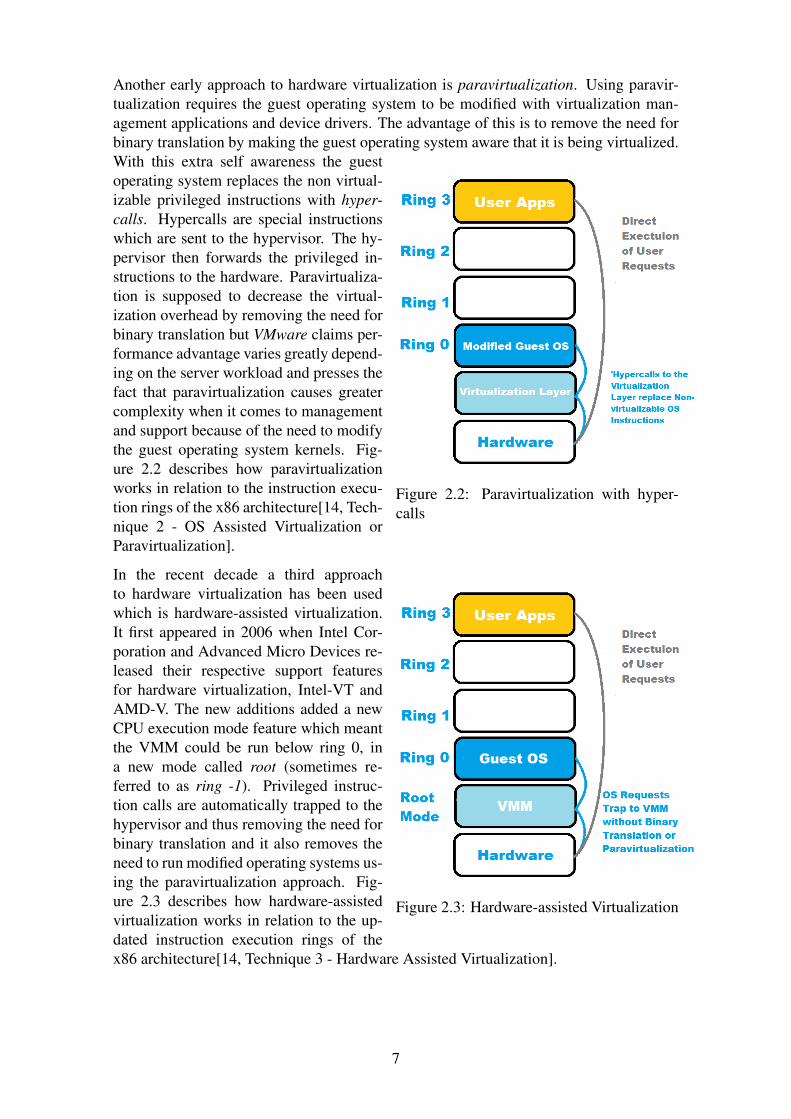
Another early approach to hardware virtualization is paravirtualization. Using paravir-tualization requires the guest operating system to be modified with virtualization man-agement applications and device drivers. The advantage of this is to remove the need forbinary translation by making the guest operating system aware that it is being virtualized.
Figure 2.2: Paravirtualization with hyper-calls
With this extra self awareness the guestoperating system replaces the non virtual-izable privileged instructions with hyper-calls. Hypercalls are special instructionswhich are sent to the hypervisor. The hy-pervisor then forwards the privileged in-structions to the hardware. Paravirtualiza-tion is supposed to decrease the virtual-ization overhead by removing the need forbinary translation but VMware claims per-formance advantage varies greatly depend-ing on the server workload and presses thefact that paravirtualization causes greatercomplexity when it comes to managementand support because of the need to modifythe guest operating system kernels. Fig-ure 2.2 describes how paravirtualizationworks in relation to the instruction execu-tion rings of the x86 architecture[14, Tech-nique 2 - OS Assisted Virtualization orParavirtualization].
Figure 2.3: Hardware-assisted Virtualization
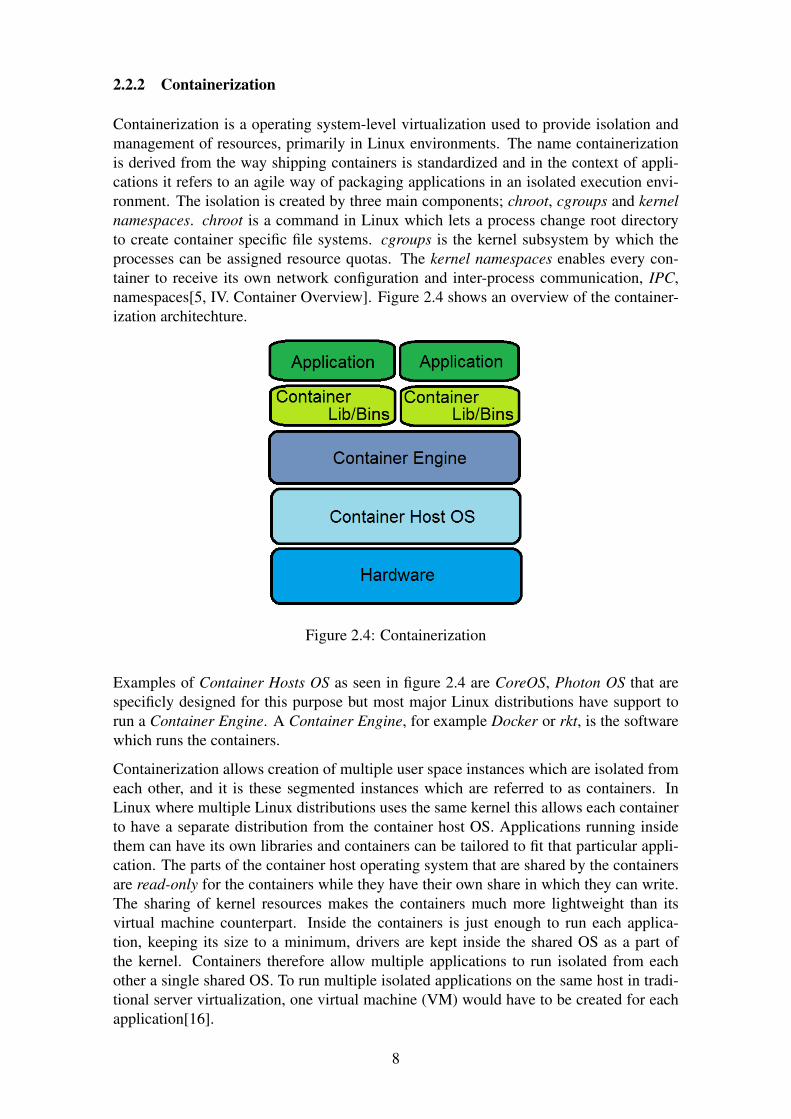
In the recent decade a third approachto hardware virtualization has been usedwhich is hardware-assisted virtualization.It first appeared in 2006 when Intel Cor-poration and Advanced Micro Devices re-leased their respective support featuresfor hardware virtualization, Intel-VT andAMD-V. The new additions added a newCPU execution mode feature which meantthe VMM could be run below ring 0, ina new mode called root (sometimes re-ferred to as ring -1). Privileged instruc-tion calls are automatically trapped to thehypervisor and thus removing the need forbinary translation and it also removes theneed to run modified operating systems us-ing the paravirtualization approach. Fig-ure 2.3 describes how hardware-assistedvirtualization works in relation to the up-dated instruction execution rings of thex86 architecture[14, Technique 3 - Hardware Assisted Virtualization].
7
2.2.2 Containerization
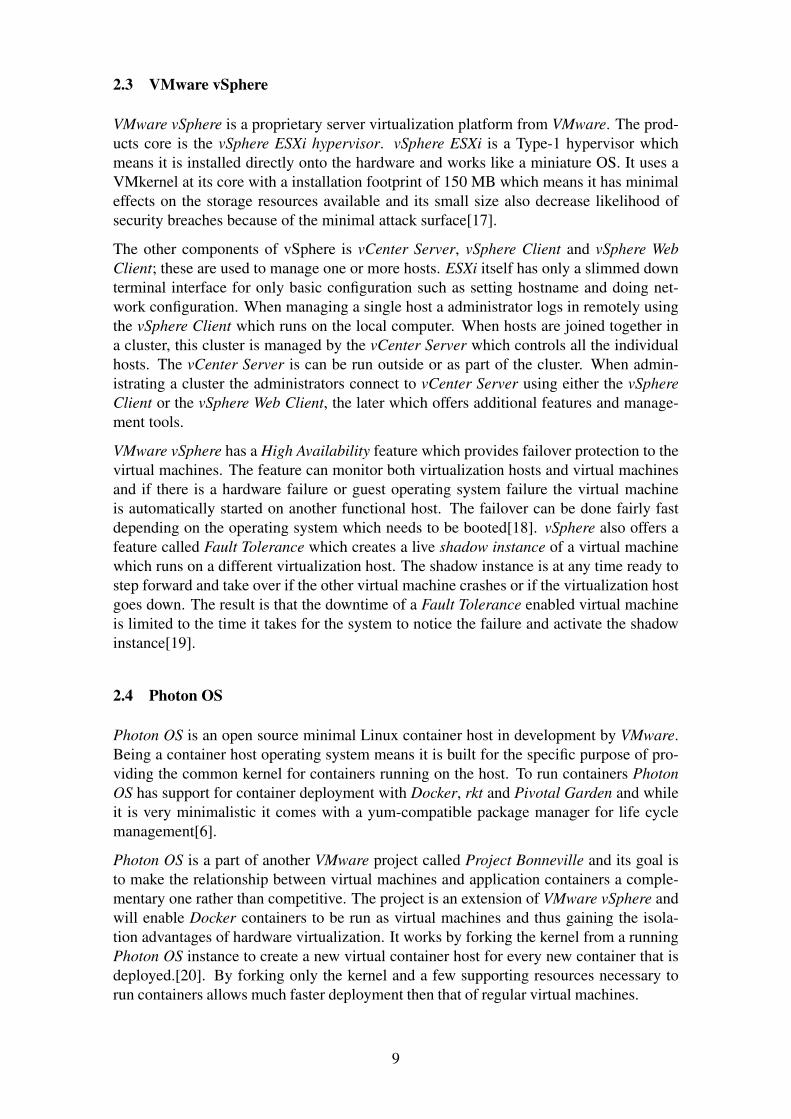
Containerization is a operating system-level virtualization used to provide isolation andmanagement of resources, primarily in Linux environments. The name containerizationis derived from the way shipping containers is standardized and in the context of appli-cations it refers to an agile way of packaging applications in an isolated execution envi-ronment. The isolation is created by three main components; chroot, cgroups and kernelnamespaces. chroot is a command in Linux which lets a process change root directoryto create container specific file systems. cgroups is the kernel subsystem by which theprocesses can be assigned resource quotas. The kernel namespaces enables every con-tainer to receive its own network configuration and inter-process communication, IPC,namespaces[5, IV. Container Overview]. Figure 2.4 shows an overview of the container-ization architechture.
Figure 2.4: Containerization
Examples of Container Hosts OS as seen in figure 2.4 are CoreOS, Photon OS that arespecificly designed for this purpose but most major Linux distributions have support torun a Container Engine. A Container Engine, for example Docker or rkt, is the softwarewhich runs the containers.
Containerization allows creation of multiple user space instances which are isolated fromeach other, and it is these segmented instances which are referred to as containers. InLinux where multiple Linux distributions uses the same kernel this allows each containerto have a separate distribution from the container host OS. Applications running insidethem can have its own libraries and containers can be tailored to fit that particular appli-cation. The parts of the container host operating system that are shared by the containersare read-only for the containers while they have their own share in which they can write.The sharing of kernel resources makes the containers much more lightweight than itsvirtual machine counterpart. Inside the containers is just enough to run each applica-tion, keeping its size to a minimum, drivers are kept inside the shared OS as a part ofthe kernel. Containers therefore allow multiple applications to run isolated from eachother a single shared OS. To run multiple isolated applications on the same host in tradi-tional server virtualization, one virtual machine (VM) would have to be created for eachapplication[16].
8
2.3 VMware vSphere
VMware vSphere is a proprietary server virtualization platform from VMware. The prod-ucts core is the vSphere ESXi hypervisor. vSphere ESXi is a Type-1 hypervisor whichmeans it is installed directly onto the hardware and works like a miniature OS. It uses aVMkernel at its core with a installation footprint of 150 MB which means it has minimaleffects on the storage resources available and its small size also decrease likelihood ofsecurity breaches because of the minimal attack surface[17].
The other components of vSphere is vCenter Server, vSphere Client and vSphere WebClient; these are used to manage one or more hosts. ESXi itself has only a slimmed downterminal interface for only basic configuration such as setting hostname and doing net-work configuration. When managing a single host a administrator logs in remotely usingthe vSphere Client which runs on the local computer. When hosts are joined together ina cluster, this cluster is managed by the vCenter Server which controls all the individualhosts. The vCenter Server is can be run outside or as part of the cluster. When admin-istrating a cluster the administrators connect to vCenter Server using either the vSphereClient or the vSphere Web Client, the later which offers additional features and manage-ment tools.
VMware vSphere has a High Availability feature which provides failover protection to thevirtual machines. The feature can monitor both virtualization hosts and virtual machinesand if there is a hardware failure or guest operating system failure the virtual machineis automatically started on another functional host. The failover can be done fairly fastdepending on the operating system which needs to be booted[18]. vSphere also offers afeature called Fault Tolerance which creates a live shadow instance of a virtual machinewhich runs on a different virtualization host. The shadow instance is at any time ready tostep forward and take over if the other virtual machine crashes or if the virtualization hostgoes down. The result is that the downtime of a Fault Tolerance enabled virtual machineis limited to the time it takes for the system to notice the failure and activate the shadowinstance[19].
2.4 Photon OS
Photon OS is an open source minimal Linux container host in development by VMware.Being a container host operating system means it is built for the specific purpose of pro-viding the common kernel for containers running on the host. To run containers PhotonOS has support for container deployment with Docker, rkt and Pivotal Garden and whileit is very minimalistic it comes with a yum-compatible package manager for life cyclemanagement[6].
Photon OS is a part of another VMware project called Project Bonneville and its goal isto make the relationship between virtual machines and application containers a comple-mentary one rather than competitive. The project is an extension of VMware vSphere andwill enable Docker containers to be run as virtual machines and thus gaining the isola-tion advantages of hardware virtualization. It works by forking the kernel from a runningPhoton OS instance to create a new virtual container host for every new container that isdeployed.[20]. By forking only the kernel and a few supporting resources necessary torun containers allows much faster deployment then that of regular virtual machines.
9
2.5 CoreOS
CoreOS is a minimal operating system which is designed to run in clusters to host Linuxcontainers. In the core of CoreOS is Docker, the container engine used to run the contain-ers. CoreOS does not come with a package manager for lifecycle management, instead,administrators of a CoreOS cluster must run the tools within containers[21]. CoreOS uti-lizes fleet, a software that makes an administrator able to treat a large group of CoreOSmachines as a single system with a shared init-system. Using fleet, the cluster also is ableto maintain high availability because if a cluster host fails, the containers running on thathost is automatically started on a different host in the cluster[22].
2.6 CentOS
CentOS is a Linux distribution which is a community-driven derivative to the Red HatEnterprise Linux (RHEL) operating system. In contrast to RHEL, CentOS is completelyfree and its goal is to provide a platform for the open source communities. The operatingsystem has been in development since 2004 and the goal is to be functionally compatiblewith RHEL[23].
2.7 Docker
Docker is an open-source application that enables deployment of applications inside ofsoftware containers. All of the applications dependencies are included in the container,anything from code and run-time to system tools and system libraries, everything that isneeded to run the application. Docker makes use of images to launch new containers andthey are templates from which many containers can be created, each container is thenan instance of a particular image. Images are created from layered file systems whichenables sharing of common files, this in turn can help reduce disk storage and speedup uploading and downloading of images. One of the possible use-case scenarios forDocker is optimization of infrastructure. Docker creates lightweight containers that allshare the same kernel so there is no need for additional guest operating systems to isolateapplications. Containers create less overhead compared to virtual machines, reduces thetime to spin up applications and take up less storage[24].
2.8 Apache
Apache HTTP Server is a web server which as of November 2015 hosts 37% of all websites[25], making it the most popular web server in the world. Apache had its initial re-lease in 1995 and is a free and open-source software; a part of the Apache HTTP ServerProject which is a developer community to further develop and support Apache, all su-pervised by the Apache Software Foundation.[26]. Apache can be used on Linux, OS Xand Windows among others.
10
2.9 Apache JMeter
Apache JMeter is a Java application which is used to benchmark web application perfor-mance. The application was first developed by the Apache Software Foundation and theproject was headed by Stefano Mazzacchi. The Apache Software Foundation has sincethen developed extra functionalities and a graphical user interface which helps visualisingboth the construction of tests and results. JMeter’s only works at the protocol level anddoes not render images like a regular browser[27].
2.10 MySQL
MySQL is an open source database developed the company MySQL AB, headquarteredin Cupertino, California, United States and Uppsala, Sweden. In 2008 the company wasaquired by Sun Microsystems, Inc and is since then a joint venture. In 2008 the databasesoftware had been downloaded 100 million times with 50,000 downloads daily[28]. MySQLis a transactional database which means the data is exchanged within transactions. If atransaction is not completed in its entirety, the data exchange is rolled back, thus main-taining the coherency of the transaction in case of a potential system failure[29].
11
3 Method
This chapter contains a description of the method that will be used to answer the researchquestions put forward in this thesis project. Under Method Description a topology will bepresented describing the different hardware and software components used in the experi-ments. A more detailed system documentation can be seen in appendix A.
3.1 Scientific approach
The scientific approach of this report is an inductive approach using an empirical methodto collect quantitative data. In order to measure the performance of applications insideof containers a number of experiments will be conducted. The data gathered from theseexperiments will be time to complete service requests and number of completed servicerequests.
3.2 Method description
To answer our research questions three experiments was conducted: One HTTP-GET test,one SQL-SELECT test and one SQL-INSERT test. The HTTP-GET test was intended tomeasure the overhead of CPU virtualization. The web server put the page that was fetchedin its cache and worked at delivering the page to as many parallel users as possible. Inthe Apache web server, a new process was created for each new user. The page was 10000 bytes big and the Gigabit Ethernet network could support a total throughput of 1 000000 000/8 = 125 MB per second, meaning that the network could support about 12 500transactions per second not taking into consideration overhead introduced by Ethernet,TCP and HTTP. The overhead is usually around 2-9% according to forum posts on Stack-Overflow[30] which still leaves the network supporting more than 10 000 transactions. Ifthe results show less transactions per second, the network was not overloaded. At maxi-mum a total number of 100 users was working towards the website, this meant that if theweb server response time was for example 100 milliseconds, no more than 1000 trans-actions could traverse the network at any given second. If a bottleneck occurred then itwould likely be because the CPU did not have the compute capacity to handle that manyrequests.
The SQL-SELECT experiments measured the latency of which a small SQL-SELECTquery could be performed between two application containers running on the same con-tainer host. When the database server received the query, it also had to read from thedisk. Differences between virtualized and non-virtualized setups was intended to showthe overhead of read operations and if there was a difference in inter-container commu-nication latency. The third test, the SQL-INSERT test, measured the overhead of writeoperations.
The purpose of these experiments was to measure the performance of the applications run-ning inside of containers deployed by Docker, and to compare non-virtualized containerhosts to virtualized container hosts. Differences in containerized application performancebetween the container host operating systems themselves was also examined. The fol-lowing description section is divided into: Topology for the experiment setups, a prestudy
12
benchmarking the physical hardware verifying their equal I/O performance, ending witha detailed description of the individual experiments.
3.2.1 Topology
The lab environment consisted of an IBM BladeCenter chassis containing four bladeservers and two Cisco Ethernet switches. All four blades had the same physical configu-ration which can be seen in futher detail in appendix A.1. The experiments was executedin five different setups. Each of the blade servers had one or three setups, though no morethen one active at a time.
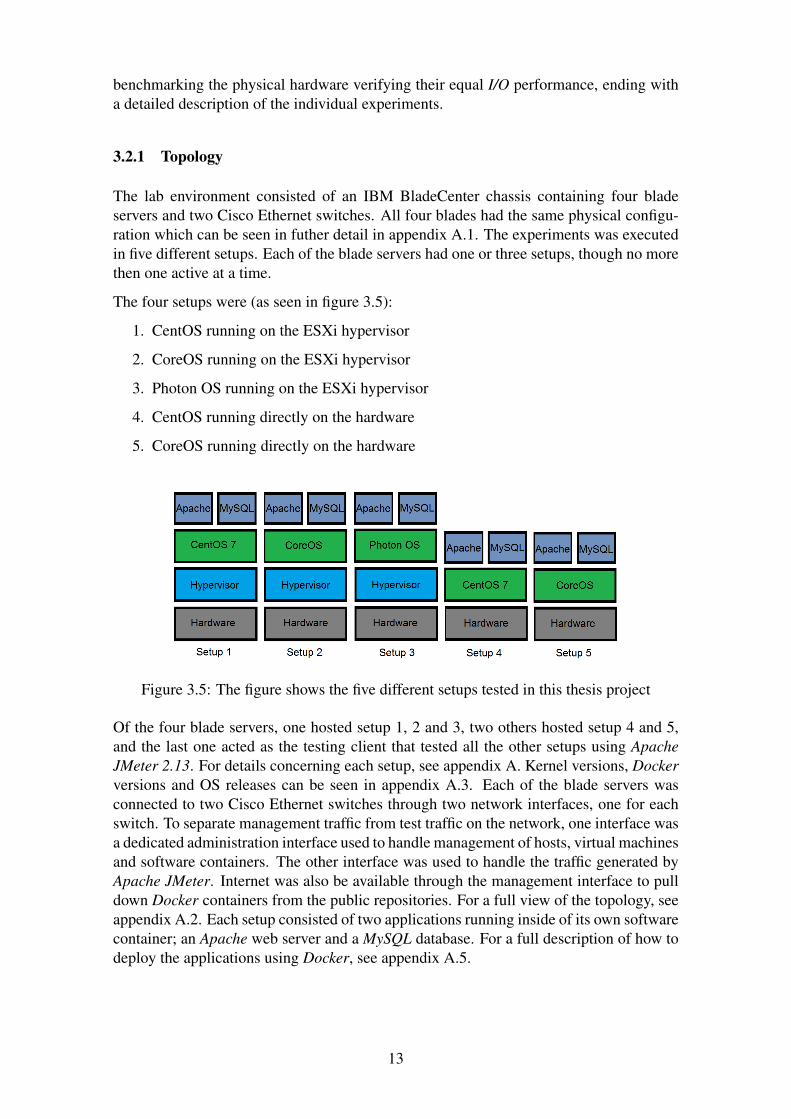
The four setups were (as seen in figure 3.5):
1. CentOS running on the ESXi hypervisor
2. CoreOS running on the ESXi hypervisor
3. Photon OS running on the ESXi hypervisor
4. CentOS running directly on the hardware
5. CoreOS running directly on the hardware
Figure 3.5: The figure shows the five different setups tested in this thesis project
Of the four blade servers, one hosted setup 1, 2 and 3, two others hosted setup 4 and 5,and the last one acted as the testing client that tested all the other setups using ApacheJMeter 2.13. For details concerning each setup, see appendix A. Kernel versions, Dockerversions and OS releases can be seen in appendix A.3. Each of the blade servers wasconnected to two Cisco Ethernet switches through two network interfaces, one for eachswitch. To separate management traffic from test traffic on the network, one interface wasa dedicated administration interface used to handle management of hosts, virtual machinesand software containers. The other interface was used to handle the traffic generated byApache JMeter. Internet was also be available through the management interface to pulldown Docker containers from the public repositories. For a full view of the topology, seeappendix A.2. Each setup consisted of two applications running inside of its own softwarecontainer; an Apache web server and a MySQL database. For a full description of how todeploy the applications using Docker, see appendix A.5.
13
3.2.2 Prestudy: Hardware I/O Benchmarks
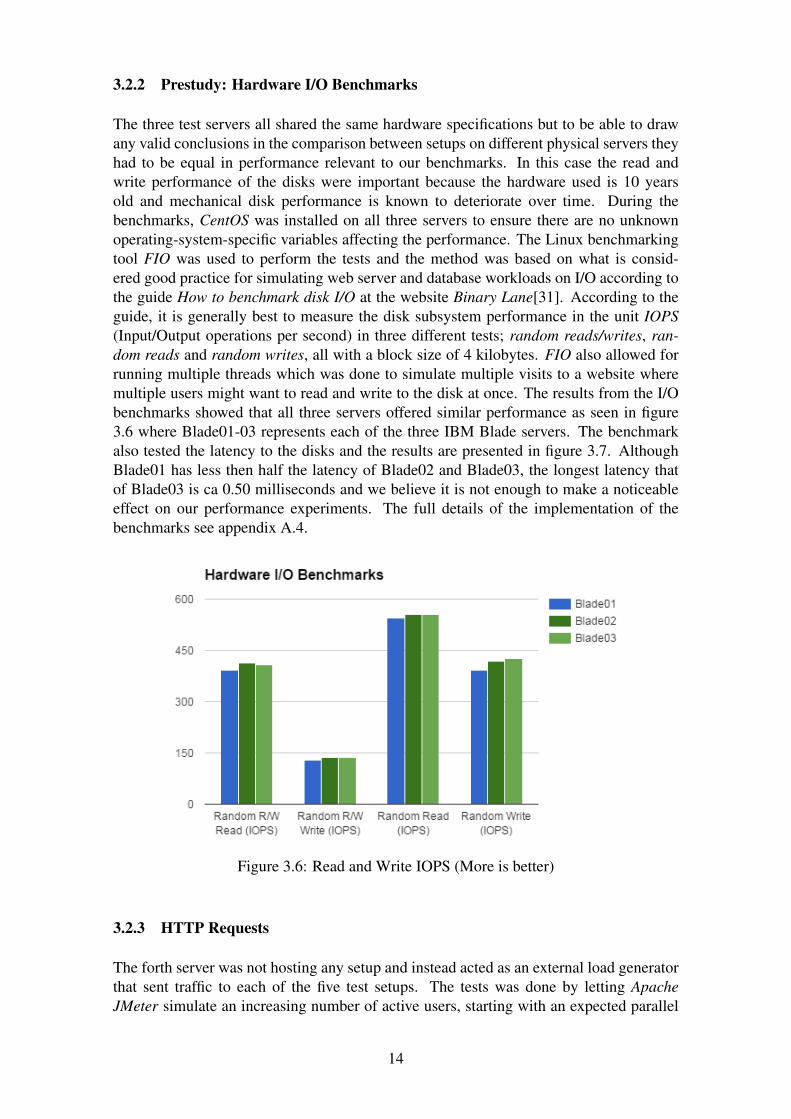
The three test servers all shared the same hardware specifications but to be able to drawany valid conclusions in the comparison between setups on different physical servers theyhad to be equal in performance relevant to our benchmarks. In this case the read andwrite performance of the disks were important because the hardware used is 10 yearsold and mechanical disk performance is known to deteriorate over time. During thebenchmarks, CentOS was installed on all three servers to ensure there are no unknownoperating-system-specific variables affecting the performance. The Linux benchmarkingtool FIO was used to perform the tests and the method was based on what is consid-ered good practice for simulating web server and database workloads on I/O according tothe guide How to benchmark disk I/O at the website Binary Lane[31]. According to theguide, it is generally best to measure the disk subsystem performance in the unit IOPS(Input/Output operations per second) in three different tests; random reads/writes, ran-dom reads and random writes, all with a block size of 4 kilobytes. FIO also allowed forrunning multiple threads which was done to simulate multiple visits to a website wheremultiple users might want to read and write to the disk at once. The results from the I/Obenchmarks showed that all three servers offered similar performance as seen in figure3.6 where Blade01-03 represents each of the three IBM Blade servers. The benchmarkalso tested the latency to the disks and the results are presented in figure 3.7. AlthoughBlade01 has less then half the latency of Blade02 and Blade03, the longest latency thatof Blade03 is ca 0.50 milliseconds and we believe it is not enough to make a noticeableeffect on our performance experiments. The full details of the implementation of thebenchmarks see appendix A.4.
Figure 3.6: Read and Write IOPS (More is better)
3.2.3 HTTP Requests
The forth server was not hosting any setup and instead acted as an external load generatorthat sent traffic to each of the five test setups. The tests was done by letting ApacheJMeter simulate an increasing number of active users, starting with an expected parallel
14
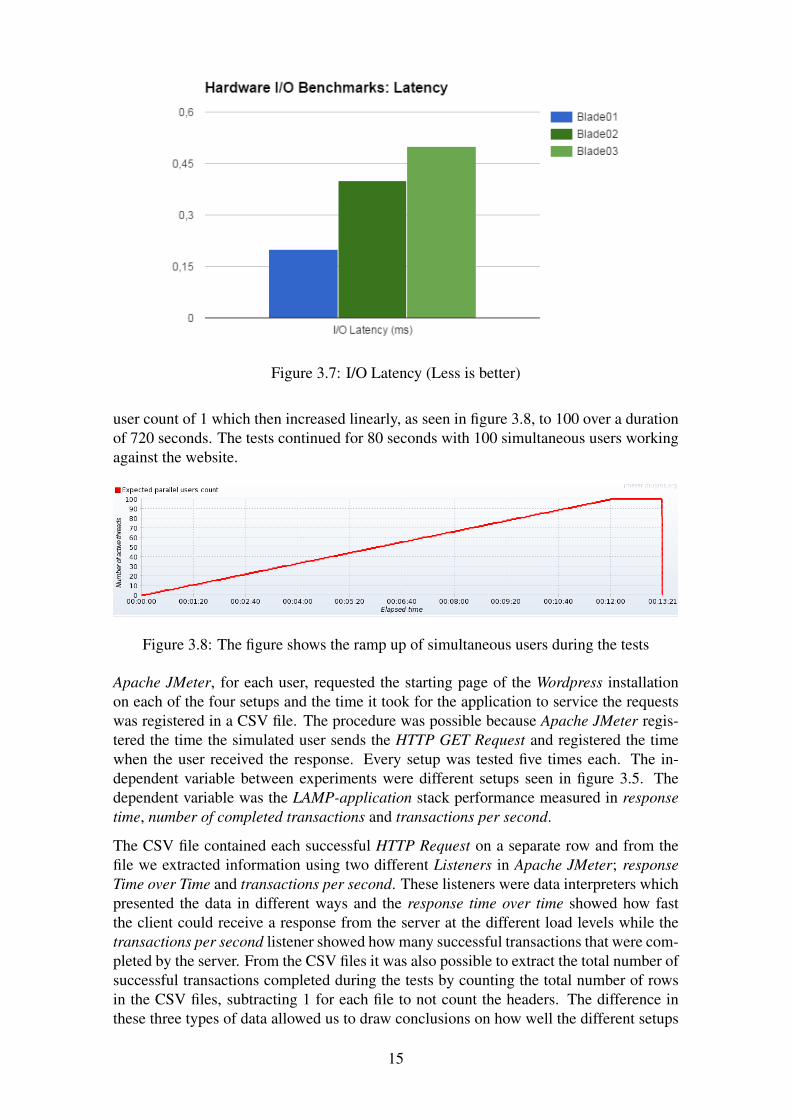
Figure 3.7: I/O Latency (Less is better)
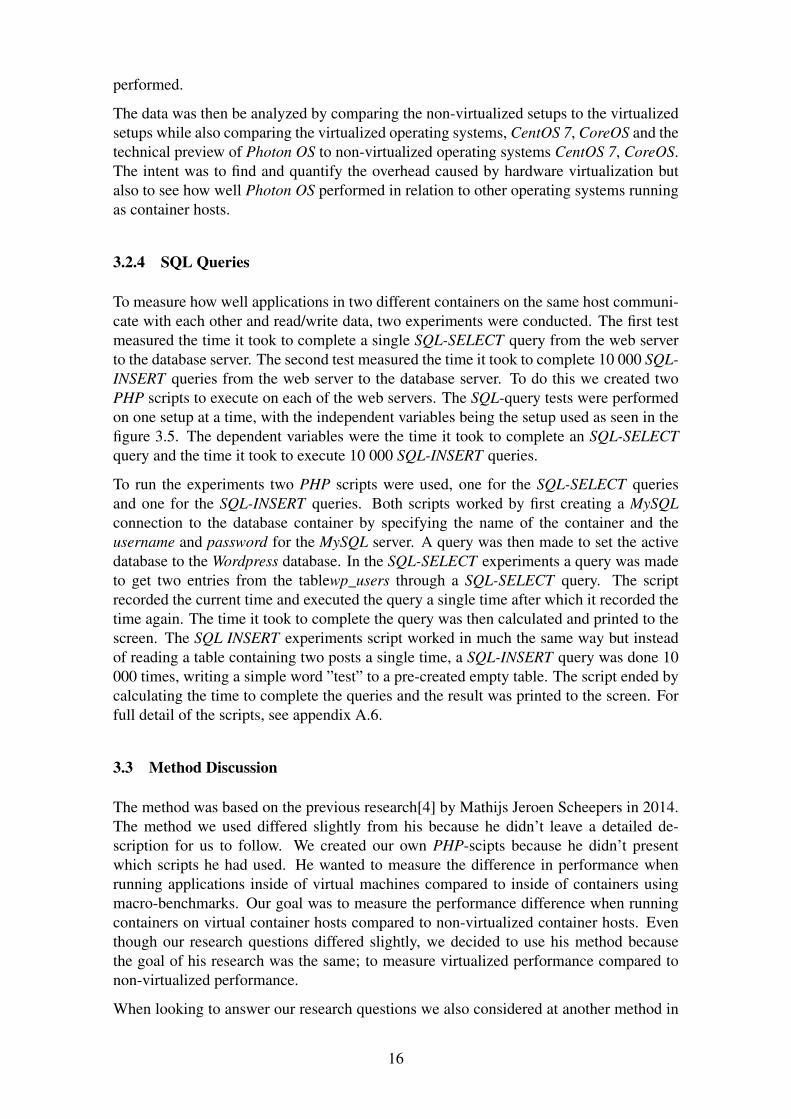
user count of 1 which then increased linearly, as seen in figure 3.8, to 100 over a durationof 720 seconds. The tests continued for 80 seconds with 100 simultaneous users workingagainst the website.
Figure 3.8: The figure shows the ramp up of simultaneous users during the tests
Apache JMeter, for each user, requested the starting page of the Wordpress installationon each of the four setups and the time it took for the application to service the requestswas registered in a CSV file. The procedure was possible because Apache JMeter regis-tered the time the simulated user sends the HTTP GET Request and registered the timewhen the user received the response. Every setup was tested five times each. The in-dependent variable between experiments were different setups seen in figure 3.5. Thedependent variable was the LAMP-application stack performance measured in responsetime, number of completed transactions and transactions per second.
The CSV file contained each successful HTTP Request on a separate row and from thefile we extracted information using two different Listeners in Apache JMeter; responseTime over Time and transactions per second. These listeners were data interpreters whichpresented the data in different ways and the response time over time showed how fastthe client could receive a response from the server at the different load levels while thetransactions per second listener showed how many successful transactions that were com-pleted by the server. From the CSV files it was also possible to extract the total number ofsuccessful transactions completed during the tests by counting the total number of rowsin the CSV files, subtracting 1 for each file to not count the headers. The difference inthese three types of data allowed us to draw conclusions on how well the different setups
15
performed.
The data was then be analyzed by comparing the non-virtualized setups to the virtualizedsetups while also comparing the virtualized operating systems, CentOS 7, CoreOS and thetechnical preview of Photon OS to non-virtualized operating systems CentOS 7, CoreOS.The intent was to find and quantify the overhead caused by hardware virtualization butalso to see how well Photon OS performed in relation to other operating systems runningas container hosts.
3.2.4 SQL Queries
To measure how well applications in two different containers on the same host communi-cate with each other and read/write data, two experiments were conducted. The first testmeasured the time it took to complete a single SQL-SELECT query from the web serverto the database server. The second test measured the time it took to complete 10 000 SQL-INSERT queries from the web server to the database server. To do this we created twoPHP scripts to execute on each of the web servers. The SQL-query tests were performedon one setup at a time, with the independent variables being the setup used as seen in thefigure 3.5. The dependent variables were the time it took to complete an SQL-SELECTquery and the time it took to execute 10 000 SQL-INSERT queries.
To run the experiments two PHP scripts were used, one for the SQL-SELECT queriesand one for the SQL-INSERT queries. Both scripts worked by first creating a MySQLconnection to the database container by specifying the name of the container and theusername and password for the MySQL server. A query was then made to set the activedatabase to the Wordpress database. In the SQL-SELECT experiments a query was madeto get two entries from the tablewp_users through a SQL-SELECT query. The scriptrecorded the current time and executed the query a single time after which it recorded thetime again. The time it took to complete the query was then calculated and printed to thescreen. The SQL INSERT experiments script worked in much the same way but insteadof reading a table containing two posts a single time, a SQL-INSERT query was done 10000 times, writing a simple word ”test” to a pre-created empty table. The script ended bycalculating the time to complete the queries and the result was printed to the screen. Forfull detail of the scripts, see appendix A.6.
3.3 Method Discussion
The method was based on the previous research[4] by Mathijs Jeroen Scheepers in 2014.The method we used differed slightly from his because he didn’t leave a detailed de-scription for us to follow. We created our own PHP-scipts because he didn’t presentwhich scripts he had used. He wanted to measure the difference in performance whenrunning applications inside of virtual machines compared to inside of containers usingmacro-benchmarks. Our goal was to measure the performance difference when runningcontainers on virtual container hosts compared to non-virtualized container hosts. Eventhough our research questions differed slightly, we decided to use his method becausethe goal of his research was the same; to measure virtualized performance compared tonon-virtualized performance.
When looking to answer our research questions we also considered at another method in
16
the report An Updated Performance Comparison of Virtual Machines and Linux Contain-ers[8] by IBM. The objective was the same as in the the report by Mathijs Jeroen Scheep-ers, to strain the resources in the systems to compare and to quantify the performance tosee differences. A difference between the two methods were that the IBM research wasa series of benchmarks of more specific parts of a system while the research conductedby Jeroen Scheepers was a macro-benchmark. Being a macro-benchmark method meansit measured the performance of a system by running an application which itself used thedifferent parts of the system. A reason we did not chose the method by IBM was thatit was was hard to understand and would therefore be hard to replicate. We chose to doa macro-benchmark because we wanted to measure the performance of the applicationstack as a whole and not just individual components.
The VMware ESXi hypervisor was chosen as it was closely linked to Photon OS, whichis designed to run within the context of vSphere Integrated Containers and is tuned forvSphere. CentOS was chosen as a representative heavyweight enterprise operating systemto use as a container host. CoreOS was chosen as a representative lightweight containerhost operating system because it is specifically designed to act as a container host operat-ing system and is commonly used and referred to in containerization articles.
There are ways our method could have been done differently though. In a real-worldscenario the system would most likely not have ran at 100% capacity for any extensiveperiod of time. To simulate this, the tests could have been set to stop at an average numberof user connections for a web site, possibly utilizing 70% resources of the web server.However, this was not chosen because the overhead was thought of to be more visible athigh resource utilization.
3.4 Reliability and Validity
To improve reliability of the results each test was conducted five times. The differencebetween containerized application performance on non-virtualized and virtualized con-tainer hosts should have been similar on all systems using the same hypervisor and testingmethod regardless of the hardware used. The prestudy with measurements of I/O perfor-mance was conducted to increase the reliability of the results since I/O could have been abottleneck.
We weren’t able to run the same version of Docker on all the container hosts. The lat-est version on Photon OS was 1.8.1, as seen in appendix A.3, and we attempted to runversions on other hosts close to the version on Photon OS. The reliability threat imposedby the different versions could however only affect the comparison between different op-erating systems because both the virtualized and the non-virtualized setup of the samecontainer host used the same Docker version.
One thing that might have affected the results was that the hypervisor itself consumedabout 0-0,5% of the CPU in the virtualized setups because it had services running lis-tening to administrator input. Since our tests very quickly utilized all of the computingresources there may have been an internal validity threat because the CPU utilization ofthe hypervisor could alter the performance. The hypervisor also consumed some memorybut our tests did not strain the memory resources of the systems.
17
4 Results and Analysis
In this section the results of our experiments is presented and analysed. Information willbe given for each graph and table. To increase readability of the results and the analysisthey are combined into one section. The graphs illustrate the results while the surroundingtext contains analysis of the results.
4.1 HTTP Requests
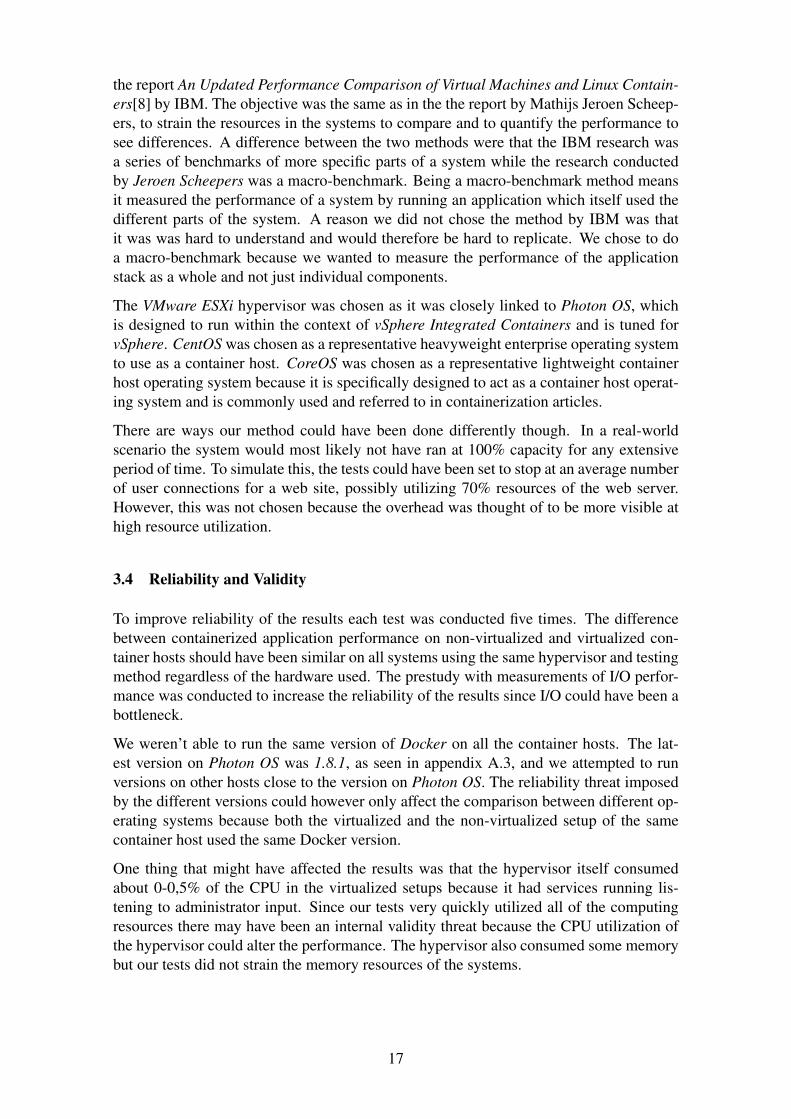
The results seen in figure 4.9 showed a decrease in performance in virtualized envi-ronments compared to the non-virtualized environments. The non-virtualized CentOSmachine performed 20% better on average than the virtualized CentOS and the non-virtualized CoreOS machine performed 27% better on average than the virtualized CoreOSwhen comparing the number of successful HTTP Requests completed during the tests.It should be noted however, that the first test run on the CoreOS virtual machine per-formed significantly worse than its own average, a performance reduction of 33%. Thecause was unknown but we can speculate that an event like a scheduled job was per-formed on the hypervisor during the test. Discounting the first test run on the virtualizedCoreOS machine, the performance of the virtualized CoreOS machine compared to thenon-virtualized CoreOS machine was 18% lower . By those numbers, the average de-crease in performance when hardware virtualizing a container host was 19%. The resultsin figure 4.9 showed that the Photon OS container host performed better than the othervirtualized operating systems. Although still a technical preview, VMware explains thatPhoton OS is ”validated on and tuned for VMware product and provider platforms”[6,What is Photon OS] which could explain the slight performance increase compared to theother operating systems.
Figure 4.9: Successful HTTP Requests (More is better)
As seen in figure 4.10 the transactions per second increased more quickly in the non-
18
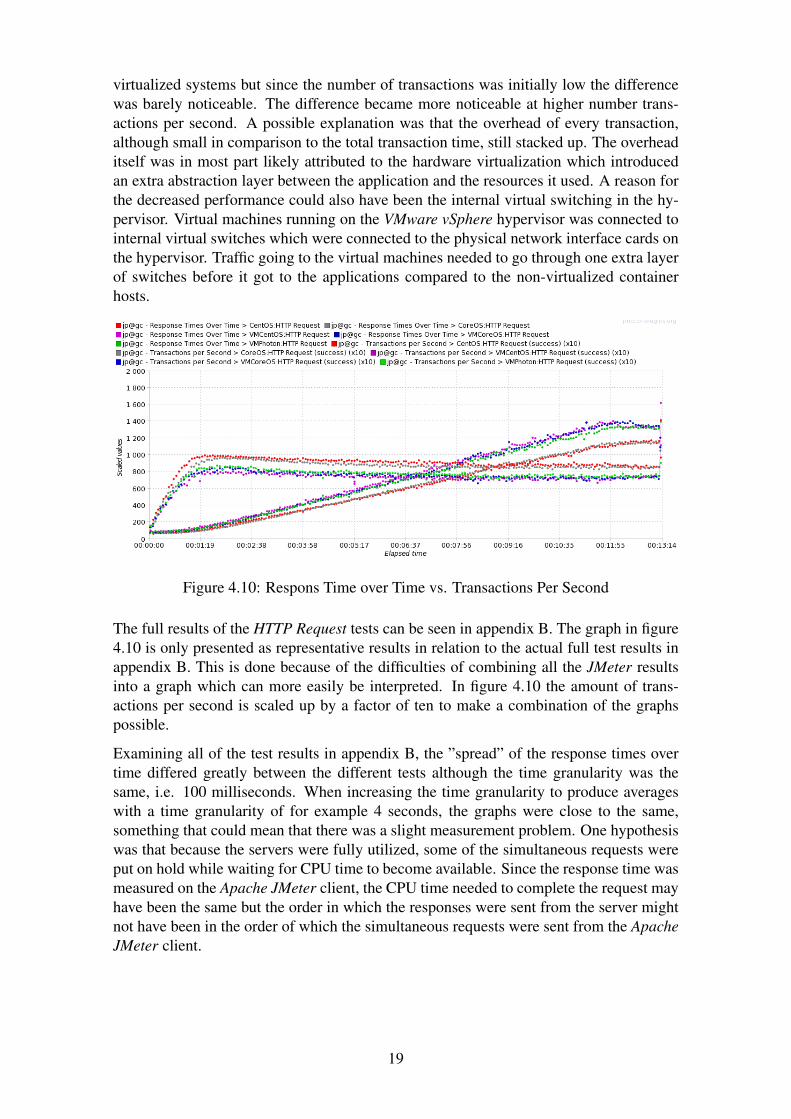
virtualized systems but since the number of transactions was initially low the differencewas barely noticeable. The difference became more noticeable at higher number trans-actions per second. A possible explanation was that the overhead of every transaction,although small in comparison to the total transaction time, still stacked up. The overheaditself was in most part likely attributed to the hardware virtualization which introducedan extra abstraction layer between the application and the resources it used. A reason forthe decreased performance could also have been the internal virtual switching in the hy-pervisor. Virtual machines running on the VMware vSphere hypervisor was connected tointernal virtual switches which were connected to the physical network interface cards onthe hypervisor. Traffic going to the virtual machines needed to go through one extra layerof switches before it got to the applications compared to the non-virtualized containerhosts.
Figure 4.10: Respons Time over Time vs. Transactions Per Second
The full results of the HTTP Request tests can be seen in appendix B. The graph in figure4.10 is only presented as representative results in relation to the actual full test results inappendix B. This is done because of the difficulties of combining all the JMeter resultsinto a graph which can more easily be interpreted. In figure 4.10 the amount of trans-actions per second is scaled up by a factor of ten to make a combination of the graphspossible.
Examining all of the test results in appendix B, the ”spread” of the response times overtime differed greatly between the different tests although the time granularity was thesame, i.e. 100 milliseconds. When increasing the time granularity to produce averageswith a time granularity of for example 4 seconds, the graphs were close to the same,something that could mean that there was a slight measurement problem. One hypothesiswas that because the servers were fully utilized, some of the simultaneous requests wereput on hold while waiting for CPU time to become available. Since the response time wasmeasured on the Apache JMeter client, the CPU time needed to complete the request mayhave been the same but the order in which the responses were sent from the server mightnot have been in the order of which the simultaneous requests were sent from the ApacheJMeter client.
19
4.2 SQL Queries
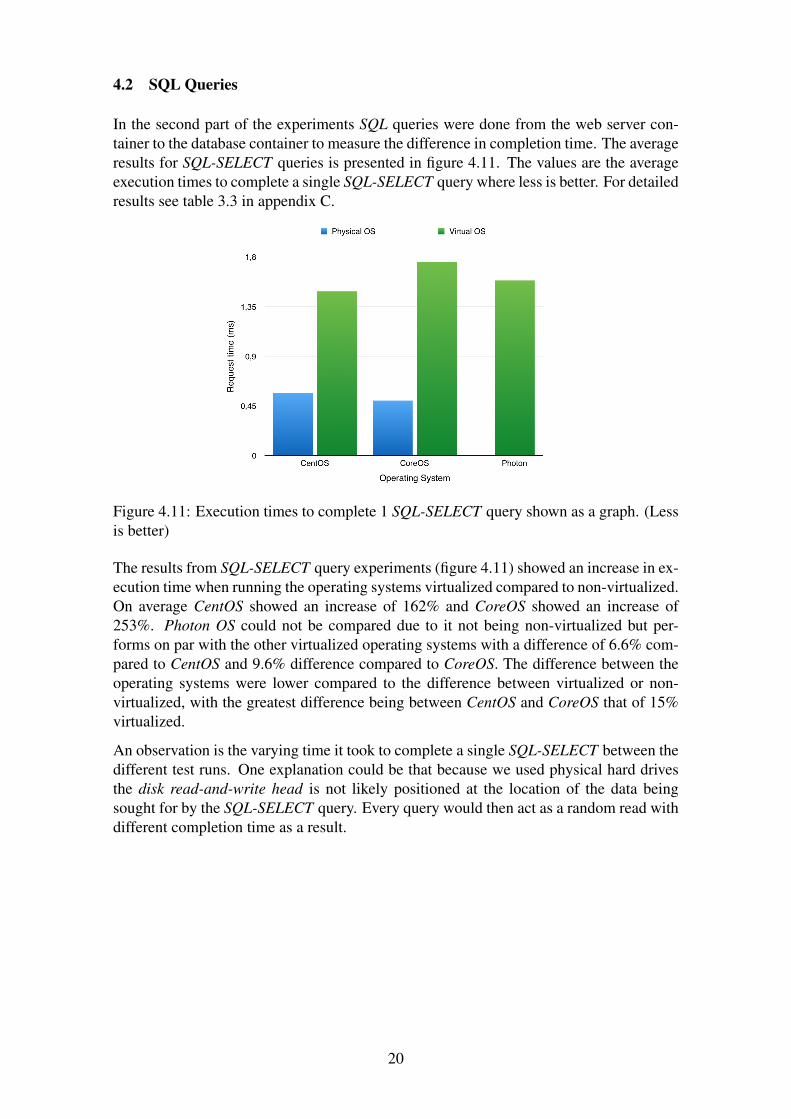
In the second part of the experiments SQL queries were done from the web server con-tainer to the database container to measure the difference in completion time. The averageresults for SQL-SELECT queries is presented in figure 4.11. The values are the averageexecution times to complete a single SQL-SELECT query where less is better. For detailedresults see table 3.3 in appendix C.
Figure 4.11: Execution times to complete 1 SQL-SELECT query shown as a graph. (Lessis better)
The results from SQL-SELECT query experiments (figure 4.11) showed an increase in ex-ecution time when running the operating systems virtualized compared to non-virtualized.On average CentOS showed an increase of 162% and CoreOS showed an increase of253%. Photon OS could not be compared due to it not being non-virtualized but per-forms on par with the other virtualized operating systems with a difference of 6.6% com-pared to CentOS and 9.6% difference compared to CoreOS. The difference between theoperating systems were lower compared to the difference between virtualized or non-virtualized, with the greatest difference being between CentOS and CoreOS that of 15%virtualized.
An observation is the varying time it took to complete a single SQL-SELECT between thedifferent test runs. One explanation could be that because we used physical hard drivesthe disk read-and-write head is not likely positioned at the location of the data beingsought for by the SQL-SELECT query. Every query would then act as a random read withdifferent completion time as a result.
20
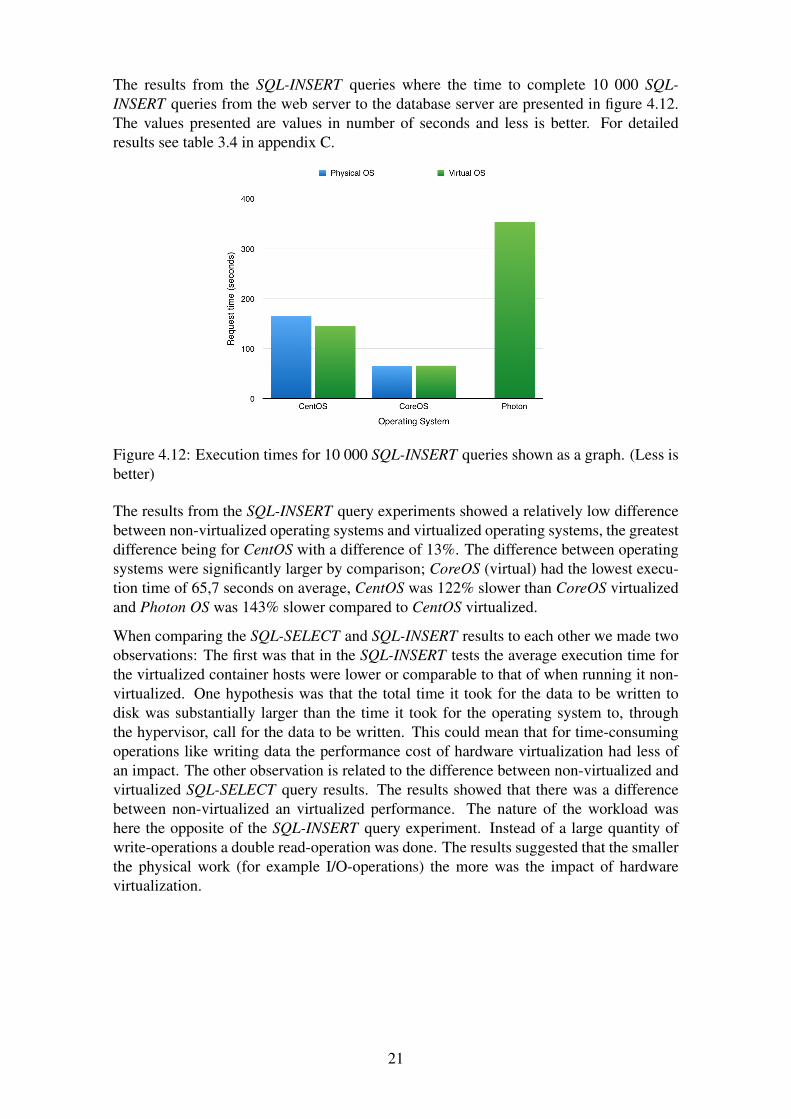
The results from the SQL-INSERT queries where the time to complete 10 000 SQL-INSERT queries from the web server to the database server are presented in figure 4.12.The values presented are values in number of seconds and less is better. For detailedresults see table 3.4 in appendix C.
Figure 4.12: Execution times for 10 000 SQL-INSERT queries shown as a graph. (Less isbetter)
The results from the SQL-INSERT query experiments showed a relatively low differencebetween non-virtualized operating systems and virtualized operating systems, the greatestdifference being for CentOS with a difference of 13%. The difference between operatingsystems were significantly larger by comparison; CoreOS (virtual) had the lowest execu-tion time of 65,7 seconds on average, CentOS was 122% slower than CoreOS virtualizedand Photon OS was 143% slower compared to CentOS virtualized.
When comparing the SQL-SELECT and SQL-INSERT results to each other we made twoobservations: The first was that in the SQL-INSERT tests the average execution time forthe virtualized container hosts were lower or comparable to that of when running it non-virtualized. One hypothesis was that the total time it took for the data to be written todisk was substantially larger than the time it took for the operating system to, throughthe hypervisor, call for the data to be written. This could mean that for time-consumingoperations like writing data the performance cost of hardware virtualization had less ofan impact. The other observation is related to the difference between non-virtualized andvirtualized SQL-SELECT query results. The results showed that there was a differencebetween non-virtualized an virtualized performance. The nature of the workload washere the opposite of the SQL-INSERT query experiment. Instead of a large quantity ofwrite-operations a double read-operation was done. The results suggested that the smallerthe physical work (for example I/O-operations) the more was the impact of hardwarevirtualization.
21
5 Discussion
The purpose of this study is to answer the following research question: How will con-tainerized application performance be affected by 1) virtualized and non-virtualized con-tainer hosts, and 2) choice of container host operating systems. To answer the questionswe adopt a method where application performance is measured with the independent vari-ables first being the choice of whether or not to use hardware virtualization and secondvariable being the choice of container host operating system. Given the setup of an LAMP-application stack with a web server and a database server in two separate containers; howwell does containerized applications perform when simulating HTTP Requests and SQLqueries.
The results show that there is a performance decrease in the number of answerable HTTPRequests when running the container host as a virtual machine. There is approximatelyan 18-20% decrease of completed HTTP Requests. A decrease is expected because of theextra abstraction layer added when virtualizing an operating system, which has to com-municate to hardware through the hypervisor. The network traffic must also be switchedthrough the hypervisor from the physical port to the virtual switch which the virtualizedcontainer host is connected to. Photon OS performs slightly better than the other virtual-ized container host operating systems when measuring HTTP Requests, possibly becauseit is said be tuned to run efficiently in vSphere. It might also be tuned in ways which don’taffect LAMP-stack performance. It will be interesting to see how VMware can integratePhoton OS more and add container management support to vSphere in the future whenvSphere Integrated Containers is launched and Photon OS leaves the technical previewphase.
In the analysis we explain a difference in the results between the two types of SQLexperiments. There is a notable difference in time to complete a single SQL-SELECTquery between containers running on virtualized compared to non-virtualized operatingsystems, while only showing a minor difference between the different operating sys-tems themselves. In the SQL-INSERT experiments the choice of operating system hada much greater impact on performance, whilst showing almost no difference betweennon-virtualized and virtualized operating systems. We believe the reason for this is thatwhen the number of queries increases it becomes more important how different operatingsystems handle the workload. Also the nature of the workload seem to be a major reasonfor differences in performance, virtualized compared to non-virtualized, as described inthe analysis of the SQL tests.
IBM claims as described in Previous Research that the extra abstraction layer of hardwarevirtualization only adds overhead without any additional benefits[8] when deploying con-tainers inside of virtual machines. It is true that it comes with extra overhead, even whenrunning container host operating systems like Photon OS which is specifically designedto run in a vSphere environment. However, hardware virtualization comes with severalbenefits such as hardware isolation and features such as Fault Tolerance in vSphere whichhelps reduce downtime for critical systems. Software containers are fast to boot thoughso the difference in downtime in case of a failure in a CoreOS-fleet cluster compared tovSphere cluster with Fault Tolerance may be negligible.
22
6 Conclusion
In this study we examined the implications for application performance when runningcontainers inside of virtual machines. This was done by comparing non-virtual containerhosts to virtual container hosts and measure the performance of two of their applica-tions.
Our conclusion is that running virtual container hosts could affect the performance oftheir applications negatively, something to be expected considering the abstraction layerprovided by the hypervisor. However, the impact of virtualizing a container hosts differsbetween the type of operation performed inside the applications running on it. We foundthat on larger amounts of consecutive SQL-INSERT queries the performance on virtualcontainer hosts were even on par with physical ones. The opposite was found in theSQL-SELECT experiments. From the HTTP Request test we saw a 20% decrease incompleted HTTP-Requests on average when running on a virtual machine instead of aphysical installation. Non-virtualized CoreOS and CentOS had both faster response timeover time as well as more transactions per second than virtualized CoreOS and CentOS.These experiments show that CPU intensive applications will see greater a performancedecrease in a virtualized environment.
The choice of container host operating system is a complicated issue because they all offerdifferent advantages. The results of the HTTP-Request experiments show that Photon OSperforms slightly better in the virtualized setups than CoreOS and CentOS when it comesto the total number of completed HTTP Requests. CoreOS and Photon OS is also verysmall distribution which compared to CentOS requires less storage and memory resourcesto be installed and to be run. However, in the SQL-INSERT test Photon OS performedworse then all other tested operating systems, be it virtualized or non-virtualized. Thisshows that it is also important to consider the application before choosing an operatingsystem for this kind of implementation.
The results is likely not fully generalizable. This is because our research found that theimpact of hardware virtualization depends on the operation performed. When doing heav-ier operations like writing to disk the impact of hardware virtualization was negligible butwhen doing smaller operations like a small read operation the impact was large. Ourconclusion based on those results is that the smaller the operation, the bigger the impact.To make the result more generalizable we would want to make more measurements withdifferent amounts of read and writes. The overhead caused by hardware virtualizationalso becomes more visible at higher utilization levels in our experiments meaning thatour results in the HTTP tests may only be general at those utilization levels.
Our method was based on previous research by Mathijs Jeroen Scheepers[4], but whenanalysing our data we found that our conclusions could be made stronger by improvingor supplementing our experiments. In the SQL experiments there could be a compari-son between doing a single query and multiple queries of the same type because time toexecute can be significantly different between reading and writing data. Each of our ex-periments only included a single SQL-SELECT query and 10 000 SQL-INSERT queries.In retrospect we could have analyzed the methods of earlier research more critically. Inthe HTTP-Request experiments it might also have been better to test the systems at lowerutilization levels to get a picture of performance at workload closer to what would be ina production environment. A test could be done to see at which number of simultaneoususers simulated by Apache JMeter would push the system to about 70-90% CPU load
23
and then do a linear increase from one user to that specified number. In our current tests,the maximum amount of transactions per second are at t=100s (12% into the test), thenumber then decreases as the system becomes overloaded. Our reasoning for choosingmethod is that we wanted to push the utilization high to make the overhead caused by thehardware virtualization more visible. The overhead is on a operation-basis which meansthe overhead would not be as visible at low utilization. Now we get a picture of how muchoverhead exists from hardware virtualization in a fully utilized system.
Another thing that could improve our method is to also test using less hardware (CPUand memory) for the non-virtualized operating systems and then reduced the hardwarefor the virtual machines to the same amount of CPU and memory. In our tests the virtualmachine running on the hypervisor was assigned all of the hardware on the virtualizationhost because the hypervisor itself only utilizes about 0-0,5% of the hardware resourcesaccording to our management view through the vSphere Client. It is however unknown ifthe virtual container host was actually competing for resources with the hypervisor duringthe high utilization phase of the tests in a way that affected the results. To analyze thismore resources could be assigned to the hypervisor or less hardware resources installed onthe physical blades hosting the non-virtualized installations of CentOS and CoreOS.
One possible scenario for this kind of implementation is to use virtual machines as ap-plication platforms consisting of multiple components where each component is a con-tainer. The application platform could be a web shop and the necessary componentscould be the web server to host site for the customers interact with. There might also bea database server to hold information about the products and an inventory system usedby the employees. Instead of running each component in it’s own virtual machine eachcomponent is run as a container inside of a single virtual machine. The componentswould be lightweight with inter-container communication being more effective comparedto inter-virtual machine communication, while also receiving hardware isolation betweendifferent application platforms running on the same physical hardware. Having all com-ponents necessary to run the application platform inside the same virtual machine alsomakes migration between physical machines easier because the administrators does nothave to move each component separately.
We believe these results to be relevant to the IT industry because even though companieslike VMware and Microsoft are putting both time and money into developing technologiesto better support virtual container hosts, we found no academic research on the concept ofrunning containers in virtual machines. Virtual container hosts bring new and interestingpossibilities to the data center administrators but questions about the implications of doingso, such as performance, needs to be addressed. As we believe virtual container hostsis going to be a major part of future data centers it is important to fill this knowledgegap.
24
6.1 Future research
It would be interesting if someone could do our tests with a further developed method. Iffuture research takes into account the proposed improvements discussed in the Conclusionchapter the results may be different. In a future where Photon OS has left technicalpreview we would also like to see our tests done again to see if there are any improvementsto performance.
Future research could also be to evaluate different container engines. CoreOS has its owncontainer engine called rkt which could be compared to Docker. Why is there a need fortwo different container engines, is one better than the other and in which ways?
Another future research that could be conducted is a well structured operational compar-ison between different virtualization platforms. One could for example compare CoreOSwith fleet to VMware vSphere on provisioning-, high availability-, fault tolerance- andmigration-features to see which one suits which environment and for what reasons. It isespecially interesting if the operational comparison is made when container managementhas been integrated in vSphere.
25
References
[1] D. Kumar. (2015) Server consolidation benefits – with real world exam-ples. (Accessed on 07/27/2016). [Online]. Available: http://www.sysprobs.com/server-consolidation-benefits-with-real-world-examples
[2] Docker. (2016) What is docker? [Online]. Available: https://www.docker.com/what-docker
[3] S. Hogg. (2014) Software containers: Used more frequently thanmost realize | network world. (Accessed on 05/09/2016). [On-line]. Available: http://www.networkworld.com/article/2226996/cisco-subnet/software-containers--used-more-frequently-than-most-realize.html
[4] M. J. Scheepers, “Virtualization and containerization of application infrastructure:A comparison,” 21st Twente Student Conference on IT, pp. 1–7, 2014.
[5] R. Dua, A. Raja, and D. Kakadia, “Virtualization vs containerization to supportpaas,” in Cloud Engineering (IC2E), 2014 IEEE International Conference on, March2014, pp. 610–614.
[6] VMware, Inc. (2015) Photon OS by VMware. [Online]. Available: https://vmware.github.io/photon/
[7] Canonical Ltd. What’s LXC? [Online]. Available: https://linuxcontainers.org/lxc/introduction/
[8] W. Felter, A. Ferreira, R. Rajamony, and J. Rubio, “An updated performance com-parison of virtual machines and linux containers,” in Performance Analysis of Sys-tems and Software (ISPASS), 2015 IEEE International Symposium On. IEEE, 2015,pp. 171–172.
[9] D. Kumar. (2014) Docker vs vms. (Accessed on 07/27/2016). [Online]. Available:http://devops.com/2014/11/24/docker-vs-vms/
[10] S. Seshachala. (2014, 11) Docker vs vms - devops.com. (Accessed on 05/20/2016).[Online]. Available: http://devops.com/2014/11/24/docker-vs-vms/
[11] S. J. Vaughan-Nichols. (2014, 08) Why Containers Instead of Hypervisors?(Accessed on 05/24/2016). [Online]. Available: http://blog.smartbear.com/web-monitoring/why-containers-instead-of-hypervisors/
[12] P. M. Mell and T. Grance, “Sp 800-145. the nist definition of cloud computing,”National Institute of Standards & Technology, Gaithersburg, MD, United States,Tech. Rep., 2011.
[13] Oracle. 1.1.1. Brief History of Virtualization. [Online]. Available: https://docs.oracle.com/cd/E26996_01/E18549/html/VMUSG1010.html
[14] VMware, Inc. (2007, 09) Understanding Full Virtualization, Paravirtualizationand Hardware Assist. [Online]. Available: https://www.vmware.com/files/pdf/VMware_paravirtualization.pdf
[15] R. Vanover. (2009, 06) Type 1 and Type 2 Hypervisors Explained. (Ac-cessed on 05/24/2016). [Online]. Available: https://virtualizationreview.com/blogs/everyday-virtualization/2009/06/type-1-and-type-2-hypervisors-explained.aspx
26
[16] P. Rubens. (2015) What are containers and why do you need them? | cio. (Ac-cessed on 05/12/2016). [Online]. Available: http://www.cio.com/article/2924995/enterprise-software/what-are-containers-and-why-do-you-need-them.html
[17] VMware, Inc., “vSphere ESXi Hypervisor,” 2016. [Online]. Available: http://www.vmware.com/se/products/vsphere/features/esxi-hypervisor.html
[18] (2016) Vmware vsphere with operations management: High availability| vmware sverige. (Accessed on 05/06/2016). [Online]. Available: http://www.vmware.com/se/products/vsphere/features/high-availability
[19] (2016) vsphere fault tolerance: Vmware | vmware sverige. (Accessed on05/06/2016). [Online]. Available: http://www.vmware.com/se/products/vsphere/features/fault-tolerance.html
[20] B. Corrie. (2015, 06) Introducing Project Bonneville - Cloud-Native AppsCloud-Native Apps - VMware Blogs. (Accessed on 05/24/2016). [Online]. Available:http://blogs.vmware.com/cloudnative/introducing-project-bonneville/
[21] CoreOS. Using CoreOS. (Accessed on 05/24/2016). [Online]. Available: https://coreos.com/using-coreos/
[22] ——, “Using fleet with coreos,” https://coreos.com/using-coreos/clustering/, (Ac-cessed on 02/25/2016).
[23] (2016) About centos. (Accessed on 05/06/2016). [Online]. Available: https://www.centos.org/about/
[24] . Docker. (2016) What is docker? (Accessed on 05/20/2016). [Online]. Available:https://www.docker.com/what-docker
[25] Netcraft Ltd. (2016) November 2015 Web Server Survey. [Online]. Available: http://news.netcraft.com/archives/2015/11/16/november-2015-web-server-survey.html
[26] Apache Software Foundation. (2016) Foundation Project. [Online]. Available:http://www.apache.org/foundation/
[27] ——. (2016) Apache JMeter - User’s Manual: Introduction. [Online]. Available:http://jmeter.apache.org/usermanual/intro.html
[28] M. AB, “Mysql ab :: Sun to acquire mysql,” https://web.archive.org/web/20080117192218/http://www.mysql.com:80/news-and-events/sun-to-acquire-mysql.html, 01 2008, (Accessed on 05/03/2016).
[29] T. T. FAQ, “Transactional database,” http://www.tech-faq.com/transactional-database.html, 10 2012, (Accessed on 05/03/2016).
[30] F. Penov. (2010) networking - what % of traffic is network over-head on top of http/s requests - stack overflow. (Accessed on07/27/2016). [Online]. Available: http://stackoverflow.com/questions/3613989/what-of-traffic-is-network-overhead-on-top-of-http-s-requests
[31] How to benchmark disk I/O. [Online]. Available: https://www.binarylane.com.au/support/solutions/articles/1000055889-how-to-benchmark-disk-i-o
27
A Appendix A: System Documentation
Appendix A contains all the documentation describing the topology used in this thesisproject.
A.1 Physical Configuration
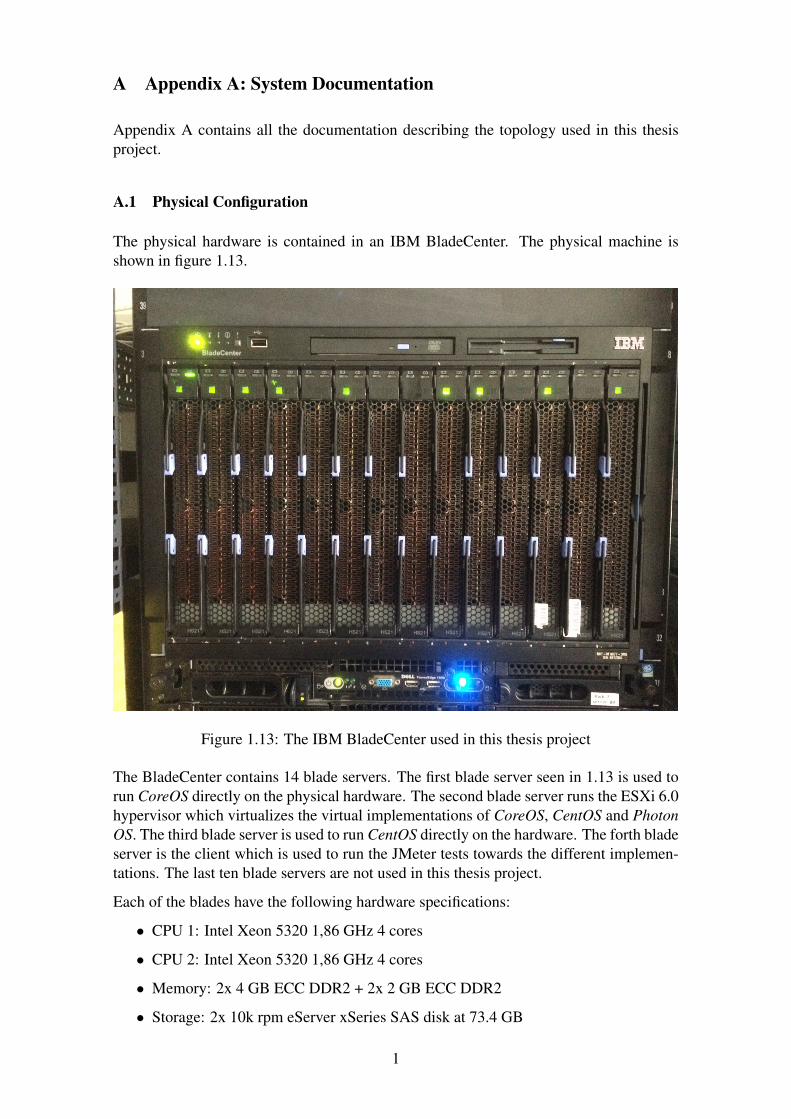
The physical hardware is contained in an IBM BladeCenter. The physical machine isshown in figure 1.13.
Figure 1.13: The IBM BladeCenter used in this thesis project
The BladeCenter contains 14 blade servers. The first blade server seen in 1.13 is used torun CoreOS directly on the physical hardware. The second blade server runs the ESXi 6.0hypervisor which virtualizes the virtual implementations of CoreOS, CentOS and PhotonOS. The third blade server is used to run CentOS directly on the hardware. The forth bladeserver is the client which is used to run the JMeter tests towards the different implemen-tations. The last ten blade servers are not used in this thesis project.
Each of the blades have the following hardware specifications:
• CPU 1: Intel Xeon 5320 1,86 GHz 4 cores
• CPU 2: Intel Xeon 5320 1,86 GHz 4 cores
• Memory: 2x 4 GB ECC DDR2 + 2x 2 GB ECC DDR2
• Storage: 2x 10k rpm eServer xSeries SAS disk at 73.4 GB
1
• 2x Gigabit Ethernet Network Interfaces
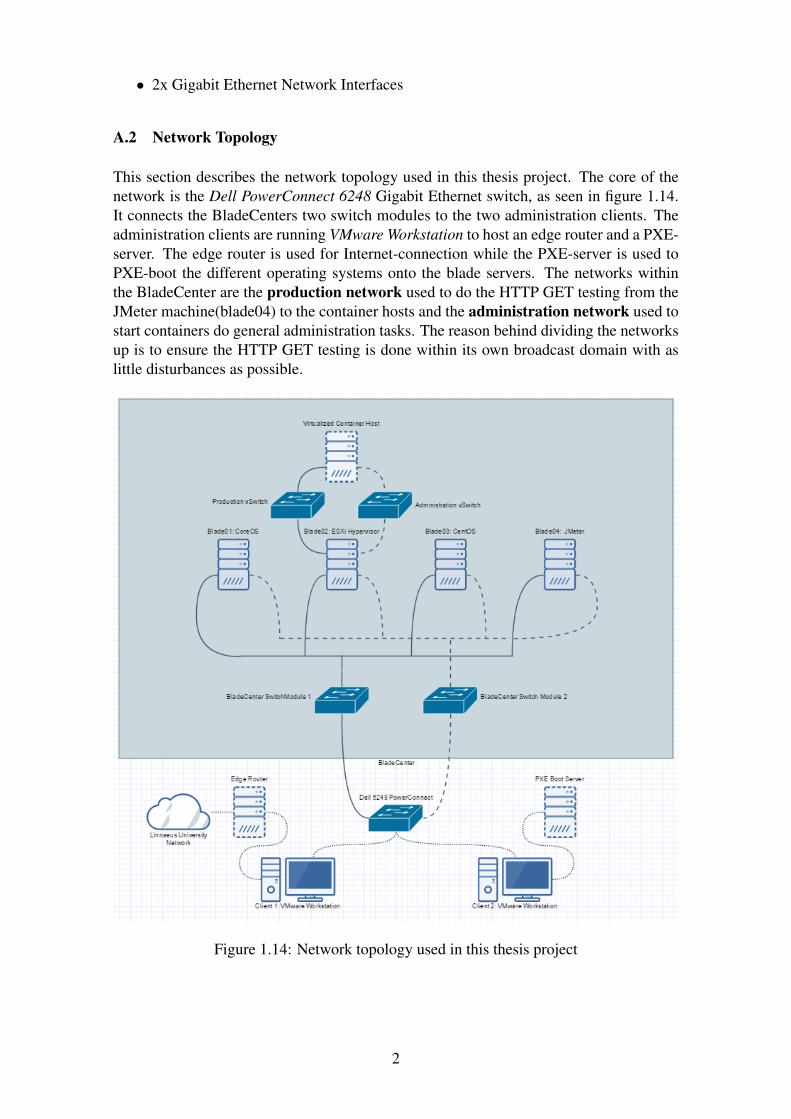
A.2 Network Topology
This section describes the network topology used in this thesis project. The core of thenetwork is the Dell PowerConnect 6248 Gigabit Ethernet switch, as seen in figure 1.14.It connects the BladeCenters two switch modules to the two administration clients. Theadministration clients are running VMware Workstation to host an edge router and a PXE-server. The edge router is used for Internet-connection while the PXE-server is used toPXE-boot the different operating systems onto the blade servers. The networks withinthe BladeCenter are the production network used to do the HTTP GET testing from theJMeter machine(blade04) to the container hosts and the administration network used tostart containers do general administration tasks. The reason behind dividing the networksup is to ensure the HTTP GET testing is done within its own broadcast domain with aslittle disturbances as possible.
Figure 1.14: Network topology used in this thesis project
2
A.3 Versions
This chapter contains the versions and releases of the software and operating systemsused in this thesis project. Table 1.1 show the kernel-, Docker- and operating system-versions used. For Apache JMeter, the version number is 2.13 and Jmeter Extras 1.31 isalso installed for the extra functionality to merge the data from different tests.
Table 1.1: Kernel-, Docker- and OS-versions of the operating systems used in this thesisproject
Type CentOS CoreOS Photon OSKernel 3.10.0-327.10.1.el7.x86_64 4.3.7-coreos 4.0.9
Docker1.8.2-el17.centos,
build a01dc02/1.8.21.9.1,
build 98946981.8.1,
build d12ea79OS Release 7.2.1511 899.15.0 1.0 Tech Preview 2
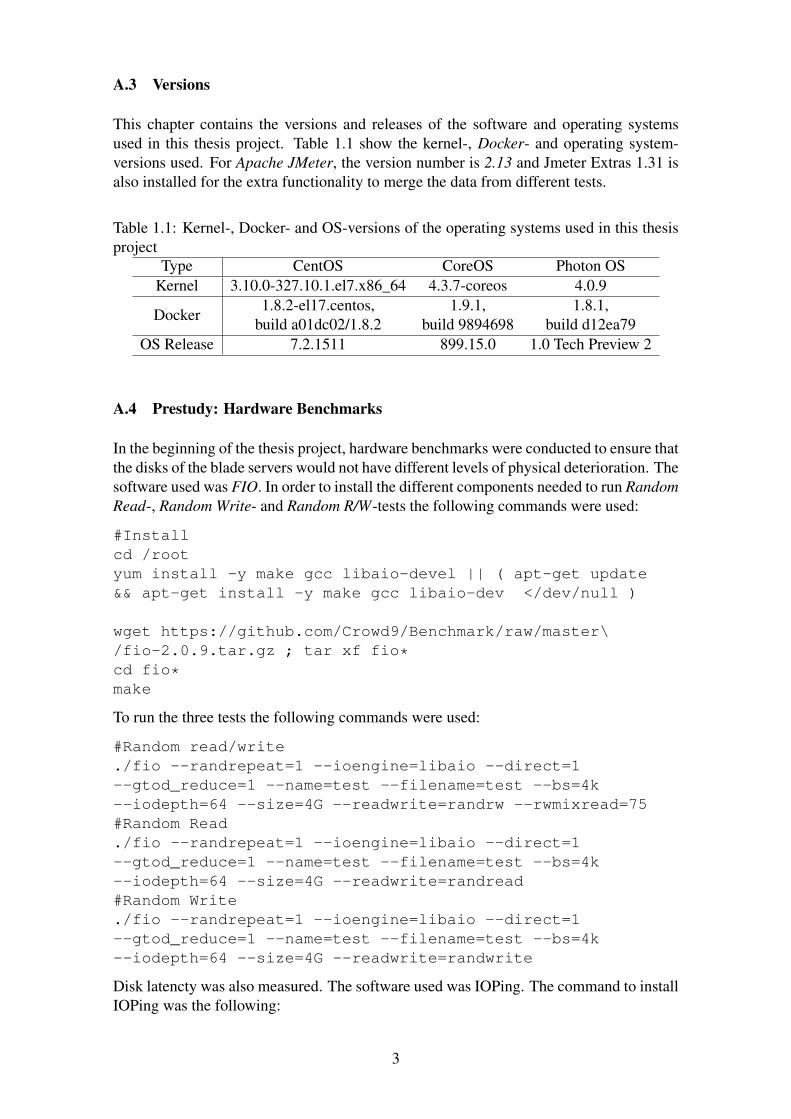
A.4 Prestudy: Hardware Benchmarks
In the beginning of the thesis project, hardware benchmarks were conducted to ensure thatthe disks of the blade servers would not have different levels of physical deterioration. Thesoftware used was FIO. In order to install the different components needed to run RandomRead-, Random Write- and Random R/W-tests the following commands were used:
#Installcd /rootyum install -y make gcc libaio-devel || ( apt-get update&& apt-get install -y make gcc libaio-dev </dev/null )
wget https://github.com/Crowd9/Benchmark/raw/master\/fio-2.0.9.tar.gz ; tar xf fio*cd fio*make
To run the three tests the following commands were used:
#Random read/write./fio --randrepeat=1 --ioengine=libaio --direct=1--gtod_reduce=1 --name=test --filename=test --bs=4k--iodepth=64 --size=4G --readwrite=randrw --rwmixread=75#Random Read./fio --randrepeat=1 --ioengine=libaio --direct=1--gtod_reduce=1 --name=test --filename=test --bs=4k--iodepth=64 --size=4G --readwrite=randread#Random Write./fio --randrepeat=1 --ioengine=libaio --direct=1--gtod_reduce=1 --name=test --filename=test --bs=4k--iodepth=64 --size=4G --readwrite=randwrite
Disk latencty was also measured. The software used was IOPing. The command to installIOPing was the following:
3
cd /rootyum install -y make gcc libaio-devel || ( apt-get update &&apt-get install -y make gcc libaio-dev </dev/null )wget https://ioping.googlecode.com/files/ioping-0.6.tar.gz; tar xf ioping*cd ioping*make
To run the test the following command was used:
#Test./ioping -c 10 .
A.5 Docker Commands
The following script is used to deploy the LAMP stack which includes a MySQL containerand an Apache container:
#!/bin/bash
# Enviroment variablesexport ROOT_PASSWORD=passwordexport WORDPRESS_PASSWORD=password
# Run MySQL containerdocker run --detach \
--name mysql1 \--env MYSQL_ROOT_PASSWORD=$ROOT_PASSWORD \--env MYSQL_USER=wordpress \--env MYSQL_PASSWORD=$WORDPRESS_PASSWORD \--env MYSQL_DATABASE=wordpress \mysql
sleep 10# Run Wordpress containerdocker run --detach \
--publish 80:80 \--name wordpress1 \--env WORDPRESS_DB_HOST=mysql:3306 \--link mysql1:mysql \--env WORDPRESS_DB_USER=wordpress \--env WORDPRESS_DB_PASSWORD=$WORDPRESS_PASSWORD \
wordpress
4
A.6 PHP Scripts
The two following PHP scripts describes how to establish and connect to a MySQLdatabase server and measure the time to complete SELECT or INSERT queries.
A.6.1 SQL SELECT
The following PHP script is used to measure the time it takes to complete an SQL-SELECT query:
<?php$servername = "mysql1";$username = "wordpress";$password = "password";$dbname = "wordpress";
// Create connection$conn = new mysqli($servername, $username, $password);
// Check connectionif($conn->connect_error) {die("Connection failed: " . $conn->connect_error);}echo "Connected successfully\n";
$sql = "USE wordpress";$conn->query($sql);
$sql = "SELECT * FROM wp_users";$time = microtime(TRUE);$conn->query($sql);$time = microtime(TRUE) - $time;echo "Time to complete 1 SQL SELECT: ";echo $time;echo "\n";?>
5
A.6.2 SQL INSERT
The following PHP script is used to test the time it takes for the web server to complete10 000 SQL-INSERT queries where the value ”test” is inserted to a test table within theWordpress database:
<?php$servername = "mysql1";$username = "wordpress";$password = "password";$dbname = "wordpress";
// Create connection$conn = new mysqli($servername, $username, $password);
// Check connectionif($conn->connect_error) {die("Connection failed: " . $conn->connect_error);}echo "Connected successfully\n";
$sql = "USE wordpress";$conn->query($sql);
$sql = "INSERT INTO test_table(test) VALUES(’test’)";$time = microtime(TRUE);for($i = 0; $i < 10000; $i++) {$conn->query($sql);}$time = microtime(TRUE) - $time;echo "Time to complete 10 000 SQL INSERT: ";echo $time;echo "\n";?>
6
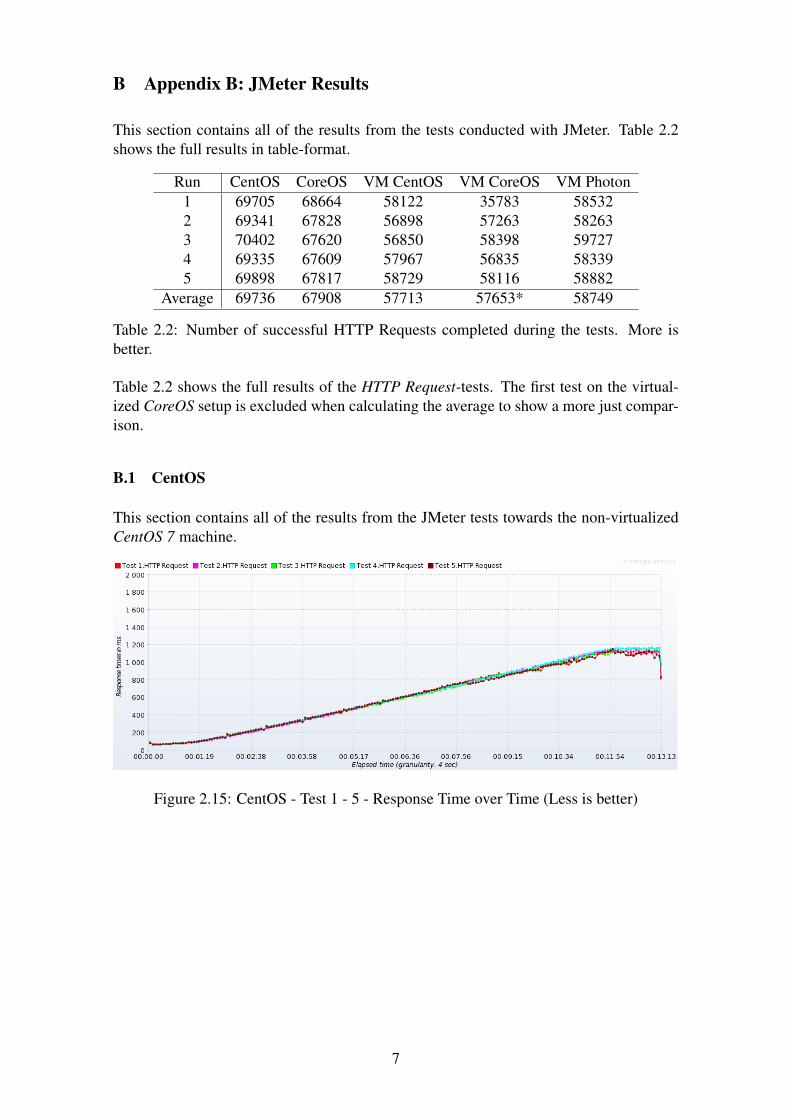
B Appendix B: JMeter Results
This section contains all of the results from the tests conducted with JMeter. Table 2.2shows the full results in table-format.
Run CentOS CoreOS VM CentOS VM CoreOS VM Photon1 69705 68664 58122 35783 585322 69341 67828 56898 57263 582633 70402 67620 56850 58398 597274 69335 67609 57967 56835 583395 69898 67817 58729 58116 58882
Average 69736 67908 57713 57653* 58749
Table 2.2: Number of successful HTTP Requests completed during the tests. More isbetter.
Table 2.2 shows the full results of the HTTP Request-tests. The first test on the virtual-ized CoreOS setup is excluded when calculating the average to show a more just compar-ison.
B.1 CentOS
This section contains all of the results from the JMeter tests towards the non-virtualizedCentOS 7 machine.
Figure 2.15: CentOS - Test 1 - 5 - Response Time over Time (Less is better)
7
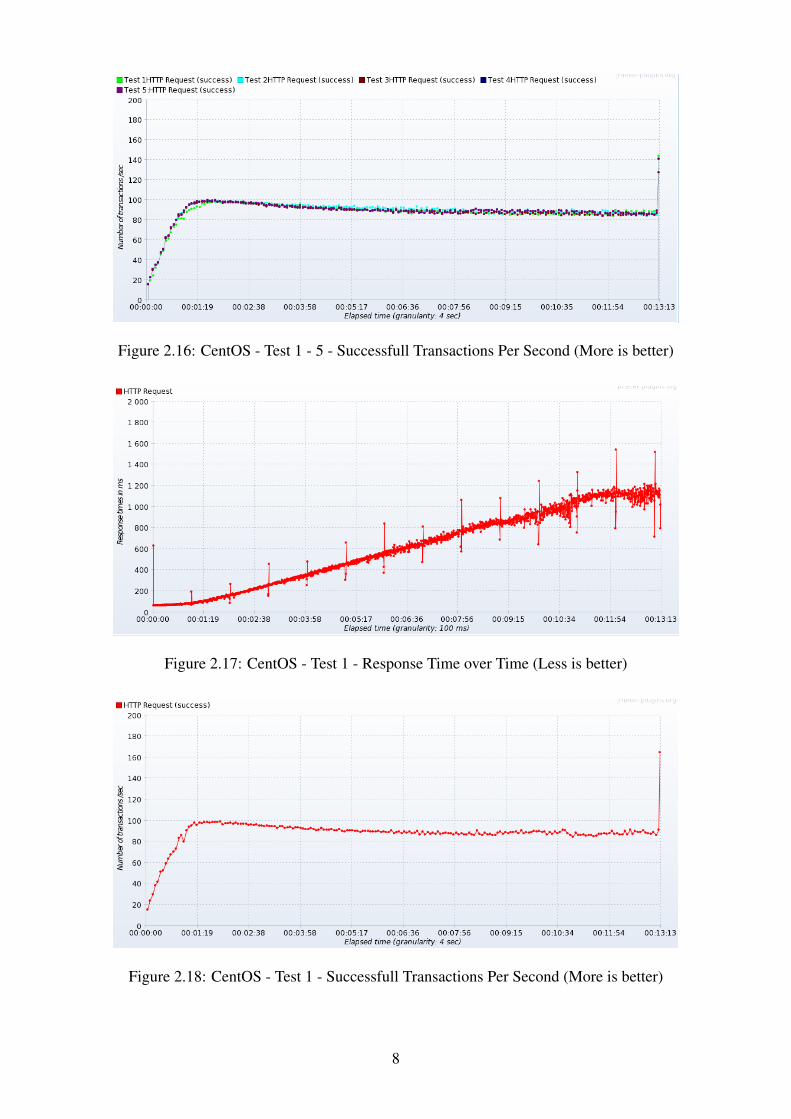
Figure 2.16: CentOS - Test 1 - 5 - Successfull Transactions Per Second (More is better)
Figure 2.17: CentOS - Test 1 - Response Time over Time (Less is better)
Figure 2.18: CentOS - Test 1 - Successfull Transactions Per Second (More is better)
8
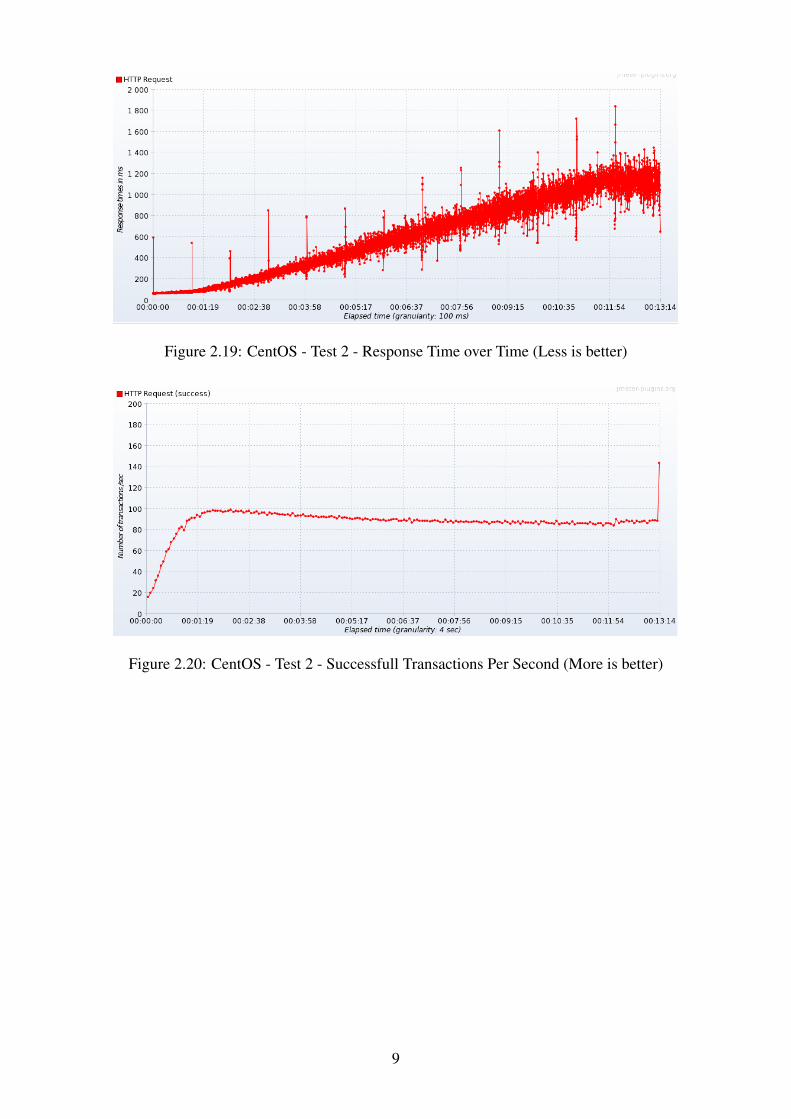
Figure 2.19: CentOS - Test 2 - Response Time over Time (Less is better)
Figure 2.20: CentOS - Test 2 - Successfull Transactions Per Second (More is better)
9
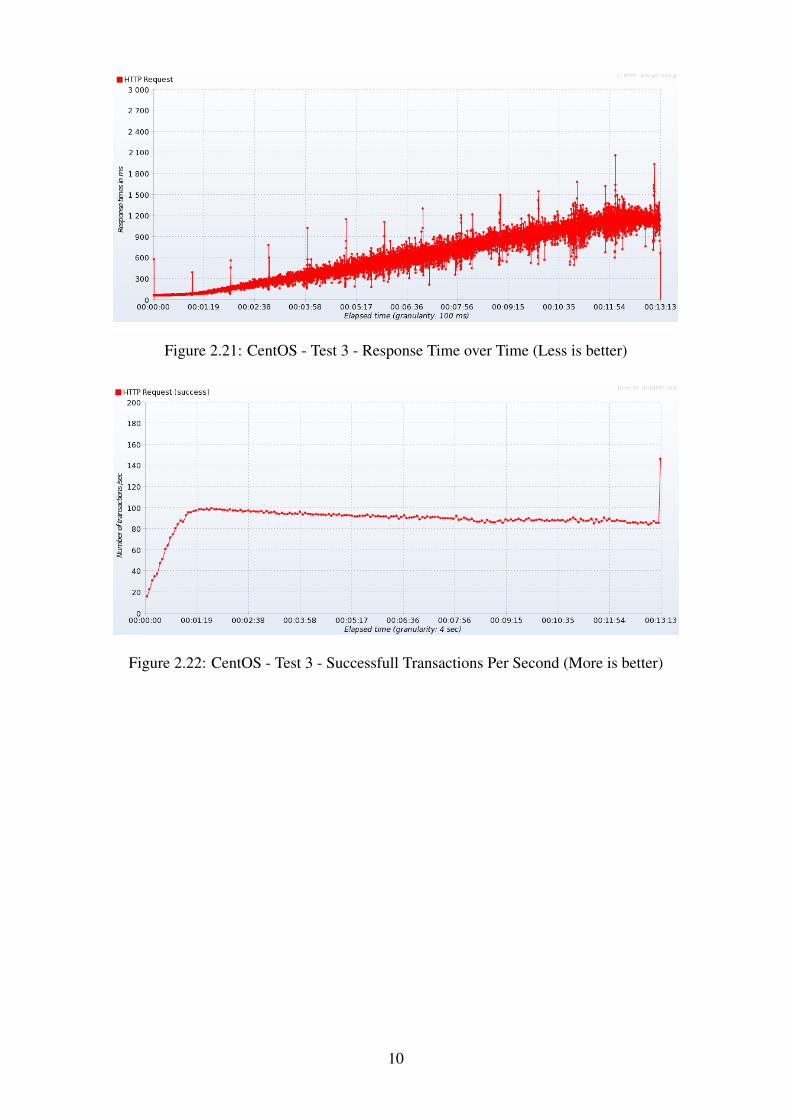
Figure 2.21: CentOS - Test 3 - Response Time over Time (Less is better)
Figure 2.22: CentOS - Test 3 - Successfull Transactions Per Second (More is better)
10
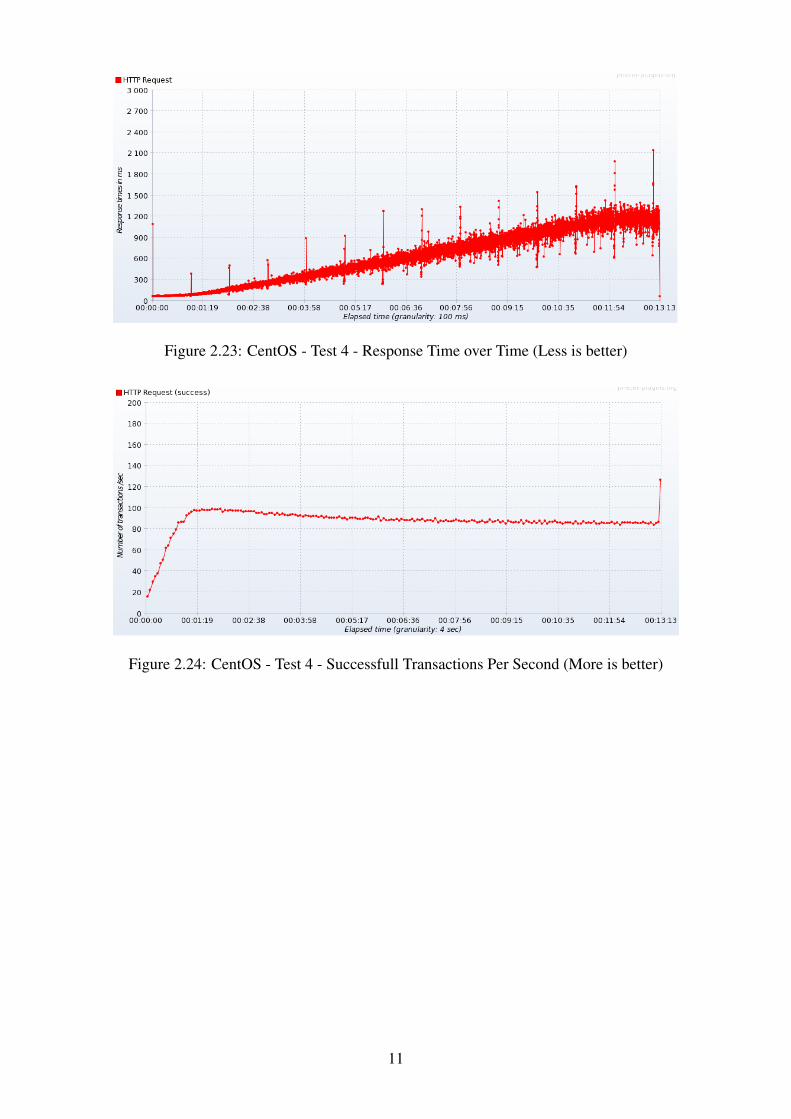
Figure 2.23: CentOS - Test 4 - Response Time over Time (Less is better)
Figure 2.24: CentOS - Test 4 - Successfull Transactions Per Second (More is better)
11
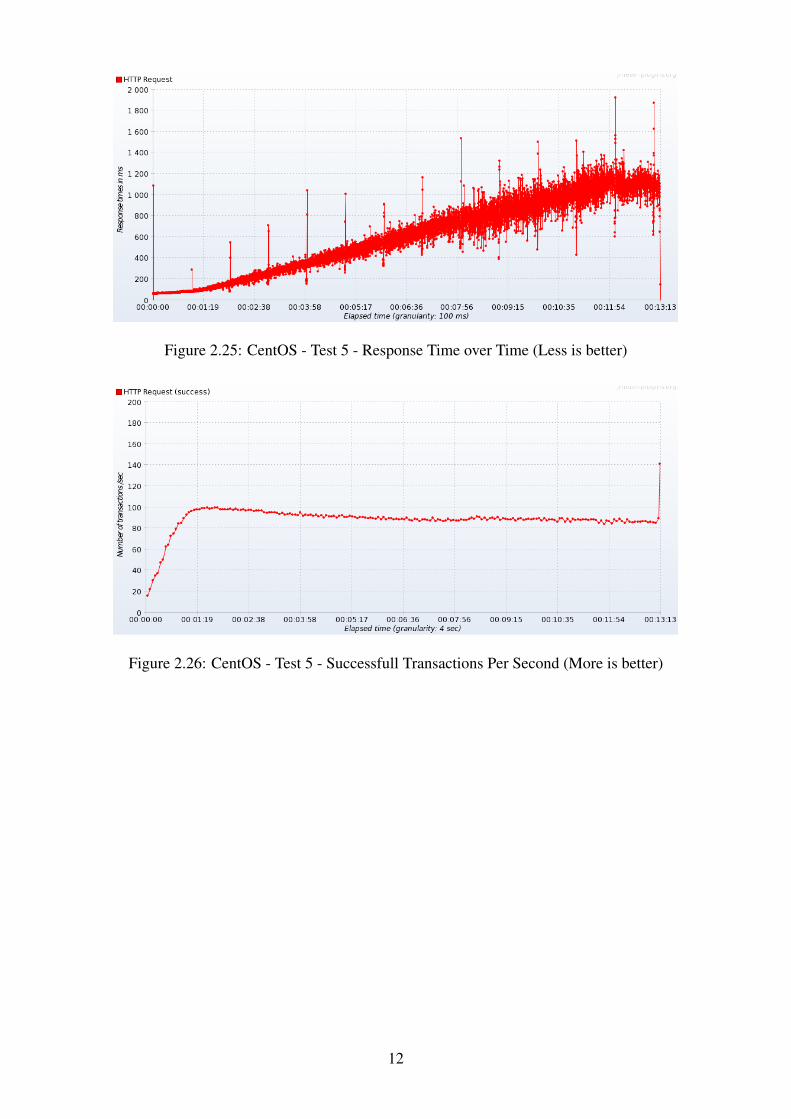
Figure 2.25: CentOS - Test 5 - Response Time over Time (Less is better)
Figure 2.26: CentOS - Test 5 - Successfull Transactions Per Second (More is better)
12
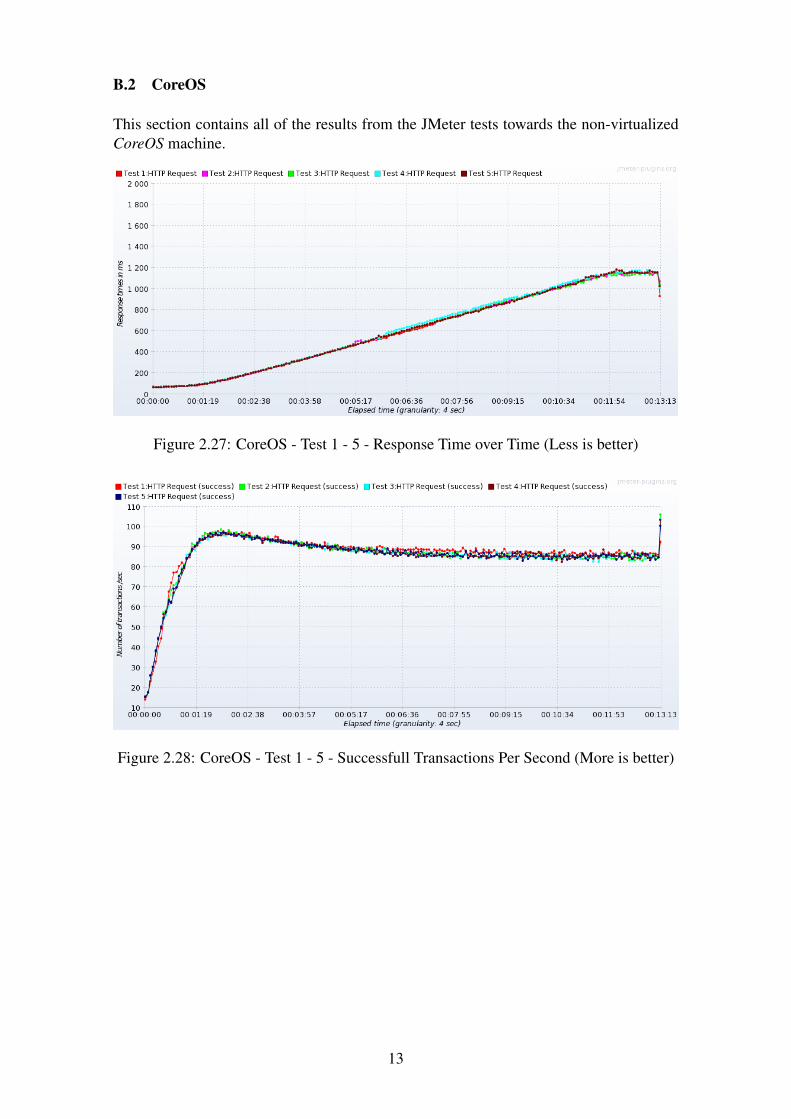
B.2 CoreOS
This section contains all of the results from the JMeter tests towards the non-virtualizedCoreOS machine.
Figure 2.27: CoreOS - Test 1 - 5 - Response Time over Time (Less is better)
Figure 2.28: CoreOS - Test 1 - 5 - Successfull Transactions Per Second (More is better)
13
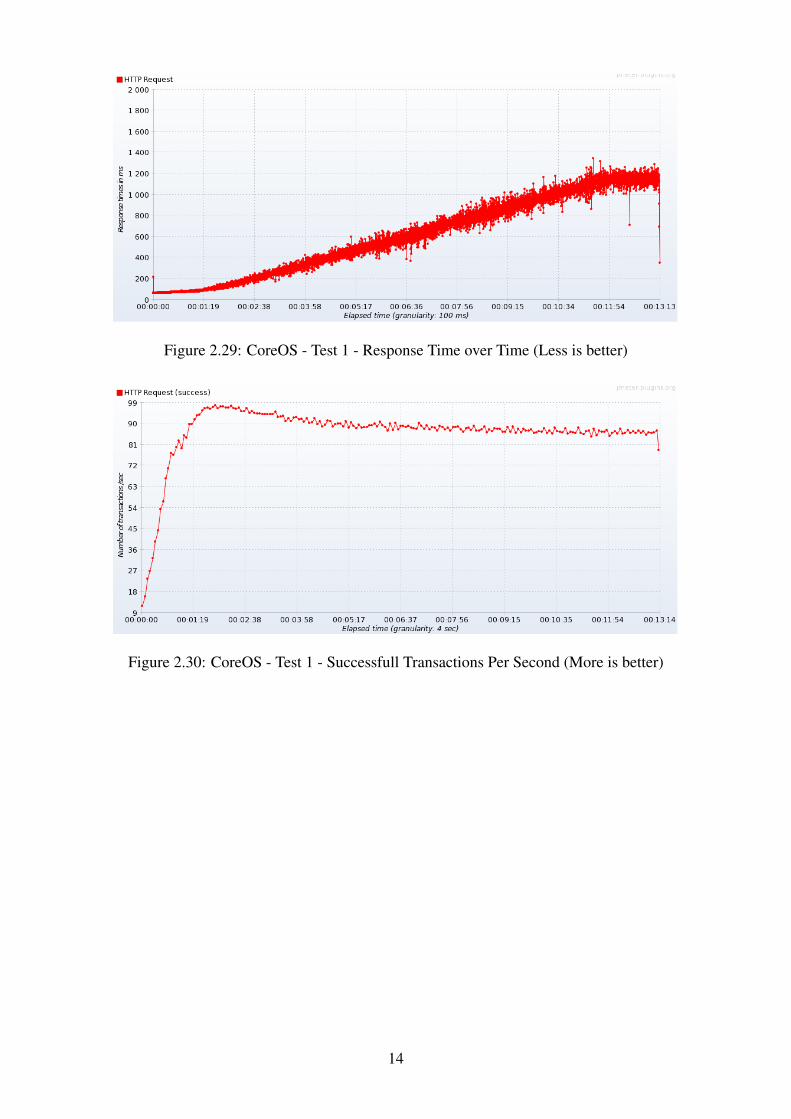
Figure 2.29: CoreOS - Test 1 - Response Time over Time (Less is better)
Figure 2.30: CoreOS - Test 1 - Successfull Transactions Per Second (More is better)
14
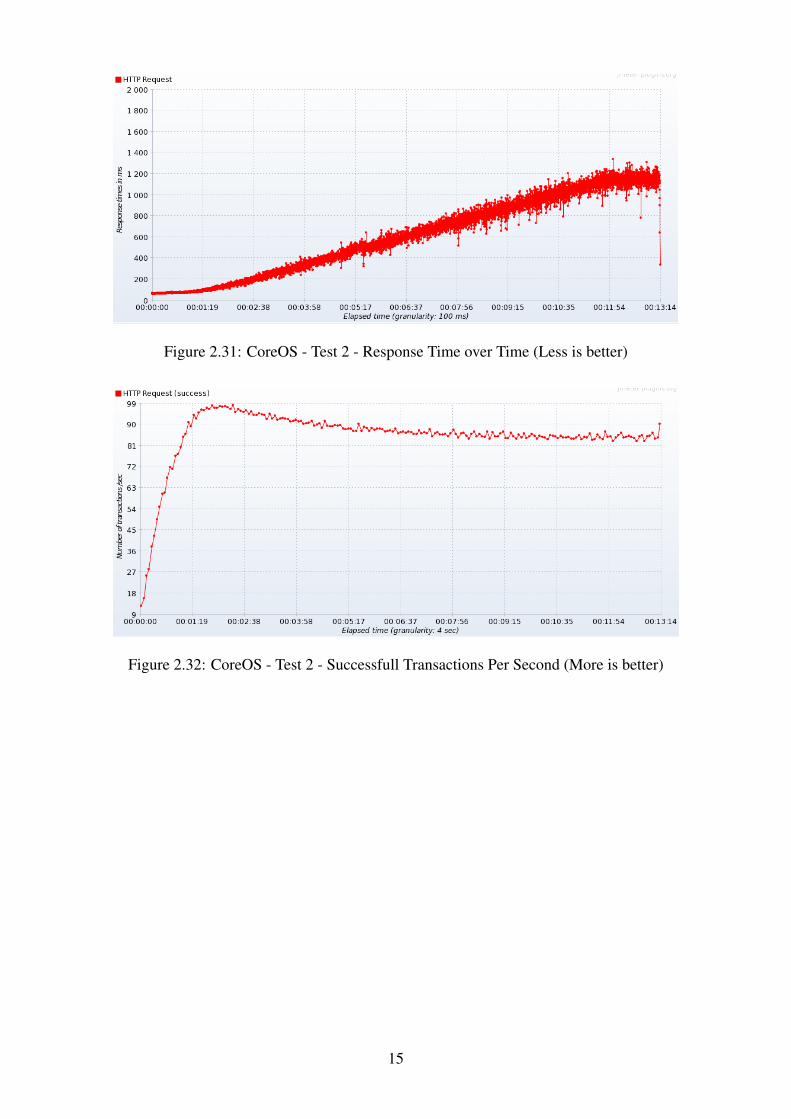
Figure 2.31: CoreOS - Test 2 - Response Time over Time (Less is better)
Figure 2.32: CoreOS - Test 2 - Successfull Transactions Per Second (More is better)
15
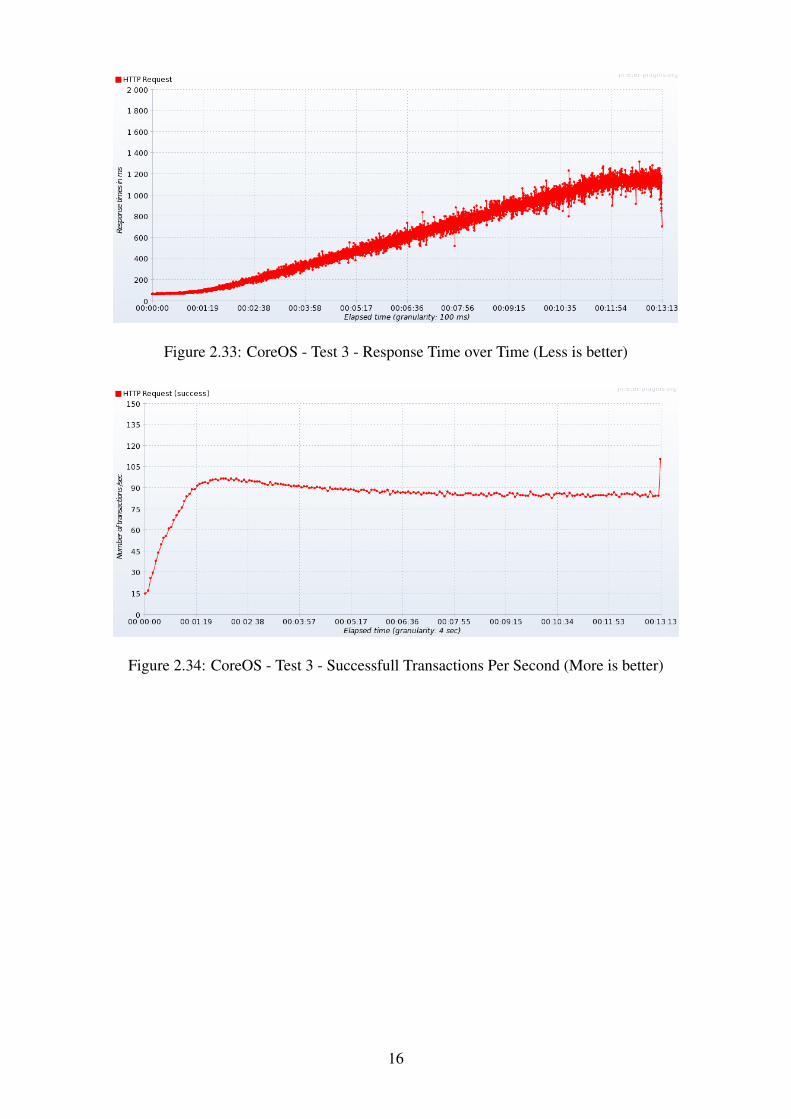
Figure 2.33: CoreOS - Test 3 - Response Time over Time (Less is better)
Figure 2.34: CoreOS - Test 3 - Successfull Transactions Per Second (More is better)
16
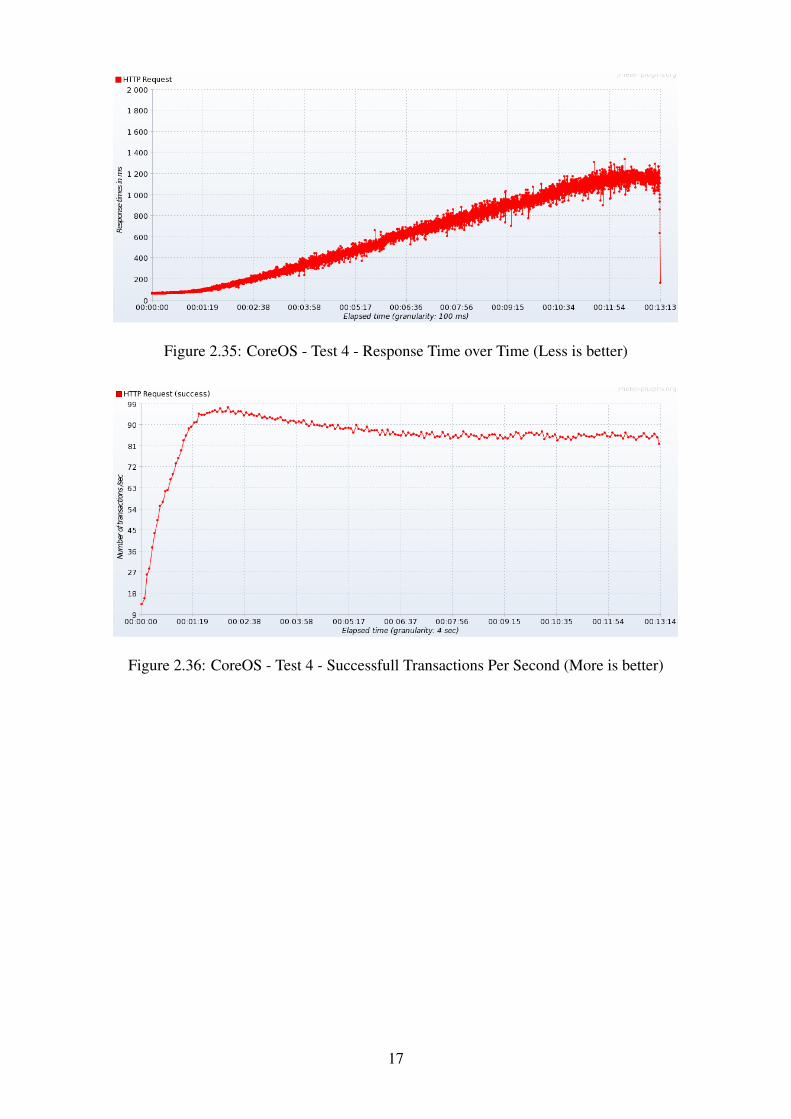
Figure 2.35: CoreOS - Test 4 - Response Time over Time (Less is better)
Figure 2.36: CoreOS - Test 4 - Successfull Transactions Per Second (More is better)
17
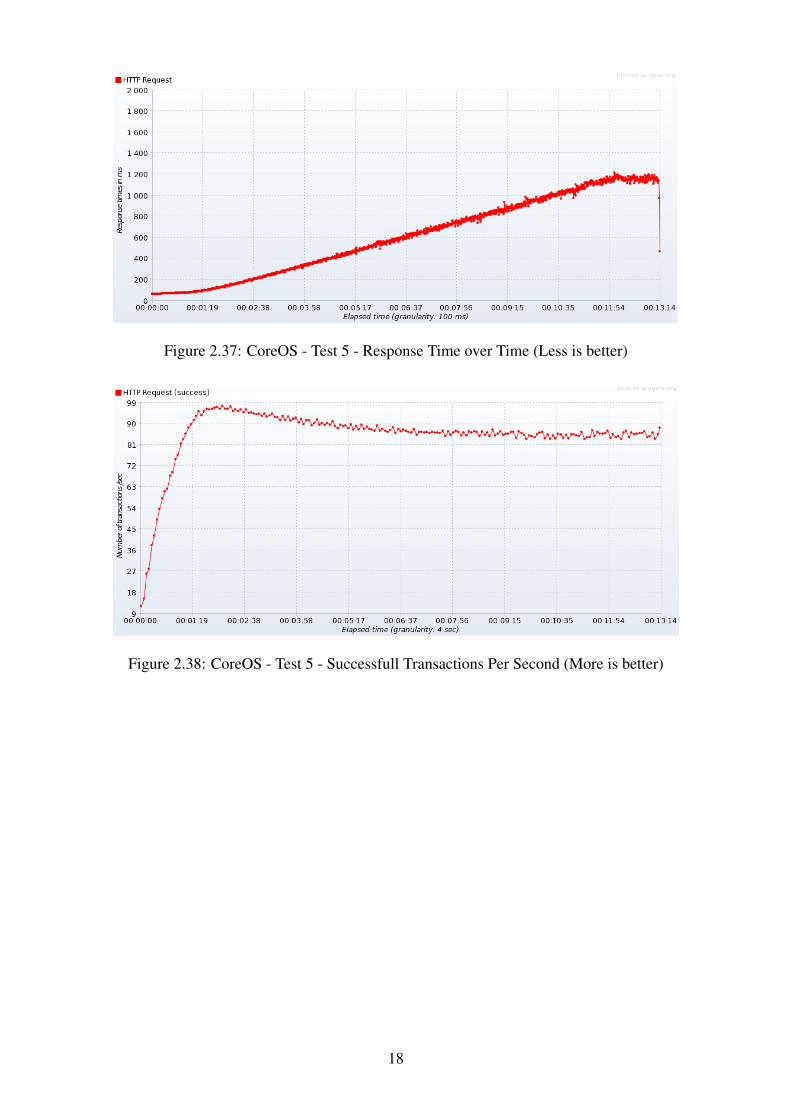
Figure 2.37: CoreOS - Test 5 - Response Time over Time (Less is better)
Figure 2.38: CoreOS - Test 5 - Successfull Transactions Per Second (More is better)
18
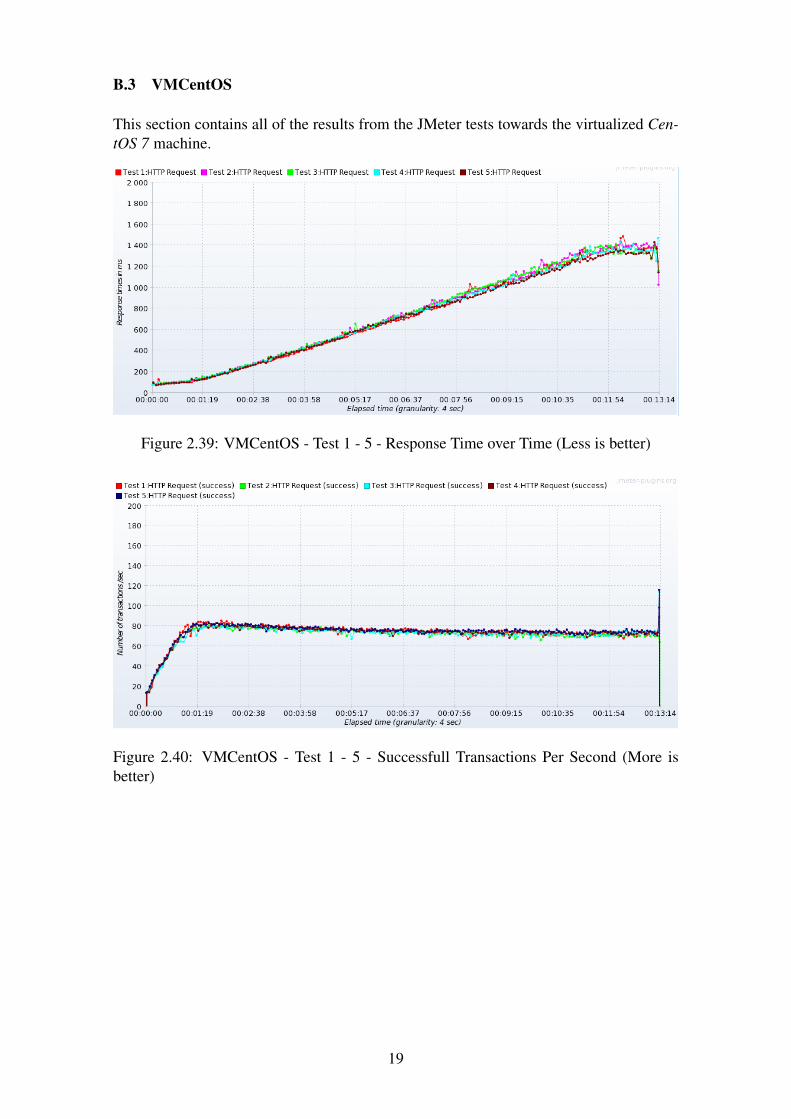
B.3 VMCentOS
This section contains all of the results from the JMeter tests towards the virtualized Cen-tOS 7 machine.
Figure 2.39: VMCentOS - Test 1 - 5 - Response Time over Time (Less is better)
Figure 2.40: VMCentOS - Test 1 - 5 - Successfull Transactions Per Second (More isbetter)
19
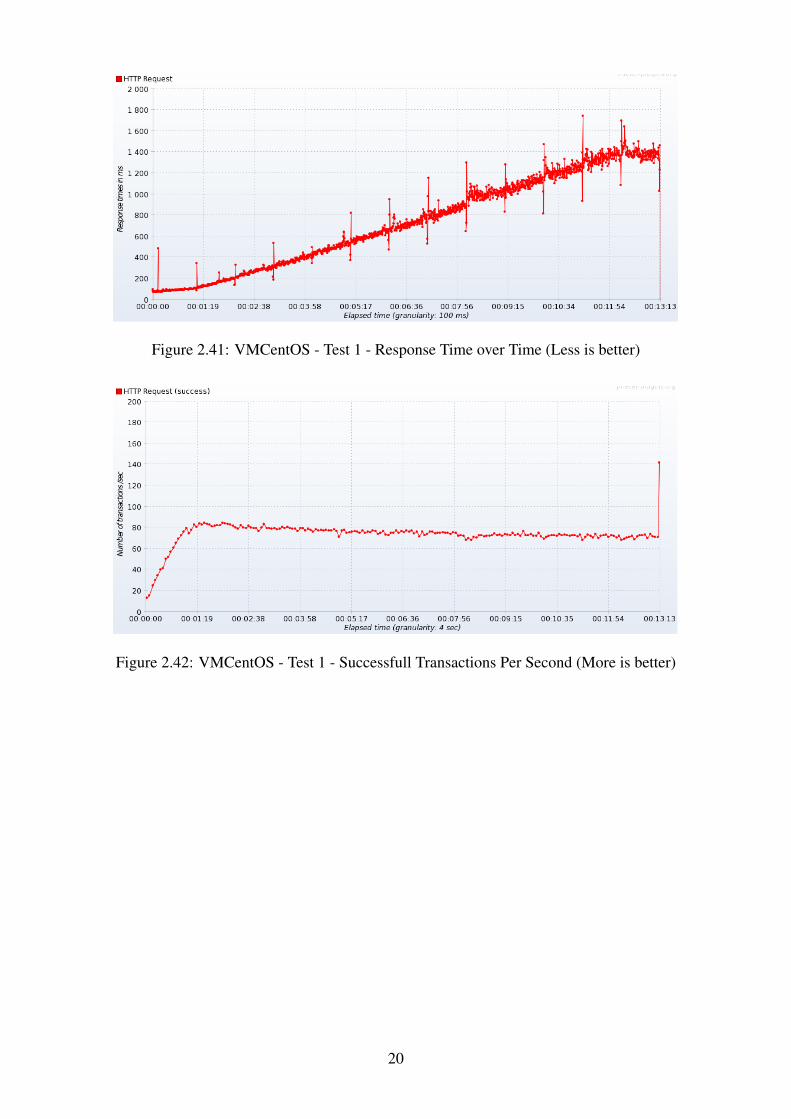
Figure 2.41: VMCentOS - Test 1 - Response Time over Time (Less is better)
Figure 2.42: VMCentOS - Test 1 - Successfull Transactions Per Second (More is better)
20
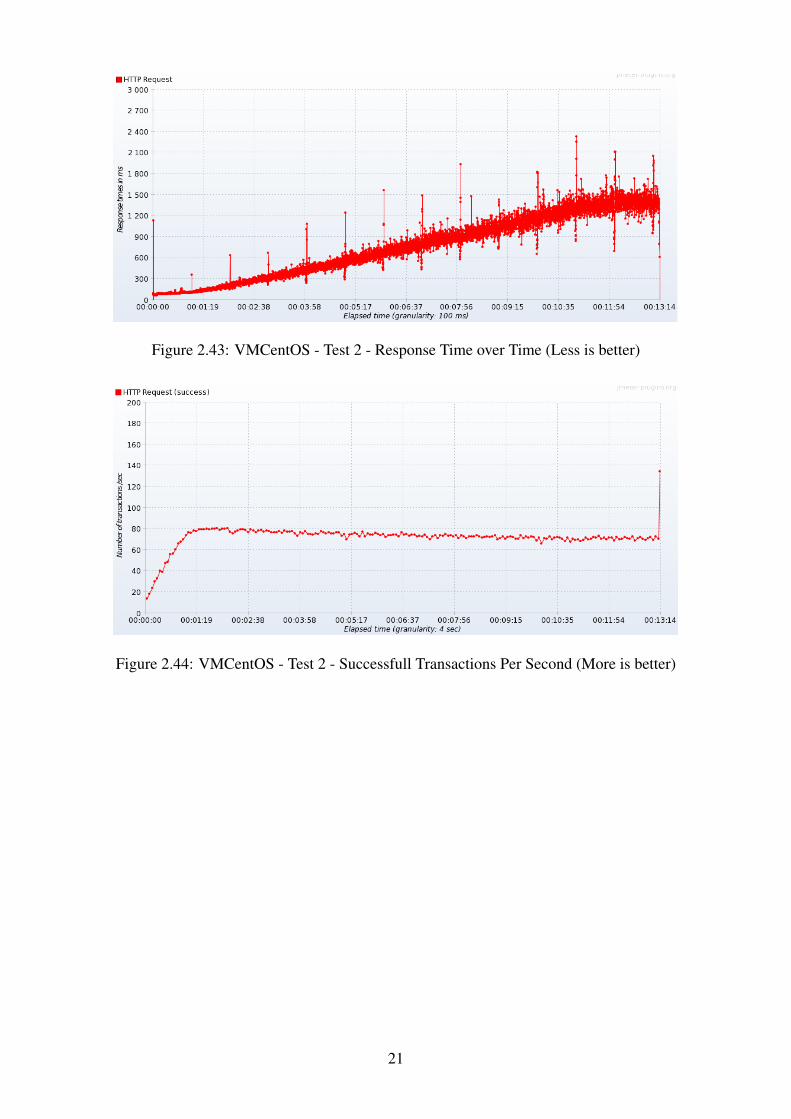
Figure 2.43: VMCentOS - Test 2 - Response Time over Time (Less is better)
Figure 2.44: VMCentOS - Test 2 - Successfull Transactions Per Second (More is better)
21
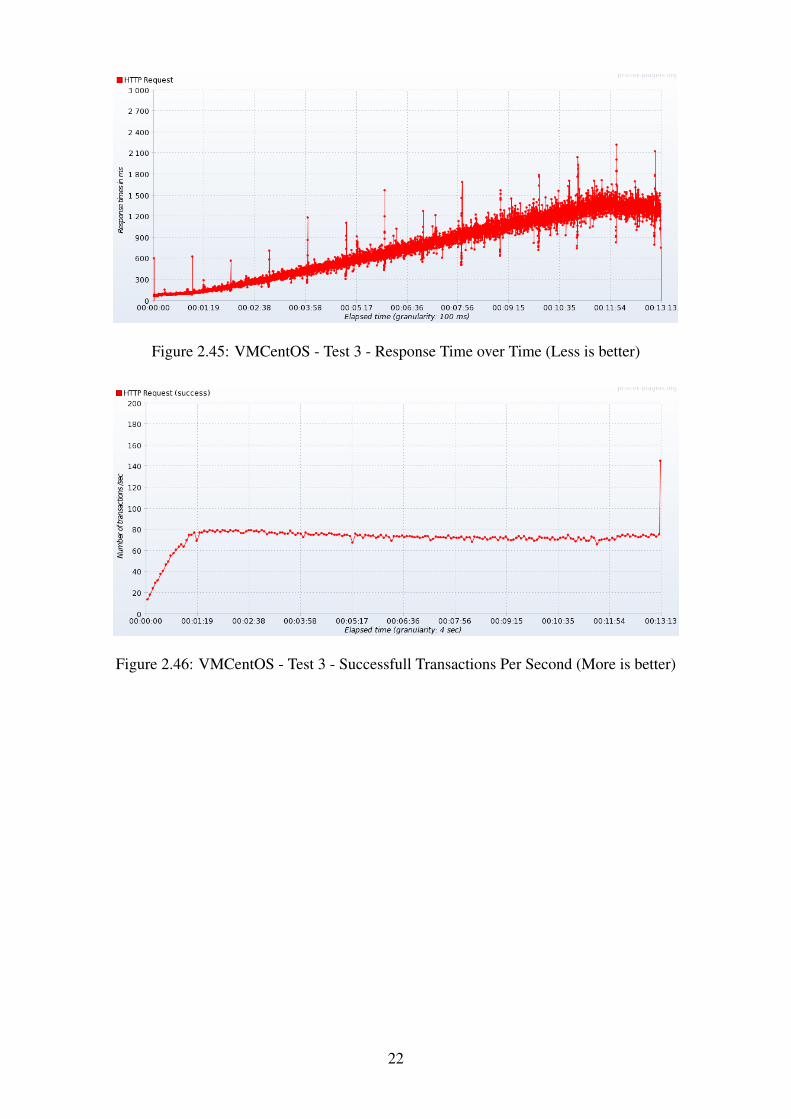
Figure 2.45: VMCentOS - Test 3 - Response Time over Time (Less is better)
Figure 2.46: VMCentOS - Test 3 - Successfull Transactions Per Second (More is better)
22

Figure 2.47: VMCentOS - Test 4 - Response Time over Time (Less is better)
Figure 2.48: VMCentOS - Test 4 - Successfull Transactions Per Second (More is better)
23
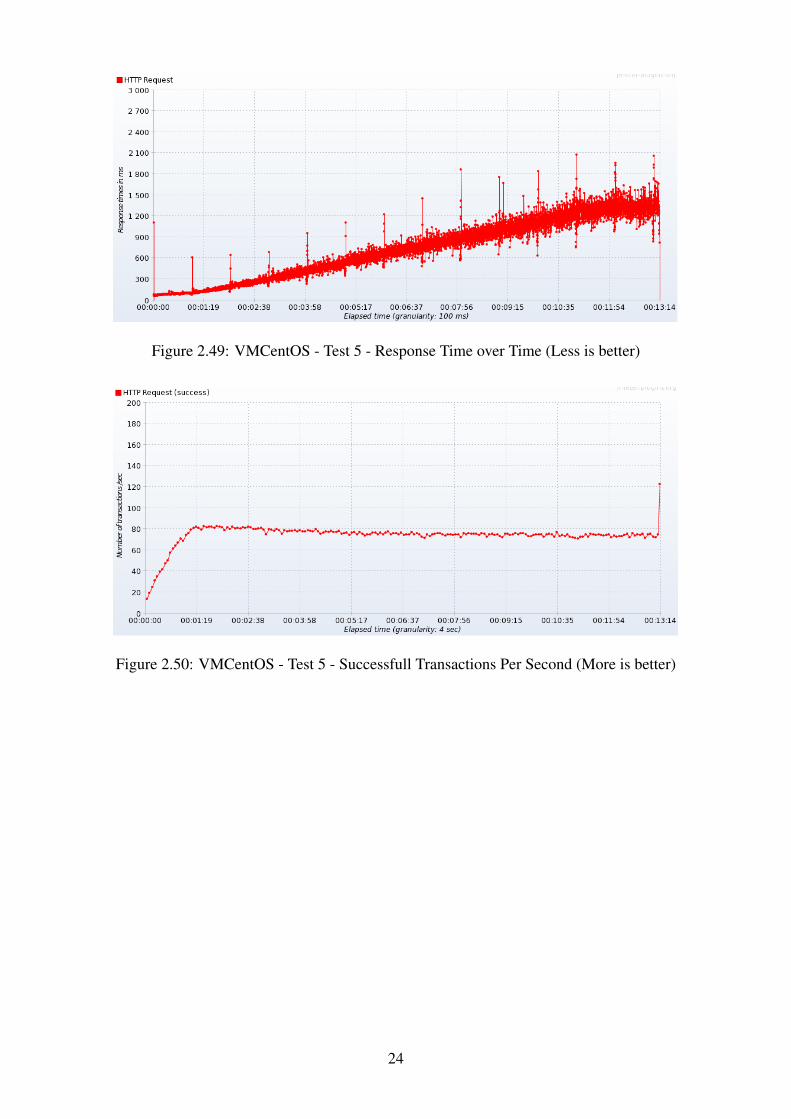
Figure 2.49: VMCentOS - Test 5 - Response Time over Time (Less is better)
Figure 2.50: VMCentOS - Test 5 - Successfull Transactions Per Second (More is better)
24
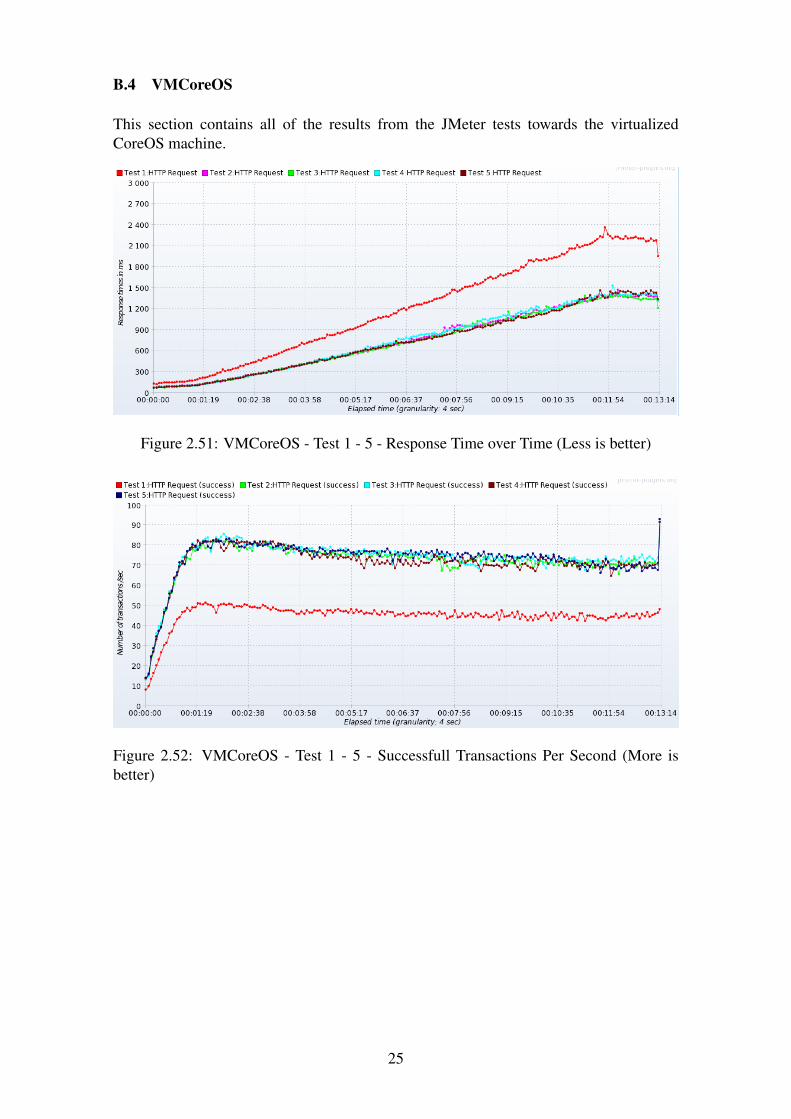
B.4 VMCoreOS
This section contains all of the results from the JMeter tests towards the virtualizedCoreOS machine.
Figure 2.51: VMCoreOS - Test 1 - 5 - Response Time over Time (Less is better)
Figure 2.52: VMCoreOS - Test 1 - 5 - Successfull Transactions Per Second (More isbetter)
25
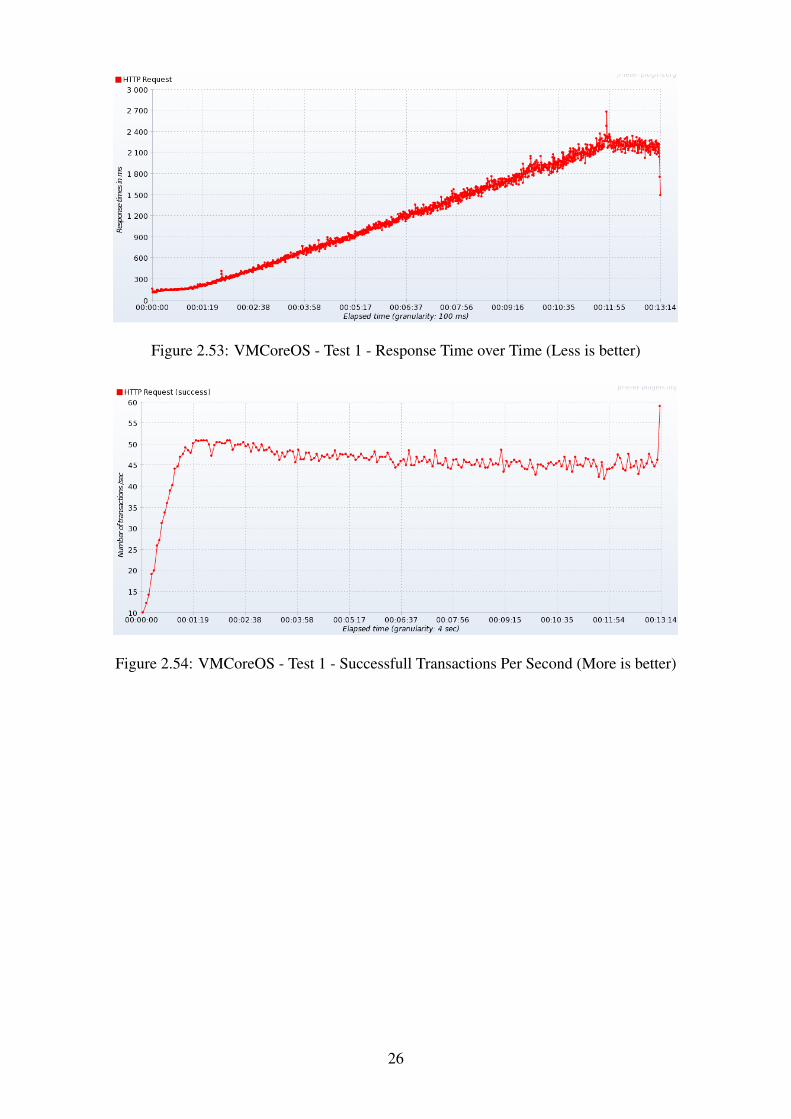
Figure 2.53: VMCoreOS - Test 1 - Response Time over Time (Less is better)
Figure 2.54: VMCoreOS - Test 1 - Successfull Transactions Per Second (More is better)
26
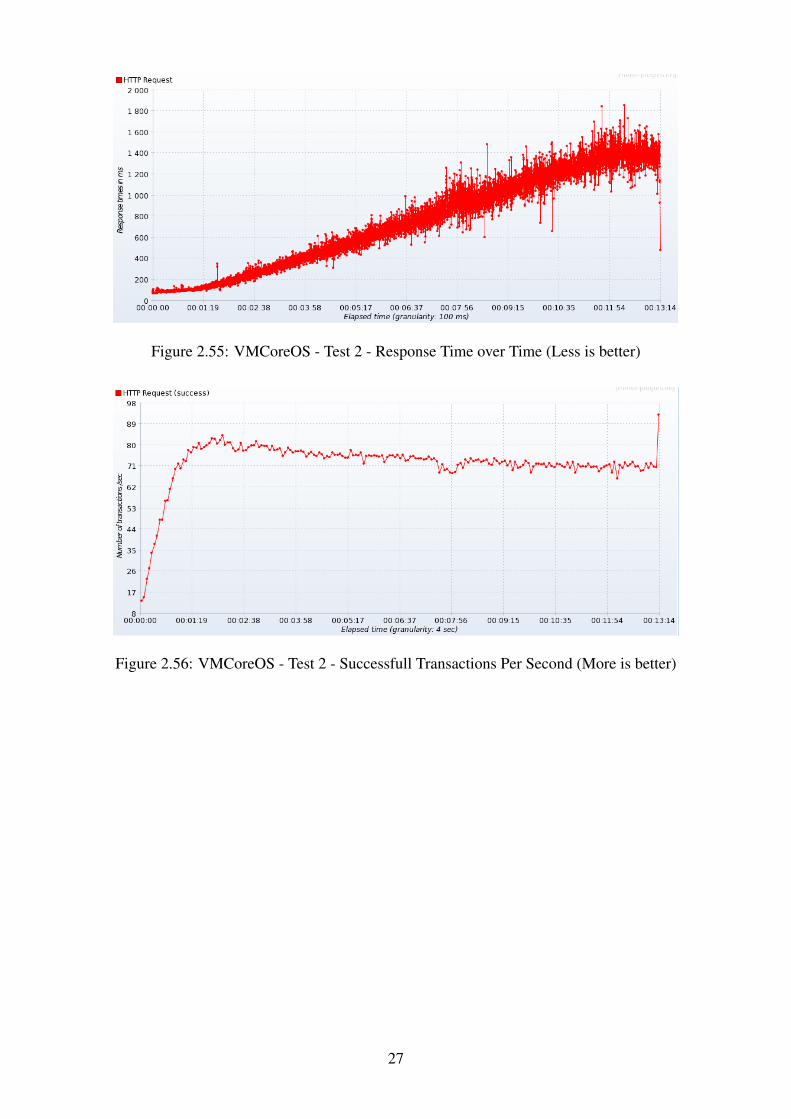
Figure 2.55: VMCoreOS - Test 2 - Response Time over Time (Less is better)
Figure 2.56: VMCoreOS - Test 2 - Successfull Transactions Per Second (More is better)
27
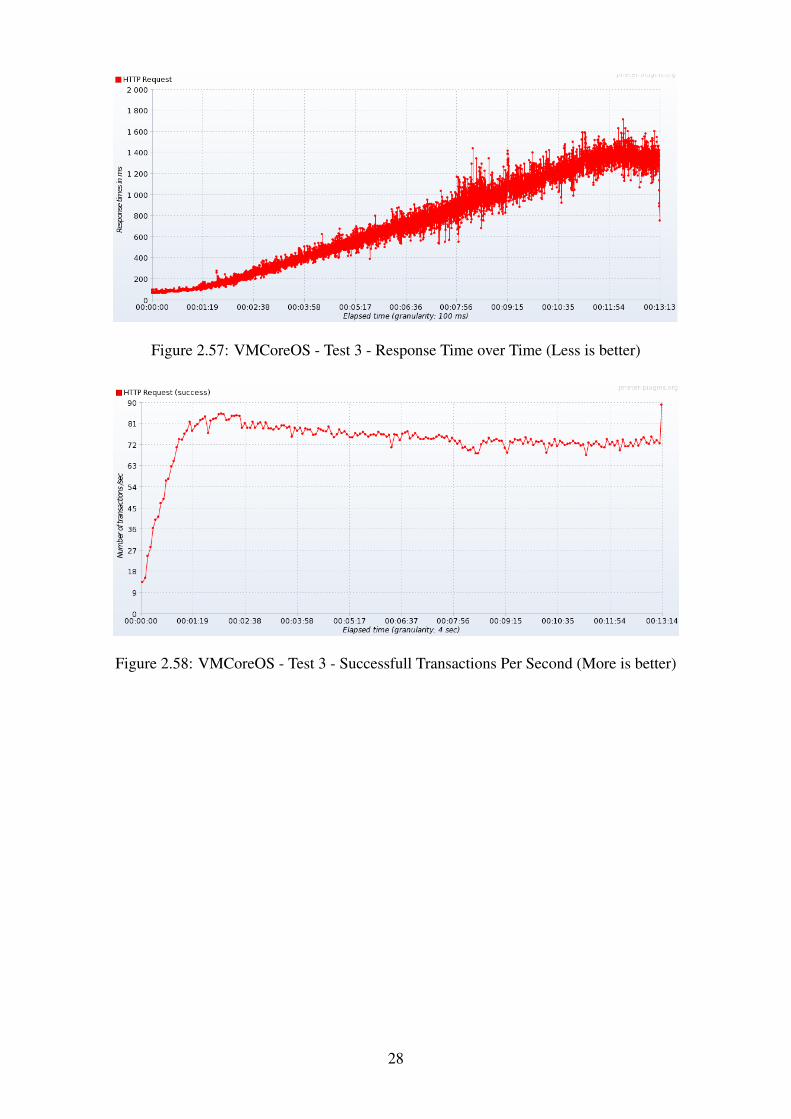
Figure 2.57: VMCoreOS - Test 3 - Response Time over Time (Less is better)
Figure 2.58: VMCoreOS - Test 3 - Successfull Transactions Per Second (More is better)
28
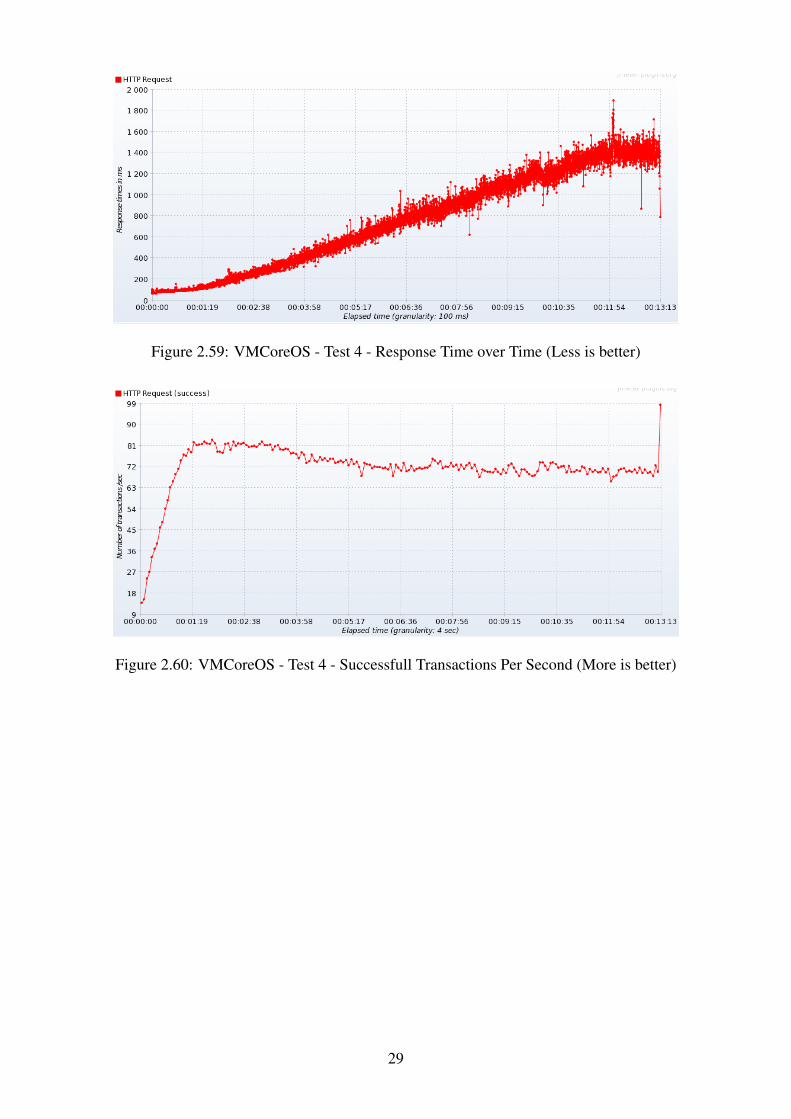
Figure 2.59: VMCoreOS - Test 4 - Response Time over Time (Less is better)
Figure 2.60: VMCoreOS - Test 4 - Successfull Transactions Per Second (More is better)
29
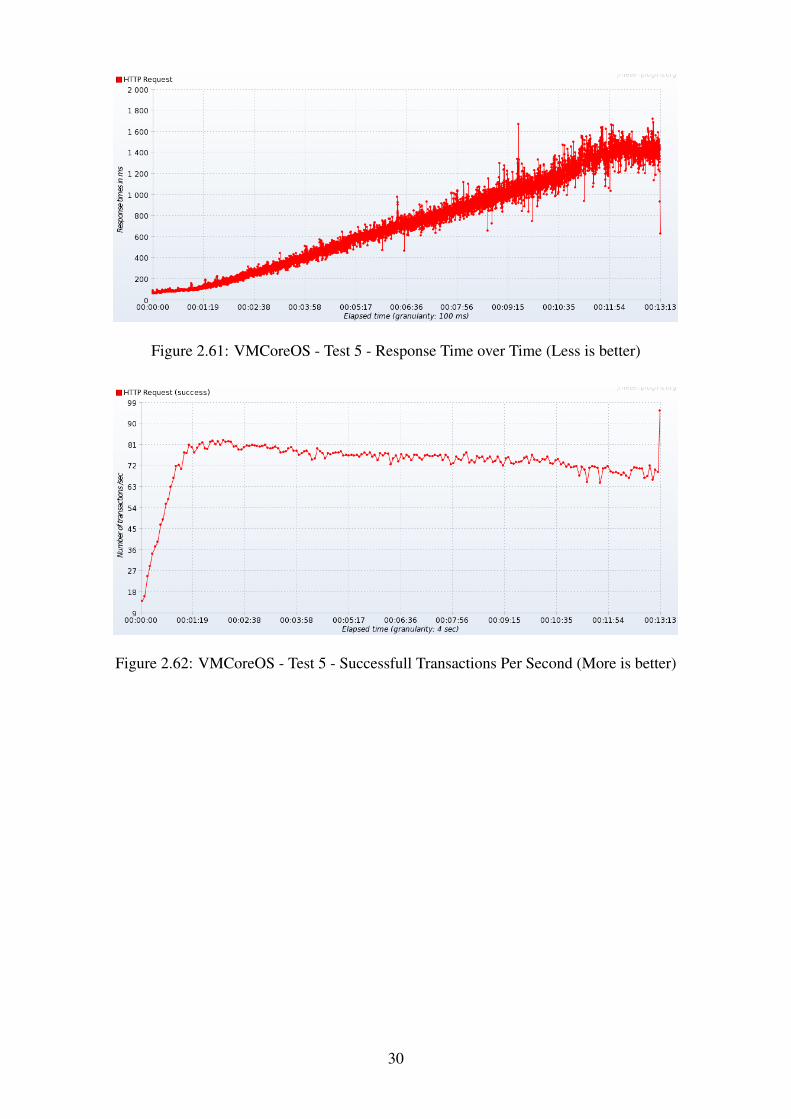
Figure 2.61: VMCoreOS - Test 5 - Response Time over Time (Less is better)
Figure 2.62: VMCoreOS - Test 5 - Successfull Transactions Per Second (More is better)
30
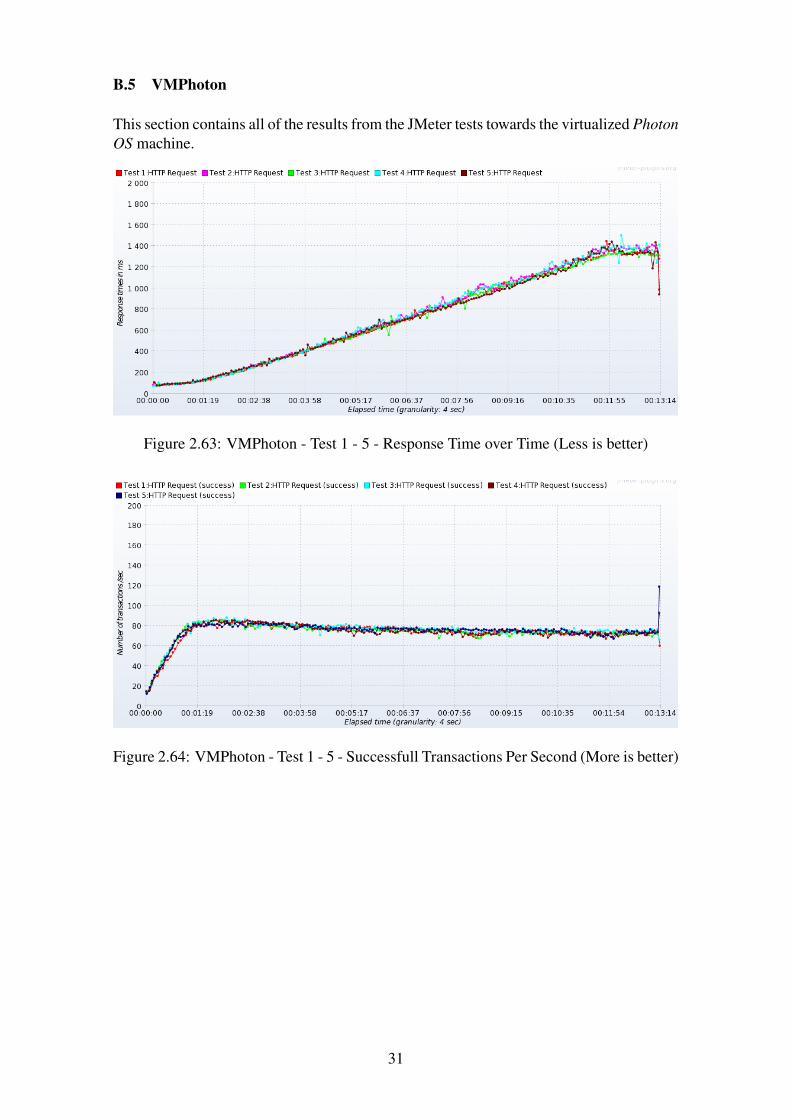
B.5 VMPhoton
This section contains all of the results from the JMeter tests towards the virtualized PhotonOS machine.
Figure 2.63: VMPhoton - Test 1 - 5 - Response Time over Time (Less is better)
Figure 2.64: VMPhoton - Test 1 - 5 - Successfull Transactions Per Second (More is better)
31
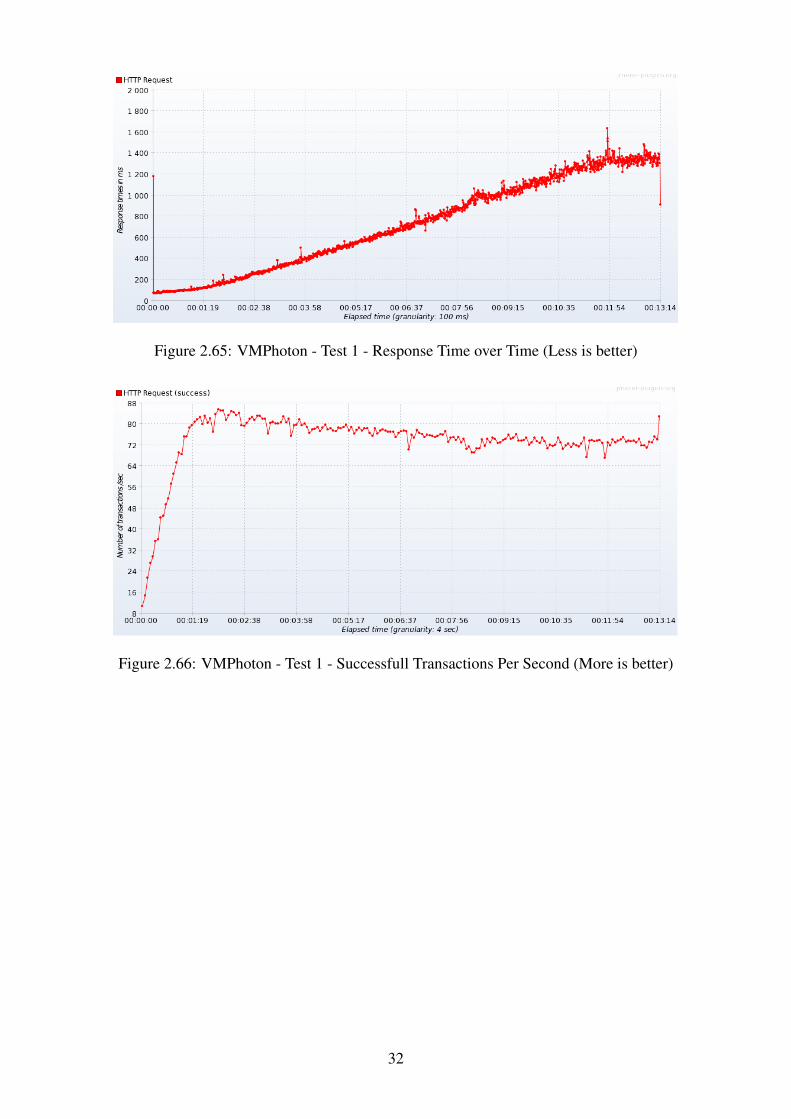
Figure 2.65: VMPhoton - Test 1 - Response Time over Time (Less is better)
Figure 2.66: VMPhoton - Test 1 - Successfull Transactions Per Second (More is better)
32
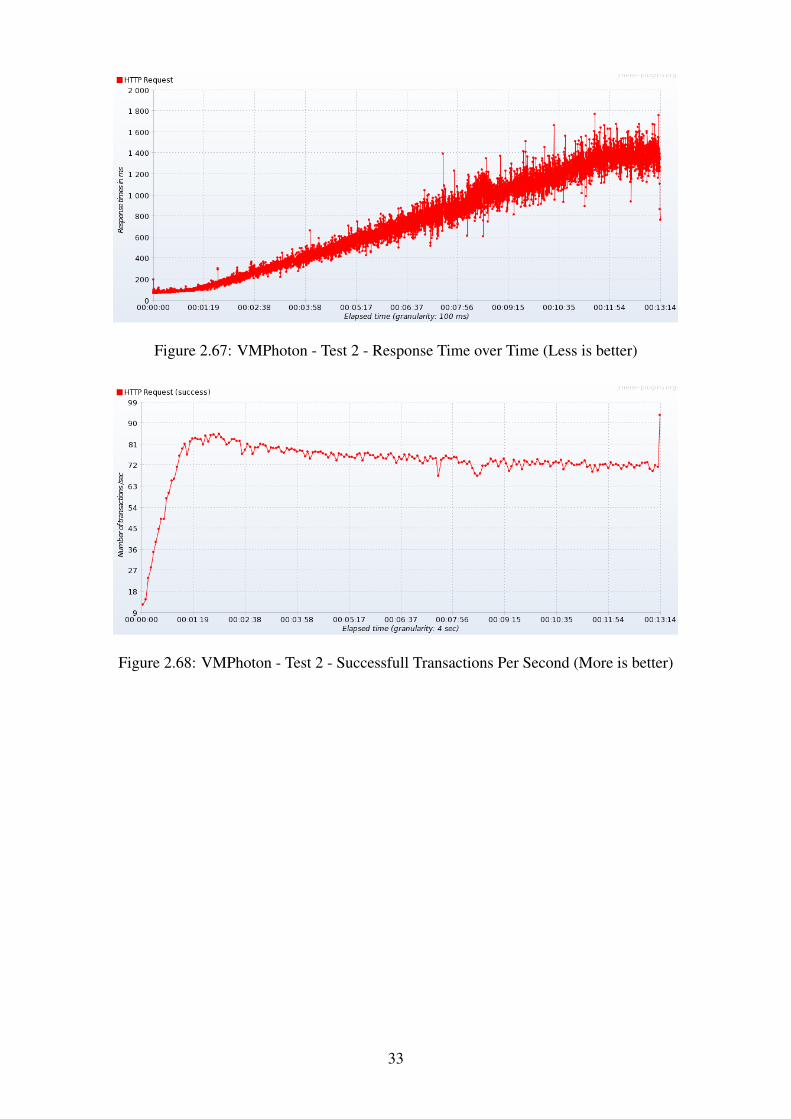
Figure 2.67: VMPhoton - Test 2 - Response Time over Time (Less is better)
Figure 2.68: VMPhoton - Test 2 - Successfull Transactions Per Second (More is better)
33

Figure 2.69: VMPhoton - Test 3 - Response Time over Time (Less is better)
Figure 2.70: VMPhoton - Test 3 - Successfull Transactions Per Second (More is better)
34
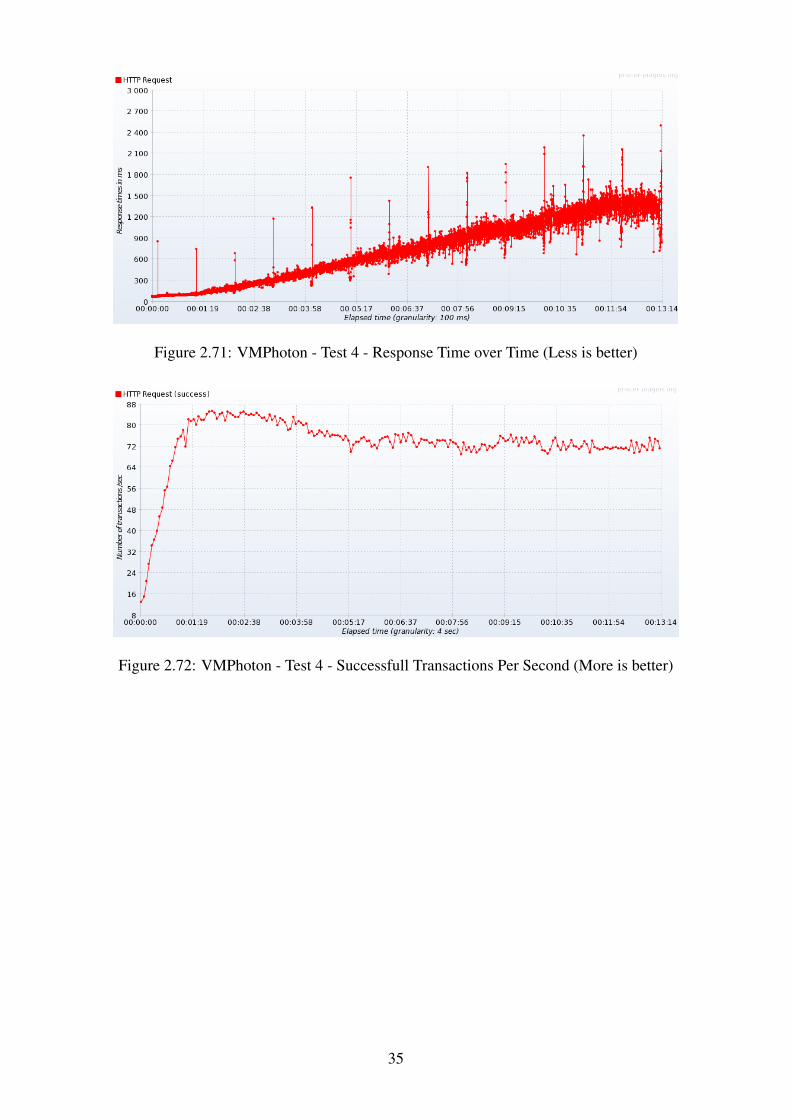
Figure 2.71: VMPhoton - Test 4 - Response Time over Time (Less is better)
Figure 2.72: VMPhoton - Test 4 - Successfull Transactions Per Second (More is better)
35
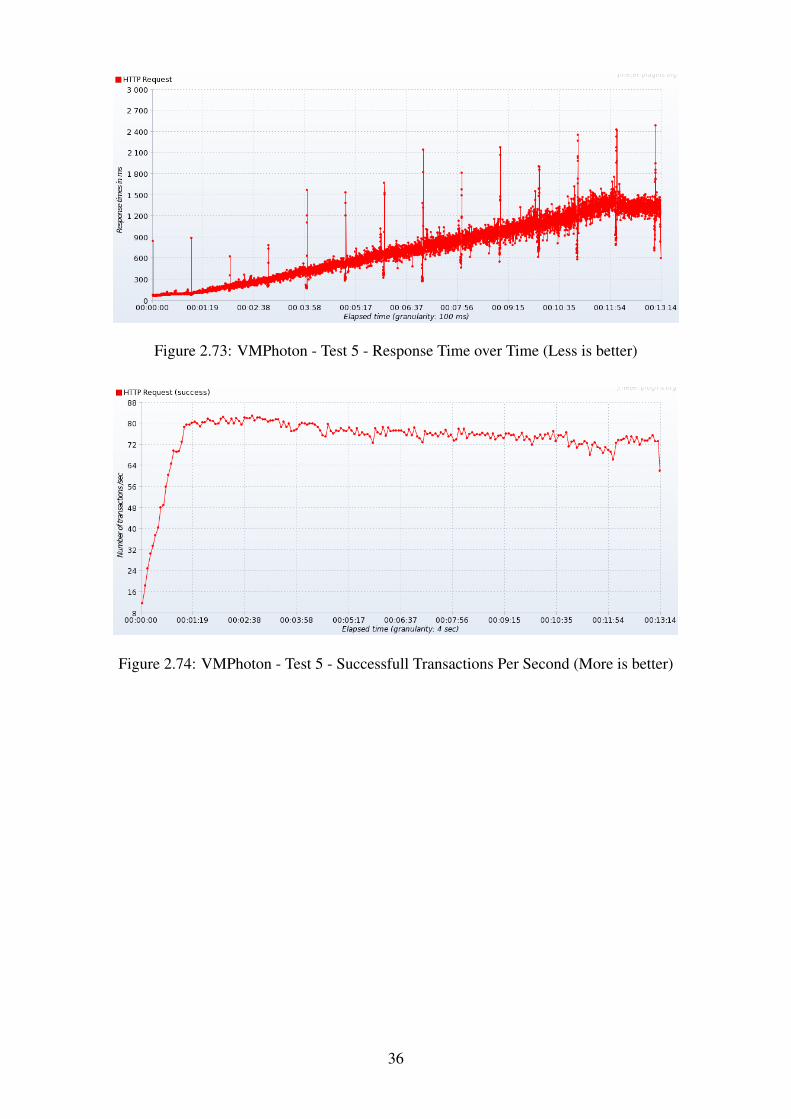
Figure 2.73: VMPhoton - Test 5 - Response Time over Time (Less is better)
Figure 2.74: VMPhoton - Test 5 - Successfull Transactions Per Second (More is better)
36
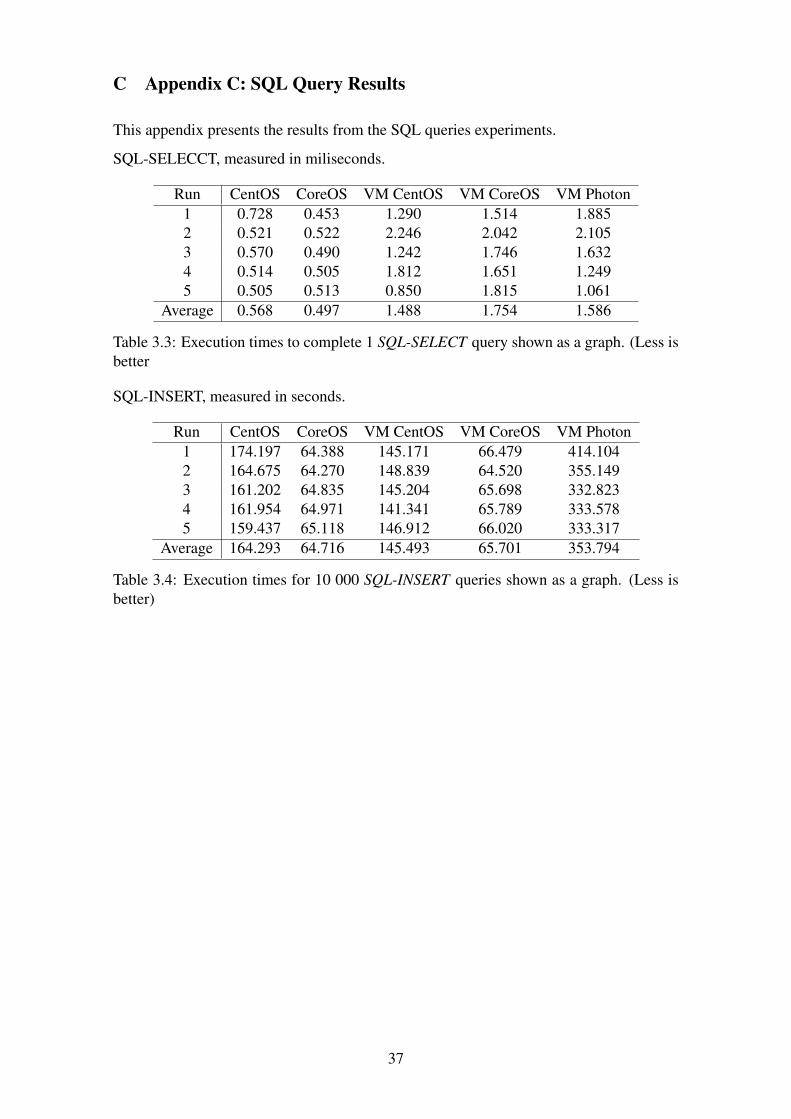
C Appendix C: SQL Query Results
This appendix presents the results from the SQL queries experiments.
SQL-SELECCT, measured in miliseconds.
Run CentOS CoreOS VM CentOS VM CoreOS VM Photon1 0.728 0.453 1.290 1.514 1.8852 0.521 0.522 2.246 2.042 2.1053 0.570 0.490 1.242 1.746 1.6324 0.514 0.505 1.812 1.651 1.2495 0.505 0.513 0.850 1.815 1.061
Average 0.568 0.497 1.488 1.754 1.586
Table 3.3: Execution times to complete 1 SQL-SELECT query shown as a graph. (Less isbetter
SQL-INSERT, measured in seconds.
Run CentOS CoreOS VM CentOS VM CoreOS VM Photon1 174.197 64.388 145.171 66.479 414.1042 164.675 64.270 148.839 64.520 355.1493 161.202 64.835 145.204 65.698 332.8234 161.954 64.971 141.341 65.789 333.5785 159.437 65.118 146.912 66.020 333.317
Average 164.293 64.716 145.493 65.701 353.794
Table 3.4: Execution times for 10 000 SQL-INSERT queries shown as a graph. (Less isbetter)
37