Baby Bunting Group...This document is a presentation of general background information about the...
33
Baby Bunting Group Half Year Ended 27 December 2015 Results Presentation 12 February 2016 Matt Spencer Chief Executive Officer & Managing Director Darin Hoekman Chief Financial Officer
Transcript of Baby Bunting Group...This document is a presentation of general background information about the...

Baby Bunting GroupHalf Year Ended 27 December 2015
Results Presentation12 February 2016
Matt SpencerChief Executive Officer & Managing Director
Darin HoekmanChief Financial Officer

Important Notice and Disclaimer
This document is a presentation of general background information about the activities of Baby Bunting Group Limited (Baby Bunting) current at the date of the presentation (12 February 2016). The information contained in this presentation is for general background and does not purport to be complete. It is not intended to be relied upon as advice to investors or potential investors and does not take into account the investment objectives, financial situation or needs of any particular investor. These should be considered, with or without professional advice, when deciding if an investment is appropriate.
Baby Bunting, its related bodies corporate and any of their respective officers, directors and employees (Baby Bunting Parties), do not warrant the accuracy or reliability of this information, and disclaim any responsibility and liability flowing from the use of this information by any party. To the maximum extent permitted by law, the Baby Bunting Parties do not accept any liability to any person, organisation or entity for any loss or damage suffered as a result of reliance on this document.
Forward looking statements
This document contains certain forward looking statements and comments about future events, including Baby Bunting’s expectations about the performance of its business. Forward looking statements can generally be identified by the use of forward looking words such as ‘expect’, ‘anticipate’, ‘likely’, ‘intend’, ‘should’, ‘could’, ‘may’, ‘predict’, ‘plan’, ‘propose’, ‘will’, ‘believe’, ‘forecast’, ‘estimate’, ‘target’ and other similar expressions within the meaning of securities laws or applicable jurisdictions. Indications of, and guidance on, future earnings or financial position or performance are also forward looking statements.
Forward looking statements involve inherent risks and uncertainties, both general and specific, and there is a risk that such predictions, forecasts, projections and other forward looking statements will not be achieved. The Baby Bunting IPO Prospectus lodged with ASIC on 29 September 2015 (Prospectus) contains details of the number of material risks associated with an investment in Baby Bunting. Forward looking statements are provided as a general guide only, and should not be relied on as an indication or guarantee of future performance. Forward looking statements involve known and unknown risks, uncertainty and other factors which can cause Baby Bunting’s actual results to differ materially from the plans, objectives, expectations, estimates and intentions expressed in such forward looking statements and many of these factors are outside the control of Baby Bunting. As such, undue reliance should not be placed on any forward looking statement. Past performance is not necessarily a guide to future performance and no representation or warranty is made by any person as to the likelihood of achievement or reasonableness of promise, representation, warranty or guarantee as to the past, present or the future performance of Baby Bunting.
Pro forma financial information
Baby Bunting uses certain measures to manage and report on its business that are not recognised under Australian Accounting Standards. These measures are referred to as non-IFRS financial information.
Baby Bunting considers that this non-IFRS financial information is important to assist in evaluating Baby Bunting’s performance. The information is presented to assist in making appropriate comparisons with prior periods and to assess the operating performance of the business. In particular, this information is important for comparative purposes with pro forma information in Baby Bunting’s IPO Prospectus.
For a reconciliation of the non-IFRS financial information contained in this presentation to IFRS-compliant comparative information, refer to the Appendix to this presentation.
All dollar values are in Australian dollars (A$) unless otherwise stated.
. 2

Introduction to Baby Bunting
• Founded in 1979, Baby Bunting is Australia’s largest
specialty baby goods retailer
• Operating 35 stores across Australia, with the leading
specialty baby goods website by number of visits
• Target market is parents-to-be, parents, friends and
family, purchasing products for the 0 to 3 years age
group
• Principal product categories include prams, cots and
nursery furniture, car safety, toys, babywear, feeding,
nappies, manchester and associated accessories
• Successful ASX listing in October 2015
Baby Bunting is Australia’s largest specialty retailer of baby goods, aiming to provide customers with the widest range of products, high levels of service and low prices every day
3
ALL THE BEST BRANDS AT LOW PRICES
CAR SEAT
FITTINGLAY BY
GIFT REGISTRY
GIFT CARDS
EXCLUSIVE PRODUCTS &
BRANDS
PERSONALISED SERVICE

Agenda
2
3
5
4
6
Financial information
Growth strategy
Business overview
Industry overview
Outlook
7 Appendix – pro forma reconciliation
1 Results highlights
4

Results highlights
1.

1H FY2016 Results Highlights
TRADING
• Sales of $108.2 million, up 30.3% on the prior corresponding period
• Comparable store sales growth of 9.2%
• Gross margin improvement of 48bp
1
EARNINGS(1)
• Cost of doing business (pro forma) improved by 50bp
• EBITDA (pro forma) of $7.8 million, up 50.6% on the prior corresponding period
• NPAT (pro forma) of $4.3 million, up 54.7% on the prior corresponding period
2
CAPITAL STRUCTURE
3
GROWTH
• 4 new stores opened in Booval, North Lakes and Burleigh Waters in QLD, and Campbelltown in NSW
• Launched new website and Click-and-Collect functionality
• Multiple business efficiency and IT projects delivered
4
FY2016OUTLOOK
• Sales expected to be in the range of $225 to $235 million
• EBITDA (pro forma) expected to be in the range of $16.5 - 18.5 million
• 1 to 2 new stores expected to be opened in 2H FY2016
5
6
• Capital expenditure of $3.7 million, including investment in multiple IT projects to support future growth
• Operating cash flow reflects a $4.0 million investment in inventory to support post-Christmas sales events
• Cash at 27 December 2015 of $7.2 million, plus $13.0m undrawn borrowing facility
Note:1. Refer to page 31 for a reconciliation of the non-IFRS financial information contained in this presentation to the IFRS-compliant information

Industryoverview
2.
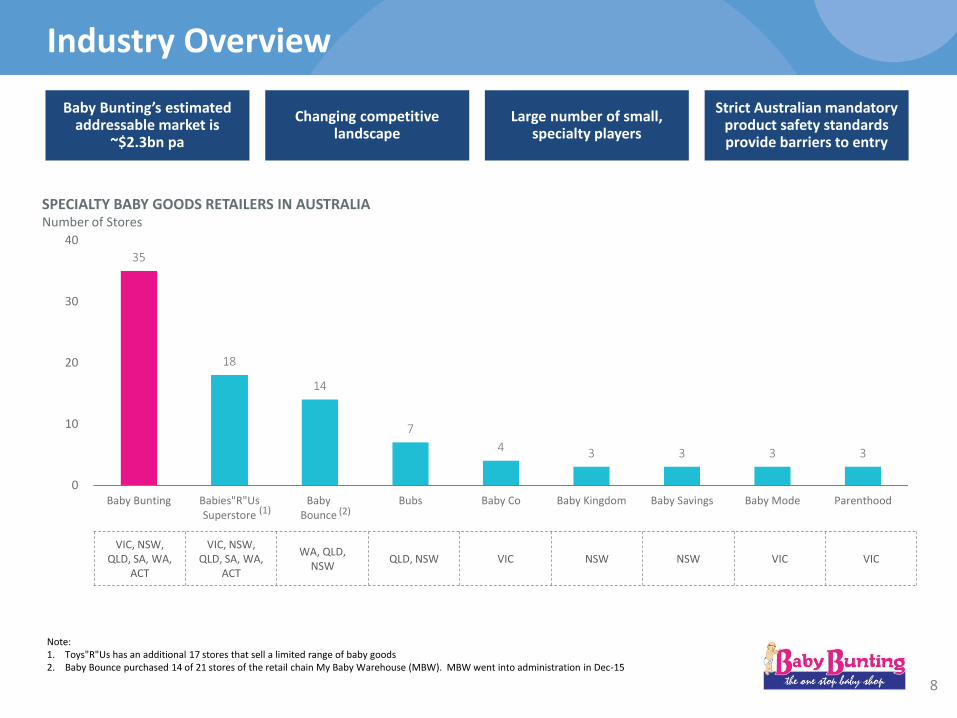
Industry Overview
35
18
14
7
4 3 3 3 3
0
10
20
30
40
Baby Bunting Babies"R"UsSuperstore
BabyBounce
Bubs Baby Co Baby Kingdom Baby Savings Baby Mode Parenthood
SPECIALTY BABY GOODS RETAILERS IN AUSTRALIA Number of Stores
Note:1. Toys"R"Us has an additional 17 stores that sell a limited range of baby goods2. Baby Bounce purchased 14 of 21 stores of the retail chain My Baby Warehouse (MBW). MBW went into administration in Dec-15
8
Baby Bunting’s estimated addressable market is
~$2.3bn pa
Changing competitive landscape
Large number of small, specialty players
Strict Australian mandatory product safety standards provide barriers to entry
VIC, NSW, QLD, SA, WA,
ACT
VIC, NSW, QLD, SA, WA,
ACT
WA, QLD, NSW
QLD, NSW VIC NSW NSW VIC VIC
(1) (2)

Business overview
3.

Drivers of Competitive Advantage
Consistent Retail Format
Convenient Network of Stores and Online
Cost Effective Marketing
Customer Centric Team Culture
Comprehensive Range of Ancillary
Services
Competitively Priced
Widest Product Offering, In-Stock
and Available
Scale Platform
10

Baby Bunting’s Store Network
HawthornEast BentleighFrankstonTaylors Lakes
Narre WarrenRingwoodThomastownBallarat
GeelongHoppers CrossingMaribyrnongBendigo
Victoria
Helensvale KawanaFortitude ValleyTownsville
MacgregorBooval (29 Jul)North Lakes (18 Sep)Burleigh Waters (14 Nov)
Queensland
PenrithWarners BayTaren PointAuburn
Moore ParkWest GosfordCampbelltown (19 Dec)Fyshwick (ACT)
New South Wales and ACT
CanningtonMyareeJoondalup
MidlandOsborne Park
Western Australia
Gepps Cross Melrose Park
South Australia
35 stores across Australia, with significant roll-out potential
11
5 stores
2 stores
8 stores
8 stores
12 stores

Store Experience
Stores are consistent in branding, range, operations and customer service
• The widest range of products with over +6,000 products
• Price match guarantee and continued investment in value for the customer
• Increasing range of Private Label and Exclusive Products
• Services include lay-by, car seat fitting, parenting room, in-store / online gift registry
• Click & Collect
• Dedicated team of knowledgeable staff to service customers individual needs
• 1,500 to 2,000 square metres in bulky goods centres or at stand-alone sites with parking and parcel pick up facilities. Regional store format of 1,000 to 1,200 square meters without compromising on range or service
Evidence of strong customer loyalty in-store with a Net Promoter Score of ~40 (1)
Note:1. NPS score based on a national customer survey conducted by the Company in early 2015 that included more than 15,000 responses. To calculate NPS,
customers are categorised as "Promoters", "Passives" or "Detractors" based on how likely they would be to recommend Baby Bunting to a friend or colleague. The percentage of Detractors is then subtracted from the percentage of Promoters. 12

Online
www.babybunting.com.au continues to evolve & grow as the leading specialty baby goods website
Note:1. Source: Baby Bunting. Measures total non-unique website sessions across all devices2. Source: Google Trends for Australia only
• 35% increase in website visits (1H FY2016), and a 44% increase for the month of December year-on-year
• 48% increase in online sales on the prior comparable
period
• Range expansion with ~10% additional products added
on the prior comparable period
• Implementation of a new look website delivering an
enhanced online experience and product search capability, and improved educational content for
parents and parents to be
• Click & Collect phase 1 launched with a strong uptake
TOTAL WEBSITE SESSIONS BY MONTH (babybunting.com.au) (1)
0
150
300
450
600
750
900
Dec-10 Dec-11 Dec-12 Dec-13 Dec-14 Dec-15
13
GOOGLE TRENDS (2)
0
20
40
60
80
100
Dec-10 Dec-11 Dec-12 Dec-13 Dec-14 Dec-15
Baby Bunting
Babies”R”Us
Baby Kingdom
Baby Warehouse
Bubs
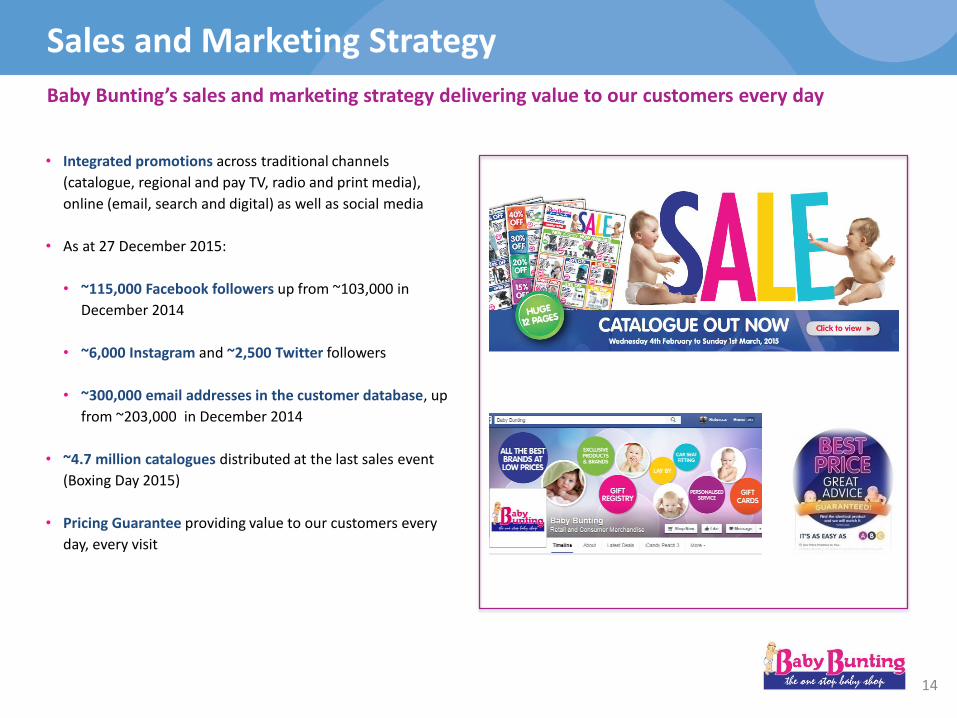
Sales and Marketing Strategy
Baby Bunting’s sales and marketing strategy delivering value to our customers every day
• Integrated promotions across traditional channels
(catalogue, regional and pay TV, radio and print media),
online (email, search and digital) as well as social media
• As at 27 December 2015:
• ~115,000 Facebook followers up from ~103,000 in
December 2014
• ~6,000 Instagram and ~2,500 Twitter followers
• ~300,000 email addresses in the customer database, up
from ~203,000 in December 2014
• ~4.7 million catalogues distributed at the last sales event
(Boxing Day 2015)
• Pricing Guarantee providing value to our customers every
day, every visit
14

Logistics & Supply Chain
Continuous improvement in the Distribution Centre supporting the growth of the business
• Implementation of the “Paperless” Warehouse
Management System driving efficiency
• ~1,600 products held in the DC for store and online
fulfilment and a further ~3,200 products held for online
fulfilment only
• Supporting more stores and online sales growth with
improved efficiency
• ~24% of store products are fulfilled from the DC and make
up over 50% of store sales
• Expanded use of 3rd party logistics improving stock flow
and customer experience
• Supply chain opportunities identified from source to shelf
with the aim of driving continuous improvement and
capability
% of sales% of products
SUPPLY CHAIN IS CONTROLLED FOR KEY PRODUCTS (1H FY2016)
DC to store24%
Supplierto store
76%
DC to store54%
Supplier to store
46%
15

Supplier Relationships
Strong growth in Private Label and Exclusive Products(1)
• Private Label and Exclusive Product sales have grown from
7.2% of sales for FY2015 to 9.5% of sales in 1H FY2016
• Network of more than 260 suppliers across third party
brands, Private Label and Exclusive Products
• Top 10 suppliers represent 46% of sales
• A focus of the business has been to increase the level of
direct sourcing, Private Label and Exclusive Products
Notes:1. Private Label and Exclusive Products includes products sold by Baby Bunting under its own 4Baby brand (ie private label products) as well as products
sourced by Baby Bunting for sale on an exclusive basis (so that those products can only be purchased in Australia from Baby Bunting stores). Historically, exclusive supply arrangements have been arranged with suppliers in relation to selected products and for varying lengths of time
% OF SALES – PRIVATE LABEL AND EXCLUSIVE PRODUCTS
SUPPLIER BREAKDOWN BY SALES (1H FY2016)
Top 10 suppliers
46%
Remaining suppliers
54%
2.0%3.1%
5.0%
7.2%
9.5%
0.0%
2.0%
4.0%
6.0%
8.0%
10.0%
FY2012 FY2013 FY2014 FY2015 1H FY2016
16

Building the Best Team
Continued focus on the development of our growing team
• Implementation of a Learning Management System
underway
• Building the talent pipeline
• Inductions, training & development
• Succession planning and performance coaching
• Training & development
• Recruit, train, retain
• Alignment across the Team
• Significant Board and Executive Team share ownership
• Approx. 400 employees participated in the Employee
Share Gift Offer as part of the IPO
• Over 100 staff purchased shares under the priority offer
as part of the IPO
• Culture
• Customer focused
• Family values based business
• Equal opportunity and Code of Conduct
FUNCTION Dec 2014 Jun 2015 Dec 2015
Stores 499 550 644
Logistics 19 19 19
Support Office 44 46 55
TOTAL 562 615 718
BREAKDOWN OF EMPLOYEES (including casuals)
17

Growth strategy
4.
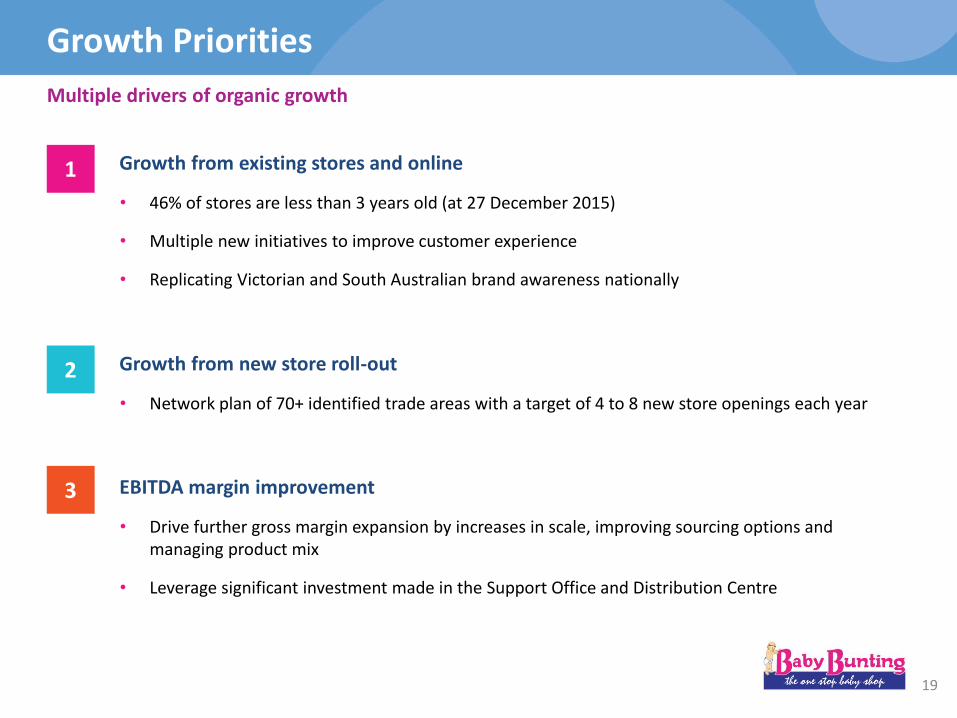
Growth Priorities
Multiple drivers of organic growth
Growth from existing stores and online
• 46% of stores are less than 3 years old (at 27 December 2015)
• Multiple new initiatives to improve customer experience
• Replicating Victorian and South Australian brand awareness nationally
Growth from new store roll-out
• Network plan of 70+ identified trade areas with a target of 4 to 8 new store openings each year
EBITDA margin improvement
• Drive further gross margin expansion by increases in scale, improving sourcing options and managing product mix
• Leverage significant investment made in the Support Office and Distribution Centre
1
2
3
19

Growth from Existing Stores and Online
Strong 1H FY2016 comparable store sales growth1 of 9.2%
Note:1. Refer to Glossary for a definition of comparable store sales growth
• Comparable store sales growth driven by the maturing of “new” stores (at 27 December 2015, 46% of stores were less than 3 years old)
• Average comparable store sales growth of 5.4% pa since June 2010
• Focused strategies to continue comparable store sales growth include:
• Growing brand awareness in underpenetrated regions
• Investments in online capabilities
• Click & Collect functionality
• Continue to improve in-stock position
• Continued investment in training and in-store support
• Introduction of customer focussed technology
STORE MATURITY PROFILE AT 27 DECEMBER 2015 (YEARS OPENED)
COMPARABLE STORE SALES GROWTH (%) (1)
<3 years46%
3 - 5 years17%
>5 years37%
6%
1%
4%
2%
9%8%
9%
0%
5%
10%
FY2010 FY2011 FY2012 FY2013 FY2014 FY2015 1H FY2016
20

Growth from New Store Roll-Out
4 new stores opened in 1H FY2016, 1-2 more planned for 2H FY2016
• Expect to open 5-6 new stores in FY2016 (compared to prospectus forecast of 5 new stores)
• Pipeline of new store opportunities has been identified for FY2017
• Target 4 to 8 new store openings each year
• 70+ trade areas identified based on demographic, location and competition parameters, ~40% of remaining sites are in regional locations (population < 200,000)
• 2 Regional stores opened in Q4 FY2015 are trading inline with expectations
NUMBER OF STORES
912
1519 21 23
3136-37
0
20
40
60
80
FY2009 FY2010 FY2011 FY2012 FY2013 FY2014 FY2015 FY2016F Network Plan
70+
21

Margin Improvement
Gross margin improvement across all key categories and operating leverage achieved
Note:1. Private Label and Exclusive Products includes products sold by Baby Bunting under its own 4Baby brand (ie private label products) as well as products
sourced by Baby Bunting for sale on an exclusive basis (so that those products can only be purchased in Australia from Baby Bunting stores). Historically, exclusive supply arrangements have been arranged with suppliers in relation to selected products and for varying lengths of time
• Gross margin improvement of 48bps in 1H FY2016 to 34.8%, from 34.3% in 1HFY2015
• Driven by sales and margin growth in all key categories
• Product range now includes Baby Formula (with sales commencing in December 2015)
• Continued catalogue and promotional support
• Product mix
• Further expansion of our 4Baby range planned for 2H FY2016
• Private Label and Exclusive Products represented 9.5% of sales in 1H FY2016
• Expect Private Label and Exclusive Products to account for a growing share of sales over time
Leverage Investment in Support Office and Distribution CentreGross Margin Improvement
Private Label and Exclusive Products (1)
• Cost of doing business (pro forma) improvement of 50bps in 1H FY2016 to 27.5%, from 28.0% in 1H FY2015
• Overhead leverage in Support Office and Distribution Centre expenses has been achieved despite an increased investment year-on-year ($5.1 million to $6.2 million on a pro forma basis)
• Expect continued leverage on this investment in future years, so that Support Office and Distribution Centre expenses grow slower than sales
22

Financial information
5.
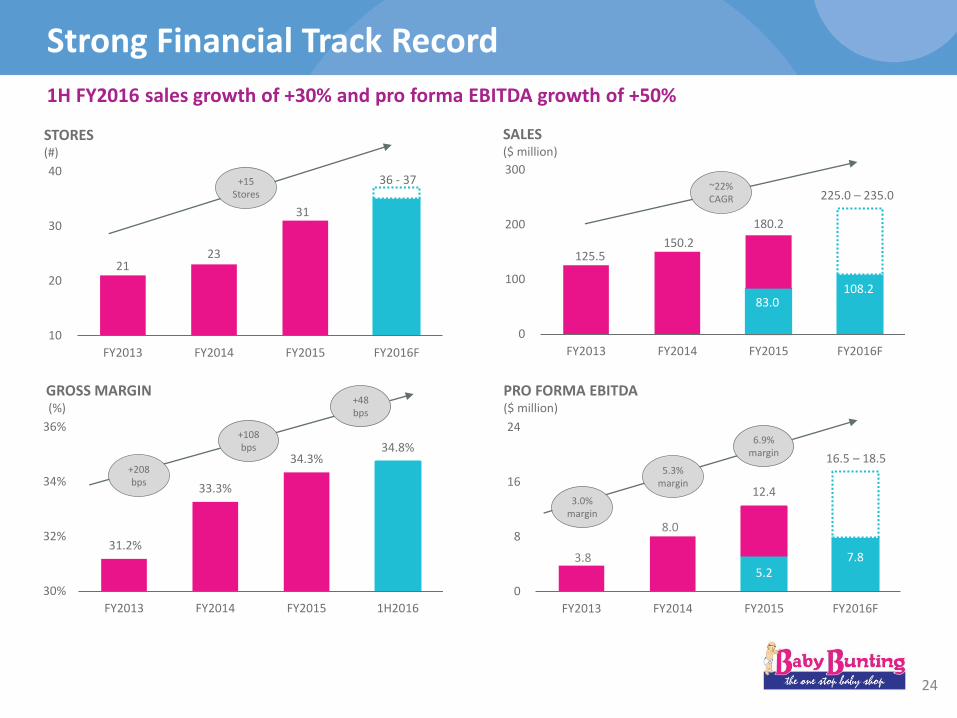
3.8
8.0
5.2 7.8
12.4
0
8
16
24
FY2013 FY2014 FY2015 FY2016F
6.9% margin
Strong Financial Track Record
1H FY2016 sales growth of +30% and pro forma EBITDA growth of +50%
SALES($ million)
125.5 150.2
83.0 108.2
180.2
225.0 – 235.0
0
100
200
300
FY2013 FY2014 FY2015 FY2016F
~22%CAGR
PRO FORMA EBITDA($ million)
3.0% margin
5.3% margin
GROSS MARGIN(%)
31.2%
33.3%
34.3%34.8%
30%
32%
34%
36%
FY2013 FY2014 FY2015 1H2016
+208bps
+108bps
+48bps
STORES(#)
21 23
31
36 - 37
10
20
30
40
FY2013 FY2014 FY2015 FY2016F
+15Stores
24
16.5 – 18.5
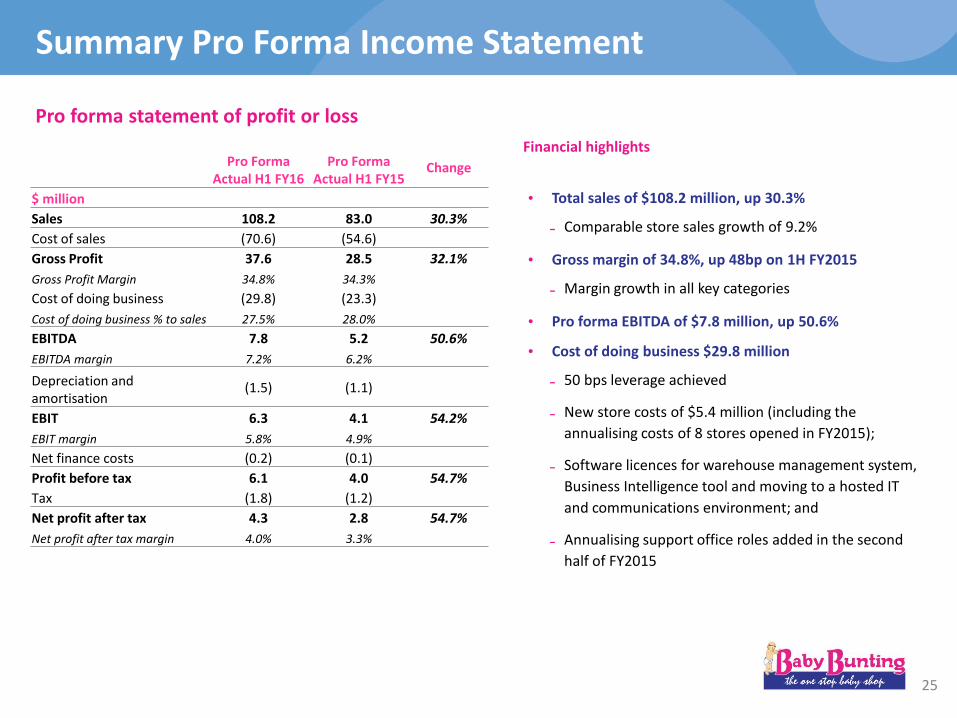
Summary Pro Forma Income Statement
Financial highlights
• Total sales of $108.2 million, up 30.3%
Comparable store sales growth of 9.2%
• Gross margin of 34.8%, up 48bp on 1H FY2015
Margin growth in all key categories
• Pro forma EBITDA of $7.8 million, up 50.6%
• Cost of doing business $29.8 million
50 bps leverage achieved
New store costs of $5.4 million (including the
annualising costs of 8 stores opened in FY2015);
Software licences for warehouse management system,
Business Intelligence tool and moving to a hosted IT
and communications environment; and
Annualising support office roles added in the second
half of FY2015
Pro forma statement of profit or loss
25
Pro Forma Actual H1 FY16
Pro Forma Actual H1 FY15
Change
$ million
Sales 108.2 83.0 30.3%
Cost of sales (70.6) (54.6)
Gross Profit 37.6 28.5 32.1%
Gross Profit Margin 34.8% 34.3%
Cost of doing business (29.8) (23.3)
Cost of doing business % to sales 27.5% 28.0%
EBITDA 7.8 5.2 50.6%
EBITDA margin 7.2% 6.2%
Depreciation and amortisation
(1.5) (1.1)
EBIT 6.3 4.1 54.2%
EBIT margin 5.8% 4.9%
Net finance costs (0.2) (0.1)
Profit before tax 6.1 4.0 54.7%
Tax (1.8) (1.2)
Net profit after tax 4.3 2.8 54.7%
Net profit after tax margin 4.0% 3.3%

Balance Sheet
Capital structure
• $0.2 million net cash position
• Inventory increase reflects 4 new stores added ($3.0 million), new store inventory infill ($0.75m) and $4.0 million of inventory to support post Christmas sales ahead of supplier shutdowns in January
• Payables increase in line with inventory
Statement of financial position
Dividends
• Proposed FY2016 dividend based on a payoutratio of 75% of pro forma NPAT
• Target ongoing payout ratio of 70% - 100% of NPAT
• As indicated in the prospectus, no interim dividend will be paid in respect of the 1H FY2016 period
• All dividends are expected to be fully franked
26
Statutory 27-Dec-15
Statutory 28-Jun-15
$ million
Cash and cash equivalents 7.2 3.6
Inventories 44.3 35.5
Plant and equipment 17.1 14.9
Goodwill 44.2 44.2
Other Assets 10.7 8.2
Total Assets 123.3 106.3
Payables 24.4 19.6
Borrowings 7.0 8.0
Provisions 4.9 4.4
Income Tax Payable 0.6 2.4
Total Liabilities 36.8 34.3
Net Assets 86.6 72.0
Net Cash / (Debt) 0.2 (4.4)

Cash Flow Statement
• Change in working capital reflects new store openings and investment in inventory to support the January sales event
• Tax paid includes settlement of FY2015 tax return ($2.4m) and FY2016 provisional tax ($1.5m). In the prior year, the FY2014 tax return was settled in 2H
• Capital expenditure (excluding new stores) included investments in:
• Warehouse Management System;
• Business Intelligence software tools;
• Improved website, adding Click & Collect functionality; and
• Refurbishments and signage updates on a number of older stores.
• $28.7 million of new equity raised ($25.0 million from the IPO, and $3.7 million raised from the exercise of existing options)
27
Statement of cash flows
Statutory Statutory
1H FY16 1H FY15
$ million
EBITDA1 8.0 5.5
Movement in working capital (4.5) (2.1)
Tax Paid (3.9) (2.1)
Net finance costs paid (0.3) (0.6)
Net cash flow from operating activities (0.6) 0.6
New store capex (2.1) (1.8)
Capex (excluding new stores) (1.6) (1.3)
Operating cashflow (4.3) (2.5)
Proceeds from issue of shares, net of transaction costs
25.1 1.5
Dividends paid (16.1) -
Borrowings (net) (1.0) 3.6
Net cash flow 3.7 2.6
1. EBITDA excludes IPO transaction costs expensed and accelerated expenses of old LTI plan

Outlook
6.

Outlook
• Strong trading has continued into 2H FY2016 with year-to-date comparable stores sales growth increasing to 11.2% as at 31 January 2016
• Updated FY2016 guidance:
• Sales are expected to be in the range of $225 – $235 million
• Expect comparable store sales growth to moderate through 2H FY2016
• Pro forma EBITDA expected to be in the range of $16.5 million to $18.5 million
• Anticipate 5 to 6 new stores to be opened in FY2016 (including 4 opened in 1H FY2016)
• Gross margin in 2H FY2016 is expected to remain largely consistent with 1H FY2016
29
Updated FY2016 outlook reflecting strong trading performance year-to-date
Note: Refer to “Forward looking statements” section on page 2

Appendix
7.

Statutory - Pro Forma Reconciliation
31
a. Accelerated expenses of old LTI plan are excluded from pro forma results
b. Listed public company costs - estimate of incremental half year costs BB would have incurred if it operated as a public company for the full period. Adjustment also applied to comparative half year period
c. IPO Transaction costs - IPO costs charged as expenses excluded from pro forma results
d. Net interest - adjustment for part year impact on interest expense as if the major IPO cash flows had taken effect at 29 June 15. Adjustment also applied to comparative half year period
Statutory 1H FY16
Pro Forma adjustments
Pro Forma 1H FY16
Prospectus pro forma
FY16
$ million
Sales 108.2 108.2 218.6
Cost of sales (70.6) (70.6) (141.8)
Gross Profit 37.6 37.6 76.8
Cost of doing business:
Store expenses (21.6) (21.6) (43.8)
Marketing expenses (2.0) (2.0) (4.0)
Warehouse expenses (1.7) (1.7) (3.5)
Administrative expenses (5.3) 0.7 a,b (4.5) (9.1)
IPO transaction costs expensed (1.9) 1.9 c 0.0
EBITDA 5.2 2.6 7.8 16.3
Depreciation and amortisation (1.5) (1.5) (3.1)
EBIT 3.7 2.6 6.3 13.2
Net finance costs (0.2) 0.1 d (0.2) (0.2)
Profit before tax 3.5 2.7 6.1 12.9
Income tax expense (1.2) (0.6) (1.8) (3.9)
Net profit after tax 2.3 2.0 4.3 9.1

Glossary
Comparable Store Sales Growth • Calculated as a percentage change of the total sales generated from stores (including the online store) in a relevant period, compared to the total sales from the same set of stores in the prior corresponding period, provided the stores were open at the beginning of the prior financial year
Exclusive Products • Products sourced by Baby Bunting for sale on an exclusive basis (so that those products can only be purchased in Australia from Baby Bunting stores). Historically, exclusive supply arrangements have been arranged with suppliers in relation to selected products and for varying lengths of time
Net Promoter Score or NPS • Net promoter score is a method of measuring customers’ loyalty. To calculate NPS, customers are categorised as "Promoters", "Passives" or "Detractors" based on how likely they would be to recommend Baby Bunting to a friend or colleague. The percentage of Detractors is then subtracted from the percentage of Promoters
Private Label • Products sold by Baby Bunting under its own brand (Baby Bunting currently markets its private label products under the 4Baby brand name)
32

33
Thank You!