4393%20b&a%20consumer%20confidence%20tracker%20dec%2013%2011 13
B&A%20Consumer%20Confidence%20Bar%20May%202011
33
IMAGE HERE INTO GREY AREA. Consumer Confidence Tracker May 2011 Prepared by John J Clarke & Luke Reaper
-
Upload
morsolutions-helpdesk -
Category
Documents
-
view
212 -
download
0
description
http://www.banda.ie/assets/files/B&A%20Consumer%20Confidence%20Bar%20May%202011.pdf
Transcript of B&A%20Consumer%20Confidence%20Bar%20May%202011

IMAGE HERE INTO GREY AREA.Consumer ConfidenceTracker
May 2011
Prepared by John J Clarke & Luke Reaper
2J.1814
Introduction
This report presents the findings of the latest phase of the Behaviour & Attitudes’ Consumer Confidence Tracker.
Survey results for this phase are based on a sample of 1004 adults aged 16+, quota controlled in terms of age, gender, socio-economic class and region to reflect the profile of the adult population of the Republic of Ireland.
All interviewing on the survey is conducted on our fortnightly face-to-face Barometer by trained members of the B&A field force working under ESOMAR guidelines.
Fieldwork on the latest wave was carried out between 8th April to 19th April 2011.
At the end of this report we have also included some of the latest CSO data on GNP, retail sales, unemployment and inflation.
The figures contained within the B&A Consumer Confidence Barometer have an estimated margin of error 3.2%.

3J.1814
About Behaviour & Attitudes
Behaviour and Attitudes is Ireland’s largest and most experienced independently owned research company. We have 30 permanent staff members which includes 10 directors, the most experienced team in the Irish market. In addition, we have a team of over 150 experienced, fully trained face-to-face interviewers nationwide. Our Dublin CATI (telephone) Unit is based in our offices in Milltown and has a capacity for over 60 interviewers.
Established 25 years ago, Behaviour and Attitudes provides a full range of market research services, ranging from CAPI (Computer Aided Personal Interviewing), through to standard face-to-face interviewing surveys, CATI (Computer Aided Telephone Interviewing), central location interviewing, as well as an in-house CAWI (Computer Aided Web Interviewing) Unit. The company would be well known for having pioneered the development of qualitative research in Ireland.
Despite being the second largest market research company in Ireland, Behaviour & Attitudes has a very well defined and tight company structure which is built around excellent client service delivery principles.
Behaviour & Attitudes is fully owned by its Research Directors. These Directors are fully involved in day-to-day research on behalf of their clients. Hence our clients have access to the most senior team in the Irish marketplace.
For more information please visit our website at: www.banda.ie
4J.1814
Summary The previous Behaviour & Attitudes Consumer Confidence Barometer, January 2011 saw a
deepening of negative sentiment in consumer confidence, primarily due to the 2011 austerity Budget, the details of the EU/IMF/ECB banking recapitalisation programme and the introduction of the Universal Social Charge.
In the intervening period to the current survey, two key elements which underpin consumer confidence have changed.
Firstly the general election provided an opportunity for consumers to elect a political party with a mandate to deal with overhanging economic issues. The increase in political stability and the removal of the previous government has created a level of buoyancy in terms of reducing negative sentiment, to a degree.
However, the effect of this change in economic leadership and increased political stability on consumer confidence has, to a degree, been undermined by the return of interest rate increases for households. While the initial rate increase will only modestly reduce current disposable income levels, the anticipation of increases of up to 3 percentage points across the next 18-24 months, will add considerably to reduced spending, as preparations are made for declines in real income levels. These increases are particularly concerning as inflation (without mortgage interest being a driving factor, due to its current low level) has already reached 3%, a level not seen since the end of 2008.
Current consumer spending intentions remain distinctively negative, albeit at slightly lower levels than before.
It is important also to take into consideration that the current survey was conducted prior to the announcement of the May Jobs Initiative. The effects of which will be factored into the analysis of the next Consumer Confidence Barometer.
5J.1814
Summary
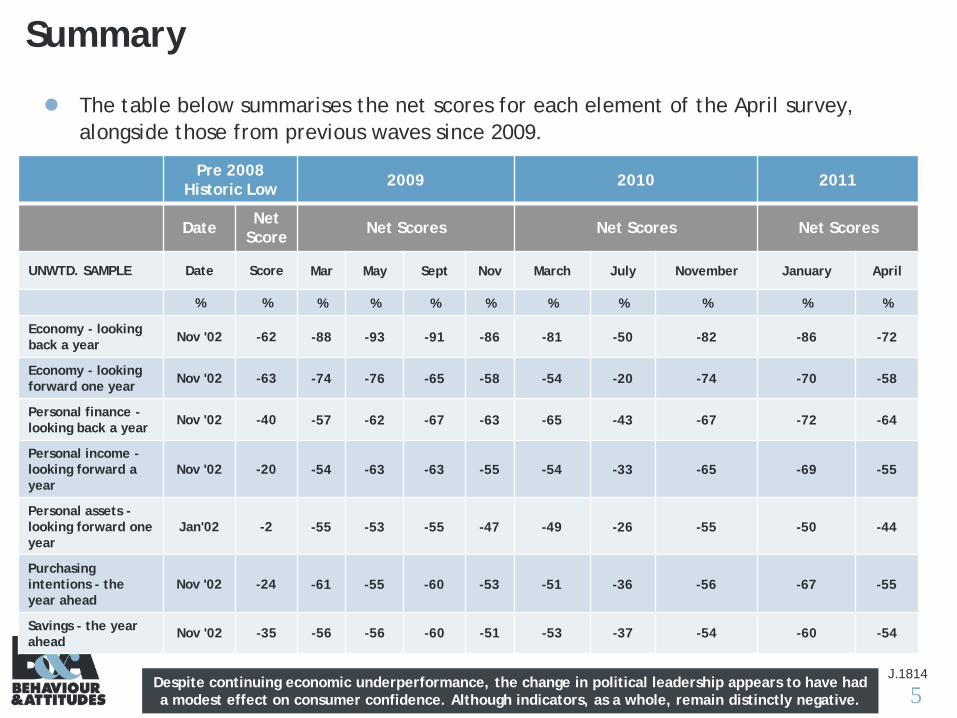
The table below summarises the net scores for each element of the April survey, alongside those from previous waves since 2009.
Pre 2008Historic Low 2009 2010 2011
Date Net Score Net Scores Net Scores Net Scores
UNWTD. SAMPLE Date Score Mar May Sept Nov March July November January April
% % % % % % % % % % %
Economy - looking back a year Nov '02 -62 -88 -93 -91 -86 -81 -50 -82 -86 -72
Economy - looking forward one year Nov '02 -63 -74 -76 -65 -58 -54 -20 -74 -70 -58
Personal finance -looking back a year Nov '02 -40 -57 -62 -67 -63 -65 -43 -67 -72 -64
Personal income -looking forward a year
Nov '02 -20 -54 -63 -63 -55 -54 -33 -65 -69 -55
Personal assets -looking forward one year
Jan'02 -2 -55 -53 -55 -47 -49 -26 -55 -50 -44
Purchasing intentions - the year ahead
Nov '02 -24 -61 -55 -60 -53 -51 -36 -56 -67 -55
Savings - the year ahead
Nov '02 -35 -56 -56 -60 -51 -53 -37 -54 -60 -54
Despite continuing economic underperformance, the change in political leadership appears to have had a modest effect on consumer confidence. Although indicators, as a whole, remain distinctly negative.
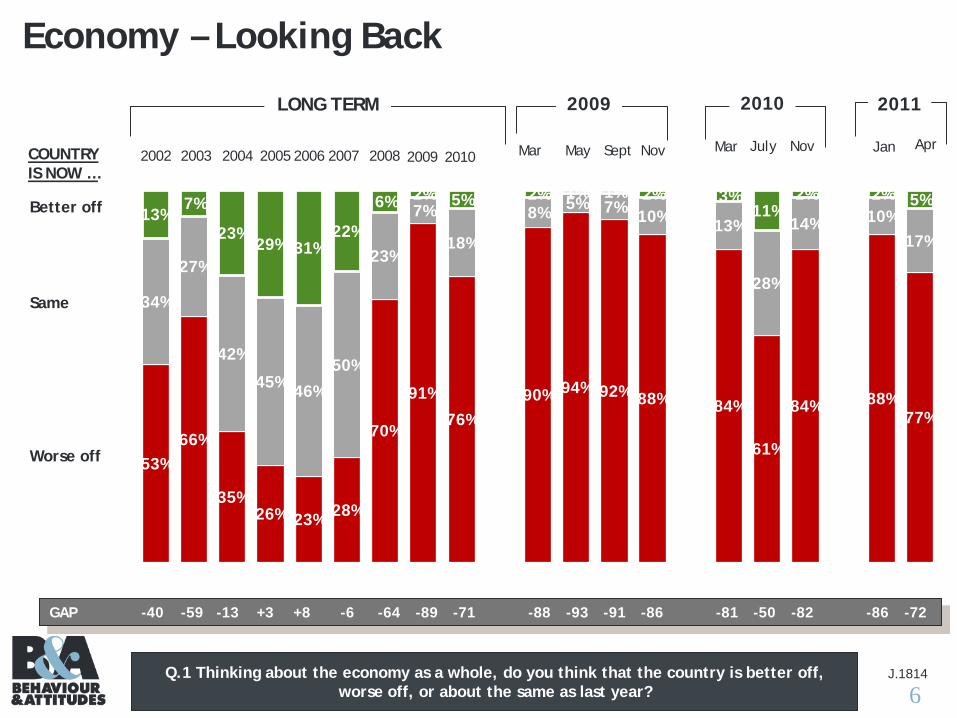
6J.1814Q.1 Thinking about the economy as a whole, do you think that the country is better off,
worse off, or about the same as last year?
Economy – Looking Back
Better off
Same
Worse off
COUNTRY IS NOW …
GAP -40 -59 -13 +3 +8 -6 -64 -89 -71 -88 -93 -91 -86 -81 -50 -82 -86 -72
LONG TERM 2009
2002 20052003 2004 2006 2007 2008 Mar May Sept Nov
2010
Mar2009
July
0%
53%66%
35%26% 23% 28%
70%
91%
76%90% 94% 92% 88% 84%
61%
84% 88%77%
0%
34%
27%
42%
45% 46%
50%
23%
7%
18%
8% 5% 7% 10% 13%
28%
14% 10%17%
0%
13%7%
23%29% 31%
22%
6% 2% 5% 2% 1% 1% 2% 3%11%
2% 2% 5%
Nov2010
2011
Jan Apr
7J.1814
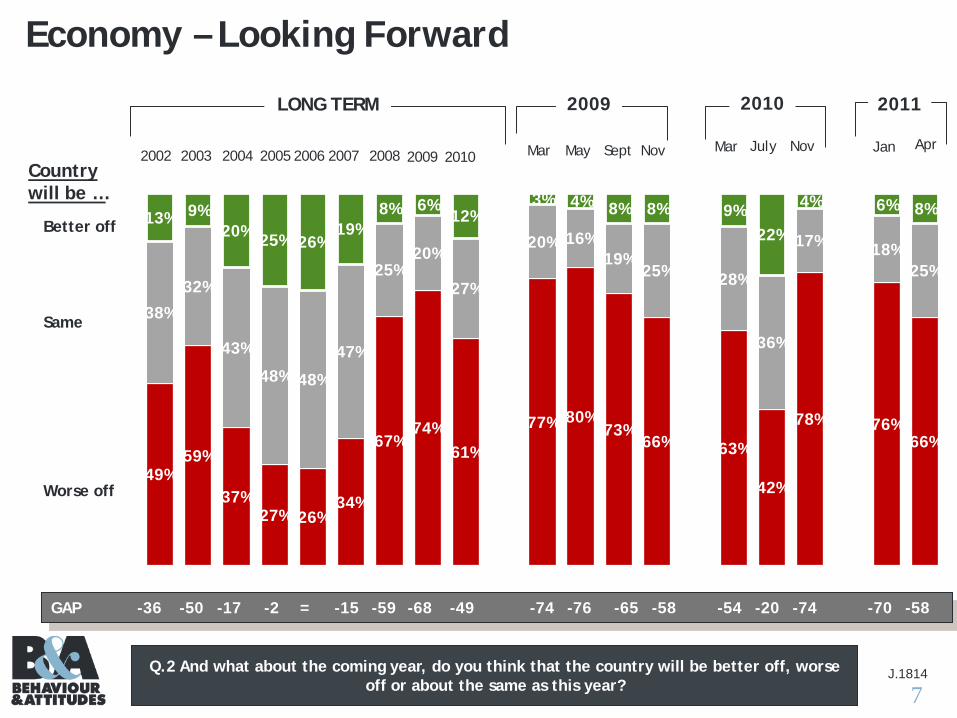
Economy – Looking Forward
Better off
Same
Worse off
GAP -36 -50 -17 -2 = -15 -59 -68 -49 -74 -76 -65 -58 -54 -20 -74 -70 -58
Country will be …
Q.2 And what about the coming year, do you think that the country will be better off, worse off or about the same as this year?
49%59%
37%27% 26%
34%
67%74%
61%
77% 80%73%
66% 63%
42%
78% 76%66%
38%
32%
43%
48% 48%
47%
25%20%
27%
20% 16%19%
25% 28%
36%
17% 18%25%
13% 9%20% 25% 26%
19%8% 6%
12%3% 4% 8% 8% 9%
22%
4% 6% 8%
LONG TERM 2009
2002 20052003 2004 2006 2007 2008 Mar May Sept Nov
2010
Mar2009
July Nov2010
2011
Jan Apr

8J.1814
Balance Of Opinion - Economy
Long Term Short TermBalance +/-
-40
-59
-13
38
-6
-64
-41
-55
-69-73-77 -79
-88 -93 -91 -86-81
-50
-82 -86
-72
-36-50
-17
-2 0
-15
-59 -42-56
-66-67 -65-69
-74-76
-65-58 -54
-20
-74-70
-58
-100
-90
-80
-70
-60
-50
-40
-30
-20
-10
0
10
2002200320042005200620072008 Jan Mar July Sept Oct Dec Mar May Sept Nov Mar July Nov Jan Apr
Looking Back
Looking Forward
YEARLY AVERAGES 20092008 2010
In comparison to last year economic performance, current sentiment remains distinctly negative as there has been little appreciable improvement in lifestyle, cost of living or employment prospects for consumers. A discreet level of optimism, possibly due to increased political stability, in terms of
future prospects is apparent in the reduction in negative sentiment of this measure.
2011
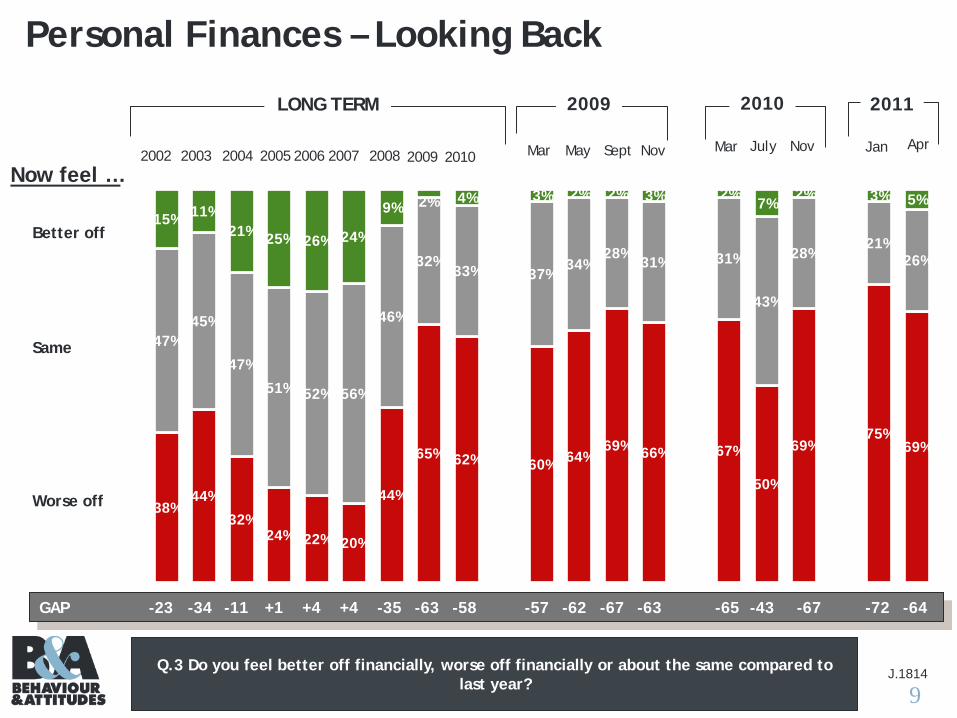
9J.1814Q.3 Do you feel better off financially, worse off financially or about the same compared to
last year?
Personal Finances – Looking Back
Better off
Same
Worse off
Now feel …
GAP -23 -34 -11 +1 +4 +4 -35 -63 -58 -57 -62 -67 -63 -65 -43 -67 -72 -64
38%44%
32%24% 22% 20%
44%
65% 62% 60% 64%69% 66% 67%
50%
69%75%
69%
47%45%
47%
51% 52% 56%
46%
32%33% 37%
34%28% 31% 31%
43%
28%21%
26%
15% 11%21% 25% 26% 24%
9% 2% 4% 3% 2% 2% 3% 2%7%
2% 3% 5%
LONG TERM 2009
2002 20052003 2004 2006 2007 2008 Mar May Sept Nov
2010
Mar2009
July Nov2010
2011
Jan Apr

10J.1814
Q.5 Do you expect your income in the next year, after inflation and taxes, to be higher, lower or the same as in the last twelve months?
Personal Finances – Looking Forward
Higher
The same
Lower
Expect it to be …
GAP -2 -8 +8 +16 +18 +15 -21 -59 -50 -54 -63 -63 -55 -54 -33 -65 -69 -55
24% 27%17% 13% 12% 13%
34%
64%57% 60%
67% 67%62% 58%
44%
70% 74%63%
54% 54%
58% 58%58% 59%
52%
30%35% 34%
29% 29%31% 38%
46%
24% 20%
28%
22% 22% 25% 25% 30% 28%
13%5% 7% 6% 4% 4% 7% 4%
11%5% 5% 8%
LONG TERM 2009
2002 20052003 2004 2006 2007 2008 Mar May Sept Nov
2010
Mar2009
July Nov2010
2011
Jan Apr

11J.1814
Balance Of Opinion - Personal Finances
Balance +/-
-23
-34
-11
1 4 4
-35
-12 -9
-32
-48-43
-50-57
-62-67
-63 -65
-43
-67 -72-64
-2-8
816 18 15
-21
3-1
-20-26
-38-44
-54-63 -61
-55 -54
-33
-65-69
-55
-75
-65
-55
-45
-35
-25
-15
-5
5
15
2002 2003 2004 2005 2006 2007 2008 Jan Mar July Sept Oct Dec Mar May Sept Nov Mar Jul Nov Jan Apr
Looking Back
Looking Forward
Long Term Short Term
There has been little change in how consumers perceive their financial situation in comparison to last year. That there has been any reduction in negative sentiment during the timeframe when the effects of the USC are being felt and increased interest rates have been announced is surprising. In terms of financial prospects in the future, negative sentiment appears to be reducing . This may be due to renewed belief among consumers of the governments ability to take control of the struggling economy. Alternately, it may reflect consumer ‘nadir’, a point at which people believe that their personal circumstances could not possibly degrade further.
YEARLY AVERAGES 20092008 2010 2011
12J.1814
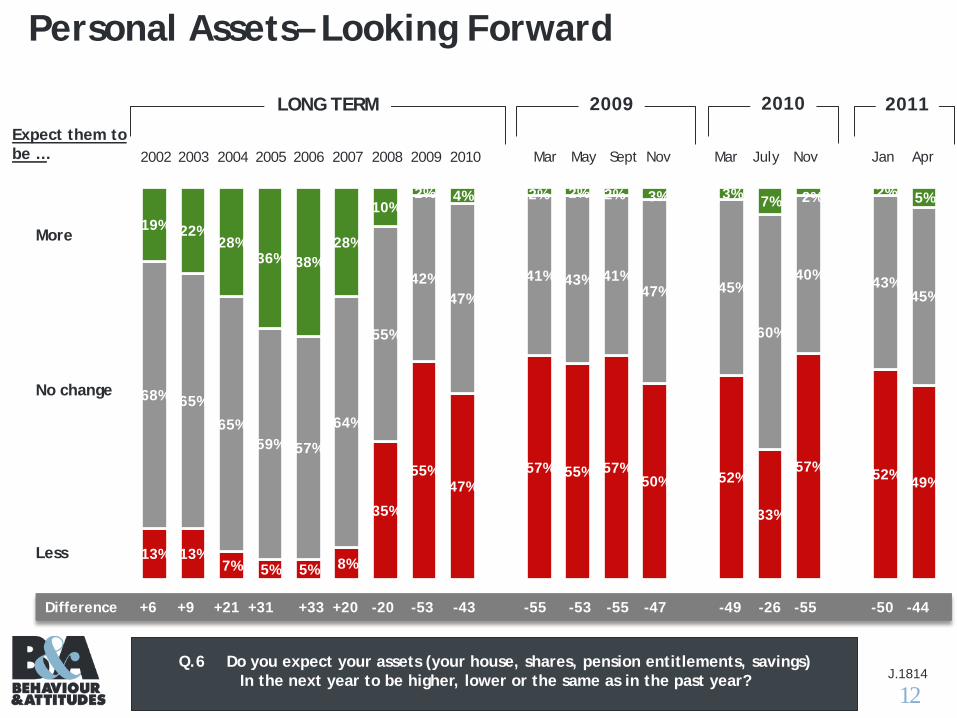
Q.6 Do you expect your assets (your house, shares, pension entitlements, savings) In the next year to be higher, lower or the same as in the past year?
Personal Assets– Looking Forward
More
No change
Less
Expect them to be …
Difference +6 +9 +21 +31 +33 +20 -20 -53 -43 -55 -53 -55 -47 -49 -26 -55 -50 -44
13% 13%7% 5% 5% 8%
35%
55%47%
57% 55% 57%50% 52%
33%
57% 52% 49%
68% 65%
65%59% 57%
64%
55%
42%47%
41% 43% 41%47% 45%
60%
40% 43%45%
19% 22%28%
36% 38%28%
10%2% 4% 2% 2% 2% 3% 3% 7% 2% 2% 5%
LONG TERM 2009
2002 20052003 2004 2006 2007 2008 Mar May Sept Nov
2010
Mar2009 July Nov2010
2011
AprJan
13J.1814
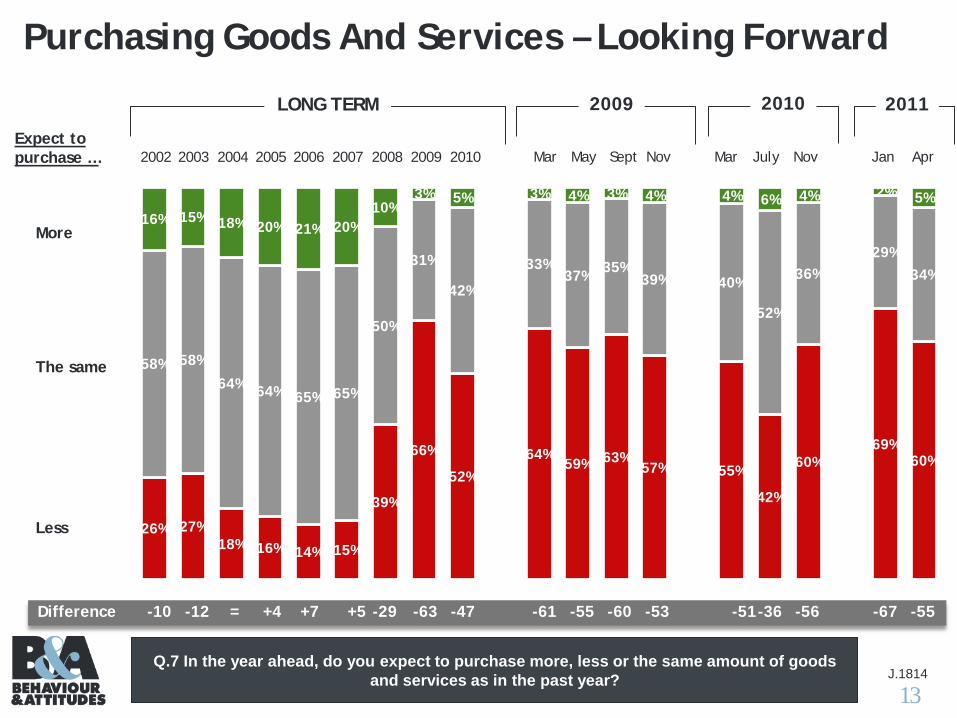
Q.7 In the year ahead, do you expect to purchase more, less or the same amount of goods and services as in the past year?
Purchasing Goods And Services – Looking Forward
More
The same
Less
Expect to purchase …
Difference -10 -12 = +4 +7 +5 -29 -63 -47 -61 -55 -60 -53 -51-36 -56 -67 -55
26% 27%18% 16% 14% 15%
39%
66%
52%64%
59% 63%57% 55%
42%
60%69%
60%
58% 58%
64% 64% 65% 65%
50%
31%
42%
33%37% 35%
39% 40%
52%
36%29%
34%
16% 15% 18% 20% 21% 20%10%
3% 5% 3% 4% 3% 4% 4% 6% 4% 2% 5%
LONG TERM 2009
2002 20052003 2004 2006 2007 2008 Mar May Sept Nov
2010
Mar2009 July Nov2010
2011
AprJan

14J.1814Q.8 Do you expect to save more, less or the same amount in the year ahead compared with
the last twelve months?
Savings – Looking Forward
More
The same
Less
Expect to save …
Difference -23 -28 -8 -5 -1 -5 -34 -56 -48 -56 -56 -60 -51 -53 -37 -54 -60 -54
36% 39%
25% 23% 19% 23%
44%
62%55%
62% 62% 66%57% 60%
44%
62%66%
61%
51%50%
58% 59% 63% 59%
46%
32%37%
31% 32% 28%37% 33%
50%
30%27%
32%
13% 11%17% 18% 18% 18%
10% 6% 7% 6% 6% 6% 6% 7% 7% 8% 6% 7%
LONG TERM 2009
2002 20052003 2004 2006 2007 2008 Mar May Sept Nov
2010
Mar2009 July Nov2010
2011
AprJan
15J.1814
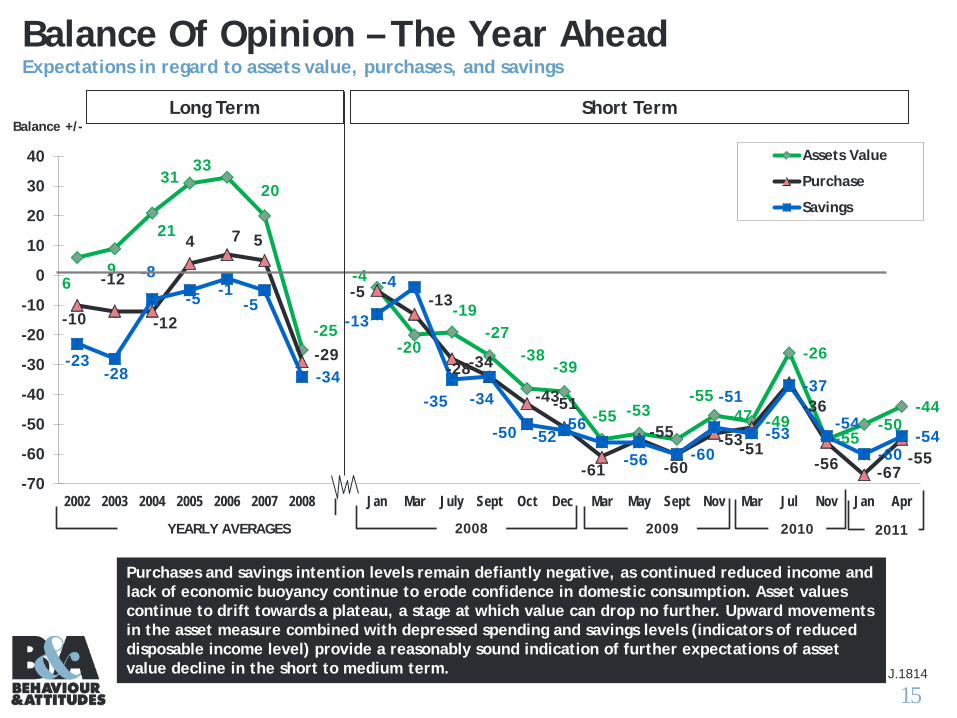
Balance Of Opinion – The Year AheadExpectations in regard to assets value, purchases, and savings
Balance +/-
69
21
3133
20
-25
-4
-20
-19-27
-38-39
-55 -53-55
-47 -49
-26
-55-50
-44
-10
-12
-12
4 7 5
-29
-5 -13
-28-34
-43-51
-61
-55
-60
-53-51
-36
-56 -67-55
-23-28
-8
-5 -1-5
-34
-13
-4
-35 -34
-50 -52-56
-56 -60
-51
-53
-37
-54
-60-54
-70
-60
-50
-40
-30
-20
-10
0
10
20
30
40
2002 2003 2004 2005 2006 2007 2008 Jan Mar July Sept Oct Dec Mar May Sept Nov Mar Jul Nov Jan Apr
Assets Value
Purchase
Savings
Long Term Short Term
YEARLY AVERAGES 20092008 2010 2011
Purchases and savings intention levels remain defiantly negative, as continued reduced income and lack of economic buoyancy continue to erode confidence in domestic consumption. Asset values continue to drift towards a plateau, a stage at which value can drop no further. Upward movements in the asset measure combined with depressed spending and savings levels (indicators of reduced disposable income level) provide a reasonably sound indication of further expectations of asset value decline in the short to medium term.

16J.1814
CSO DATA(latest estimates 2011)

17J.1814
Initial Estimates: Quarterly Increase in GDP but GNP down slightly% Change on previous quarter
-6
-5
-4
-3
-2
-1
0
1
2
3
4GDPGNP
2008 Q1
2008 Q3
2008 Q2
2008 Q4
2009 Q1
2009 Q2
2009 Q3
*Source: CSO Estimates as of 16th December 2010
%
Initial estimates for the fourth quarter of 2010 show a decrease, on a seasonally adjusted basis, of 1.6 per cent in GDP and an increase of 2 per cent in GNP compared with the previous quarter.
2009 Q4*
2008 2009 2010
2010 Q1
Figures – GDP and GNP at constant market prices seasonally adjusted.
2010 Q2
2010 Q3
2010 Q4
18J.1814
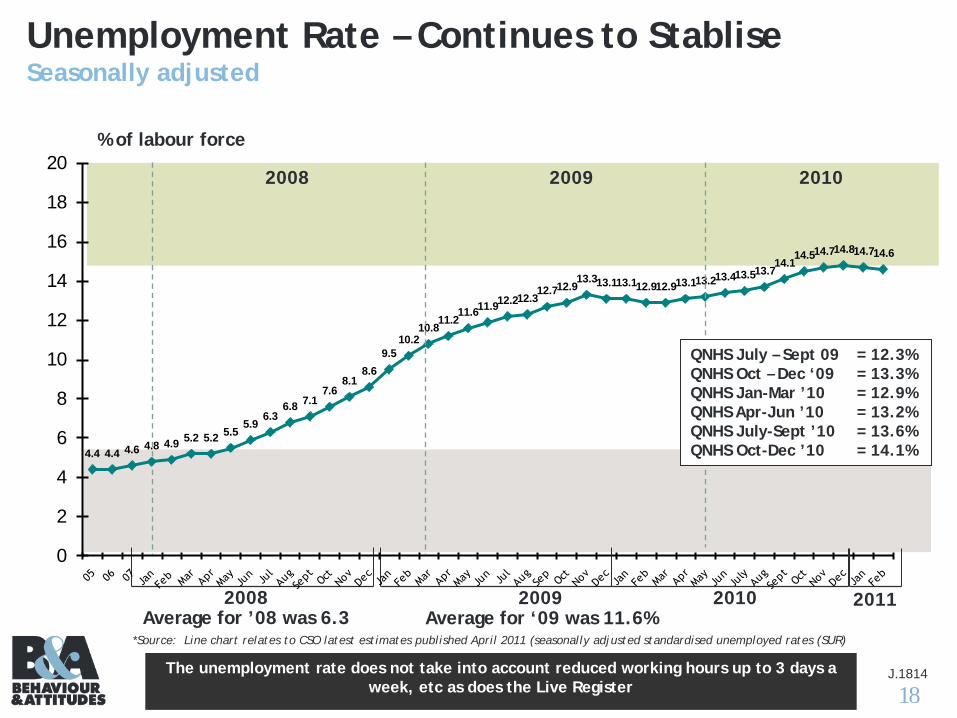
Unemployment Rate – Continues to StabliseSeasonally adjusted
% of labour force
2008
The unemployment rate does not take into account reduced working hours up to 3 days a week, etc as does the Live Register
2008Average for ’08 was 6.3
2009Average for ‘09 was 11.6%
*Source: Line chart relates to CSO latest estimates published April 2011 (seasonally adjusted standardised unemployed rates (SUR)
2009
4.4 4.4 4.6 4.8 4.9 5.2 5.2 5.55.9
6.36.8 7.1
7.68.1
8.69.5
10.210.8
11.211.611.912.212.3
12.712.913.313.113.112.912.913.113.213.413.513.7
14.114.514.714.814.714.6
0
2
4
6
8
10
12
14
16
18
20
2010
2010
QNHS July – Sept 09 = 12.3%QNHS Oct – Dec ‘09 = 13.3% QNHS Jan-Mar ’10 = 12.9%QNHS Apr-Jun ’10 = 13.2%QNHS July-Sept ’10 = 13.6%QNHS Oct-Dec ’10 = 14.1%
2011
19J.1814
162,700
166,000
167,000
171,300
173,200
179,300186,300
197,900
198,400
205,900215,100
225,900
236,100
245,800
261,800
278,300
294,300
325,700
351,000
371,000
387,200
400,900
412,900
423,400
426,200427,400
425,400
426,800
428,900434,400
430,600
430,600
435,100
440,300442,000446,100
449,200449,400
448,700
446,100446,700
441,600
440,300440,800
439,200
150,000
200,000
250,000
300,000
350,000
400,000
450,000
Aug Sept Oct Nov Dec Jan Feb Mar Apr May Jun Jul Aug Sept Oct Nov Dec Jan Feb Mar Apr May Jun Jul Aug Sept Oct Nov Dec Jan Feb Mar Apr MayJuneJulyAug Sept Oct Nov Dec Jan Feb Mar Apr
Total Persons
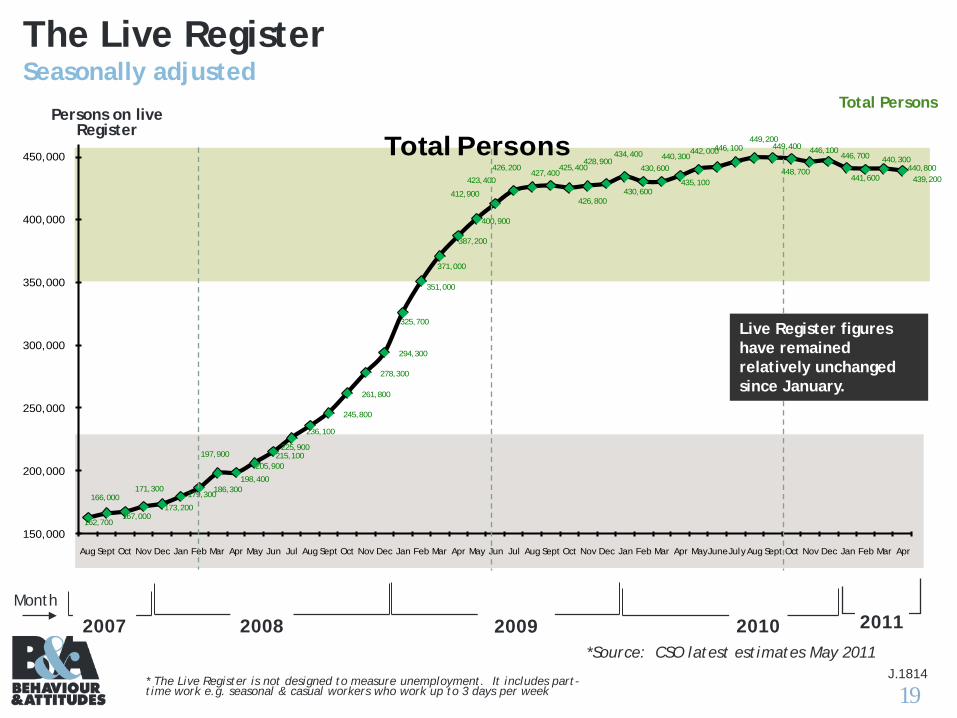
The Live Register Seasonally adjusted
* The Live Register is not designed to measure unemployment. It includes part-time work e.g. seasonal & casual workers who work up to 3 days per week
Total PersonsPersons on live
Register
Month
*Source: CSO latest estimates May 2011
20092007 20102008
Live Register figures have remained relatively unchanged since January.
2011
20J.1814
324993 322158 328477 333979 329211 323388315266 311857 315687 322270 318520
294636281945 274675 281755 282123 280474 274566270151
87414 91347 95118102957 107745 111733 117391
126065137195 144554 148402 147781 147608 150327 155324 160554 163825 166627169420
0
50000
100000
150000
200000
250000
300000
350000
400000
Oct-09 Nov-09
Dec-09
Jan-10
Feb-10
Mar-10
Apr-10
May-10
Jun-10
Jul-10 Aug-10
Sep-10
Oct-10 Nov-10
Dec-10
Jan-11
Feb-11
Mar-11
Apr-11
Less than one year More than one year
-1% 2% 2% -1% -2%-3% -1% 1% 2% -1%
-7%-4%
4%4%
8% 5% 4%5% 7%
9% 5% 3% 0% 0%
Apr 10 vsApr 11 = -15.5%
Apr10 vs Apr11 = +56%
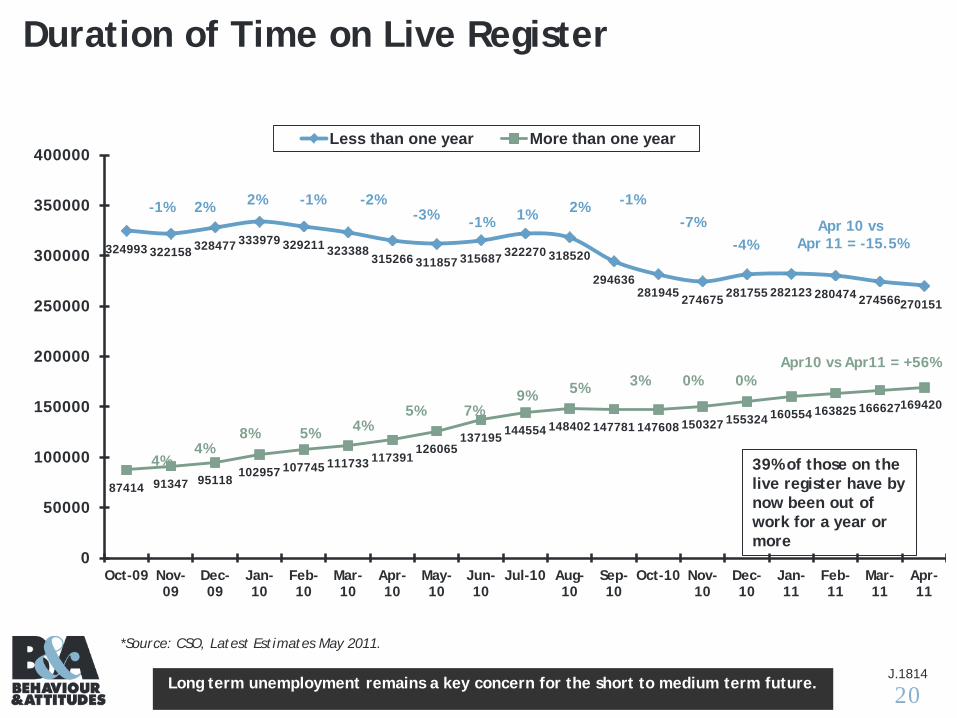
Duration of Time on Live Register
*Source: CSO, Latest Estimates May 2011.
Long term unemployment remains a key concern for the short to medium term future.
39% of those on the live register have by now been out of work for a year or more
21J.1814
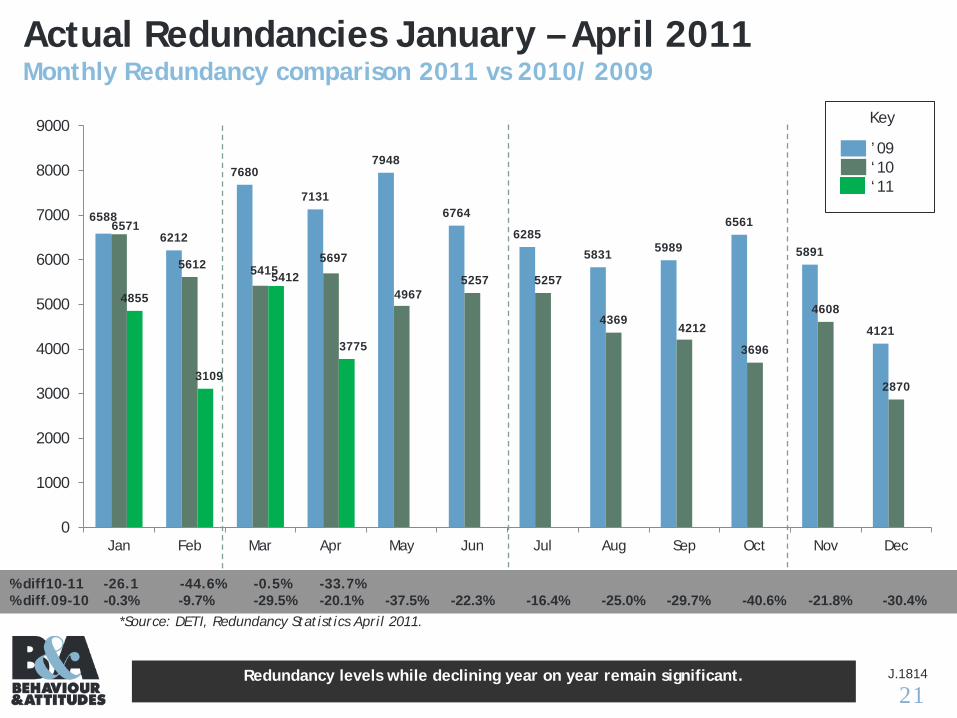
Actual Redundancies January – April 2011Monthly Redundancy comparison 2011 vs 2010/ 2009
% diff10-11 -26.1 -44.6% -0.5% -33.7%% diff.09-10 -0.3% -9.7% -29.5% -20.1% -37.5% -22.3% -16.4% -25.0% -29.7% -40.6% -21.8% -30.4%
6588
6212
7680
7131
7948
6764
6285
5831 5989
6561
5891
4121
6571
5612 54155697
49675257 5257
43694212
3696
4608
2870
4855
3109
5412
3775
0
1000
2000
3000
4000
5000
6000
7000
8000
9000
Jan Feb Mar Apr May Jun Jul Aug Sep Oct Nov Dec
*Source: DETI, Redundancy Statistics April 2011.
Key
’09‘10‘11
Redundancy levels while declining year on year remain significant.
22J.1814
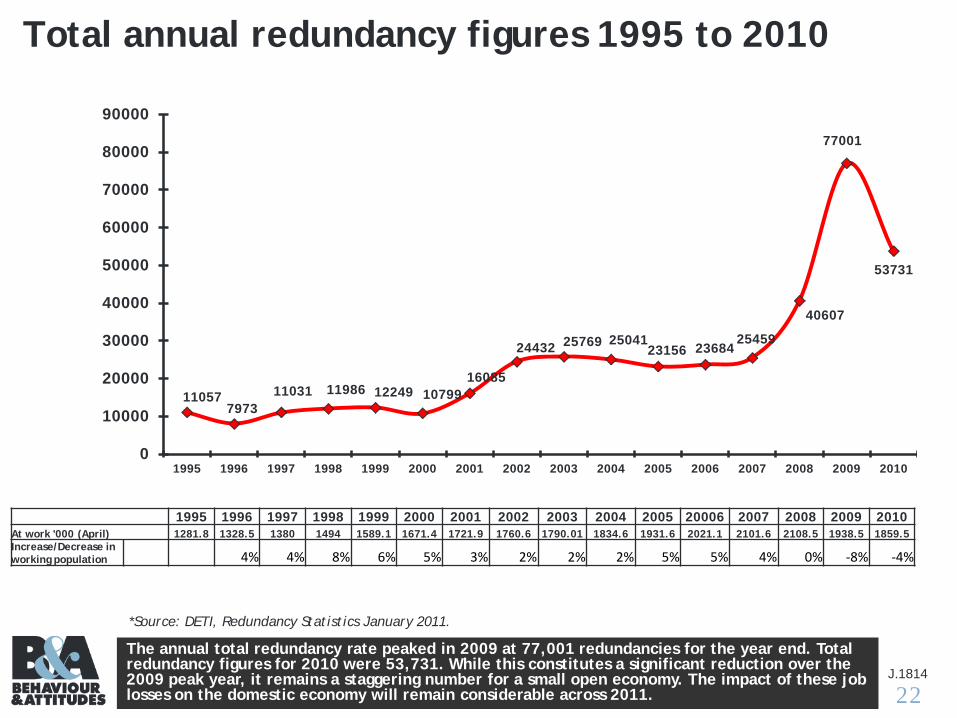
Total annual redundancy figures 1995 to 2010
1995 1996 1997 1998 1999 2000 2001 2002 2003 2004 2005 20006 2007 2008 2009 2010At work '000 (April) 1281.8 1328.5 1380 1494 1589.1 1671.4 1721.9 1760.6 1790.01 1834.6 1931.6 2021.1 2101.6 2108.5 1938.5 1859.5Increase/Decrease in working population 4% 4% 8% 6% 5% 3% 2% 2% 2% 5% 5% 4% 0% -8% -4%
Actual redundancies 2010The annual total redundancy rate peaked in 2009 at 77,001 redundancies for the year end. Total redundancy figures for 2010 were 53,731. While this constitutes a significant reduction over the 2009 peak year, it remains a staggering number for a small open economy. The impact of these job losses on the domestic economy will remain considerable across 2011.
110577973
11031 11986 12249 1079916085
24432 25769 2504123156 23684
25459
40607
77001
53731
0
10000
20000
30000
40000
50000
60000
70000
80000
90000
1995 1996 1997 1998 1999 2000 2001 2002 2003 2004 2005 2006 2007 2008 2009 2010
*Source: DETI, Redundancy Statistics January 2011.

23J.1814
Actual Redundancies January 2010 – April 2011 Cumulative Redundancy comparison 2010 vs 2011
% diff 2011 v 2010 -25.5% -34.2% -23.9% -26.3%
The rate of redundancies has reduced year on year by a quarter. The level remains considerably high for an economy into its third year of recession. The continued level of redundancies
indicates a domestic economy which is continuing to contract regardless of policy interventions and cost reductions within work places. Stagnant domestic consumer demand is a key driver of
this continued contraction in employment levels.
6571
12183
17598
2329528262
3351938776
4314547357
5125355861
58731
48557964
1337617151
0
10000
20000
30000
40000
50000
60000
70000
80000
90000
Jan Feb Mar Apr May Jun Jul Aug Sep Oct Nov Dec
2010
2011
*Source: DETI, Redundancy Statistics April 2011.
24J.1814
-9.5 -9.8-10.7
-12.2-13.2
-10.8
-11.4
-10.2
-11.6-12.0-11.2-11.3
-8.1 -7.7
-4.7
-3.1 -3.5
-5.0 -4.9-3.9 -3.8
-1.8 -1.9-2.9
-0.7
-2.3-2.5
-15
-10
-5
0
5
10
15
Jan-08 Feb '08
Mar '08
Apr '08 May '08
June '08
Jul '08 Aug '08
Sept '08
Oct '08 Nov '08
Dec '08
Jan '09 Feb '09
Mar '09
Apr '09 May '09
Jun '09
Jul '09 Aug '09
Sept '09
Oct '09 Nov '09
Dec '09
Jan '10 Feb '10
Mar '10
Apr '10 May '10
Jun '10
Jul '10 Aug '10
Sept '10
Oct '10 Nov '10
Dec '10
Jan'11 Feb '11
Mar '11
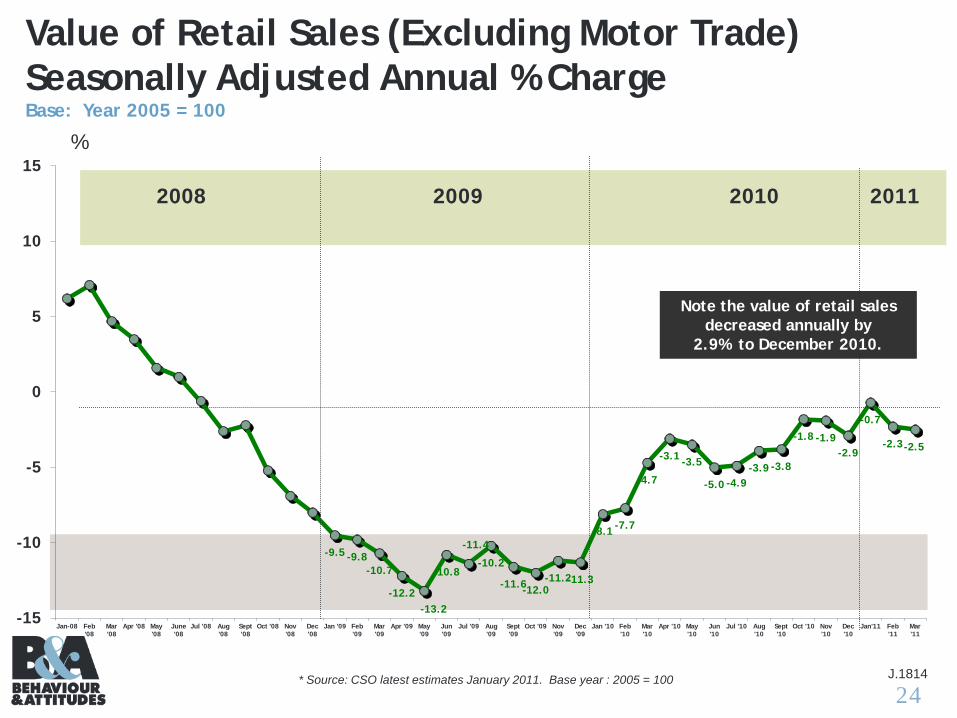
Note the value of retail sales decreased annually by
2.9% to December 2010.
Value of Retail Sales (Excluding Motor Trade)Seasonally Adjusted Annual % ChargeBase: Year 2005 = 100
%
* Source: CSO latest estimates January 2011. Base year : 2005 = 100
2008 2009 2010 2011

25J.1814
Retail SalesValue & Volume Growth: 2011 vs 2005 (= 100). Seasonally adjusted.
*Source: CSO latest estimates Apr 2011 (seasonally adjusted).
Retail Business – NACE REV 2
Value Volume
Period March 2011
IndexAnnual % Ch Index
Most recent % annual vol.
Change
Motor Trades 63.0 +4.7 67.8 +8.7
Department Stores 88.0 0.9 114.5 2.1
Food beverages & Tobacco 88.4 -3.5 87.7 -3.6
Fuel 106.8 0.3 78.1 -12.6
Pharmaceuticals Medical & Cosmetic Articles 104.6 -4.1 113 -5.5
Clothing, footwear & textiles 87.7 -0.6 122.3 2.8
Furniture and Lighting 57.8 -17.8 76.5 -13.9
Hardware, Paints and Glass 81.9 -2.8 85.3 -1.8
Electrical Goods 71.7 -12.0 120.0 -6.7
Books, Newspapers and Stationery 73.1 -8.8 67.3 -10.4
Other retail sales 83.3 -10.9 97.6 -14.2
Bars 75.6 -9.2 69.2 -9.6
Early year recovery for the motor trade over the first four months of the year, as expected, yet overall value and volume remains low against 2005 benchmark. Continued price surges and income
reductions are undermining the volume of fuel sales, if not their value.Furniture, books & stationery, on trade sales and ancillary retail sales are all being directly affected
by reduced disposable consumer income for the third year.
26J.1814
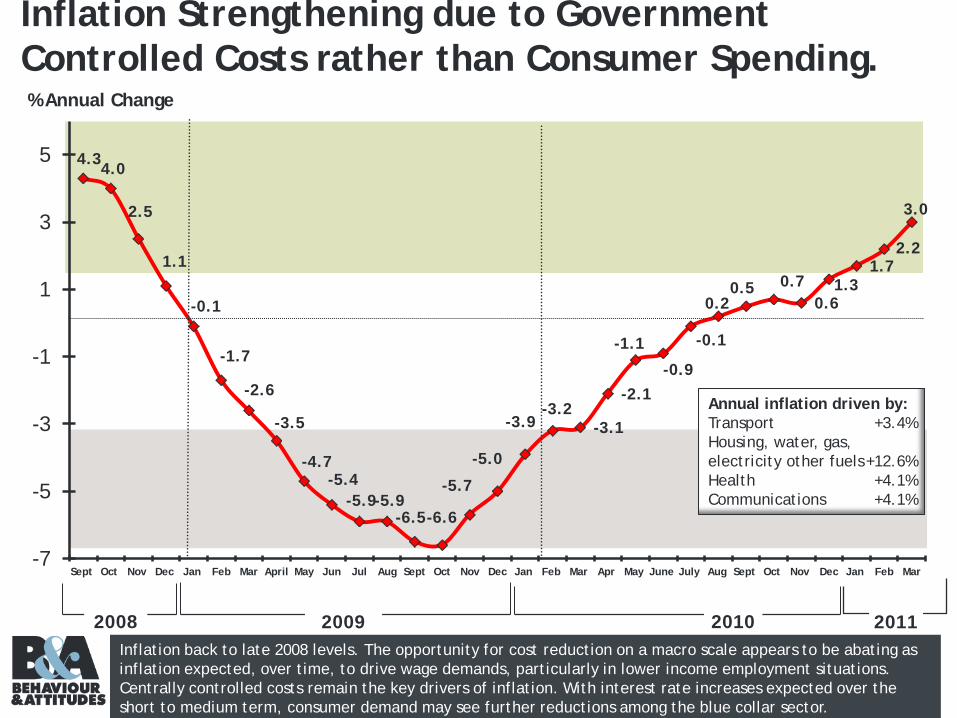
Inflation Strengthening due to Government Controlled Costs rather than Consumer Spending.
4.34.0
2.5
1.1
-0.1
-1.7
-2.6
-3.5
-4.7-5.4
-5.9-5.9-6.5-6.6
-5.7
-5.0
-3.9-3.2
-3.1
-2.1
-1.1
-0.9
-0.1
0.20.5 0.7
0.61.3
1.72.2
3.0
-7
-5
-3
-1
1
3
5
Sept Oct Nov Dec Jan Feb Mar April May Jun Jul Aug Sept Oct Nov Dec Jan Feb Mar Apr May June July Aug Sept Oct Nov Dec Jan Feb Mar
% Annual Change
2009 20102008 2011
Annual inflation driven by:Transport +3.4%Housing, water, gas, electricity other fuels+12.6%Health +4.1%Communications +4.1%
Inflation back to late 2008 levels. The opportunity for cost reduction on a macro scale appears to be abating as inflation expected, over time, to drive wage demands, particularly in lower income employment situations. Centrally controlled costs remain the key drivers of inflation. With interest rate increases expected over the short to medium term, consumer demand may see further reductions among the blue collar sector.
27J.1814
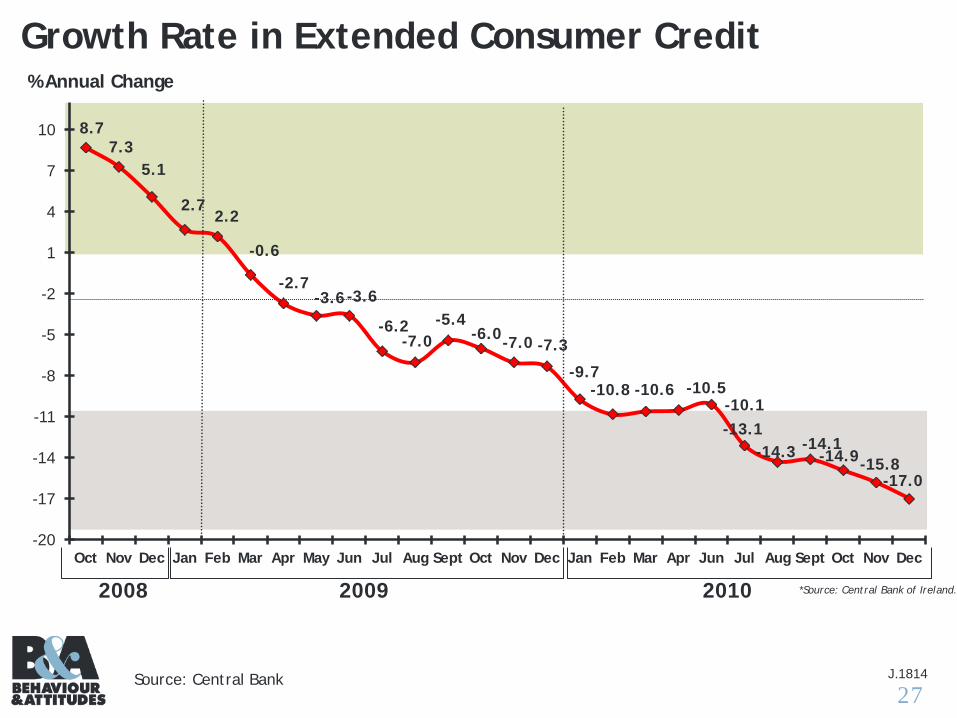
Growth Rate in Extended Consumer Credit
8.77.3
5.1
2.72.2
-0.6
-2.7-3.6-3.6
-6.2-7.0
-5.4-6.0-7.0 -7.3
-9.7-10.8 -10.6 -10.5
-10.1-13.1
-14.3 -14.1-14.9-15.8
-17.0
-20
-17
-14
-11
-8
-5
-2
1
4
7
10
Oct Nov Dec Jan Feb Mar Apr May Jun Jul Aug Sept Oct Nov Dec Jan Feb Mar Apr Jun Jul Aug Sept Oct Nov Dec
% Annual Change
2008 2009 2010
Source: Central Bank
*Source: Central Bank of Ireland.

28J.1814
€167.7
€176.7
€186.6
€179.9
€166.3 €164.6
€144.0
€153.4
€160.3
€154.6
€138.1€135.3
100.00
110.00
120.00
130.00
140.00
150.00
160.00
170.00
180.00
190.00
200.00
2005 2006 2007 2008 2009 2010
GDP
GNP
Last days of the Celtic Tiger
(€bn)
GDP and GNP Value Changes (at Current Market Prices)
*Source: CSO, Latest Estimates May 2011.
GDP and GNP values have declined back to pre 2005 levels. From peak year 2008, GDP has declined by 11.7% and GNP decline has been 15.6%. The decline in GNP indicates the severity of the recession in the domestic economy, this decline has accounted for all declines in GDP. In comparison the FDI sector has remained relatively static, making a marginal gain across the same time period.
29J.1814
€144.1
€159.3
€172.4€164.1
€134.5€124.1
€77.8€85.0
€93.4 €94.8€84.3
€81.4
€22.2 €24.6 €27.3 €29.2
€27.7€26.0
€43.4 €48.0 €50.1€39.8
€24.7€17.4
0.00
20.00
40.00
60.00
80.00
100.00
120.00
140.00
160.00
180.00
200.00
2005 2006 2007 2008 2009 2010
Total Domestic Demand
Personal Consumption
Gov Capital Spending
Gov Exp on Goods & Services
(€Billion)
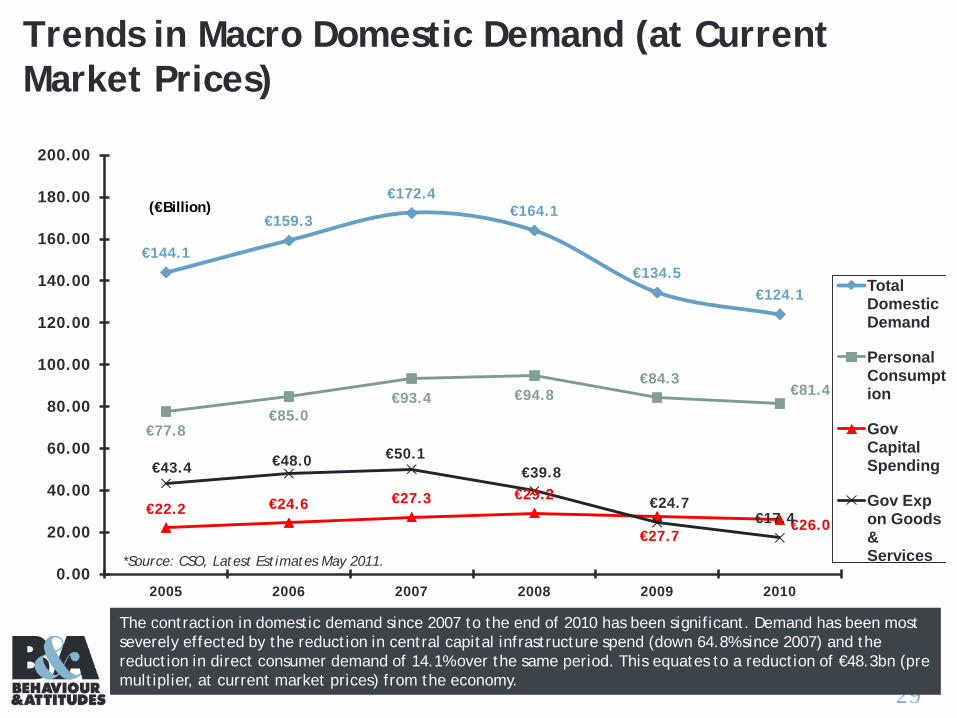
Trends in Macro Domestic Demand (at Current Market Prices)
*Source: CSO, Latest Estimates May 2011.
The contraction in domestic demand since 2007 to the end of 2010 has been significant. Demand has been most severely effected by the reduction in central capital infrastructure spend (down 64.8% since 2007) and the reduction in direct consumer demand of 14.1% over the same period. This equates to a reduction of €48.3bn (pre multiplier, at current market prices) from the economy.

30J.1814
€132.5€140.7
€152.4 €150.2€144.8
€158.4
€82.9 €82.6 €84.1 €81.0€77.0
€83.9
€49.5€58.1
€68.3 €69.1 €67.8€74.5
€113.5€123.6
€135.3 €133.9
€120.4€129.3
€55.1 €59.2 €64.3€57.3
€44.7 €46.7
€58.4€64.4
€71.1€76.7 €75.7
€82.6
0.00
20.00
40.00
60.00
80.00
100.00
120.00
140.00
160.00
180.00
200.00
2005 2006 2007 2008 2009 2010
Total Exports
Export Goods
Export Services
Total imports
Import Goods
Import Services
(€Billion)
Balance of Payment: Exports vs Imports (at current market prices)
*Source: CSO, Latest Estimates May 2011.
Exports remain key to Irish economic recovery, with a significant increase noted for 2010.Import levels have declined from the peak year 2007 due to reduced disposable income among consumers and also due to reduced business input requirements, although service imports have continued to increase .
31J.1814
€27.8€23.4 €19.8 €23.8
€32.3€37.2
€19.0 €17.1 €17.1 €16.3€24.4
€29.1
-€8.9 -€6.3 -€2.7-€7.5 -€7.9 -€8.0
-100.00
-80.00
-60.00
-40.00
-20.00
0.00
20.00
40.00
60.00
80.00
100.00
2005 2006 2007 2008 2009 2010
Goods
Total Goods Services
Services
(€Billion)Net Exporter
Net Importer
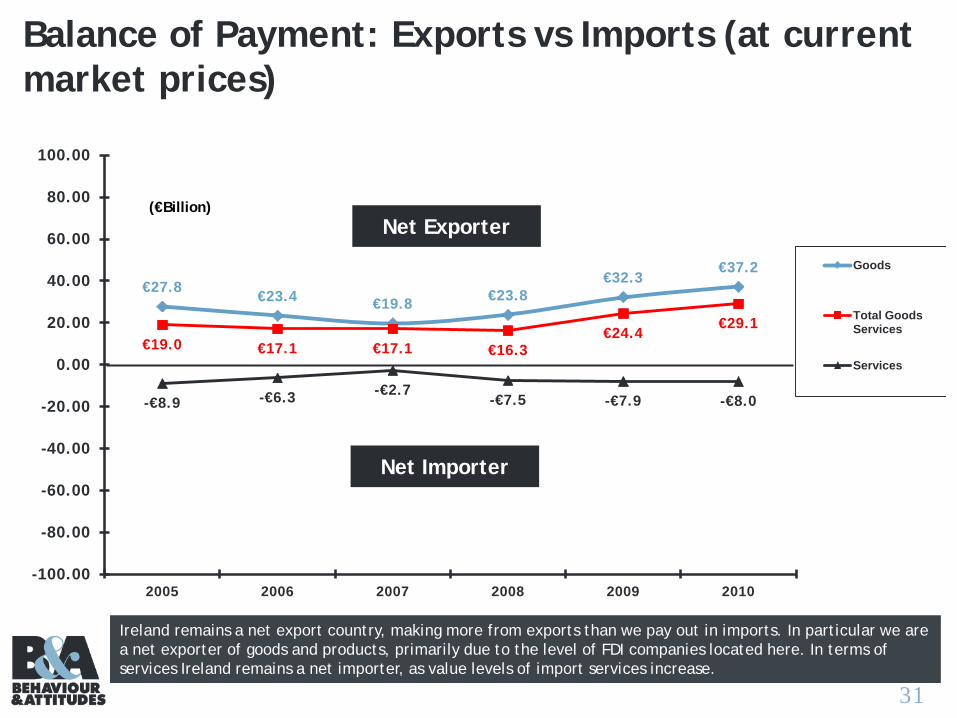
Balance of Payment: Exports vs Imports (at current market prices)
Ireland remains a net export country, making more from exports than we pay out in imports. In particular we are a net exporter of goods and products, primarily due to the level of FDI companies located here. In terms of services Ireland remains a net importer, as value levels of import services increase.

32J.1814
APPENDICESThe Questionnaire

33J.1814
SECTION ‘F’ - ECONOMYASK ALL RESPONDENTS aged 16+
Better off 1Worse off 2The same 3
Q.1 Thinking about the economy as a whole, do you think that the country is better off, worse off, or about the same as last year?
Q.2 And what about the coming year, do you think that the country will be better off, worse off or about the same as this year?
Better off 1Worse off 2The same 3
Better off 1Worse off 2The same 3
Q.3 Do you yourself feel better off financially, worse off financially or about the same compared to last year?
More confident 1Less confident 2No change 3
Q.4 In terms of your own economic well-being over the year ahead, are you more confident, less confident or is your confidence about the same as last year?
Higher 1Lower 2The same 3
Q.5 Do you expect your income in the next year, after inflation and taxes, to be higher, lower or the same as in the last twelve months?
A lot higher 1A little higher 2No change 3A little lower 4A lot lower 5
Q.6 Do you expect your assets (your house, shares, pension entitlements, savings) In the next year to be higher, lower or the same as in the past year? PROBE: A lot or a little
More 1Less 2The same 3
Q.7 In the year ahead, do you expect to purchase more, less or the same amount of goods and services as in the past year?
More 1
Less 2
The same 3
Q.8 Do you expect to save more, less or the same amount in the year ahead compared with the last twelve months?