Lecture 3 Evolution of Global Economies Bullionism & Mercantilism part 2
Upload
pearson-college-londonCategory
view
332download
0
B416: The Evolution of Global Economies
Lecture 1 : Module Aims, Outcomes & Assessment;
Introduction to Global Economics; Riccardo’s Comparative Advantage

Module Aims• This module aims to introduce learners to the major issues and influences in
the international economy over the past 150 years.
• Understanding the patterns of economic cycles and the causes of growth and recession is an important aim of this course.
• Putting into perspective the extreme economic booms and busts of the past will enable learners to analyse contemporary events in a historically relevant context, and enable learning from past events to be applied to challenges which present themselves today.
• An important objective of this module will be to identify the role of national and institutional economic policies, in combination with a geographical context, to explain key changes in the evolution of the global economy.
• The module aims to give learners an understanding of the causes and impact of ideological, political and socio-economic change on nations, and to enable appropriate use of economic analysis from understanding of key events in the past.
• Comparative Advantage & Riccardian Economics 2

Module OutcomesBy the end of this module, students should be able to:• Understand the foundations of industrialisation and the
drivers of economic growth.• Understand critical points in time and importance of the
evolutionary changes in the international and global economy during the past 150 years.
• Apply constructive critical analysis to, and interpretation from, economic history and consider its relevance to contemporary issues.
• Assess the economic circumstances, theories and principles that were drivers of economic development and growth for specific nations, and barriers to growth for other nations.
• Understand the causes and effects of ideological, political and socio-economic transitions on nation’s economies.
• Demonstrate appropriate use of economic analysis from understanding of key events in the past. 3

Assessment
• Group Presentation between week 5 and week 6 (30% of the overall grade)
• Course Work: 1,500 words assignment (70% pf the overall grade)
4

5
Topic 1: How did the global economy get to where it is today?Topic 2: Modern Economic Growth.Topic 3: The Economic History of Nations: Migration, Colonialism and Historical Persistence.Topic 4: Africa’s economy: Past and PresentTopic 5: Asian Tigers? Transition to Asia Topic 6: Disintegration: The Great Depression and recovery.Topic 7: Between the Military Storms: The Dark Valley to 1939Topic 8: Reconstruction and recovery: post 1945Topic 9: Demography and Economic GeographyTopic 10 The Great Recession 2008
Overview of Syllabus

Preparation Time
6
Preparation Activity Symbol Time Budget
Lecture 1 Hour
Seminar 30 Minutes
Work shop 30 Minutes
Read a chapter from
the core text + any
other recommended
material
30 Minutes
Annotate, take
notes15 Minutes
Online Individual
Activity30 Minutes
Group Activity 1 Hour
7
The Module Reading ListCore Textbook:Age of the Economist, by Daniel R. Fusfeld, 9th Edition, 2002; ISBN-10: 0321088123 • ISBN-13: 9780321088123, Prentice Hall
Recommended Reading:1. International Business - 14th Edition by John D Daniels, Lee H Radebaugh &
Daniel P Sullivan, Pearson, ISBN 978-0-273-76695-7 (available via DawsonEra)
2. An Outline of the History of Economic Thought, by Screpanti, Ernesto; Zamagni, Stefano, 2nd Edition, 2005; Oxford University Press, ISBN 0-19-927913-6 (cloth); 0-19-927914-4 (pbk). (available via DawsonEra)
3. The New Introduction to Geographical Economics by Charles Van Marrewijk(available via DawsonEra)
Further Reading:1. International Economics - 2nd Edition by Charles Van Marrewijk, Oxford
University Press, ISBN 978-0-19-956709-6
The core textbook will be used in Lectures and Seminar and should be brought to each Lecture and Seminar.

B416: The Evolution of Global Economies
Lecture 1: How did the global economy get to where it is today?

Learning Outcomes
By the end of this lecture, you should understand the following:
• We present basic information on the world economy
• Countries are ‘big’ measured by area, population, or income
• Income can be measured as Gross Domestic Product or Gross National Product; the difference is based on nationality of ownership of production factors:
• GDP + net receipts of factor income = GNP
• For most countries the difference (GDP – GNP) is small (but not, e.g. for small oil-rich countries)
• Using exchange rates to compare income levels in different countries underestimates income in developing countries; it is better to use Purchasing Power Parity (PPP) rates to correct for price differences.
• We can distinguish two waves of globalization, both for trade flows and capital flows.
9

Page 10
Scope of Global Economics• What is international economics about?• International trade topics
– Gains from trade, explaining patterns of trade, effects of government policies on trade
• International finance topics– Balance of payments, exchange rate determination, international
policy coordination and capital markets
• International trade versus finance
• International economics is about how nations interact through:
– trade of goods and services, flows of money, and investment.
• International economics is an old subject, but continues to grow in importance as countries become tied more to the international economy.
• Nations are now more closely linked than ever before.

Page 11
GDP and GNI, 2008 (billion current $)
10
100
1,000
10,000
100,000
10 100 1,000 10,000 100,000
Gross Domestic Product, GDP
Gro
ss N
ational In
com
e,
GN
I
USA
China
Germany
Japan
GDP and GNI income levels generally similarG
ross N
atio
na
l In
co
me
(lo
g s
ca
le)
Gross Domestic Product (log scale)

Page 12
GDP, 2008; top fifteen countries, ranked according to PPP
992
1,302
1,344
1,443
1,549
1,872
1,978
2,122
2,178
2,260
2,905
3,359
4,358
7,909
14,093
0 2,000 4,000 6,000 8,000 10,000 12,000 14,000 16,000
Turkey
Canada
S. Korea
Spain
Mexico
Italy
Brazil
France
UK
Russia
Germany
India
Japan
China
USA
GDP; PPP
GDP; current $
Developing country income higher at PPP rates
China # 3 at exchange rate;
China # 2 at PPP rates
India # 12 at exchange rate;
India # 4 at PPP rates

Page 13
Exports and imports of goods and services, 2008 ($ bn)
1
10
100
1,000
10,000
1 10 100 1,000 10,000
export value
import
valu
e
USA
GermanyChina
Russia
Saudi Arabia
Ethiopia
Brunei
Export – Import deviations can be substantial
Export value (log scale)
Imp
ort
va
lue
(lo
g s
ca
le)

Page 14
Relative exports of goods and services, 2008 (% of GDP)
88
90
91
92
97
110
131
179
212
234
0 50 100 150 200 250
Malta
Macao
United Arab Emirates
Belgium
Bahrain
Malaysia
Seychelles
Luxembourg
Hong Kong
Singapore
Exports(not value added) can be higher than income(value added)

Page 15
Taxes on international trade, 2008 (% of revenue)
25
26
27
32
32
35
35
44
52
57
0 10 20 30 40 50 60
Russian Federation
Niger
Bangladesh
St. Kitts and Nevis
Maldives
Madagascar
Cote d'Ivoire
Namibia
Bahamas, The
Lesotho
Developing countries depend on tariffs for tax revenue
Page 16
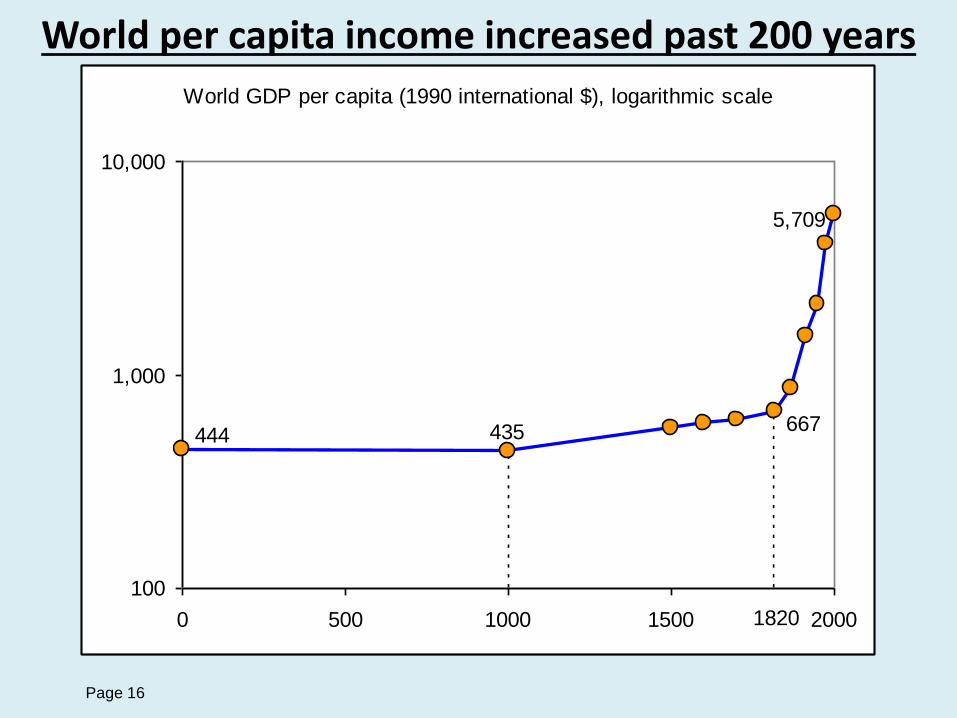
World per capita income increased past 200 years
World GDP per capita (1990 international $), logarithmic scale
5,709
435444667
1820
100
1,000
10,000
0 500 1000 1500 2000

Page 17
Two waves of globalization in tradeMerchandise exports, % of GDP in 1990 prices
4.6
17.2
2.5
10.1
0.2
13.4
0
5
10
15
1870 1900 1930 1960 1990
world USA Japan
Before World War I
After World War II

Page 18
Two waves of globalization in capital flows
0.6
0.4
0.2
0
1860 1880 1900 19601920 1940 1980 2000
Foreign capital stocks; assets / world GDP0.6
0.4
0.2
0
1860 1880 1900 19601920 1940 1980 2000
Foreign capital stocks; assets / world GDP
After World War I
Before World War I

Page 19
Labour migration peak before World War I
Relative annual immigration flows, 1870-1998 (per 1000)
-2
0
2
4
6
1870-1913 1914-1949 1950-1973 1974-1998
Western Europe Western Offshoots

Page 20
Global regional trade flows; manufactures, 2008
Merchandise trade export by region, 2008 (% of total)
0.3
0.9
1.0
0.8
6.5
13.9
29.9
3.5
3.8
4.5
6.5
13.0
27.7
41.0
0 10 20 30 40
AFR
SCA
CIS
mEAST
NAM
ASIA
EUR
total
intra-region

Page 21
Concluding remarks The World Economy
• Large countries land: Russia, China, Canada, USA• Large countries population: China, India• Large countries income: USA, Japan, Germany, UK, France• Large countries income PPP: USA, China, Japan, India• Price differences (at exchange rates) between countries
can be large for non-traded goods (no arbitrage opportunities)
• Deviations GDP – GNP relatively small for most countries• Large trade flows within Europe• Deviations Exports – Imports can be relatively large• Global per capita income levels increased fast last 200
years• Two waves of globalization, both for trade and capital
flows

Page 22
David Ricardo (1772-1823)
“When a country can either import a commodity or produce it at home, it compares the cost of producing at home with the cost of procuring from abroad; if the latter is less than the first, it imports.”

Page 23
Overview Ricardian (classical) model
• Technology differences between countries are the driving force behind international trade flows
• Relative (or comparative) differences are crucial, not absolute differences
• Absolute differences are important for determining a country’s welfare level
• The production possibility frontier summarizes the state of technology and the available factors of production in final goods space
• Trade flows increase welfare (technology gains from trade)

Page 24
Overview Ricardian (classical) model
• Technology differences between countries are the driving force behind international trade flows
• Relative (or comparative) differences are crucial, not absolute differences
• Absolute differences are important for determining a country’s welfare level
• The production possibility frontier summarizes the state of technology and the available factors of production in final goods space
• Trade flows increase welfare (technology gains from trade)

Page 25
Assumptions of the Ricardian technology model
• Two countries (EU and Kenya)• Two final goods (Food and
Chemicals)• One factor of production (Labour)• Constant returns to scale production functions• Perfect competition• Labour is mobile between sectors, but not between
countries• Costless trade in final goods (no impediments to
trade)• Technology differs between countries
• General (example)

Page 26
Technology differences between countries
Production technology is summarized in a productivity table:
Labour units required to produce one unit of output
Food Chemicals
EU 2 8
Kenya 4 24
The EU technology is more productive for both goods
The EU has an absolute advantage in Food production: it
requires less labour (2 units instead of 4)
The EU also has an absolute advantage in Chemicals
production: it requires less labour (8 units instead of 24)

Page 27
Comparative advantage: productivity method
Labour units required to produce one unit of output
Food Chemicals
EU 2 8
Kenya 4 24
• The EU is twice as productive in the Food sector (4/2 = 2)
• The EU is three times as productive in the Chemicals sector
(24/8 = 3), so
The EU has a comparative advantage in Chemicals, and
Kenya has a comparative advantage in Food

Page 28
• An extra unit of Chemicals needs 8 labour in the EU
• This labour could have made 8/2 = 4 units of Food; the
opportunity cost of Chemicals production in the EU is 4 Food
• An extra unit of Chemicals in Kenya needs 24 labour
• This labour could have made 24/4 = 6 units of Food; the
opportunity cost of Chemicals production in Kenya is 6 Food
Comparative advantage: opportunity cost method
Labour units required to produce one unit of output
Food Chemicals
EU 2 8
Kenya 4 24
The EU has a comparative advantage in Chemicals,
Kenya in Food

Page 29
Production possibility frontier (ppf)
Definition: all possible combinations of efficient production points of final goods, given the available factors of production and the state of technology;
note that:• It is a technical specification: the ppf does not depend on the type of market competition• The ppf depends on the available factors of production: if, e.g., more labour becomes available more goods can be produced• The ppf depends on the state of technology: if new techniques become available, output increases with the same use of inputs

Page 30
The ppf is a straight line in the Ricardian modelLabour units required to produce one unit of output
Food Chemicals
EU 2 8
Kenya 4 24
• Suppose the EU has 200 units of labour available and Kenya has
480 units available (remember: it is just an example)
• If all workers in the EU produce only Food, the EU can make
200/2 = 100 Food (and 0 Chemicals)
• If all workers in the EU produce only Chemicals, the EU can make
200/8 = 25 Chemicals (and 0 Food)
• Similarly, if all workers in Kenya produce Food total output is
480/4 = 120 Food (and 0 Chemicals); if they all produce Chemicals
total output is 480/24 = 20 Chemicals (and 0 Food)

Page 31
Concluding remarks Ricardian (classical) model
• Technological differences between countries are the classical driving force for international trade flows.
• Only comparative costs, not absolute costs, are important for determining the direction of trade flows.
• Absolute costs are important for determining a country’s welfare level.
• Allowing for more countries and more goods is easy, allowing for more than one factor of production is not (see neoclassical model).

And Now…Work Outside the Lecture
Preparation
For
Padagogic
Style
Preparation
Time Budget
Individual
TaskGroup Task Output Week 1 Preparation Activity
Read Chapter 1 to Chapter 4 from Core Text
Book: The Age of the Economist
An outline of the history of economic thought by
SCREPANTI & ZAMAGNI, Section 1 to 3
Seminar 1 30 Minutes Read above Material + Seminar material
Workshop 1 1 HourOnline Collaboration Activities relating Group
Presentation in Week 6
Lecture 1 2 Hour

End of presentation
© Pearson College 2013