B: Chapter 12 HTF: Chapter 14.5 Principal Component...
70
Principal Component Analysis Barnabás Póczos University of Alberta Nov 24, 2009 B: Chapter 12 HTF: Chapter 14.5
Transcript of B: Chapter 12 HTF: Chapter 14.5 Principal Component...

Principal Component AnalysisBarnabás Póczos
University of Alberta
Nov 24, 2009
B: Chapter 12HTF: Chapter 14.5

2
Contents
• Motivation• PCA algorithms• Applications
• Face recognition• Facial expression recognition
• PCA theory• Kernel-PCA
Some of these slides are taken from • Karl Booksh Research group• Tom Mitchell• Ron Parr

3
PCA Applications
• Data Visualization• Data Compression• Noise Reduction• Data Classification• Trend Analysis• Factor Analysis

4
Data Visualization
Example:
• Given 53 blood and urine samples (features) from 65 people.
• How can we visualize the measurements?

5
Data Visualization• Matrix format (65x53)
H -W B C H -R B C H -H g b H -H c t H -M C V H -M C H H -M C H CH -M C H C
A 1 8 . 0 0 0 0 4 . 8 2 0 0 1 4 . 1 0 0 0 4 1 . 0 0 0 0 8 5 . 0 0 0 0 2 9 . 0 0 0 0 3 4 . 0 0 0 0
A 2 7 . 3 0 0 0 5 . 0 2 0 0 1 4 . 7 0 0 0 4 3 . 0 0 0 0 8 6 . 0 0 0 0 2 9 . 0 0 0 0 3 4 . 0 0 0 0
A 3 4 . 3 0 0 0 4 . 4 8 0 0 1 4 . 1 0 0 0 4 1 . 0 0 0 0 9 1 . 0 0 0 0 3 2 . 0 0 0 0 3 5 . 0 0 0 0
A 4 7 . 5 0 0 0 4 . 4 7 0 0 1 4 . 9 0 0 0 4 5 . 0 0 0 0 1 0 1 . 0 0 0 0 3 3 . 0 0 0 0 3 3 . 0 0 0 0
A 5 7 . 3 0 0 0 5 . 5 2 0 0 1 5 . 4 0 0 0 4 6 . 0 0 0 0 8 4 . 0 0 0 0 2 8 . 0 0 0 0 3 3 . 0 0 0 0
A 6 6 . 9 0 0 0 4 . 8 6 0 0 1 6 . 0 0 0 0 4 7 . 0 0 0 0 9 7 . 0 0 0 0 3 3 . 0 0 0 0 3 4 . 0 0 0 0
A 7 7 . 8 0 0 0 4 . 6 8 0 0 1 4 . 7 0 0 0 4 3 . 0 0 0 0 9 2 . 0 0 0 0 3 1 . 0 0 0 0 3 4 . 0 0 0 0
A 8 8 . 6 0 0 0 4 . 8 2 0 0 1 5 . 8 0 0 0 4 2 . 0 0 0 0 8 8 . 0 0 0 0 3 3 . 0 0 0 0 3 7 . 0 0 0 0
A 9 5 . 1 0 0 0 4 . 7 1 0 0 1 4 . 0 0 0 0 4 3 . 0 0 0 0 9 2 . 0 0 0 0 3 0 . 0 0 0 0 3 2 . 0 0 0 0
Inst
ance
s
Features
Difficult to see the correlations between the features...

6
Data Visualization• Spectral format (65 curves, one for each person)
0 10 20 30 40 50 600100200300400500600700800900
1000
measurement
Val
ue
Measurement
Difficult to compare the different patients...

7
Data Visualization
0 10 20 30 40 50 60 7000.20.40.60.811.21.41.61.8
Person
H-B
ands
• Spectral format (53 pictures, one for each feature)
Difficult to see the correlations between the features...

8
0 50 150 250 350 45050100150200250300350400450500550
C-Triglycerides
C-L
DH
0 100200300400500
0200
4006000
1
2
3
4
C-TriglyceridesC-LDH
M-E
PI
Bi-variate Tri-variate
Data Visualization
How can we visualize the other variables???
… difficult to see in 4 or higher dimensional spaces...

9
Data Visualization• Is there a representation better than the coordinate axes?
• Is it really necessary to show all the 53 dimensions?• … what if there are strong correlations between the
features?
• How could we find the smallest subspace of the 53-D space that keeps the most information about the original data?
• A solution: Principal Component Analysis

10
Principle Component Analysis
Orthogonal projection of data onto lower-dimension linear space that...• maximizes variance of projected data (purple line)
• minimizes mean squared distance between • data point and • projections (sum of blue lines)
PCA:
11
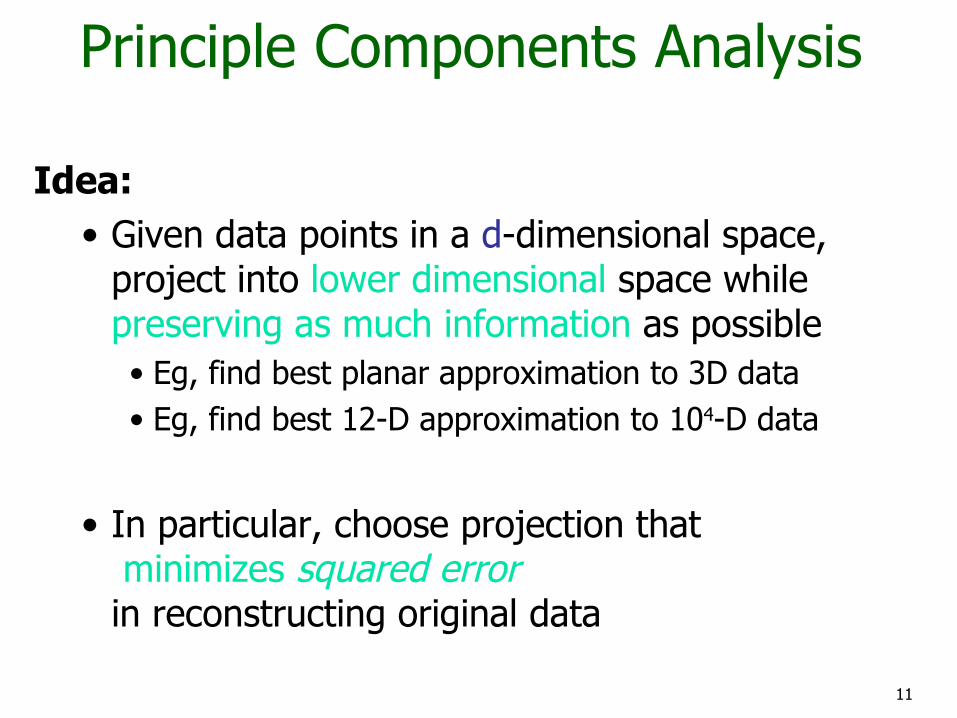
Principle Components Analysis
Idea: • Given data points in a d-dimensional space,
project into lower dimensional space while preserving as much information as possible• Eg, find best planar approximation to 3D data• Eg, find best 12-D approximation to 104-D data
• In particular, choose projection that minimizes squared error in reconstructing original data

12
• Vectors originating from the center of mass
• Principal component #1 points in the direction of the largest variance.
• Each subsequent principal component…• is orthogonal to the previous ones, and • points in the directions of the largest
variance of the residual subspace
The Principal Components

13
2D Gaussian dataset

14
1st PCA axis

15
2nd PCA axis
16
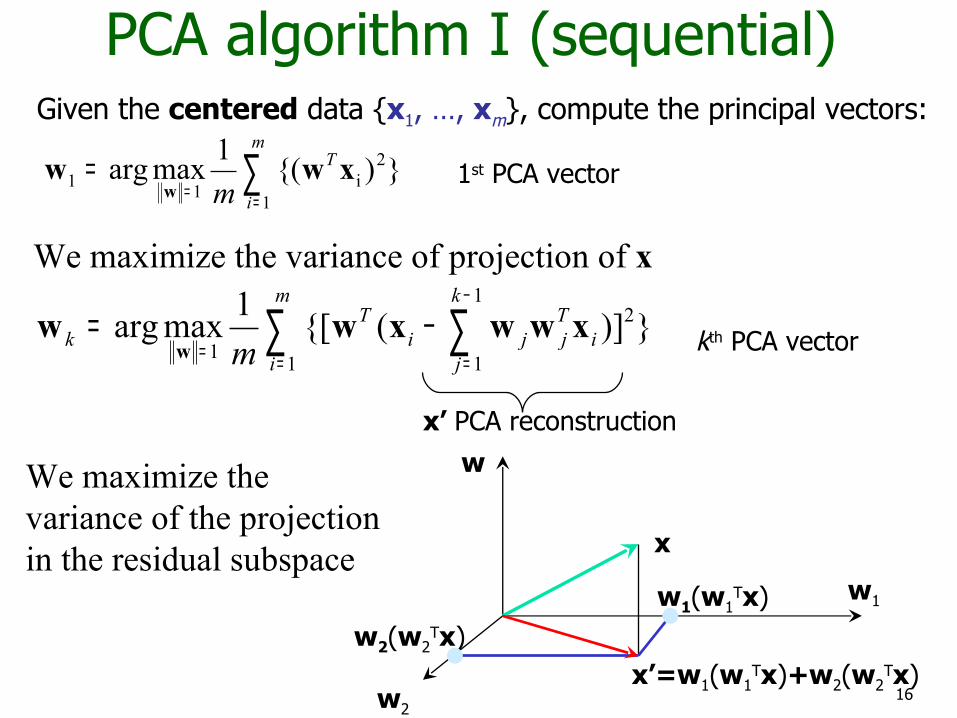
PCA algorithm I (sequential)
∑ ∑=
−
==−=
m
i
k
ji
Tjji
Tk m 1
21
11})]({[1maxarg xwwxww
w
}){(1maxarg1
2i11 ∑
===
m
i
T
mxww
w
We maximize the variance of the projection in the residual subspace
We maximize the variance of projection of x
x’ PCA reconstruction
Given the centered data {x1, …, xm}, compute the principal vectors:
1st PCA vector
kth PCA vector
w1(w1Tx)
w2(w2Tx)
x
w1
w2
x’=w1(w1Tx)+w2(w2
Tx)
w

17
PCA algorithm II (sample covariance matrix)
• Given data {x1, …, xm}, compute covariance matrix Σ
• PCA basis vectors = the eigenvectors of Σ
• Larger eigenvalue ⇒ more important eigenvectors
∑=
−−=Σm
i
Tim 1
))((1 xxxx ∑=
=m
iim 1
1 xxwhere

18
PCA algorithm II PCA algorithm(X, k): top k eigenvalues/eigenvectors
% X = N × m data matrix, % … each data point xi = column vector, i=1..m
•
• X subtract mean x from each column vector xi in X
• Σ X XT … covariance matrix of X
• { λi, ui }i=1..N = eigenvectors/eigenvalues of Σ ... λ1 ≥ λ2 ≥ … ≥ λN
• Return { λi, ui }i=1..k% top k principle components
∑=
=m
im 1
1ixx

19
PCA algorithm III (SVD of the data matrix)
Singular Value Decomposition of the centered data matrix X.
Xfeatures × samples = USVT
X VTSU=
samples
significant
noise
nois
e noise
sign
ifica
nt
sig.

20
PCA algorithm III• Columns of U
• the principal vectors, { u(1), …, u(k) }• orthogonal and has unit norm – so UTU = I• Can reconstruct the data using linear combinations
of { u(1), …, u(k) }
• Matrix S • Diagonal• Shows importance of each eigenvector
• Columns of VT • The coefficients for reconstructing the samples

Face recognition
22
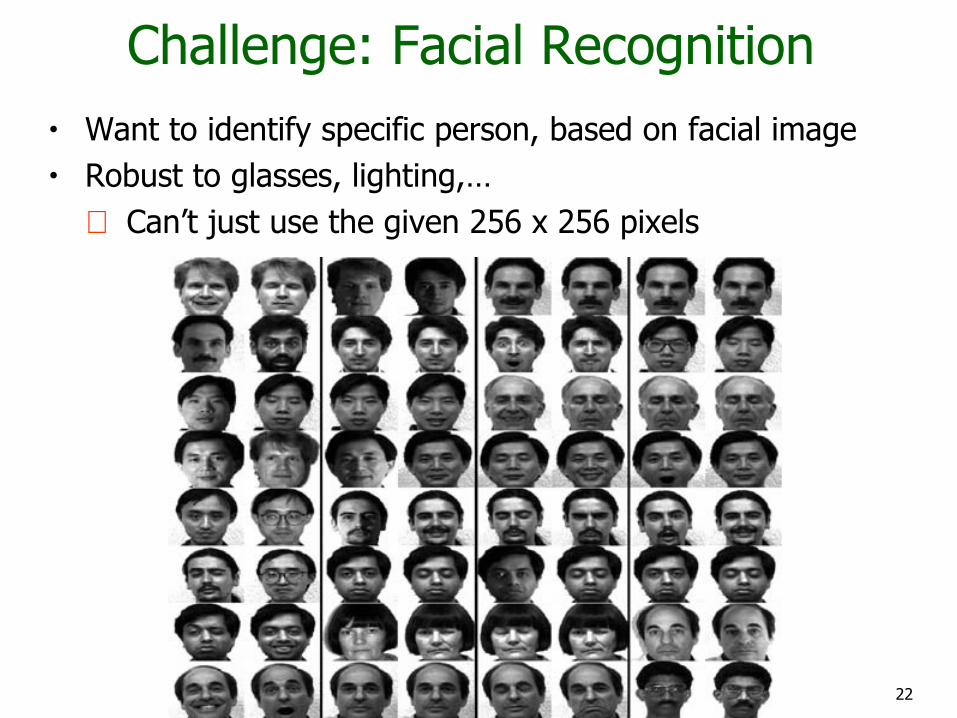
Challenge: Facial Recognition• Want to identify specific person, based on facial image• Robust to glasses, lighting,…
⇒ Can’t just use the given 256 x 256 pixels

23
Applying PCA: Eigenfaces
• Example data set: Images of faces • Famous Eigenface approach
[Turk & Pentland], [Sirovich & Kirby]• Each face x is …• 256 × 256 values (luminance at location)
• x in ℜ256×256 (view as 64K dim vector)
• Form X = [ x1 , …, xm ] centered data mtx• Compute Σ = XXT • Problem: Σ is 64K × 64K … HUGE!!!
256 x 256 real values
m faces
X =
x1, …, xm
Method A: Build a PCA subspace for each person and check which subspace can reconstruct the test image the best
Method B: Build one PCA database for the whole dataset and then classify based on the weights.

24
Computational Complexity
• Suppose m instances, each of size N• Eigenfaces: m=500 faces, each of size N=64K
• Given N×N covariance matrix Σ, can compute • all N eigenvectors/eigenvalues in O(N3)• first k eigenvectors/eigenvalues in O(k N2)
• But if N=64K, EXPENSIVE!

25
A Clever Workaround
• Note that m<<64K• Use L=XTX instead of Σ=XXT
• If v is eigenvector of Lthen Xv is eigenvector of Σ
Proof: L v = γ v XTX v = γ v X (XTX v) = X(γ v) = γ Xv (XXT)X v = γ (Xv) Σ (Xv) = γ (Xv)
256 x 256 real values
m faces
X =
x1, …, xm

26
Principle Components (Method B)

27
Reconstructing… (Method B)
• … faster if train with…• only people w/out glasses• same lighting conditions

28
Shortcomings• Requires carefully controlled data:
• All faces centered in frame• Same size• Some sensitivity to angle
• Alternative:• “Learn” one set of PCA vectors for each angle• Use the one with lowest error
• Method is completely knowledge free• (sometimes this is good!)• Doesn’t know that faces are wrapped around 3D objects
(heads)• Makes no effort to preserve class distinctions

Facial expression recognition

30
Happiness subspace (method A)

31
Disgust subspace (method A)

32
Facial Expression RecognitionMovies (method A)

33
Facial Expression RecognitionMovies (method A)

34
Facial Expression RecognitionMovies (method A)

Image Compression

36
Original Image
• Divide the original 372x492 image into patches:
• Each patch is an instance that contains 12x12 pixels on a grid
• View each as a 144-D vector

37
L2 error and PCA dim

38
PCA compression: 144D ) 60D

39
PCA compression: 144D ) 16D

40
16 most important eigenvectors
2 4 6 8 1 0 1 2
2468
1 01 2
2 4 6 8 1 0 1 2
2468
1 01 2
2 4 6 8 1 0 1 2
2468
1 01 2
2 4 6 8 1 0 1 2
2468
1 01 2
2 4 6 8 1 0 1 2
2468
1 01 2
2 4 6 8 1 0 1 2
2468
1 01 2
2 4 6 8 1 0 1 2
2468
1 01 2
2 4 6 8 1 0 1 2
2468
1 01 2
2 4 6 8 1 0 1 2
2468
1 01 2
2 4 6 8 1 0 1 2
2468
1 01 2
2 4 6 8 1 0 1 2
2468
1 01 2
2 4 6 8 1 0 1 2
2468
1 01 2
2 4 6 8 1 0 1 2
2468
1 01 2
2 4 6 8 1 0 1 2
2468
1 01 2
2 4 6 8 1 0 1 2
2468
1 01 2
2 4 6 8 1 0 1 2
2468
1 01 2

41
PCA compression: 144D ) 6D

42
2 4 6 8 1 0 1 2
2
4
6
8
1 0
1 22 4 6 8 1 0 1 2
2
4
6
8
1 0
1 22 4 6 8 1 0 1 2
2
4
6
8
1 0
1 2
2 4 6 8 1 0 1 2
2
4
6
8
1 0
1 22 4 6 8 1 0 1 2
2
4
6
8
1 0
1 22 4 6 8 1 0 1 2
2
4
6
8
1 0
1 2
6 most important eigenvectors

43
PCA compression: 144D ) 3D

44
2 4 6 8 1 0 1 2
2
4
6
8
1 0
1 2
2 4 6 8 1 0 1 2
2
4
6
8
1 0
1 2
2 4 6 8 1 0 1 2
2
4
6
8
1 0
1 2
3 most important eigenvectors

45
PCA compression: 144D ) 1D

46
60 most important eigenvectors
Looks like the discrete cosine bases of JPG!...

47
2D Discrete Cosine Basis
http://en.wikipedia.org/wiki/Discrete_cosine_transform

Noise Filtering

49
Noise Filtering, Auto-Encoder…x x’
U x

50
Noisy image

51
Denoised image using 15 PCA components

PCA Shortcomings

53
PCA, a Problematic Data Set
PCA doesn’t know labels!

54
PCA vs Fisher Linear Discriminant
• PCA maximizes variance,independent of class⇒ magenta
• FLD attempts to separate classes⇒ green line

55
PCA, a Problematic Data Set
PCA cannot capture NON-LINEAR structure!

56
PCA Conclusions• PCA
• finds orthonormal basis for data• Sorts dimensions in order of “importance”• Discard low significance dimensions
• Uses:• Get compact description• Ignore noise• Improve classification (hopefully)
• Not magic:• Doesn’t know class labels• Can only capture linear variations
• One of many tricks to reduce dimensionality!

PCA Theory
58
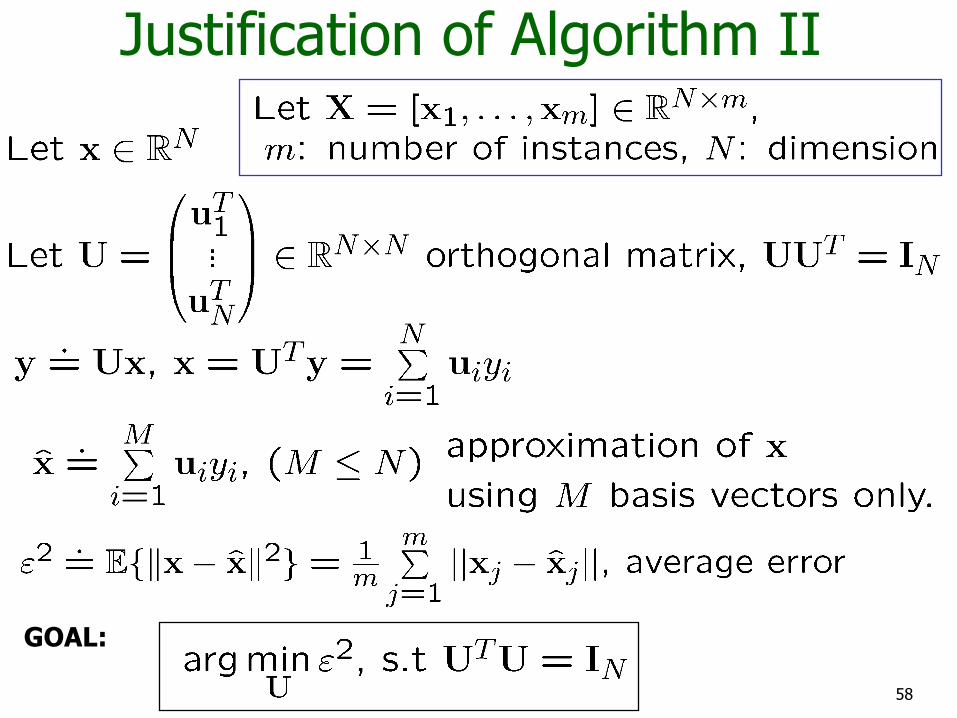
Justification of Algorithm II
GOAL:
59
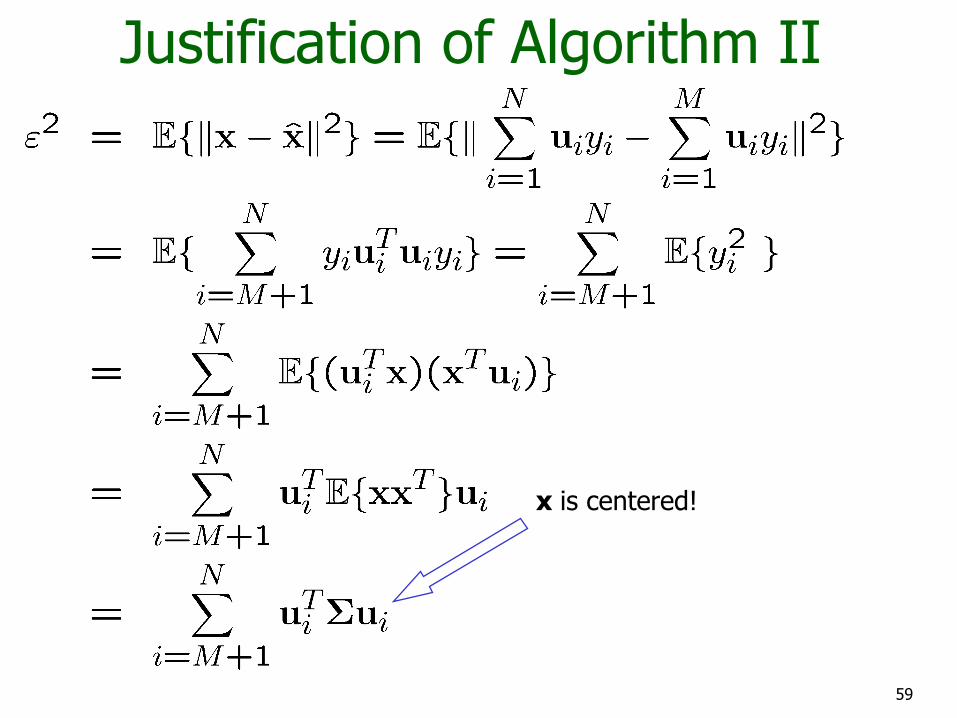
Justification of Algorithm II
x is centered!

60
Justification of Algorithm IIGOAL:
Use Lagrange-multipliers for the constraints.

61
Justification of Algorithm II

Kernel PCA

63
Kernel PCAPerforming PCA in the feature space
Lemma
Proof:

64
Kernel PCA
Lemma

65
Kernel PCAProof

66
• How to use α to calculate the projection of a new sample t?
Kernel PCA
Where was I cheating?
The data should be centered in the feature space, too!But this is manageable...

67
Input points before kernel PCA
http://en.wikipedia.org/wiki/Kernel_principal_component_analysis

68
Output after kernel PCA
The three groups are distinguishable using the first component only

69
We haven’t covered...
• Artificial Neural Network Implementations
• Mixture of Probabilistic PCA
• Online PCA, Regret Bounds

70
Thanks for the Attention!