Azerbaijan - InterSciWikiintersci.ss.uci.edu/wiki/eBooks/Articles/2001 AZ Country...COUNTRY PROFILE...
57
COUNTRY PROFILE 2001 Azerbaijan This Country Profile is a reference tool, which provides analysis of historical political, infrastructural and economic trends. It is revised and updated annually. The EIU’s Country Reports analyse current trends and provide a two-year forecast The full publishing schedule for Country Profiles is now available on our website at http://www.eiu.com/schedule The Economist Intelligence Unit 15 Regent St, London SW1Y 4LR United Kingdom
Transcript of Azerbaijan - InterSciWikiintersci.ss.uci.edu/wiki/eBooks/Articles/2001 AZ Country...COUNTRY PROFILE...

COUNTRY PROFILE 2001
AzerbaijanThis Country Profile is a reference tool, which providesanalysis of historical political, infrastructural and economictrends. It is revised and updated annually. The EIU’s CountryReports analyse current trends and provide a two-yearforecast
The full publishing schedule for Country Profiles is nowavailable on our website at http://www.eiu.com/schedule
The Economist Intelligence Unit15 Regent St, London SW1Y 4LRUnited Kingdom

The Economist Intelligence UnitThe Economist Intelligence Unit is a specialist publisher serving companies establishing and managingoperations across national borders. For over 50 years it has been a source of information on businessdevelopments, economic and political trends, government regulations and corporate practice worldwide.
The EIU delivers its information in four ways: through our digital portfolio, where our latest analysis isupdated daily; through printed subscription products ranging from newsletters to annual referenceworks; through research reports; and by organising seminars and presentations. The firm is a member ofThe Economist Group.
LondonThe Economist Intelligence Unit15 Regent StLondonSW1Y 4LRUnited KingdomTel: (44.20) 7830 1007Fax: (44.20) 7830 1023E-mail: [email protected]
New YorkThe Economist Intelligence UnitThe Economist Building111 West 57th StreetNew YorkNY 10019, USTel: (1.212) 554 0600Fax: (1.212) 586 0248E-mail: [email protected]
Hong KongThe Economist Intelligence Unit60/F, Central Plaza18 Harbour RoadWanchaiHong KongTel: (852) 2585 3888Fax: (852) 2802 7638E-mail: [email protected]
Website: www.eiu.com
Electronic deliveryThis publication can be viewed by subscribing online at www.store.eiu.com
Reports are also available in various other electronic formats, such as CD-ROM, Lotus Notes, on-linedatabases and as direct feeds to corporate intranets. For further information, please contact your nearestEconomist Intelligence Unit office
Copyright© 2001 The Economist Intelligence Unit Limited. All rights reserved. Neither this publication norany part of it may be reproduced, stored in a retrieval system, or transmitted in any form or by anymeans, electronic, mechanical, photocopying, recording or otherwise, without the prior permissionof The Economist Intelligence Unit Limited.
All information in this report is verified to the best of the author's and the publisher's ability. However,the EIU does not accept responsibility for any loss arising from reliance on it.
ISSN 1366-4239
Symbols for tables“n/a” means not available; “–” means not applicable
Printed and distributed by Patersons Dartford, Questor Trade Park, 151 Avery Way, Dartford, Kent DA1 1JS, UK.


EIU Country Profile 2001 © The Economist Intelligence Unit Limited 2001
Comparative economic indicators, 2000

1
EIU Country Profile 2001 © The Economist Intelligence Unit Limited 2001
Contents
3 Basic data
4 Politics4 Political development9 Constitution, institutions and administration
10 Political forces12 International relations and defence
16 Resources and infrastructure16 Population17 Education17 Health18 Natural resources and the environment18 Transport, communications and the Internet19 Energy provision
20 The economy20 Economic structure21 Economic policy24 Economic performance25 Regional trends
26 Economic sectors26 Agriculture26 Mining and semi-processing29 Manufacturing30 Construction30 Financial services31 Other services
32 The external sector32 Trade in goods33 Invisibles and the current account34 Capital flows and foreign debt36 Foreign reserves and the exchange rate
38 Appendices38 Regional organisations41 Sources of information43 Reference tables43 Population43 Population by age43 Labour force44 Production of energy44 Gross domestic product45 Gross domestic product by sector45 Gross domestic product by expenditure45 Prices and earnings46 Consolidated operations of the general government, IMF series47 Money supply and credit47 Production of major crops
2
EIU Country Profile 2001 © The Economist Intelligence Unit Limited 2001
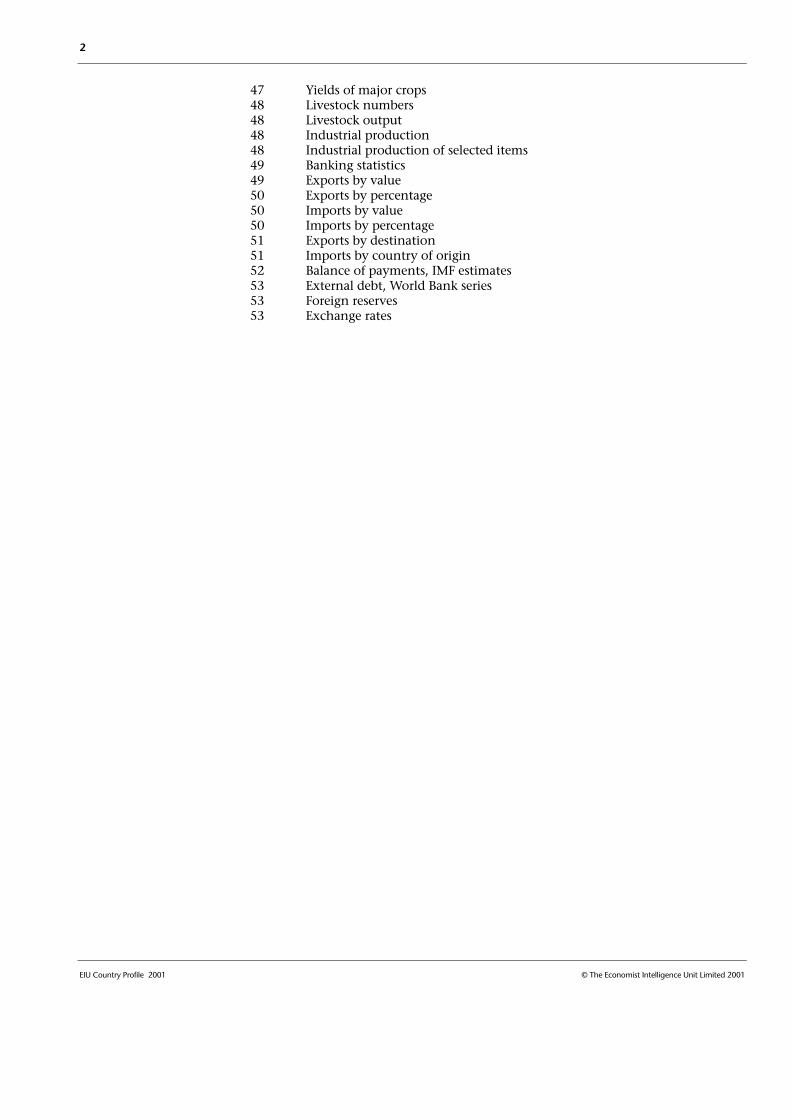
47 Yields of major crops48 Livestock numbers48 Livestock output48 Industrial production48 Industrial production of selected items49 Banking statistics49 Exports by value50 Exports by percentage50 Imports by value50 Imports by percentage51 Exports by destination51 Imports by country of origin52 Balance of payments, IMF estimates53 External debt, World Bank series53 Foreign reserves53 Exchange rates
Azerbaijan 3
© The Economist Intelligence Unit Limited 2001 EIU Country Profile 2001
Azerbaijan
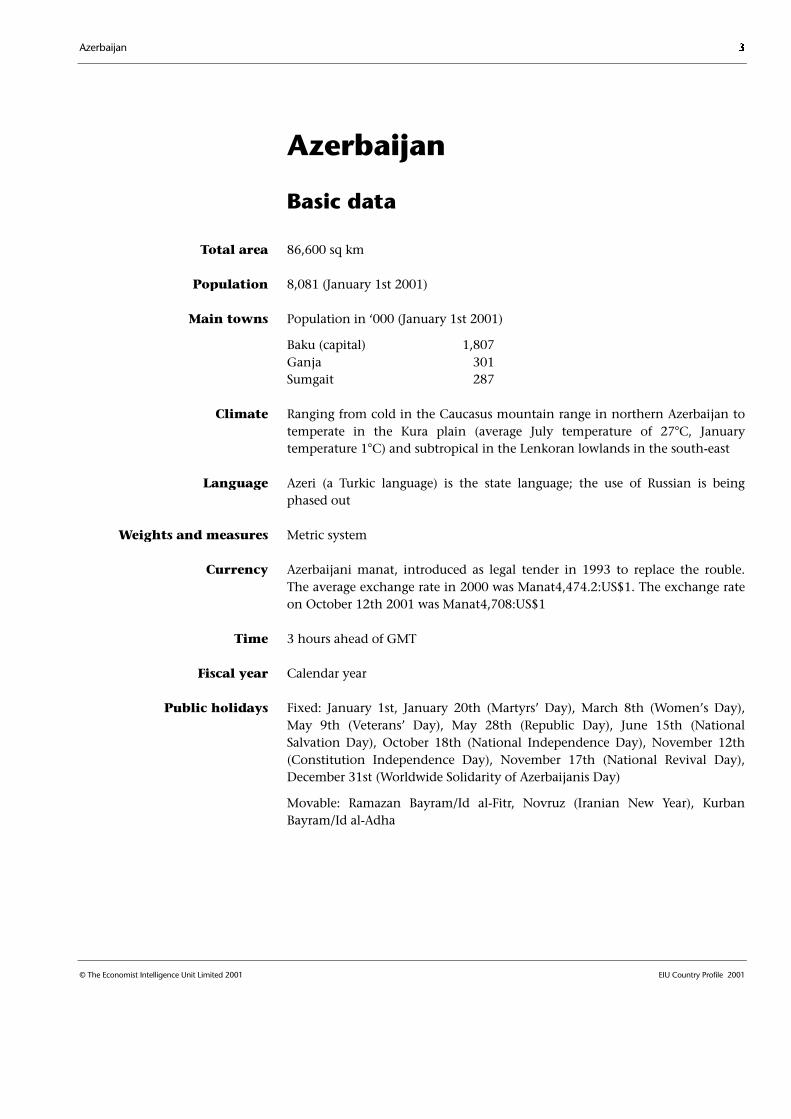
Basic data
86,600 sq km
8,081 (January 1st 2001)
Population in ‘000 (January 1st 2001)
Baku (capital) 1,807Ganja 301Sumgait 287
Ranging from cold in the Caucasus mountain range in northern Azerbaijan totemperate in the Kura plain (average July temperature of 27°C, Januarytemperature 1°C) and subtropical in the Lenkoran lowlands in the south-east
Azeri (a Turkic language) is the state language; the use of Russian is beingphased out
Metric system
Azerbaijani manat, introduced as legal tender in 1993 to replace the rouble.The average exchange rate in 2000 was Manat4,474.2:US$1. The exchange rateon October 12th 2001 was Manat4,708:US$1
3 hours ahead of GMT
Calendar year
Fixed: January 1st, January 20th (Martyrs’ Day), March 8th (Women’s Day),May 9th (Veterans’ Day), May 28th (Republic Day), June 15th (NationalSalvation Day), October 18th (National Independence Day), November 12th(Constitution Independence Day), November 17th (National Revival Day),December 31st (Worldwide Solidarity of Azerbaijanis Day)
Movable: Ramazan Bayram/Id al-Fitr, Novruz (Iranian New Year), KurbanBayram/Id al-Adha
Public holidays
Fiscal year
Time
Currency
Weights and measures
Language
Climate
Main towns
Total area
Population
4 Azerbaijan
EIU Country Profile 2001 © The Economist Intelligence Unit Limited 2001
Politics
Azerbaijan declared its independence from the Soviet Union in October 1991.Political instability from 1988 onwards and severe economic dislocation,caused by the break-up of the Soviet economy and war with Armenia, lasteduntil 1994. Azerbaijan, officially described as a “presidential republic”, is ineffect a dictatorship run by its communist-era leader, Heydar Aliyev, who seizedpower in 1993. The unicameral parliament, in which Mr Aliyev’s NewAzerbaijan Party (NAP) has a majority, is a rubber-stamp body.
Political development
The term Azerbaijan has been used since early medieval times to refer to thearea of both the present-day Republic of Azerbaijan and Iranian Azerbaijan.The Arab conquest in the seventh century brought Islam to the region. TheIranian language originally spoken in Azerbaijan was supplanted by Turkic (theforerunner of modern Azeri) when the Seljuk Turks conquered the region inthe 11th century. However, Azerbaijan retains a close cultural affinity with Iranto this day. By the mid-18th century a number of khanates existed as semi-independent statelets in the territory of what is now the Republic ofAzerbaijan. Russia began to extend its influence over the region in the early18th century. In 1828 the Treaty of Gulistan established the present borderwith Iran, placing the area of today’s independent Republic of Azerbaijanwithin imperial Russia but leaving most speakers of Azeri in Iran.
After the Bolshevik coup in 1917 the Transcaucasus was thrown into turmoil asnationalists and foreign powers attempted to seize control. The first Republic ofAzerbaijan was established in May 1918, thanks in part to advancing Turkishforces. After their withdrawal a British military occupation lasted fromNovember 1918 until August 1919, keeping the Bolsheviks out. The Red Armyconquered Azerbaijan in 1920, forcibly absorbing it into the Soviet Union. In1922 Azerbaijan was incorporated into the Transcaucasian Soviet FederatedRepublic (TSFR), which also included Armenia and Georgia. In 1936 the TSFRwas broken up and Azerbaijan gained the status of a full Soviet SocialistRepublic (SSR). Thousands of people, communist functionaries as well asintellectuals from the pre-Soviet period, were killed and many moreimprisoned during Stalinist purges in the 1930s.
During the Brezhnev era Azerbaijan was ruled by Heydar Aliyev, head of therepublic’s Communist Party and a former KGB officer. Azerbaijan becameknown for economic stagnation, political repression and rampant corruption.Mikhail Gorbachev, the reforming Soviet leader, sacked Mr Aliyev in 1987 aspart of a sweep against politicians who had presided over decades of stagnationand corruption. In the late 1980s Mr Gorbachev’s liberalising policies allowedseparatism to emerge. The ethnic Armenian majority in the autonomousdistrict of Nagorny Karabakh demanded that the territory be taken fromAzerbaijan and given to Armenia. Azerbaijani nationalism grew in response,
Communist rule lasted for70 years
Independence was brieflyattained in 1918
Iran and Russia controlledthe country

Azerbaijan 5
© The Economist Intelligence Unit Limited 2001 EIU Country Profile 2001
with the founding in mid-1989 of the Popular Front of Azerbaijan (PFA), abroad-based opposition movement. In September 1989, under pressure fromthe PFA, the Communist-dominated Azerbaijani Supreme Soviet (parliament)declared that republican laws took precedence over legislation from Moscowand called for the withdrawal of Azerbaijan from the Soviet Union. Divisionsbetween the Azerbaijanis and Armenians widened irrevocably with inter-communal violence in Nagorny Karabakh, but especially after anti-Armenianriots in Sumgait in 1988 and in Baku in January 1990 killed, on the mostconservative estimates, dozens of Armenians.
The deaths of Armenians in the riots in Baku prompted a dramatic and bloodySoviet military intervention on January 20th 1990. At least 150 people, mostlyethnic Azeris, were killed. Moscow installed a front man, Ayaz Mutalibov, asthe new leader of Azerbaijan. The parliamentary election in 1990 was flawed,but the PFA won a symbolically important 9% of the seats. The gradualcollapse of the Soviet Union weakened Mr Mutalibov. In 1991 he was forced toagree to a PFA demand for the creation of a new 50-member legislative body,the Milli Majlis (National Assembly), half of whose members were drawn fromthe Supreme Soviet and half from the PFA. Following the failed coup inMoscow in August 1991 Azerbaijan declared itself independent.
From 1992 onwards the war with Armenia over Nagorny Karabakh dominatedAzerbaijani politics, with success or failure on the battlefield determining thefate of political leaders. Mr Mutalibov was ousted in March 1992 afterArmenian forces killed Azerbaijani civilians in the village of Khojali. In May1992, after the Armenians captured the last Azerbaijani strongholds inKarabakh, the PFA seized government buildings in Baku. A leading PFAmember, Isa Gambar, became acting president. The PFA leader, AbulfazElchibey, won the presidential election held in June 1992. Mr Elchibey was apoor administrator, neglecting the economy and foreign investmentopportunities. Armenian troops took control of almost all of NagornyKarabakh and captured more and more territory in Azerbaijan proper.
In June 1993 a former commander in the Azerbaijani army in NagornyKarabakh, Surat Huseynov, led a revolt against the Elchibey government.Mr Huseynov’s troops were armed with heavy weapons that the Russians hadleft behind. Mr Elchibey turned for help to Mr Aliyev, the communist-eraleader of Azerbaijan. Mr Aliyev had restarted his political career by becomingthe president of Nakhichevan, an enclave of Azerbaijan separated from the restof the country by a strip of Armenian territory. Mr Aliyev came to Baku andwas duly elected chairman of parliament. In mid-June, with Mr Huseynov’stroops closing on Baku, Mr Elchibey fled to Nakhichevan. Mr Aliyev convincedparliament to transfer presidential powers to him on June 18th 1993, in effectremoving Mr Elchibey from the presidency, a move which was formalised in aflawed referendum. Mr Aliyev was elected president on October 3rd 1993 in anuncontested election, with 98.9% of the vote.
Although Mr Aliyev initially co-opted Mr Huseynov and appointed him primeminister, as time went on he increasingly limited Mr Huseynov’s powers. In
A nationalist governmenttakes power
Independence was regainedat a cost
A former communist leadertakes over
6 Azerbaijan
EIU Country Profile 2001 © The Economist Intelligence Unit Limited 2001
October 1994 Mr Huseynov was dismissed after being implicated in a failedcoup—an allegation that he denied. The threat posed by semi-independentmilitary commanders was finally crushed in March 1995, with the bloodydefeat of yet another coup attempt, led by a deputy minister of internal affairs,Rovshan Javadov, and backed by the special police forces. In a series of well-publicised trials, which continued until 1998, paramilitary leaders as well assenior former officials, including some from the PFA government, were triedfor involvement in various coup plots. These trials underlined Mr Aliyev’sability to impose order and to neutralise warlords.
The Nagorny Karabakh dispute
Nagorny Karabakh is a mountainous region within Azerbaijan. In the18th century both Armenian meliks (princes) and a Muslim khan ruled in theKarabakh region. After the Soviet takeover of the Transcaucasian region,Nagorny (“upland”) Karabakh was earmarked for inclusion in Soviet Armenia.Joseph Stalin, then commissioner for nationalities, reversed this decision andhanded Nagorny Karabakh to Azerbaijan. Although it was granted the status ofautonomous region in recognition of its majority Armenian community, itsinclusion within Azerbaijan rankled with Armenians and they repeatedly triedto overturn the decision, alleging discrimination by the authorities in Baku.When openly nationalist politics were allowed in the Soviet Union in the late1980s, Karabakh secessionism became central to Armenian nationalism inArmenia itself. In 1988 the Karabakh Committee forced the Supreme Soviet(parliament) of Armenia to demand the incorporation of the region into thatrepublic. Moscow responded by imposing direct rule over Nagorny Karabakhand sending in 5,000 troops. In 1989 Azerbaijan halted trade with Armeniaand blockaded Nagorny Karabakh. Armenia responded by declaring NagornyKarabakh part of a unified Armenian Soviet Socialist Republic.
Sporadic fighting among local militias, aided by troops from Armenia itself,escalated into a full-scale war after the withdrawal of Russian troops in 1992.The Nagorny Karabakh Armenians and the Armenian army inflicted a string ofdefeats on the Azerbaijani army, prompting political turmoil in Baku. TheArmenians took control of most of Karabakh and conquered all the territorybetween it and Armenia, as well as a sizeable buffer zone around the rest ofKarabakh amounting to one-fifth of Azerbaijan’s territory. In response,Azerbaijan, with support from Turkey, imposed a crippling economic embargoon Armenia. The social consequences of the war have been immense, withhundreds of thousands of refugees and internally displaced persons. Virtuallyall ethnic Azeris have left Armenia, Karabakh and the surrounding Armenian-held areas, and the Armenian community in the rest of Azerbaijan has fled.
The combatants saw the war as a way of righting historical wrongs perpetratednot just in Soviet times but also in previous centuries. For the Armenians,Karabakh embodies their sense of being a small Christian nation under threatfrom alien Muslim neighbours, a feeling that stems most immediately from thealleged genocide of Armenians in Ottoman Turkey during the first world war.Azerbaijanis feel that their country has suffered from Russia’s one-sidedsupport for the Armenians, and the war has increased Azerbaijan’s resolve tobreak free from Russian regional influence.
Azerbaijan 7
© The Economist Intelligence Unit Limited 2001 EIU Country Profile 2001
Despite the bitterness of the conflict, the ceasefire negotiated in 1994 has held.There has been little serious fighting, aside from a brief clash in June 1999. Thesuccess of the ceasefire is in part attributable to the realisation by Armenia thatfurther territorial gains would bring diminishing returns, and the Azerbaijaniforces know that they cannot afford to resume fighting. The Azerbaijanipresident, Heydar Aliyev, whose reputation is not tied to the conduct of thewar, has adopted a less confrontational stance than his late predecessor,Abulfaz Elchibey.
Little progress has been made in negotiating a settlement. The KarabakhArmenians declared themselves an independent state on September 2nd 1991,but not even Armenia has granted recognition. Azerbaijan refuses to talkdirectly to the Nagorny Karabakh leadership and so grant it legitimacy. Whenin late 1997 the then president of Armenia, Levon Ter-Petrosian, suggested thatthe Karabakh Armenians must compromise with Azerbaijan sooner rather thanlater, he was forced from office. His successor, Robert Kocharian, was previouslyleader of Nagorny Karabakh. However, Mr Kocharian is using these credentialsas a Karabakh nationalist leader to press for a negotiated solution, and heengineered the removal of hawkish officials in Nagorny Karabakh in 1999.Mr Kocharian and Mr Aliyev have held a series of meetings under the auspicesof the Organisation for Security and Co-operation in Europe (OSCE). Littleprogress was made at the talks and they were suspended in May 2000.
Azerbaijan says that it will grant Karabakh autonomy as long as its formalsovereignty over the territory is recognised. Karabakh’s Armenians want theirindependence to be recognised, and are prepared to give up only the lands thatthey have conquered outside Karabakh proper—and then only when a bindingpeace deal is on the table. Given the gulf between these two positions, acompromise is some way off.
Since 1995 Mr Aliyev has consolidated his power and established a more stablebut dictatorial government. A parliamentary election in November 1995 gaveMr Aliyev’s New Azerbaijan Party (NAP) 70 of the 125 seats in the Milli Majlis,most of the rest being won by pro-government “independents”. At the sametime a new constitution was approved in a flawed referendum. The electionalso demonstrated the weakness of the opposition, which has failed toovercome personal rivalries in order to form a cohesive anti-Aliyev front.
In 1998 leading opposition politicians boycotted the presidential election ofOctober 11th 1998. The opposition organised impressive pre-election rallies,but by failing to put up a joint candidate against Mr Aliyev it handed him aneasy victory. Only one plausible opposition candidate ran—Etibar Mammadov,head of the Azerbaijan National Independence Party (ANIP). Mr Mammadovcame second with just 11.6% of the vote, compared with Mr Aliyev’s 76.1%.
The official handling of the parliamentary election in November 2000, inwhich the NAP received a majority of the vote, revealed how nervous thegovernment is of popular discontent. Although government manipulation ofthe electoral process began months before polling day, officials appear to havepanicked in the final month. The result was the blatant stuffing of ballot boxes
Mr Aliyev emerges as astrong ruler
The 2000 parliamentaryelection was also flawed

8 Azerbaijan
EIU Country Profile 2001 © The Economist Intelligence Unit Limited 2001
and other election violations. The authorities resorted to such extreme levels ofelectoral fraud because initial preparations for a fraudulent poll wereabandoned. Until October 2000 the government tried to use dubious legal andadministrative methods, along with some physical intimidation, to excludemost opposition parties from the election. International observers wereunsparing in their criticism. The Office for Democratic Institutions andHuman Rights (ODIHR) denounced the election as a “crash course in thedifferent methodologies of manipulation” and said that its level oftransparency was “very low”. However, international observers agreed that thepolls represented an improvement compared with the previous election in1995, when almost no opposition candidates were allowed to stand. Thegovernment also manipulated the vote of the subsequent by-elections for seatswhere voting during November 2000 was annulled.
Important recent events
November 1995: A new constitution is adopted by referendum; the ruling party winsa majority in the parliamentary election.
November 1997: Oil starts flowing from the wells of the Azerbaijan InternationalOperating Company (AIOC).
October 1998: Heydar Aliyev wins re-election as president.
December 1999: Ilham Aliyev, the president’s son, becomes fifth deputy chairman ofthe ruling New Azerbaijan Party.
April 2000: Police break up an opposition demonstration calling for a free and fairparliamentary election in November 2000.
October 2000: The government reverses an attempt to exclude opposition partiesfrom parliamentary elections.
November 2000: The ruling NAP wins a flawed parliamentary election.
January 2001: Azerbaijan and Russia agree to demarcate their Caspian Sea boundary.
March 2001: Iran and Russia issue a statement criticising plans by Azerbaijan to build apipeline under the Caspian Sea from Kazakhstan. The Russian government then partlyrepudiates the statement following Azerbaijani and Kazakh protests.
July 2001: An Iranian gunboat forces two Azerbaijani survey ships to leave a disputedarea of the Caspian Sea.
Mr Aliyev has begun to secure his family’s political future by placing his son,Ilham Aliyev, in a senior post in the ruling NAP. Ilham Aliyev was elected fifthdeputy chairman of the NAP with responsibility for youth during the party’sfirst congress on December 22nd 1999. He then headed the NAP list for theproportional representation segment of the national vote on November 5th
Mr Aliyev would like hisson to succeed him

Azerbaijan 9
© The Economist Intelligence Unit Limited 2001 EIU Country Profile 2001
2000, guaranteeing his election. He is also first vice-president of the State OilCompany of the Azerbaijan Republic (SOCAR), the state owned oil company.
Milli Mejlis election, November 5th 2000
Constituency seats 99 NAP 63 Pro-government “independents” 21 PPFA 2 Musavat 1a
ANIP 1a
Seats where vote was cancelled 11
Proportional representation 25 NAP 16 PPFA 4 Civic Solidarity Party 3 Communist Party 2
Total 124
Note. One constituency seat, for Nagorny Karabakh, is kept vacant.a In both cases these opposition deputies left their parties after refusing to observe the oppositionboycott of parliament. The cancelled votes were won by government supporters in by-elections inJanuary 2001.
Proportional list election, Nov 5th 2000
Party Votes % of vote
New Azerbaijan Party 1,809,801 62.5
Party of the Popular Front of Azerbaijan (PPFA) 313,059 10.8
Civic Solidarity Party 182,777 6.3
Communist Party of Azerbaijan 182,029 6.3
Musavat Party 142,294 4.9
Azerbaijan National Independence Party (ANIP) 113,458 3.9
Liberal Party of Azerbaijan 38,038 1.3
Democratic Party of Azerbaijan 32,309 1.1
Alliance for Azerbaijan Party 27,848 1.0
National Congress Party 14,929 0.5
Democratic Azerbaijan Bloc 11,078 0.4
Democratic World Party of Azerbaijan 7,574 0.3
Total incl others 2,883,819 100.0
Source: Central Electoral Commission, Nov 14th 2000.
Constitution, institutions and administration
The new constitution of Azerbaijan was adopted in November 1995 by a flawedreferendum. Although it proclaims Azerbaijan a democratic republic, it has notprevented the president from assuming wide-ranging powers. Parliament is arubber-stamp body packed with government supporters. The constitutionproclaims the principle of the separation of powers, but all are in practicesubordinate to the president. The president is the head of state and is electedfor a term of five years. No person may be elected for more than two terms.
The presidency

10 Azerbaijan
EIU Country Profile 2001 © The Economist Intelligence Unit Limited 2001
Mr Aliyev has ensured that this provision does not apply to him, as he waselected president for the first time in October 1993, two years before the newconstitution was introduced. Mr Aliyev has considerable powers on paper andconsiderably more in practice. The president appoints the cabinet of ministers,which is answerable to him. In co-ordination with parliament, the presidentappoints the prime minister and the heads of local government. In reality, nodecision of consequence is taken without Mr Aliyev’s personal approval.
Azerbaijan’s parliament is a one-chamber body, the Milli Majlis. It is made upof 125 deputies elected every five years, of whom 100 are elected fromconstituencies on a first-past-the-post basis (one seat for Nagorny Karabakh iskept vacant) and the remaining 25 by proportional representation. On paperthe Milli Majlis can impeach the president following representations from theConstitutional Court and it can pass a vote of no confidence in thegovernment. In practice, the Milli Majlis plays little role in politics aside fromapproving Mr Aliyev’s decisions.
Judicial power is vested in the Constitutional Court, the Supreme Court, theEconomic Court, and lower-level general and specialised courts. As in mostpost-Soviet republics, the judiciary is the least developed branch ofgovernment. Judicial and police corruption is widespread and the use of tortureagainst suspects is routine.
Nakhichevan has kept its Soviet-era status of an autonomous republic withinAzerbaijan. The Nakhichevan Autonomous Republic has its own parliament,which decides local economic matters and appoints a local government.Nagorny Karabakh, formerly an autonomous region within Soviet Azerbaijan,is now a self-declared independent Armenian state, with its own government,parliament and army. It is internationally unrecognised.
Political forces
The most important political parties in Azerbaijan are listed below.
New Azerbaijan Party (NAP): Founded in 1992 by former communistsupporters of Mr Aliyev, the NAP opposed the then president, Abulfaz Elchibey.The NAP is led by a close-knit group of insiders from Nakhichevan, withMr Aliyev as chairman. Another powerful group within the NAP is the formercommunist elite. After Mr Aliyev seized power in 1993 the party grew rapidly,one of the means by which Mr Aliyev consolidated his grip on the country.NAP members hold all the key positions in the executive branch, and the NAPis the largest single party in parliament.
Party of the Popular Front of Azerbaijan (PPFA): Founded as thePopular Front of Azerbaijan (PFA) in 1989, it led the campaign for Azerbaijaniindependence and the economic blockade against Armenia. The PFA was broadbut factious—from disgruntled Communist Party functionaries to extremeAzerbaijani nationalists and pan-Turkists (favouring the union of all Turkicpeoples from Bulgaria to China). After the PFA seized power it began to
The judiciary
The legislature
Nakhichevan

Azerbaijan 11
© The Economist Intelligence Unit Limited 2001 EIU Country Profile 2001
disintegrate. As a result, Mr Elchibey was overthrown in 1993. In 1995 the PFArenamed itself the Party of the Popular Front of Azerbaijan (PPFA). Mr Elchibeydied in August 2000, causing the party to divide into so-called “reformist” and“classical” wings.
Musavat: Musavat is led by Isa Gambar, a former leader of the liberal wing ofthe PFA and speaker of parliament during Mr Elchibey’s presidency. Musavatproclaims itself successor to the Musavat Party founded in 1911by Mamedemin Rasulzadeh, one of the founders of the Azerbaijan DemocraticRepublic (1918-20).
Azerbaijan National Independence Party (ANIP): Founded in late 1991,ANIP is chaired by Etibar Mammadov, the former leader of the nationalist wingof the PFA. Since its foundation the ANIP has been at odds with the PPFA. InJune 1993 the party opposed Mr Elchibey and backed Mr Aliyev’s accession topower. Mr Mammadov declined Mr Aliyev’s offer of a government position.
Main political figures
Heydar Aliyev: Elected president of Azerbaijan in October 1993 and again inOctober 1998 in flawed elections, Mr Aliyev made his name as Azerbaijan’sKGB chief and ruled Soviet Azerbaijan as head of its Communist Party from1969 to 1987. Like Eduard Shevardnadze in Georgia, Mr Aliyev was one of anumber of non-Russians who played an important role both as tough leadersof their own republics and as top-level Soviet politicians during the long rule ofLeonid Brezhnev. Mr Aliyev was a member of the Soviet Communist Party’sPolitburo from 1982 to 1987. The new Soviet leader, Mikhail Gorbachev,sacked Mr Aliyev in 1987 because of his association with the Brezhnev era. As aresult he played no part in either Azerbaijan’s chaotic lurch towardsindependence or the outbreak of the war in Nagorny Karabakh.
Mr Aliyev’s style is one of all-pervasive personal authority. A personality culthas grown around him, and no other figure in government comes close tomatching his high profile. However, his administration has been tarnished bycronyism and corruption. Abroad, Mr Aliyev has built up US and Europeanpolitical support for Azerbaijani independence by sealing lucrative oil dealswith foreign firms. He has steered a careful diplomatic course between theconflicting interests of Russia and the US, and Turkey and Iran, something thathis predecessors were unable to do.
Rasul Guliyev: A former speaker of parliament who fell out of favour withMr Aliyev in 1996 and resigned, he originally built up his power base as directorof the largest state oil refinery. Mr Guliyev was prime minister underMr Elchibey. However, he backed Mr Aliyev and was elected speaker of parlia-ment. Since his resignation he has lived in exile, but has remained an importantpresence in Azerbaijani politics, in part because of the lack of any otherimposing figure on the opposition scene. The authorities are clearly worried byhim. He is wanted on charges of embezzlement and has been accused of othercrimes including a coup plot, for which there seems little evidence.
Isa Gambar: Speaker of the Azerbaijani parliament from May 1992 toJune 1993. One of the founders and leaders of the Popular Front of Azerbaijan

12 Azerbaijan
EIU Country Profile 2001 © The Economist Intelligence Unit Limited 2001
(PFA), he is now chairman of Musavat—the country’s oldest political party(established in 1911). With Mr Guliyev and Mr Elchibey, he boycotted the1998 election.
Etibar Mammadov: The former leader of the PFA’s nationalist wing, in 1991he left the PFA and set up the Azerbaijan National Independence Party (ANIP).Despite backing Mr Aliyev’s bid for power in 1993, he did not accept agovernment post. He was the only serious opposition figure to contest theOctober 1998 presidential election.
International relations and defence
Mr Aliyev seized power in 1993 at a time of crushing military defeats inflictedby Armenian forces. He steered Azerbaijan away from the influence of Turkey,which had provided covert military assistance against Armenia. In September1993 Azerbaijan joined the Commonwealth of Independent States (CIS). WithRussian support, Mr Aliyev negotiated a ceasefire with Armenia, realising thatcontinued fighting would have led to defeat and instability. His next step wasto sign a US$7bn oil deal with an international consortium headed by BP (UK)and Amoco (US)—the two companies have since merged into BP (UK). A stringof oil deals since then has given the EU and the US reason to bolsterAzerbaijan’s independence while turning a blind eye to human rightsviolations and corruption.
Azerbaijan’s relations with Russia have been uneasy. Mr Aliyev got off to agood start but relations soon turned sour, and in 1994 Russia imposed atransport blockade of Azerbaijan. The Russians were angered by Azerbaijan’sdecision to develop oil prospects without regard to the Caspian Sea’s legalstatus. Although probably not a deliberate policy initially, it soon developedinto a series of faits accomplis in which Azerbaijan was defying basic tenets ofinternational law in the Caspian Sea (which Russia has also done). To mollifyRussia, Azerbaijan agreed in October 1995 to transport some crude oil extractedby international companies via Russia (the Baku-Novorossisk pipeline).Mr Aliyev has refused to allow Russian troops to be based in Azerbaijan but hasallowed Russia to keep control of the Gabala early warning radar station.Continued Russian arms sales to Armenia and Russian bases there havestrained relations.
Nevertheless, unlike his predecessor, the current Russian president, VladimirPutin, has been willing to attempt a rapprochement of sorts with Azerbaijan.Mr Putin has tried to play a more even-handed role in mediation efforts overNagorny Karabakh and he has shown a willingness to seek an early settlementto the legal dispute over the Caspian Sea.
Mr Aliyev has tried to improve Azerbaijan’s relationship with Iran, which weremarred by the Elchibey government’s pro-Turkish stance. As part of his oildiplomacy Mr Aliyev promised to give Iran a share in the AzerbaijanInternational Operating Company (AIOC) contract. US pressure stoppedMr Aliyev from fulfilling this promise and so he attempted to buy Iran off by
Tensions with Iran areincreasing
Relations with Russia areimproving
Mr Aliyev determinesforeign policy

Azerbaijan 13
© The Economist Intelligence Unit Limited 2001 EIU Country Profile 2001
including it in the Shah Deniz oil consortium in 1996, which does not includeany US companies. Iran and Azerbaijan share a common cultural and religiousheritage, but their relationship in both Soviet and post-Soviet times has beentroubled. Most Azerbaijanis are Shia Muslims, the majority strand of Islam inIran, and around 20m of Iran’s 63m inhabitants speak Azeri.
The Azerbaijani government accuses Iran of wide-scale espionage and offomenting Islamist activism among Azerbaijan’s Shia Muslims. The Iraniangovernment clamps down on separatist activity in its own north-westernregion, where ethnic Azeris predominate. Iran is angered by Azerbaijan’s econ-omic and security ties with the US, Turkey and Israel, as well as its behaviour inthe Caspian Sea, where it has proceeded on the basis of faits accomplis. In July2001 the Iranian government made its displeasure known by sending agunboat backed by the Iranian air force to threaten two Azerbaijani shipssurveying for BP (UK) in the Caspian Sea. Although both countries tried to playdown the incident, there was a considerable growth in tension as a result.
In the case of Turkey, a close linguistic bond has helped to build bridges.Turkey imposed an economic embargo on Armenia in support of Azerbaijanbecause of the Karabakh war. The Turkish military on occasion built up forceson the border with Armenia to dissuade the Armenian army from marching onBaku. In 1994 Azerbaijan and Turkey signed a ten-year treaty of friendship andco-operation, and in 1996 a treaty of military co-operation. In July 2001,following the incident in the Caspian Sea in which an Iranian gunboatthreatened Azerbaijani surface ships, Turkey sent jet trainer aircraft from an airdisplay team and its chief of staff to visit Baku.
The Caspian Sea Dispute
The dispute over the Caspian Sea peaked in July 2001 when the Iranianmilitary forcibly prevented an Azerbaijani ship from surveying the sea. Theincident was the culmination of tensions over the legal status of the sea, whichcame into the open in 1993 when Russia objected to Azerbaijan’s plans todevelop oilfields in the centre of the sea. The Russian and Iranian position isthat until a new legal convention is agreed, the Soviet-Iranian treaties of 1921and 1940 remain valid. These treaties place the Caspian Sea under thecommon ownership of the littoral states (Azerbaijan, Iran, Kazakhstan, Russiaand Turkmenistan) and do not divide the sea up into national sectors.However, in practice the Soviet Union did not observe the treaties and dividedthe Caspian Sea up into economic zones for exploitation by the then Sovietrepublics. The Azerbaijani position is that it is not bound by the 1921 and 1940treaties as it was not then an independent state. Azerbaijan is developing fieldsin the centre of the sea on the basis of the economic zones. Azerbaijan wantsthe seabed and the surface to be divided into national sectors, the practiceobserved in other shared lakes around the world (although called a sea, theCaspian is an inland body of water). Turkmenistan’s position is unclear, but ithas challenged Azerbaijani ownership of fields in the centre of the sea.Turkmen-Azerbaijani talks to resolve the dispute have failed. Kazakhstan’sstance has been moderate, favouring negotiations and restricting explorationto areas of the sea that would inevitably be under its control.
Turkish-Azerbaijanirelations are strong
14 Azerbaijan
EIU Country Profile 2001 © The Economist Intelligence Unit Limited 2001
The five littoral states began talks in 1995 on a new legal convention. Thesetalks have since stalled, although Russia has consistently been scaling back itsdemands. In 1997 Russia suggested a compromise deal under whichAzerbaijan’s control over fields in the centre of the sea would have beenrecognised. Then in July 1998 Russia and Kazakhstan signed an agreement onthe north Caspian that divides up the north Caspian seabed for the purposes ofoil and gas exploration and exploitation, but which keeps the waters in jointownership and allows for freedom of navigation. The Russian governmenttakes the view that this provision gives Russia a veto over proposed pipelinesunder the sea. Russia and Iran jointly protested at a plan to build a gas pipelinefrom Turkmenistan to Azerbaijan in 1999. A further protest in 2001 by Russiaand Iran was rebuffed by Kazakhstan and Azerbaijan, with Russian officialsbeating a hasty retreat.
Although Kazakhstan and Azerbaijan would accept a deal under which the seawould be divided into national sectors, Iran is against this. Iran is taking anextremely hard line, arguing that if the 1921 and 1940 treaties are to beabandoned then the sea has to be divided up into five equal shares of 20%each—Iranian officials know that the geography of the Caspian would meanthat their national sector would cover just 12% of the sea. Ironically, givenIran’s aggressive behaviour, exploration by foreign companies based inAzerbaijan has so far failed to discover significant amounts of oil in theAzerbaijani-claimed sector.
Relations with the US and the EU have developed rapidly because of their oilfirms’ substantial involvement in Azerbaijan. However, US domestic politicshave interfered in the relationship. In 1992 the US Congress, under pressurefrom Armenian American groups, designated Azerbaijan the aggressor in theKarabakh war and demanded the suspension of most forms of US aid untilthere was an end to the economic blockade of Armenia (Section 907 of theFreedom Support Act). The ban has been softened as a result of counter-lobbying by Azerbaijan and oil companies.
In April 1996 Azerbaijan signed a Partnership and Co-operation Agreement(PCA) with the EU; the agreement came into force in 1999. The PCA issupposedly contingent on Azerbaijan’s respecting democracy and humanrights, and having a current-account convertible currency. Azerbaijan fails onall three grounds. The UK has developed a strong diplomatic position inAzerbaijan because of the importance of BP in the Azerbaijan InternationalOperating Company (AIOC).
The Azerbaijani military is weak, poorly led and badly equipped. Defencespending is relatively high at 2.7% of GDP (annual average 1995-99), comparedto overall annual spending of 21.9% of GDP (annual average 1995-99). TheInternational Institute for Strategic Studies (IISS) in London puts the totalactive strength of the Azerbaijani forces at 72,100, of whom 61,800 are in thearmy. There is a separate force of 15,000 militia and border guards controlledby the interior ministry.
Oil forges strong links withthe US and the EU
Defence

Azerbaijan 15
© The Economist Intelligence Unit Limited 2001 EIU Country Profile 2001
Heavy weapons tend to be kept separate from units to prevent their use inpossible coups. As of January 2001 the armed forces had 220 tanks, 346 otherarmoured vehicles and 303 artillery pieces. The Nagorny Karabakh Armenianforces are much better armed than the entire Azerbaijani army, with 311 tanksin total, 324 armoured fighting vehicles and 322 artillery pieces. TheAzerbaijani air force has 49 fixed-wing combat aircraft, half of which areobsolete, and another 33 are in store. The air force has 15 attack helicopters.Flying hours are limited and serviceability poor. The navy has nine surfacecombatants in the Caspian.
Security risk
Armed conflict
The stance of Azerbaijan and Armenia over the status of Nagorny Karabakh hashardened since talks stalled in May, and both countries now appear to behostile to a compromise deal. There has been talk of a military solution inofficial circles and in the defence ministry in Azerbaijan. Previously, theseannouncements had been made only by the weak and disenfranchisedopposition parties. However, it is unlikely that the current impasse will resultin military conflict, since Azerbaijan will be unwilling to risk pitting its weakand poorly equipped army against Armenia’s, which has benefited fromRussian support. Furthermore, open conflict would result in oil companiesretreating from Azerbaijan.
Tensions with both Turkmenistan and Iran have increased in recent monthsover disputed Caspian oil fields. Relations with Iran have been particularlystrained since Iran chased BP exploration vessels, working with Azerbaijanipermission, out of disputed waters. Nevertheless, it is doubtful that Iran willuse military force against Azerbaijan, although it may occasionally makethreats to demonstrate that its stance should be seriously considered.
Civil unrest
State institutions are likely to be weakened by increasing populardisenchantment with the government. However, deep apathy, characterised byelection turnouts as low as 25% in some areas, will probably prevent seriouspolitical and social unrest in the short term. Although demonstrationssometimes take place in protest against specific issues—such as cut-offs in theenergy supply, for example—protest actions are localised and short-lived.Nevertheless, the authorities will feel impelled to address the serious energyshortages and inadequate education and health provision experienced by largesections of the population, particularly outside Baku, especially as oil and gasexport revenue continues to rise sharply.
One risk to stability is the absence of a secure succession to the president,Heydar Aliyev, whose term expires in 2003. If Mr Aliyev remains in goodhealth he may even remain in power into a third term. One alternativescenario in 2003 is that Mr Aliyev will pass the presidency on to his son, IlhamAliyev. However, concern that Ilham may not receive adequate support fromthe elite or opposition camps could point towards a period of instability

16 Azerbaijan
EIU Country Profile 2001 © The Economist Intelligence Unit Limited 2001
immediately following Mr Aliyev’s departure, although this is unlikely to resultin civil unrest given the weakness of the opposition parties.
Crime
Although there are no reliable statistics on petty crime, the experience of foreignvisitors has shown that robberies are relatively common, especially on road andrail transport. Foreigners travelling alone are particularly at risk, since theyrepresent a wealthy and relatively easy target for robbers and criminal groups.
Organised crime
The president’s tight control over the security services and the main lucrativeindustries in Azerbaijan limits to some extent the ability of Azerbaijaniorganised criminal groups to penetrate the official economy.
Resources and infrastructure
Population
The population was about 8m in 2000. The population growth rate has slowedsteadily. Average annual growth rates were 3% between 1959 and 1970, 1.8%in 1970-79 and then 1.5% in 1979-89. Between 1989 and 1999 the growth rateslowed to just 1.3%. Together with some net emigration, the declining growthrate in the 1990s is attributable to a fall in the birth rate from 26.3 per 1,000 ofthe population in 1990 to 14.6 per 1,000 in 2000. (Reference tables 1 and 2provide population statistics.)
As in other southern former Soviet republics, there has been a slight reversal ofurbanisation. Ethnic minorities, who mostly lived in the towns and cities, haveemigrated. In 2000, 51% of the population was urban, compared with 53.9%in 1989. Population growth has been higher in rural areas, where half of allethnic Azeris still live. Most of the 32.8% of the population under the age of 15in 1999 live in the countryside. (The distribution of the labour force is shownin Reference table 3.)
Population trends(year-end)
1990 2000
Population (‘000) 7,219.0 8,081.0
Life expectancy at birth (av; years) 71.1 71.8 Male 67.0 68.6 Female 74.8 75.1
Source: UNDP.
According to the 1989 census—the most recent survey of ethnic origin—Azerisconstituted 82.7% of the population, Russians and Armenians 6%, andLezghins, a Muslim Caucasian people who also live in Russian Dagestan, 2.4%.Other minorities include Ukrainians, Georgians, Tatars, Jews, Talysh and Kurds.Since the census almost the entire Armenian population outside Nagorny
Ethnicity
Demographic trends

Azerbaijan 17
© The Economist Intelligence Unit Limited 2001 EIU Country Profile 2001
Karabakh has left as a result of the war, and the republic has received an influxof 192,000 Azeris from Armenia.
More than 80% of the population is Muslim: this includes the Azeris, manyGeorgians and other groups such as Lezghins and Kurds. Most Azerbaijanis areShia Muslims, but around 30% are Sunni Muslims. Azeri is a Turkic languageclosely related to Turkish and more distantly to the Turkic languages of CentralAsia. The Arabic script was used until the 1920s but it was subsequentlyreplaced by the Latin alphabet in 1929. However, ten years later the Cyrillicscript was made compulsory. A modified Latin alphabet derived from Turkishwas introduced in early 1992 and has been compulsory since 2001. Followingindependence the government began to phase out the use of Russian, but it isstill widely spoken.
Education
The education system is a product of the Soviet era: some pockets of excellenceexist alongside areas of very low standards. The Nagorny Karabakh war and theexodus of many highly educated professionals have put further stress on thesystem. The law on education of 1992 permits both state and privateeducational institutions, but the latter are still undeveloped. Training forindustry, transport and agriculture is conducted in a network of vocationalschools. In 1999, 81% of education spending was on wages, compared to 66%in 1997, which indicates that capital expenditure is being neglected.
Although on paper education levels in Azerbaijan look comparable with thoseof more developed countries and are better than those in Turkey or Iran,standards are low and falling. More than 90% of the population over the age of15 has received at least the stipulated eight years of schooling. However, theproportion of graduates in the population fell by nearly two-thirds between1990 and 1999, to just 12 per 10,000 people.
Health
Azerbaijan inherited a universal public health system with extensive medicalinfrastructure. The quality of service has been poor owing to inefficiencies,such as the Soviet emphasis on expensive in-patient care over out-patient andprimary healthcare, with some 60% of spending concentrated on hospitals.The ratio of physicians to population was just 3.9 per 1,000 in 1999.Preventive care and early treatment are neglected. The financing of publichealth has always been insufficient and has deteriorated since independence.In the immediate aftermath of independence the death rate from a range ofillnesses soared because of economic collapse. These death rates have sincefallen back considerably.
In 1995 the health ministry initiated proposals for healthcare reform. Theseincluded raising the number of medical institutions that are self-financing andreducing the share of wages of healthcare workers that is financed by thebudget. Free medical services for the poor were preserved and 75% of the

18 Azerbaijan
EIU Country Profile 2001 © The Economist Intelligence Unit Limited 2001
population does not pay for its healthcare. The ratio of healthcare spending toGDP fell from 1.4% in 1995 to 1.1% in 2000. The government tends to cutback on budgeted healthcare spending as a way of keeping the deficit in check,under-spending significantly the money allocated to healthcare in recent years.In addition, spending is mostly on wages (53% of healthcare spending in1999), utilities (13% of healthcare spending in 1999) and medicines (10% ofhealthcare spending in 1999), with very little left for capital expenditure.
Natural resources and the environment
Azerbaijan is the largest of the three Transcaucasian countries. Some 50% ofthe total land area is agricultural land and 2.5% is urban. Forests cover 13% ofthe country. Azerbaijan is ecologically diverse, including plains below sea level,4,000-metre mountains in the Caucasus range, deserts and subtropical zones.Lowlands occupy more than half of the territory. Azerbaijan’s rivers all run intothe Caspian basin. The irrigation system is regulated by water reservoirs, thelargest being the Mingechaur reservoir on the Kura River.
Azerbaijan has the worst pollution in Transcaucasia. It has adequate fresh waterreserves but surface water is polluted. Despite the decline in industrialproduction, atmospheric pollution levels remain high. Land productivity isalso undermined by soil salination, owing to many years of poor drainage andirrigation. A rise in the level of the Caspian Sea (of about 25 cm per year) isanother ecological concern. The productivity of the Caspian as a fishing area,famous as it is for its sturgeon, is under threat. Attempts to save the sturgeon’senvironment have yet to advance beyond rhetoric.
Transport, communications and the Internet
Azerbaijan is landlocked. Of its three routes to the high seas the shortest isthrough Georgia to the Black Sea, the second shortest through Russia to theBlack Sea. The longest route is south through Iran to the Persian Gulf. TheRussian and Georgian routes have been periodically disrupted by politicalinstability. Road and rail links with Russia were disrupted by a Russian blockadeand the Chechen war until 1996 and then again during the latest war inChechnya in 1999. Azerbaijan’s economic blockade of Armenia has cut theshortest route to Turkey. Travel between Azerbaijan and the detached enclaveof Nakhichevan is by air or by road through Iran. Nakhichevan has astrategically important 33-km border with Turkey. There are 2,090 km ofrailways, the main source of freight transport. Much of the rail track androlling stock needs repair or replacement.
The 36,700 km of road are poorly maintained. The number of passenger carshas remained steady since independence and was 35.6 per 1,000 inhabitants in1998. The number of trucks, however, fell by 19.7% between 1990 and 1998, inpart a result of the massive decline in the volume of external trade. The EU issponsoring an ambitious but as yet ill-defined project to provide east-westtransit routes, the Transport Corridor Europe-Caucasus-Asia (TRACECA).
Roads and railways

Azerbaijan 19
© The Economist Intelligence Unit Limited 2001 EIU Country Profile 2001
Azerbaijan has direct maritime connections to other Caspian littoral states butcan reach the high seas only through the Volga-Don canal, a Russian waterway.Baku port is the largest port on the Caspian Sea, but is in need of repair. Thereare flights to other former Soviet republics, as well as to Germany, theNetherlands, Switzerland, Israel, Iran, Turkey, the UK and the United ArabEmirates. During 2000 a number of foreign airlines curtailed their services toBaku, reporting that they were being “overcharged” by the airport.
Telecommunications infrastructure is poorly developed. In 1998 Azerbaijanhad 88.7 telephone main lines per 1,000 inhabitants, compared with anaverage of 528.6 per 1,000 inhabitants in the EU. The waiting list for new linesis long. Mobile telephone use has grown rapidly from zero in 1993 to 8 per1,000 inhabitants in 1998, but it remains costly. Azerbaijan uses the globalsystem for mobile communications (GSM) telephone system. Azercell, themobile telephone company, is the largest private-sector taxpayer in thecountry, accounting for 1.4% of government revenue (0.2% of GDP) in 1999.The government envisages widespread privatisation of the sector, with the stateretaining only a 51% stake in strategic areas, but this has yet to take place.
The number of television sets is estimated at around 254 per 1,000 inhabitants.Growing numbers can receive Turkish TV. The local media are mainly pro-government. Independent and opposition channels and publications arefrequently harassed, with two closed in 2000-01. Given the high cost oftelephone connection charges, home Internet usage is likely to remain low,and furthermore Internet penetration is also undoubtedly sparse, concentratedin the few urban centres, where the majority of Azerbaijan’s skilled and bettereducated population is concentrated.
Energy provision
The production and refining of oil and gas forms the bedrock of the economy.According to the BP Statistical Review of World Energy Azerbaijan had6.9bn barrels of oil reserves at the end of 2000, 0.7% of world reserves and areserves/production ratio of 63.4. Gas reserves were 850bn cu metres, 0.6% ofworld reserves in 2000. The State Oil Company of the Azerbaijan Republic(SOCAR) is more optimistic and puts proven reserves at 17.5bn barrels, whichprobably includes reserves that are either not viable or not fully proven. In anycase, Azerbaijan’s oil reserves are small in comparison with those of the MiddleEast, where proven reserves are put at 683.6bn barrels, or 65.3% of worldreserves. The country is a growing net oil exporter.
Azerbaijan is self-sufficient in electricity and has generating capacity of18.9bn kwh (1998 figure), of which 18% is from hydroelectric power stations.Generating technology is obsolete and in need of replacement. Electricityproduction was 18.6bn kwh in 2000. In 1990, the year before independence,Azerbaijan produced 23bn kwh of electricity. Although industrial consumptionhas fallen sharply, Azerbaijan remains highly energy-inefficient. Charges forhousehold consumption of electricity are still subsidised, and non-payment bydomestic and industrial consumers is a persistent problem. Energy supplies to
Electricity
Oil and gas
Telecommunications andthe media
International links
20 Azerbaijan
EIU Country Profile 2001 © The Economist Intelligence Unit Limited 2001
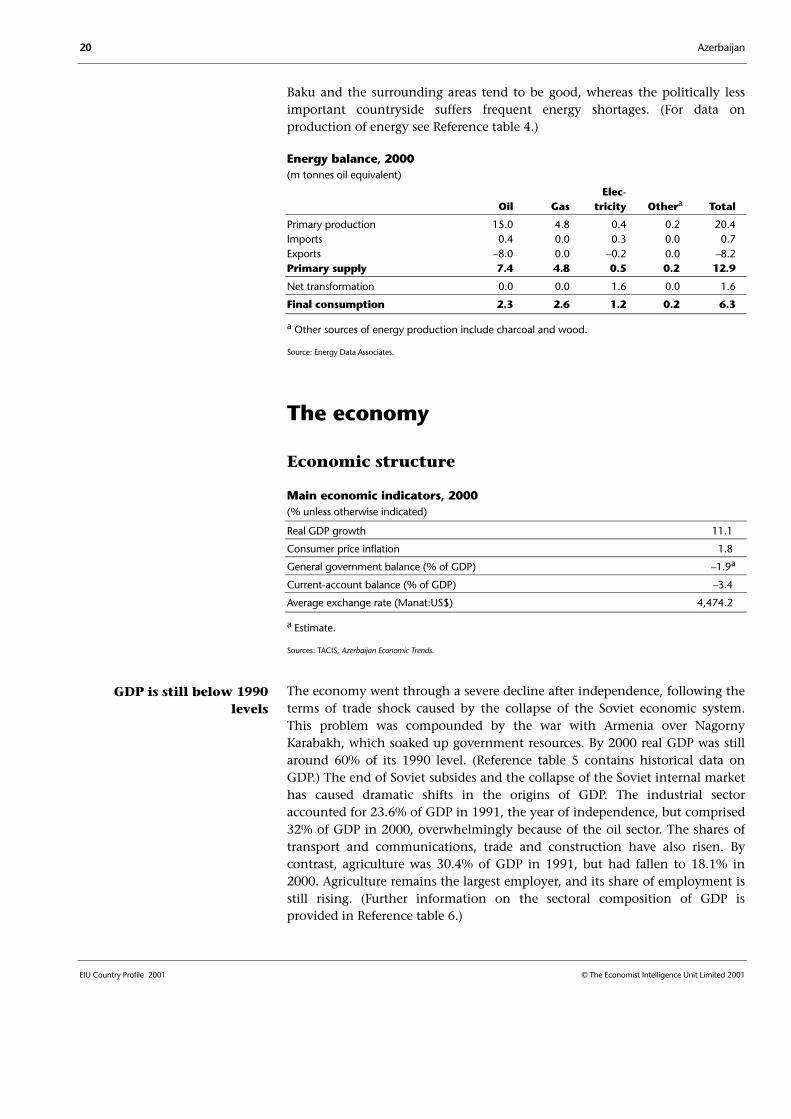
Baku and the surrounding areas tend to be good, whereas the politically lessimportant countryside suffers frequent energy shortages. (For data onproduction of energy see Reference table 4.)
Energy balance, 2000(m tonnes oil equivalent)
Elec-Oil Gas tricity Othera Total
Primary production 15.0 4.8 0.4 0.2 20.4Imports 0.4 0.0 0.3 0.0 0.7Exports –8.0 0.0 –0.2 0.0 –8.2Primary supply 7.4 4.8 0.5 0.2 12.9
Net transformation 0.0 0.0 1.6 0.0 1.6
Final consumption 2.3 2.6 1.2 0.2 6.3
a Other sources of energy production include charcoal and wood.
Source: Energy Data Associates.
The economy
Economic structure
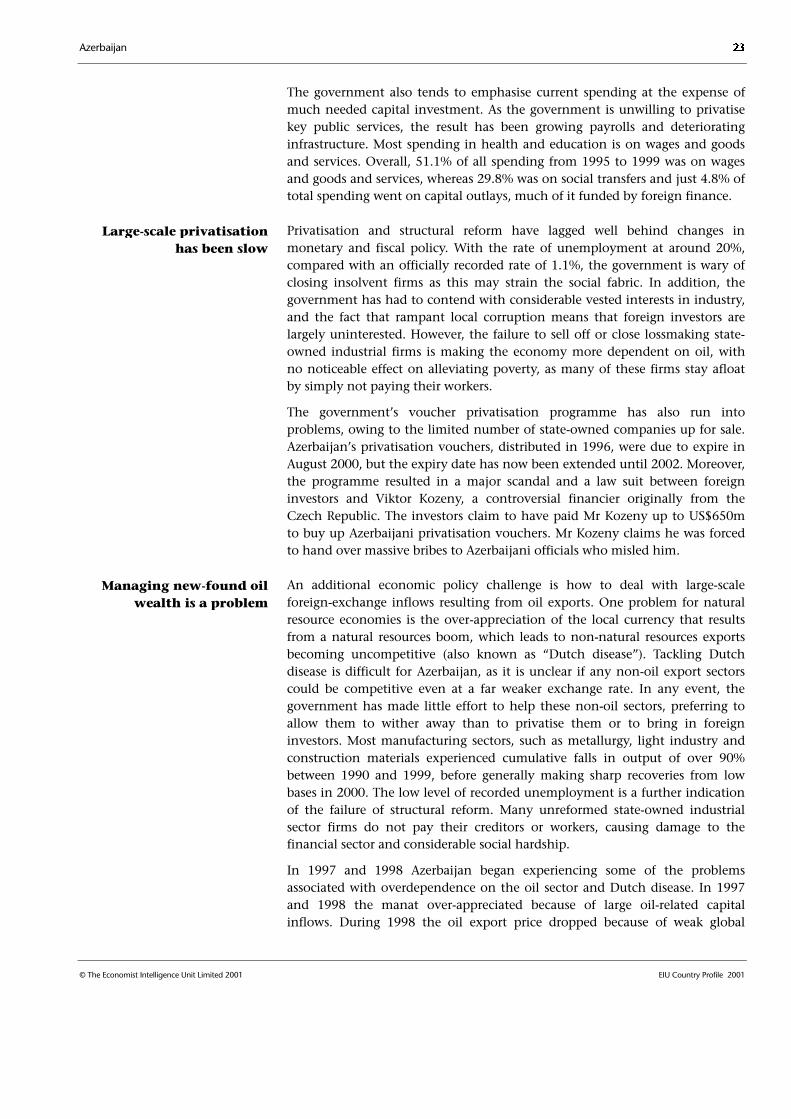
Main economic indicators, 2000(% unless otherwise indicated)
Real GDP growth 11.1
Consumer price inflation 1.8
General government balance (% of GDP) –1.9a
Current-account balance (% of GDP) –3.4
Average exchange rate (Manat:US$) 4,474.2
a Estimate.
Sources: TACIS, Azerbaijan Economic Trends.
The economy went through a severe decline after independence, following theterms of trade shock caused by the collapse of the Soviet economic system.This problem was compounded by the war with Armenia over NagornyKarabakh, which soaked up government resources. By 2000 real GDP was stillaround 60% of its 1990 level. (Reference table 5 contains historical data onGDP.) The end of Soviet subsides and the collapse of the Soviet internal markethas caused dramatic shifts in the origins of GDP. The industrial sectoraccounted for 23.6% of GDP in 1991, the year of independence, but comprised32% of GDP in 2000, overwhelmingly because of the oil sector. The shares oftransport and communications, trade and construction have also risen. Bycontrast, agriculture was 30.4% of GDP in 1991, but had fallen to 18.1% in2000. Agriculture remains the largest employer, and its share of employment isstill rising. (Further information on the sectoral composition of GDP isprovided in Reference table 6.)
GDP is still below 1990levels

Azerbaijan 21
© The Economist Intelligence Unit Limited 2001 EIU Country Profile 2001
Azerbaijan is developing into a dual economy, an investment intensivecompetitive oil economy and a slower moving non-oil economy dependent onstate assistance. Large-scale foreign investment has mostly been in the oilsector, as well as related activities such as construction and communications.Real GDP growth has exceeded 4% annually from 1997. However, growth inthe oil sector has been three to five times the rate of growth in the non-oileconomy. By 2000 oil accounted for 27.3% of total value added, comparedwith 6% for the non-oil industrial sector. In 1995 the non-oil industrial sectorhad generated 16.4% of value added compared with 13.2% for the oil sector.
The structure of GDP by expenditure shows that household consumption grewafter 1991 but then started to fall steadily from 1998. Governmentconsumption experienced a steep drop after 1991 before levelling off from1997. The share of fixed investment more than doubled from 1995 to 1998 (to36.7% in 1998), before dropping back to 19% in 2000, still a high level byformer Soviet standards. Most fixed investment has come in the form offoreign direct investment (FDI) into the oil sector. (Reference table 7 providesfuller information on GDP by expenditure.)
Comparative economic indicators, 2000
Azerbaijan Armenia Georgia Russia Turkey
GDP (US$ bn) 4.9 1.9 4.8 251.1 203.8
GDP per head (US$) 609 503 878 1,729 3,025
Consumer price inflation (av; %) 1.8 –0.7 4.1 20.8 54.9
Current-account balance (US$ bn) –0.2 –0.3 –0.3 46.3 –9.8
% of GDP –3.4 –14.5 –5.6 18.4 –4.8
Exports of goods fob (US$ bn) 1.9 0.3 0.5 105.6 31.7
Imports of goods fob (US$ bn) 1.5 0.8 1.0 44.9 54.0
External debt (US$ bn) 1.2 0.8 1.7 163.0 116.1
Source: EIU, CountryData.
Economic policy
Azerbaijan faced problems common to most former Soviet republics followingindependence in 1991: a huge terms of trade shock, the end of Soviet subsidiesand the need to reverse decades of failed communist policies that had created ahighly distorted economy. Although the government has made good progresson stabilisation, it has failed to deal with key structural issues facing theeconomy, such as how to manage its likely oil windfall, privatisation, thecreation of a more efficient state sector and economic restructuring. Politicalinstability and the war with Armenia also delayed a serious economic policyresponse until 1995.
A successful stabilisation programme was introduced in 1995, building on theintroduction in 1993 of a new currency, the manat, in place of the rouble.Monetary policy has successfully been aimed at price stability. Most prices havenow been liberalised, although utilities are often not charged for. As a result,inflation has fallen considerably. The government has also liberalised keyprices, such as of money (interest rates) and of foreign exchange (the exchange
Stabilisation began in 1995
Oil is the main contributorto growth

22 Azerbaijan
EIU Country Profile 2001 © The Economist Intelligence Unit Limited 2001
rate). The manat has a managed float regime. Although the policy of theAzerbaijan National Bank (ANB, the central bank) is to prevent over-appreciation of the manat owing to oil-related inflows, there is no pre-announced exchange-rate target (see Reference table 8 for historical prices andearnings data).
Fiscal policy has, like monetary policy, been geared towards stabilisation. Thefiscal deficit ballooned to 15.3% of GDP in 1993 owing to increased spending inthe wake of the Nagorny Karabakh war. However, by 2000 the deficit was downto just 1% of GDP, according to official figures, which differ from those of theIMF. The discrepancy is attributable to the fact that government figures excludeprojects financed with foreign loans, thereby depressing the level of reportedspending. Despite the reduction in the size of the deficit, the government’sfiscal position remains fragile and dependent on the oil sector. The governmentis finding it difficult to collect more than 20% of GDP in tax revenue. A new taxcode, implemented in 2001, has led to problems with tax collection, andattempts to broaden the revenue base have only succeeded with regard tocustoms duties. Widespread corruption complicates revenue collection.
The energy sector accounts for about one-third of total fiscal revenue (about7% of GDP). A major source of oil revenue is the State Oil Company of theAzerbaijan Republic (SOCAR), which tends to be heavily taxed. Upstreamexploration and production companies, mostly foreign-owned, tend to pay lesstax because of investment incentives in their contracts. SOCAR’s taxpayments—mostly corporate profit tax, royalties, value-added tax (VAT) andwage taxes—equalled 5.1% of GDP per year from 1996 to 1999. However, asthe IMF has pointed out, although SOCAR is the largest tax payer, it also hasthe largest tax payment arrears because of its uncollectable receivables fromAzerenerzhi, the monopoly electricity supplier. In turn, Azerenerzhi is rarelypaid by its customers for their electricity supplies. There are similar problemswith Azerigaz, the domestic gas supply company. This has lead to considerableenergy-related debt in the economy. By the end of January 2001 SOCAR hadreceivables of Manat6,900bn (US$1.5bn; 28.7% of 2001 GDP), Azerenerzhi hadManat5,417bn (22.5% of 2001 forecast GDP) of receivables and AzerigazManat1,445.6bn (6% of 2001 forecast GDP). There are no recent figures on thetotal level of inter-enterprise arrears in all sectors, but these probably exceedthe total value of GDP.
There are similar structural reform problems on the expenditure side. Owing toits inability to collect all targeted revenue, the government frequently runs upspending arrears to save money, in particular in the education sector. Inaddition, the government is trying to create employment by expanding thestate sector payroll. Some measures have proved counter-productive. Agovernment attempt in 1997 to cut pension payments to pensioners stillworking, and a decision to increase the retirement age every two years by ayear, has actually led to larger, not smaller, pensions outlays since many peopledecided to take early retirement and claim their full pension. By 1999,according to the IMF, pensions cost the government 4.3% of GDP, up from2.8% of GDP in 1997.
The fiscal position remainsfragile
Expenditure is often cut tomeet budget targets
Budget revenue is heavilydependent on oil
Azerbaijan 23
© The Economist Intelligence Unit Limited 2001 EIU Country Profile 2001
The government also tends to emphasise current spending at the expense ofmuch needed capital investment. As the government is unwilling to privatisekey public services, the result has been growing payrolls and deterioratinginfrastructure. Most spending in health and education is on wages and goodsand services. Overall, 51.1% of all spending from 1995 to 1999 was on wagesand goods and services, whereas 29.8% was on social transfers and just 4.8% oftotal spending went on capital outlays, much of it funded by foreign finance.
Privatisation and structural reform have lagged well behind changes inmonetary and fiscal policy. With the rate of unemployment at around 20%,compared with an officially recorded rate of 1.1%, the government is wary ofclosing insolvent firms as this may strain the social fabric. In addition, thegovernment has had to contend with considerable vested interests in industry,and the fact that rampant local corruption means that foreign investors arelargely uninterested. However, the failure to sell off or close lossmaking state-owned industrial firms is making the economy more dependent on oil, withno noticeable effect on alleviating poverty, as many of these firms stay afloatby simply not paying their workers.
The government’s voucher privatisation programme has also run intoproblems, owing to the limited number of state-owned companies up for sale.Azerbaijan’s privatisation vouchers, distributed in 1996, were due to expire inAugust 2000, but the expiry date has now been extended until 2002. Moreover,the programme resulted in a major scandal and a law suit between foreigninvestors and Viktor Kozeny, a controversial financier originally from theCzech Republic. The investors claim to have paid Mr Kozeny up to US$650mto buy up Azerbaijani privatisation vouchers. Mr Kozeny claims he was forcedto hand over massive bribes to Azerbaijani officials who misled him.
An additional economic policy challenge is how to deal with large-scaleforeign-exchange inflows resulting from oil exports. One problem for naturalresource economies is the over-appreciation of the local currency that resultsfrom a natural resources boom, which leads to non-natural resources exportsbecoming uncompetitive (also known as “Dutch disease”). Tackling Dutchdisease is difficult for Azerbaijan, as it is unclear if any non-oil export sectorscould be competitive even at a far weaker exchange rate. In any event, thegovernment has made little effort to help these non-oil sectors, preferring toallow them to wither away than to privatise them or to bring in foreigninvestors. Most manufacturing sectors, such as metallurgy, light industry andconstruction materials experienced cumulative falls in output of over 90%between 1990 and 1999, before generally making sharp recoveries from lowbases in 2000. The low level of recorded unemployment is a further indicationof the failure of structural reform. Many unreformed state-owned industrialsector firms do not pay their creditors or workers, causing damage to thefinancial sector and considerable social hardship.
In 1997 and 1998 Azerbaijan began experiencing some of the problemsassociated with overdependence on the oil sector and Dutch disease. In 1997and 1998 the manat over-appreciated because of large oil-related capitalinflows. During 1998 the oil export price dropped because of weak global
Managing new-found oilwealth is a problem
Large-scale privatisationhas been slow
24 Azerbaijan
EIU Country Profile 2001 © The Economist Intelligence Unit Limited 2001
demand following the Asian financial crisis. The drop in world raw materialsand commodity prices in 1998 and 1999 helped to slow annual averageinflation to –0.8% and –8.6%, respectively, but until the second quarter of 1999it also slashed export earnings. The result was a liquidity crunch as the moneysupply shrank. The devaluation of the Russian rouble in August 1998 also putthe manat under pressure. The consolidated fiscal deficit rose to 4.2% of GDPin 1998, and the manat stopped its strong nominal appreciation.
The State Oil Fund of the Azerbaijan Republic
The State Oil Fund of the Azerbaijan Republic (SOFAR), was formed in 2000 toaccumulate the small but growing oil windfall. Revenue is expected to peak in2008-15, when production from the Azeri, Chirag and Guneshli oilfields of theAzerbaijan International Operating Company (AIOC) will be at its highest. Thefund had accumulated US$460m in oil windfall money by October 2001.
Details on the workings of the fund, beyond the fact that it is a legal,independent organisation and strictly off-budget, remain scant. Assetsaccumulated in overseas accounts are to be used to improve the country’sinfrastructure and not to cover state budget deficits. In the short to mediumterm pressure on the currency from increased oil and gas revenue will becontained by sterilising funds in secure overseas accounts.
Economic performance
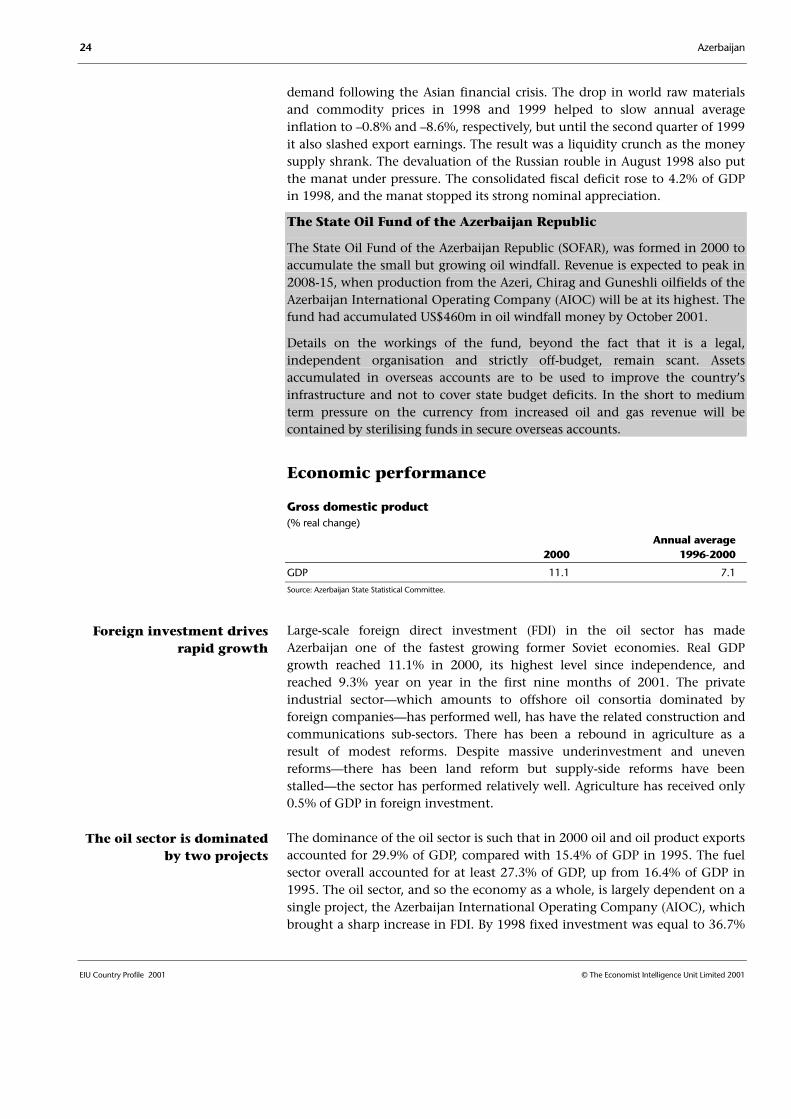
Gross domestic product(% real change)
Annual average2000 1996-2000
GDP 11.1 7.1
Source: Azerbaijan State Statistical Committee.
Large-scale foreign direct investment (FDI) in the oil sector has madeAzerbaijan one of the fastest growing former Soviet economies. Real GDPgrowth reached 11.1% in 2000, its highest level since independence, andreached 9.3% year on year in the first nine months of 2001. The privateindustrial sector—which amounts to offshore oil consortia dominated byforeign companies—has performed well, has have the related construction andcommunications sub-sectors. There has been a rebound in agriculture as aresult of modest reforms. Despite massive underinvestment and unevenreforms—there has been land reform but supply-side reforms have beenstalled—the sector has performed relatively well. Agriculture has received only0.5% of GDP in foreign investment.
The dominance of the oil sector is such that in 2000 oil and oil product exportsaccounted for 29.9% of GDP, compared with 15.4% of GDP in 1995. The fuelsector overall accounted for at least 27.3% of GDP, up from 16.4% of GDP in1995. The oil sector, and so the economy as a whole, is largely dependent on asingle project, the Azerbaijan International Operating Company (AIOC), whichbrought a sharp increase in FDI. By 1998 fixed investment was equal to 36.7%
Foreign investment drivesrapid growth
The oil sector is dominatedby two projects
Azerbaijan 25
© The Economist Intelligence Unit Limited 2001 EIU Country Profile 2001
of GDP, compared with just 15.6% of GDP in 1995. However, the end of theinitial phase of AIOC investment led to a steep fall in the ratio of investment toGDP, to 19% in 2000.
Investment should pick up again in coming years, owing to the AIOC’s phaseone expansion project and the Shah Deniz gas project, both of which shouldbegin by early 2002. The economy’s dependence on just two projects and onemajor foreign company (BP; UK) is a result of disappointing exploration resultsand a government strategy that has prioritised exploration-related investmentover selling off SOCAR production facilities to foreign firms.
The taming of inflation has been one of the few successes of economic policy.High inflation ended two years after the beginning of the stabilisation prog-ramme, the standard time frame for successful stabilisation. Whereas duringthe war with Armenia the government had simply printed money, pushing1994 annual average inflation to 1,664%, after 1995 there has been a success-ful tight monetary stance. For the moment, however, energy consumers inBaku and the surrounding area benefit from heavily subsidised energy supplies,indeed for the most part energy is simply not paid for. If the governmentdecides to reform the domestic energy sector, in particular Azerenerzhi, thenconsumers will have to start paying for their energy consumption.
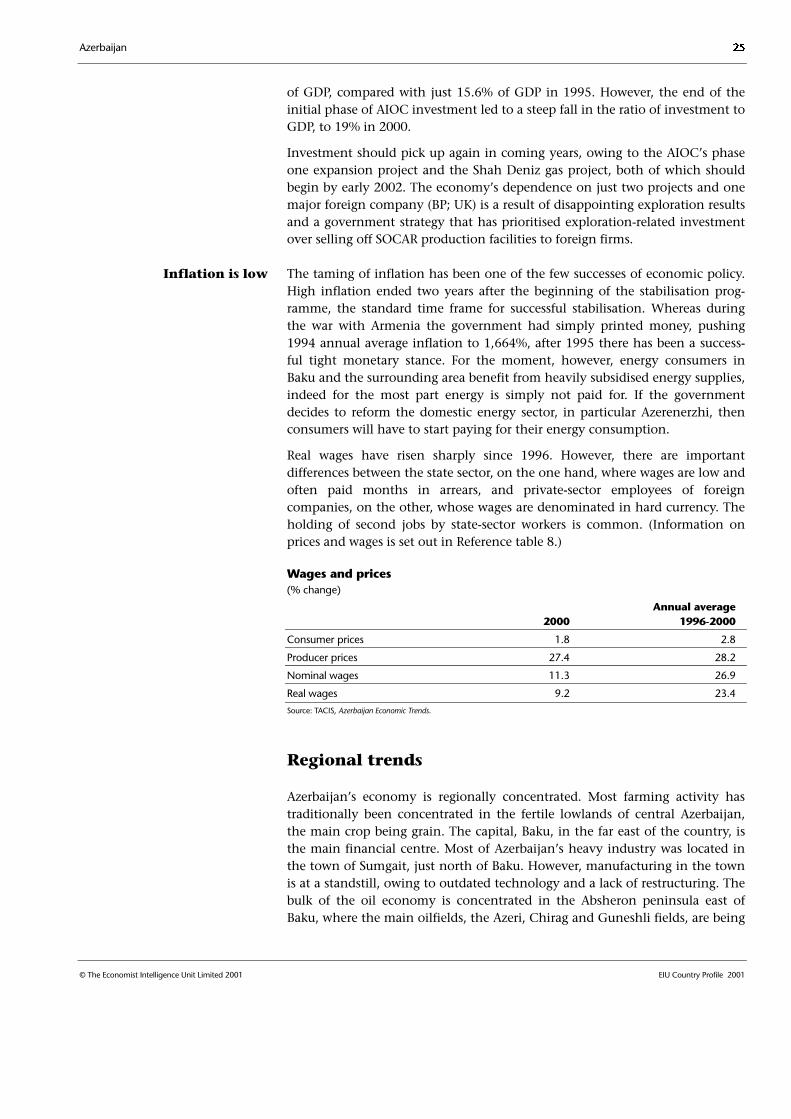
Real wages have risen sharply since 1996. However, there are importantdifferences between the state sector, on the one hand, where wages are low andoften paid months in arrears, and private-sector employees of foreigncompanies, on the other, whose wages are denominated in hard currency. Theholding of second jobs by state-sector workers is common. (Information onprices and wages is set out in Reference table 8.)
Wages and prices(% change)
Annual average2000 1996-2000
Consumer prices 1.8 2.8
Producer prices 27.4 28.2
Nominal wages 11.3 26.9
Real wages 9.2 23.4
Source: TACIS, Azerbaijan Economic Trends.
Regional trends
Azerbaijan’s economy is regionally concentrated. Most farming activity hastraditionally been concentrated in the fertile lowlands of central Azerbaijan,the main crop being grain. The capital, Baku, in the far east of the country, isthe main financial centre. Most of Azerbaijan’s heavy industry was located inthe town of Sumgait, just north of Baku. However, manufacturing in the townis at a standstill, owing to outdated technology and a lack of restructuring. Thebulk of the oil economy is concentrated in the Absheron peninsula east ofBaku, where the main oilfields, the Azeri, Chirag and Guneshli fields, are being
Inflation is low
26 Azerbaijan
EIU Country Profile 2001 © The Economist Intelligence Unit Limited 2001
developed by the Azerbaijan International Operating Company (AIOC). As oilproduction picks up and industrial plants close, most output will shifteastwards to the Caspian Sea area, where most of the oilfields are located.
Economic sectors
Agriculture
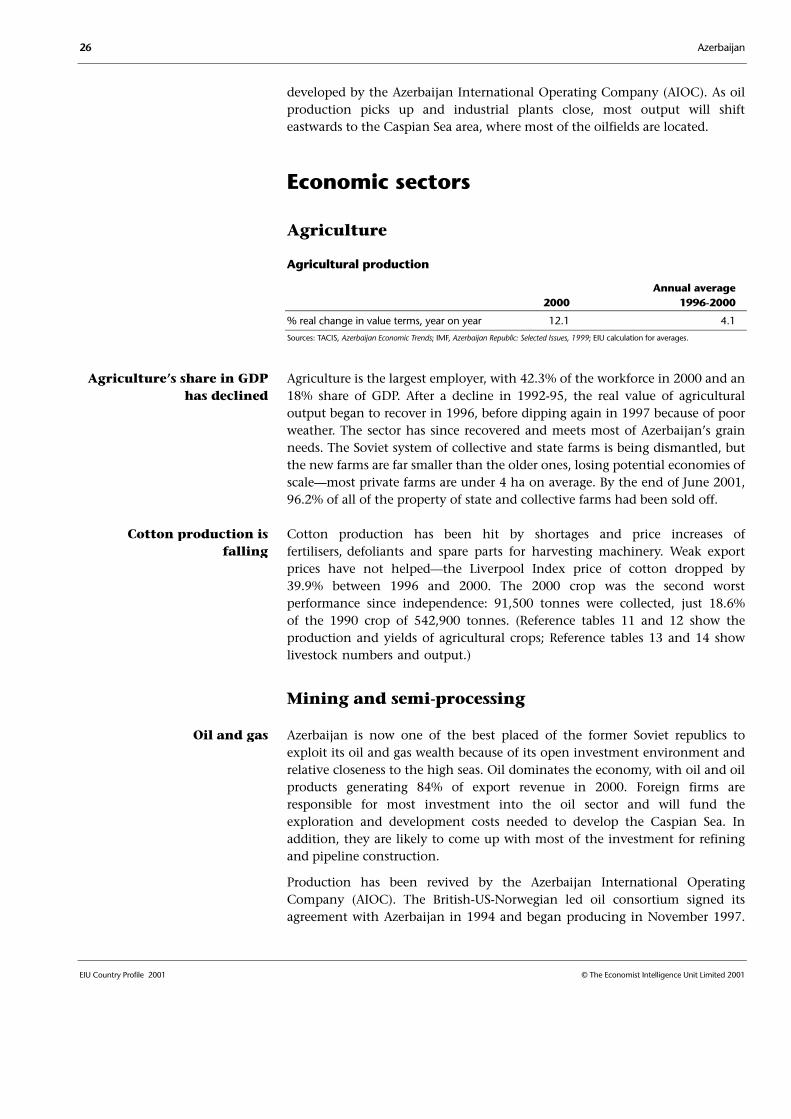
Agricultural production
Annual average2000 1996-2000
% real change in value terms, year on year 12.1 4.1
Sources: TACIS, Azerbaijan Economic Trends; IMF, Azerbaijan Republic: Selected Issues, 1999; EIU calculation for averages.
Agriculture is the largest employer, with 42.3% of the workforce in 2000 and an18% share of GDP. After a decline in 1992-95, the real value of agriculturaloutput began to recover in 1996, before dipping again in 1997 because of poorweather. The sector has since recovered and meets most of Azerbaijan’s grainneeds. The Soviet system of collective and state farms is being dismantled, butthe new farms are far smaller than the older ones, losing potential economies ofscale—most private farms are under 4 ha on average. By the end of June 2001,96.2% of all of the property of state and collective farms had been sold off.
Cotton production has been hit by shortages and price increases offertilisers, defoliants and spare parts for harvesting machinery. Weak exportprices have not helped—the Liverpool Index price of cotton dropped by39.9% between 1996 and 2000. The 2000 crop was the second worstperformance since independence: 91,500 tonnes were collected, just 18.6%of the 1990 crop of 542,900 tonnes. (Reference tables 11 and 12 show theproduction and yields of agricultural crops; Reference tables 13 and 14 showlivestock numbers and output.)
Mining and semi-processing
Azerbaijan is now one of the best placed of the former Soviet republics toexploit its oil and gas wealth because of its open investment environment andrelative closeness to the high seas. Oil dominates the economy, with oil and oilproducts generating 84% of export revenue in 2000. Foreign firms areresponsible for most investment into the oil sector and will fund theexploration and development costs needed to develop the Caspian Sea. Inaddition, they are likely to come up with most of the investment for refiningand pipeline construction.
Production has been revived by the Azerbaijan International OperatingCompany (AIOC). The British-US-Norwegian led oil consortium signed itsagreement with Azerbaijan in 1994 and began producing in November 1997.
Cotton production isfalling
Oil and gas
Agriculture’s share in GDPhas declined

Azerbaijan 27
© The Economist Intelligence Unit Limited 2001 EIU Country Profile 2001
AIOC output is expected to reach 300,000 barrels/day in 2005, following anexpansion programme that will involve US$3.1bn of investment (bycomparison, GDP in 2000 was US$4.9bn). By 1996-97 production had slumpedto 182,500 b/d from 250,900 b/d in 1990 (the peak in the past 20 years was in1980, when oil production was 282,000 b/d). By 2000, thanks to the AIOC,Azerbaijan produced 280,700 b/d. In global terms Azerbaijani production isstill insignificant, at just 0.4% of world production in 2000. The AIOC shouldreach peak production of 800,000 b/d in around 2008-10.
However, Azerbaijan’s oil wealth has become highly politicised. The main localoil producer, the State Oil Company of the Azerbaijan Republic (SOCAR), is thecountry’s largest employer, with 78,000 workers, and the diversion of oilmoney into private pockets has long been established practice. SOCAR’s firstvice-president dealing with foreign consortia is Ilham Aliyev, the son of thepresident of Azerbaijan, Heydar Aliyev. SOCAR is saddled with ageing onshorefields. So far the government has resisted the privatisation of SOCAR, whichwould make it more efficient. The government has deliberately involved asmany foreign companies in the oil consortia as possible to give foreigners astake in Azerbaijan’s future.
The interest that surrounded the initial opening up of Azerbaijan and otherCaspian Sea countries to foreign investment has waned. Sobering factors haveincluded the collapse in oil prices in 1998, notwithstanding the rally in oilprices starting in 1999 and 2000, and the realisation of the difficulty of doingbusiness in the region, the costs of business and the difficulties of buildingexport pipelines—all of which were initially underestimated. In addition, allthe exploration results to date have been disappointing from the perspective ofoil finds. Four exploration consortia have either closed or had the main foreignpartners leave because they encountered dry wells. In addition, the Shah Denizconsortium, led by BP Amoco (UK) and Statoil (Norway), found an estimated500 bn cu metres of gas rather than oil.
The gas sector was in a worse position than the oil sector at independence.Azerbaijan imported gas from suppliers such as Turkmenistan, which wereputting up prices, and domestic non-payment was rampant. Although gasproduction started to recover only in 1998, Azerbaijan managed to eliminatenet gas imports in 1996. Prospects for the gas sector have now improvedthanks to the unexpected discovery of gas at Shah Deniz. The result is thatAzerbaijan is likely to become an important supplier of gas to Turkey withinthe next ten years. The Shah Deniz consortium is about to begin constructionof the Shah Deniz-Erzerum gas export pipeline, which will have an initialcapacity of 5bn cu metres per year, rising to 16bn cu metres per year. The ShahDeniz consortium expects to be able to export 2bn cu metres per year to Turkeyby the end of 2004. Azerbaijan and Georgia finally agreed the gas transit fee forthe Shah Deniz gas export pipeline on September 30th 2001, after the WorldBank, on whose financing the Georgian economy depends, objected to initiallylow proposed tariff levels. In the final agreement, the transit fee was set atUS$2.50 per 1,000 cu metres (the World Bank was proposing transit fees ofUS$5-10), rising to US$5 per 1,000 cu metres within 20 years. Georgia will bepartly compensated with gas supplies.
28 Azerbaijan
EIU Country Profile 2001 © The Economist Intelligence Unit Limited 2001
Oil and gas export pipeline options
Azerbaijan announced that it would make a decision on its main exportpipeline (MEP) by October 1998. However, the date has slipped as a result ofdisagreements over the possible route between the oil companies, which willhave to fund and use the MEP, and the government. No decision is expecteduntil 2002. Azerbaijan has four MEP options.
• A north-western route, from Baku to the Russian Black Sea oil terminal atNovorossisk (Baku-Novorossisk). This route has the advantage of already beingcovered by an existing 110,000-barrels/day pipeline, operational as of 1997, andthe further advantage of ending at an important oil terminal, which isundergoing expansion. However, the disadvantages of Baku-Novorossisk arethat it passes through Russia, a competitor in the oil industry; that the RussianNorth Caucasus is unstable; and that the pipeline operator, the Russian state-owned firm Transneft, has frequently been forced to shut the pipeline. For themoment Azerbaijan is unable to fill its Baku-Novorossisk quota and in the longterm is likely to shun this route.• A westerly route to the Georgian Black Sea port of Supsa (Baku-Supsa). Thisroute is already covered by an existing 110,000-b/d pipeline, which opened in1999 and which, unlike Baku-Novorossisk, is cheap and efficient. In addition,Georgia is an oil importer and so has no interest in seeking to controlAzerbaijani oil exports, unlike Russia and Iran. The AIOC favours expandingBaku-Supsa as an interim measure for AIOC phase one expansion before takinga decision on an MEP later. Although the most commercially viable option,Baku-Supsa is being blocked by Turkish and US political pressure in favour ofBaku-Ceyhan (see below).• A south-western route from Baku to the Georgian capital, Tbilisi, and theninto Turkey and finally to the Turkish Mediterranean oil terminal at Ceyhan—the Baku-Tbilisi-Ceyhan (BTC) oil pipeline. Like the Baku-Supsa route, BTCwould cross the territory of Georgia—an oil importer with no interest inrestricting Azerbaijani oil exports. The route also has political support from theUS and Turkey, although neither country has made a serious offer to finance it.However, it is the most expensive option because of its length, nearly1,800 km. To be commercially viable BTC would need a total oil throughputcommitment of close to 7bn barrels, equal to Azerbaijan’s entire reserves.Although the AIOC initially opposed BTC owing to issues concerning itscommercial viability, there has been growing corporate support for the project,and BP (UK) and Statoil (Norway), two of the participants in the AIOC, havejoined the sponsor group that will conduct the feasibility study of the pipeline.BP has indicated that by building the Shah Deniz gas export pipeline (theBaku-Tbilisi-Erzerum gas pipeline) along the same route, there could beimportant economies of scale. No decision is expected until the feasibilitystudy is completed in 2002.• A southern option through Iran to the Persian Gulf. This would involvereversing the flow on existing Iranian pipelines coming up from the PersianGulf. Azerbaijan has given this possibility little thought as Iran is a competitorin the oil market and so might seek to restrict export volumes. In addition, Iranis under US sanctions. There is also no great desire outside Iran to see yet moreof the world’s oil coming out of the existing Persian Gulf oil bottleneck.
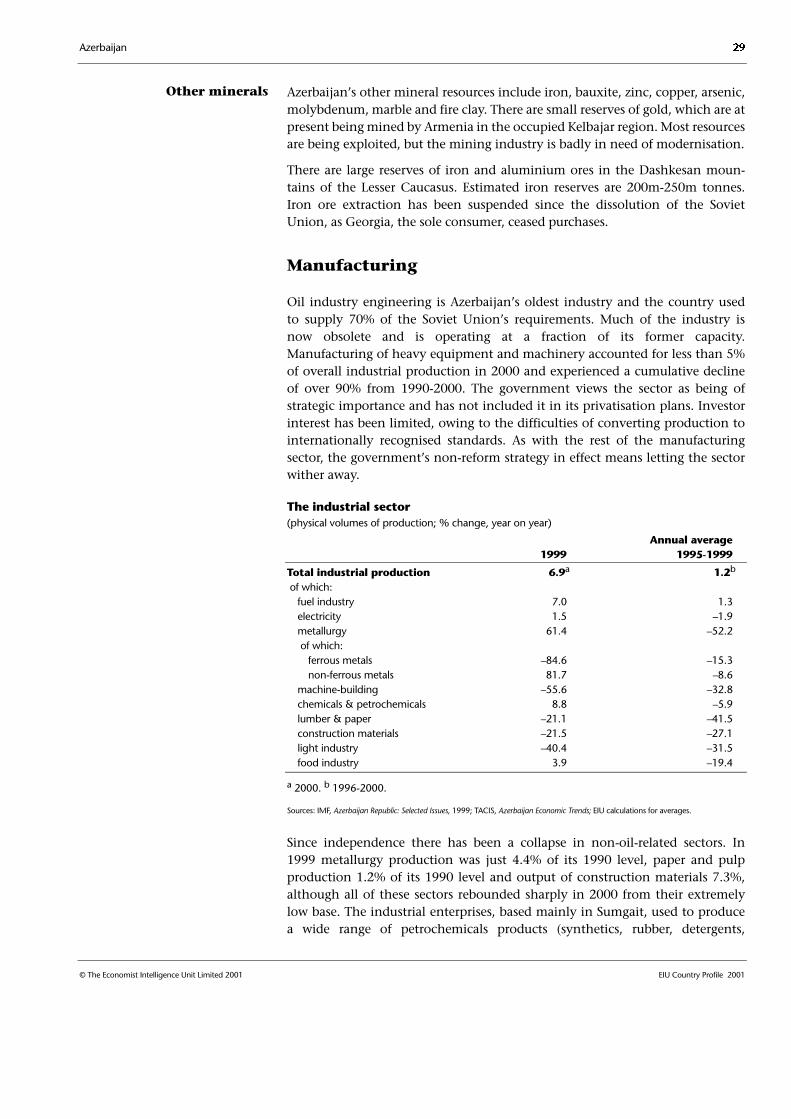
Azerbaijan 29
© The Economist Intelligence Unit Limited 2001 EIU Country Profile 2001
Azerbaijan’s other mineral resources include iron, bauxite, zinc, copper, arsenic,molybdenum, marble and fire clay. There are small reserves of gold, which are atpresent being mined by Armenia in the occupied Kelbajar region. Most resourcesare being exploited, but the mining industry is badly in need of modernisation.
There are large reserves of iron and aluminium ores in the Dashkesan moun-tains of the Lesser Caucasus. Estimated iron reserves are 200m-250m tonnes.Iron ore extraction has been suspended since the dissolution of the SovietUnion, as Georgia, the sole consumer, ceased purchases.
Manufacturing
Oil industry engineering is Azerbaijan’s oldest industry and the country usedto supply 70% of the Soviet Union’s requirements. Much of the industry isnow obsolete and is operating at a fraction of its former capacity.Manufacturing of heavy equipment and machinery accounted for less than 5%of overall industrial production in 2000 and experienced a cumulative declineof over 90% from 1990-2000. The government views the sector as being ofstrategic importance and has not included it in its privatisation plans. Investorinterest has been limited, owing to the difficulties of converting production tointernationally recognised standards. As with the rest of the manufacturingsector, the government’s non-reform strategy in effect means letting the sectorwither away.
The industrial sector(physical volumes of production; % change, year on year)
Annual average 1999 1995-1999
Total industrial production 6.9a 1.2b
of which: fuel industry 7.0 1.3 electricity 1.5 –1.9 metallurgy 61.4 –52.2 of which: ferrous metals –84.6 –15.3 non-ferrous metals 81.7 –8.6 machine-building –55.6 –32.8 chemicals & petrochemicals 8.8 –5.9 lumber & paper –21.1 –41.5 construction materials –21.5 –27.1 light industry –40.4 –31.5 food industry 3.9 –19.4
a 2000. b 1996-2000.
Sources: IMF, Azerbaijan Republic: Selected Issues, 1999; TACIS, Azerbaijan Economic Trends; EIU calculations for averages.
Since independence there has been a collapse in non-oil-related sectors. In1999 metallurgy production was just 4.4% of its 1990 level, paper and pulpproduction 1.2% of its 1990 level and output of construction materials 7.3%,although all of these sectors rebounded sharply in 2000 from their extremelylow base. The industrial enterprises, based mainly in Sumgait, used to producea wide range of petrochemicals products (synthetics, rubber, detergents,
Other minerals
30 Azerbaijan
EIU Country Profile 2001 © The Economist Intelligence Unit Limited 2001
polymeric building materials), aluminium, textiles and clothing. Much ofSumgait’s manufacturing capacity is now at a standstill. The government hasdesignated the area a free economic zone and has invited foreign investors toproduce for export. Little investment has arrived because of the enormous andprobably pointless task of attempting to turn around heavily polluting plantsusing Soviet technology and management practices.
Other important sectors include textiles and food and beverages. These sectorstoo have suffered a steep rate of collapse. Azerbaijan has traditionally been alarge textiles producer, with four major plants that use domestically producedcotton as inputs. The sector is precisely the sort of labour-intensive, non-oilactivity that economic policy should be aiming to foster. Instead, in 1999 lightindustrial activity was just 5.8% of its 1990 level. (Reference table 15 containsdata on sectoral changes in industrial production, and Reference table 16 givesproduction data for selected items.)
Construction
The contribution of construction to GDP was 4.4% in 2000, compared with13% in 1998, according to government figures. The IMF believes thatconstruction’s contribution tends to be larger than government figuresindicate. A significant proportion of construction activity goes unrecorded.Construction work associated with the start of foreign investment in the oilindustry has taken off since 1995. Companies from Turkey are also active inthe Azerbaijani market, building homes and business premises. As a result ofthe boom, wages in the sector are among the highest in the economy. Thenumbers officially recorded as working in the sector are falling, in part becauseof the decline of state-sponsored construction and in part because of thegrowth of the informal economy.
Financial services
The Azerbaijan National Bank (ANB, the central bank) was set up in 1992 butbecame independent only in 1995. The ANB is responsible for monetary policyand the supervision of the financial sector. The ANB’s tight monetary stanceproved instrumental in ending high inflation. In 1999 the ANB loosened itsmonetary stance, and devalued the manat in response to pressure on theexchange rate caused by the 1998 Russian financial crisis. The ANB’s bench-mark refinancing rate has remained at 10% since November 1999. The ANB iscommitted to raising the refinancing rate if annual inflation rises over 4%.
The commercial banking sector still contains too many banks and mostinstitutions are small and undercapitalised. Although the sector has undergoneconsolidation, partly as a result of the ANB’s activity in revoking licences forbreaches of prudential regulations, 59 banks remain in operation (down from210 in 1994). Many of the smaller banks will have to close, as the ANB’sminimum capital requirement is US$5m in 2001, up from US$2m in 2000 andUS$1.5m in 1999. In the event of a run on the manat, many banks wouldprobably go under as they have large open positions on the foreign-exchange
Banking services

Azerbaijan 31
© The Economist Intelligence Unit Limited 2001 EIU Country Profile 2001
market. The ANB will allow only 30% of the capital in the banking system tobe foreign-owned and the state-owned banks are informally protected by theANB from new competition. (Banking statistics are provided in Reference table17; Reference table 10 has data on the money supply.)
The International Bank of Azerbaijan (IBA), the best positioned and capitalisedof the four Soviet-era banks that continue to dominate the market, was due tobe privatised by the end of 1998 but the government managed to sell only aminority stake to the European Bank for Reconstruction and Development(EBRD). In June 2000 the ANB began to merge three of the four main banksinto one bank following a restructuring programme. Amanat Bank (the SavingsBank), Sanayeinvestbank (the industrial investment bank) and Agrosanayebank(the agro-industrial bank) have been merged into the United State IndustrialBank (USIB), with the latter two saddled with a loan portfolio that is over 90%non-performing. The USIB and the IBA still hold the bulk of deposits, employthe most people and have the most branches. Overall, 62% of the entirecommercial bank loan portfolio was non-performing at the end of 1999,according to the IMF. Of total assets at the end of 1999, 65% were loans tostate-owned enterprises. The IBA and USIB accounted for over 50% of allbanking sector assets at the end of 1999. (See Reference table 10 forinformation on the money supply.)
The ratio of assets to GDP is difficult to assess, as so many are of almost nilvalue. On paper, total banking sector assets were worth just Manat2,792bn(US$600m; 11.6% of 2001 forecast GDP) at the end of the first quarter of2001, of which Manat1,625bn (6.8% of 2001 forecast GDP) were the assets ofstate-owned banks. Bank profitability is falling rather than strengthening,despite rapid economic growth. Banks are exposed to the non-oil economyand so are unlikely to benefit from the expected growth in the oil sector.Measures such as the reduction of the reserve requirement from 12% to 10%of deposits in November 1999 have helped to increase lending to the non-oilsector, but this remains at very low levels. One problem for commercial banksis that the government debt market, which could provide a relative safehaven, is poorly developed.
Other services
There has been important growth in other services since 1991. Services ingeneral were either suppressed or neglected in the Soviet era. Starting from alow base, the sector has grown virtually every year since independence. Thetrue size of other services in the economy is probably larger than officialstatistics suggest, as most services companies operate on a small scale and donot pay tax. However, the services sector remains weak. Most retail enterprisesare still on a small scale, with many consumer purchases made in open marketsrather than in retail outlets. Tourism has also been poorly developed,hampered by the low quality of hotels outside the capital, Baku, and politicalinstability owing to the unresolved Nagorny Karabakh conflict.

32 Azerbaijan
EIU Country Profile 2001 © The Economist Intelligence Unit Limited 2001
The external sector
Trade in goods
Foreign trade, 2000(US$ m unless otherwise indicated)
Main exports (fob) Main imports (cif)
Oil & oil products 1,465.5 Machinery & equipment 362.8
Food products 56.7 Food products 221.8
Textiles 40.8 Oil sector 21.9
Chemicals 36.2 Metals 123.4
Machinery & equipment 30.7 Chemicals 84.1
Total incl others 1,744.9 Total incl others 1,172.1
Note. The components of trade are customs data.
Source: TACIS, Azerbaijan Economic Trends.
Azerbaijan has traditionally depended heavily on trade, with imports andexports averaging 37% and 46% of GDP, respectively, during the second half ofthe 1980s. In 1992 Azerbaijan registered a trade surplus, but a deficit hasopened up from 1993, initially as a result of the decline of the export sector, to1999. Since 1996 there has also been a rapid increase in imports, mostly owingto the inflow of machinery and equipment for the oil industry, but alsobecause of rising demand for consumer goods. Azerbaijan is increasingly relianton crude oil exports for export growth, whereas exports from the uncom-petitive manufacturing sector have plunged. The rise in oil export volumes andoil export prices helped to push the trade account into surplus in 2000.
Trade data are often unreliable: the figures for imports and exports presented inthe balance of payments are the most reliable. Balance-of-payments data havebeen compiled by both the IMF and the Azerbaijan National Bank (ANB, thecentral bank). These series differ slightly from each other, but both take intoaccount the import of technology by international oil companies and alsomake an estimate for unrecorded trade. However, the only data available onthe direction and composition of trade come from the State CustomsCommittee, which fail to reflect fully these two components (the oil industryand unrecorded trade). As a result, the State Customs Committee understatedexports by 6.1% and imports by 31% in 2000. (Reference tables 18-21 show thetrade figures by composition and use customs data. IMF data on the balance ofpayments are given in Reference table 24.)
Following independence in 1991, Azerbaijan redirected exports to new marketsoutside the former Soviet Union and the Commonwealth of IndependentStates (CIS). As oil exports from the Azerbaijan International OperatingCompany (AIOC) are sent to European markets, so dependence on the CIS isdecreasing. Azerbaijan’s main export market in 2000 was Italy, which provided43.7% of export revenue because of oil shipments to its oil terminals.
There is decreasingdependence on CIS markets
Data differs according tothe source
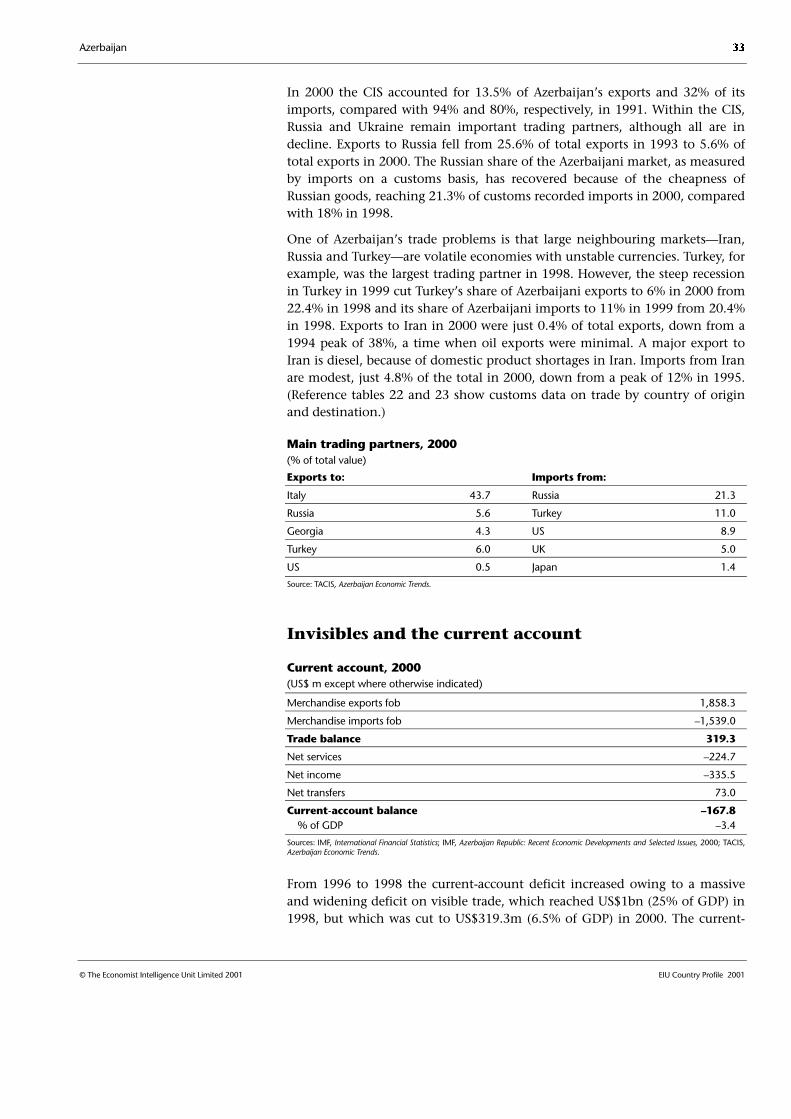
Azerbaijan 33
© The Economist Intelligence Unit Limited 2001 EIU Country Profile 2001
In 2000 the CIS accounted for 13.5% of Azerbaijan’s exports and 32% of itsimports, compared with 94% and 80%, respectively, in 1991. Within the CIS,Russia and Ukraine remain important trading partners, although all are indecline. Exports to Russia fell from 25.6% of total exports in 1993 to 5.6% oftotal exports in 2000. The Russian share of the Azerbaijani market, as measuredby imports on a customs basis, has recovered because of the cheapness ofRussian goods, reaching 21.3% of customs recorded imports in 2000, comparedwith 18% in 1998.
One of Azerbaijan’s trade problems is that large neighbouring markets—Iran,Russia and Turkey—are volatile economies with unstable currencies. Turkey, forexample, was the largest trading partner in 1998. However, the steep recessionin Turkey in 1999 cut Turkey’s share of Azerbaijani exports to 6% in 2000 from22.4% in 1998 and its share of Azerbaijani imports to 11% in 1999 from 20.4%in 1998. Exports to Iran in 2000 were just 0.4% of total exports, down from a1994 peak of 38%, a time when oil exports were minimal. A major export toIran is diesel, because of domestic product shortages in Iran. Imports from Iranare modest, just 4.8% of the total in 2000, down from a peak of 12% in 1995.(Reference tables 22 and 23 show customs data on trade by country of originand destination.)
Main trading partners, 2000(% of total value)
Exports to: Imports from:
Italy 43.7 Russia 21.3
Russia 5.6 Turkey 11.0
Georgia 4.3 US 8.9
Turkey 6.0 UK 5.0
US 0.5 Japan 1.4
Source: TACIS, Azerbaijan Economic Trends.
Invisibles and the current account
Current account, 2000(US$ m except where otherwise indicated)
Merchandise exports fob 1,858.3
Merchandise imports fob –1,539.0
Trade balance 319.3
Net services –224.7
Net income –335.5
Net transfers 73.0
Current-account balance –167.8 % of GDP –3.4
Sources: IMF, International Financial Statistics; IMF, Azerbaijan Republic: Recent Economic Developments and Selected Issues, 2000; TACIS,Azerbaijan Economic Trends.
From 1996 to 1998 the current-account deficit increased owing to a massiveand widening deficit on visible trade, which reached US$1bn (25% of GDP) in1998, but which was cut to US$319.3m (6.5% of GDP) in 2000. The current-

34 Azerbaijan
EIU Country Profile 2001 © The Economist Intelligence Unit Limited 2001
account deficit shrank dramatically in 2000 to 3.4% of GDP owing to highervolumes of oil exports, thanks to foreign investment and higher oil exportprices. It would have been smaller had it not been for a sharp deterioration ofthe income balance. The current-account deficit is expected to fall further afterthe AIOC proceeds with its phase one expansion plan, scheduled to begin byearly 2002. By the time of full-field development at the AIOC, expected in2008, Azerbaijan should be running a current-account surplus. However, as theclosure of oil consortia in 1999 and the collapse of oil prices in 1998 showed,the oil sector is volatile and the government tends to be overly optimistic. (IMFdata on the current account are shown in Reference table 24.)
Capital flows and foreign debt
Azerbaijan’s large current-account deficits have been financed with largepositive inflows on the capital and financial accounts, in particular oil-relatedforeign direct investment (FDI). In 2000 FDI covered almost 80% of therelatively small current-account deficit. Nevertheless, FDI inflows themselveswere extremely low, at US$129.9m, compared with US$1.1bn in 1997. Therewas actually a small net FDI outflow from the oil sector, because of the phasingof oil projects. There were still US$100m of oil contract signature bonuses in2000—advance payments from the oil companies. One concern, however, isthe dependence on just two projects, AIOC and Shah Deniz, caused in part bythe poor exploration results to date. However, the fact that exploration so farhas been unsuccessful is no guide to its future prospects. Portfolio investmentis negligible. (Data on capital flows can be found in Reference table 24.)
Foreign direct investment in Azerbaijan
Stocks and flows: Azerbaijan has been among the most successfulCommonwealth of Independent States (CIS) members in attracting foreigndirect investment (FDI). FDI inflows averaged about 17% of GDP in 1995-2000.The end-2000 stock of FDI is estimated at US$3.7bn. The FDI stock per head, atsome US$480, although much lower than for most east-central Europeancountries, was second only to Kazakhstan in the CIS. However, FDI fell sharplyin 2000, owing to increased operating cost recovery efforts by the AzerbaijanInternational Operating Company (AIOC), delayed investment under severalproduction-sharing agreements (PSAs), and uncertainties over negotiations onthe main export pipeline.
Origin and distribution: The US was the largest foreign investor inAzerbaijan in the 1990s, with investments amounting to US$1.2bn. The UKwas the second largest, with some US$670m, closely followed by Turkey, whichinvested US$660m. The origin of FDI in Azerbaijan is reflected in thedistribution of shares in the AIOC, the largest energy development under wayin the country. US companies hold almost 42% of AIOC shares, UK companieshold nearly 20%, Azerbaijan and Russia each hold 10%, Norway has nearly 9%and Turkey holds around 7%. An overwhelming 60% of total FDI in the 1990swas directed to the oil industry. The second main sector has been industry(with 16%), and the construction sector received 8%. FDI inflows are heavilyconcentrated in the Baku region, as all the inflows into oil exploration are
Capital flows

Azerbaijan 35
© The Economist Intelligence Unit Limited 2001 EIU Country Profile 2001
directed there. The second most important destination for FDI is theneighbouring industrial city of Sumgait, where most of the FDI into oilrefinement and petrochemicals industries has taken place.
Determinants: FDI inflows to Azerbaijan have been almost entirely driven byits oil and gas endowment. Outside the oil and gas sectors there has been littleFDI activity. This is mainly attributable to the poor investment climate andsevere bureaucratic obstacles. In addition, infrastructure is poor. Azerbaijanilaw provides for standard investment incentives: free repatriation of profits,guarantees against nationalisation without compensation, exemption fromcustom duties on imported materials and equipment, a ten-year guaranteeagainst “damaging” legislation, and preferential treatment in developmentareas and selected investment. No free economic zones have been created yet,although in order to stimulate a more balanced development of the countrythe government is seriously considering their establishment. The first area tobe made a free economic zone would be the industrial zone of Sumgait, whichneeds major investment to realise its full potential.
Impact: FDI inflows into Azerbaijan in 1995-99 have largely covered itscurrent-account deficit and have also been an important engine of growth. Oiland gas investments have contributed most to GDP growth since 1995, andFDI into these sectors has created positive and increasingly important effects inother parts of the economy. However, being narrowly based and directed to acapital-intensive sector, FDI has not generated any substantial employment.
Potential: Thanks to Azerbaijan’s enormous mineral resources there is still alarge potential for FDI inflows into oil and gas sectors. Additional pipelinecapacity—either through the expansion of existing pipelines such as Baku-Supsa or Baku-Novorossisk, or through the construction of the proposed Baku-Ceyhan pipeline—will be an important consideration for new investment. TheAIOC is due to start its phase one expansion by the end of 2001. This involvesa US$3.1bn investment for the development of offshore fields that will increaseoil output to 17m tonnes by 2005. The BP-led consortium developing the ShahDeniz gasfield is to invest some US$1.3bn in development and pipelinerenovation and construction. FDI will also be attracted to downstreamactivities—petrochemicals and related industries. Moreover, there will also beopportunities in other fields: telecommunications services, light manufacturing(especially cotton-based manufacturing) and transport. Azerbaijan hasconsiderable potential as a food-exporting country; there are growingopportunities for FDI in food-processing, packaging and other related areas.However, FDI inflows into sectors other than oil and gas will depend in thelong term on structural reforms, the progress of privatisation, the creation of amore friendly investment climate and an improvement in infrastructure.
Azerbaijan’s debt burden remains manageable. However, the debt burden isgrowing relatively fast and doubled from 1997 to 1999. According to the mostrecent World Bank figures, Azerbaijan’s total foreign debt stock was US$1bn atthe end of 1999 (26% of GDP), up by almost 50% year on year. The ratio ofdebt to the export of goods and non-factor services was 80% in 1999,according to the Economist Intelligence Unit’s calculations, up from 443% in
Foreign debt
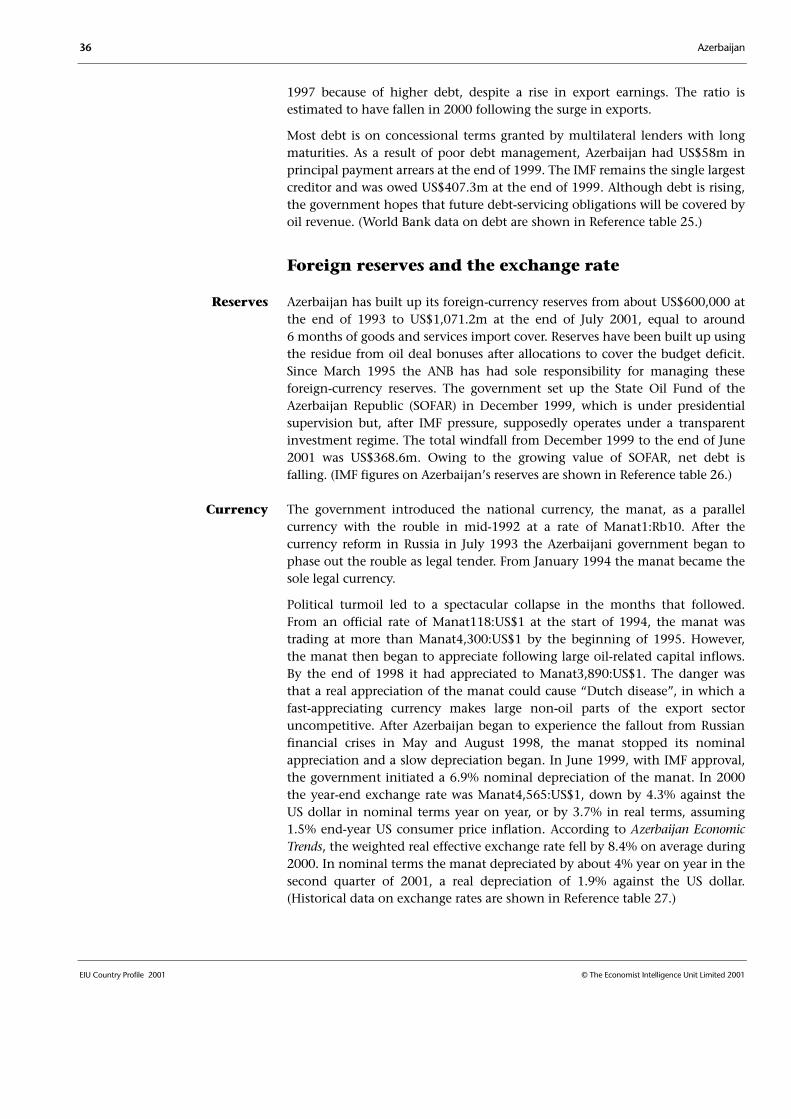
36 Azerbaijan
EIU Country Profile 2001 © The Economist Intelligence Unit Limited 2001
1997 because of higher debt, despite a rise in export earnings. The ratio isestimated to have fallen in 2000 following the surge in exports.
Most debt is on concessional terms granted by multilateral lenders with longmaturities. As a result of poor debt management, Azerbaijan had US$58m inprincipal payment arrears at the end of 1999. The IMF remains the single largestcreditor and was owed US$407.3m at the end of 1999. Although debt is rising,the government hopes that future debt-servicing obligations will be covered byoil revenue. (World Bank data on debt are shown in Reference table 25.)
Foreign reserves and the exchange rate
Azerbaijan has built up its foreign-currency reserves from about US$600,000 atthe end of 1993 to US$1,071.2m at the end of July 2001, equal to around6 months of goods and services import cover. Reserves have been built up usingthe residue from oil deal bonuses after allocations to cover the budget deficit.Since March 1995 the ANB has had sole responsibility for managing theseforeign-currency reserves. The government set up the State Oil Fund of theAzerbaijan Republic (SOFAR) in December 1999, which is under presidentialsupervision but, after IMF pressure, supposedly operates under a transparentinvestment regime. The total windfall from December 1999 to the end of June2001 was US$368.6m. Owing to the growing value of SOFAR, net debt isfalling. (IMF figures on Azerbaijan’s reserves are shown in Reference table 26.)
The government introduced the national currency, the manat, as a parallelcurrency with the rouble in mid-1992 at a rate of Manat1:Rb10. After thecurrency reform in Russia in July 1993 the Azerbaijani government began tophase out the rouble as legal tender. From January 1994 the manat became thesole legal currency.
Political turmoil led to a spectacular collapse in the months that followed.From an official rate of Manat118:US$1 at the start of 1994, the manat wastrading at more than Manat4,300:US$1 by the beginning of 1995. However,the manat then began to appreciate following large oil-related capital inflows.By the end of 1998 it had appreciated to Manat3,890:US$1. The danger wasthat a real appreciation of the manat could cause “Dutch disease”, in which afast-appreciating currency makes large non-oil parts of the export sectoruncompetitive. After Azerbaijan began to experience the fallout from Russianfinancial crises in May and August 1998, the manat stopped its nominalappreciation and a slow depreciation began. In June 1999, with IMF approval,the government initiated a 6.9% nominal depreciation of the manat. In 2000the year-end exchange rate was Manat4,565:US$1, down by 4.3% against theUS dollar in nominal terms year on year, or by 3.7% in real terms, assuming1.5% end-year US consumer price inflation. According to Azerbaijan EconomicTrends, the weighted real effective exchange rate fell by 8.4% on average during2000. In nominal terms the manat depreciated by about 4% year on year in thesecond quarter of 2001, a real depreciation of 1.9% against the US dollar.(Historical data on exchange rates are shown in Reference table 27.)
Currency
Reserves

Azerbaijan 37
© The Economist Intelligence Unit Limited 2001 EIU Country Profile 2001
There have been significant changes in monetary aggregates after thegovernment removed funds held by SOFAR from the money supply. SOFARhad accumulated US$368.6m in oil windfall money by the end of June 2001.The fund is invested overseas, leading to a rise in net foreign assets, which wereup by 49.6% year on year by the end of June. The removal of SOFAR fundshalved foreign-exchange deposits during the first quarter. Money-supplyfigures are therefore not comparable year on year. However, it is clear that ofthe few deposits kept in the banks, most are US dollar deposits. There were justManat287.7m (US$62,000, or 2.7% of GDP) in manat deposits, mostly fromfirms, in June. The economy is so substantially demonetised that M3 in Junewas just 12% of GDP (at 2000 levels). The foreign-exchange regime has beenliberalised but the manat, although in practice convertible for current-accountpurposes, is not yet formally current-account convertible.
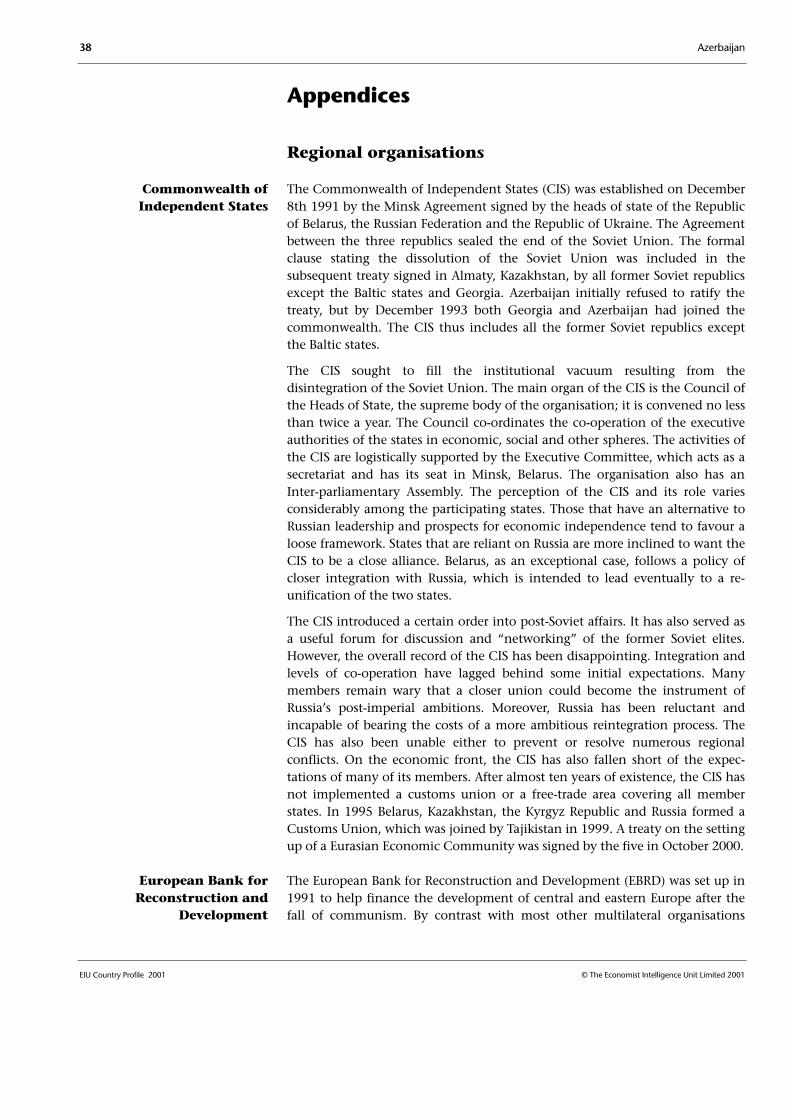
38 Azerbaijan
EIU Country Profile 2001 © The Economist Intelligence Unit Limited 2001
Appendices
Regional organisations
The Commonwealth of Independent States (CIS) was established on December8th 1991 by the Minsk Agreement signed by the heads of state of the Republicof Belarus, the Russian Federation and the Republic of Ukraine. The Agreementbetween the three republics sealed the end of the Soviet Union. The formalclause stating the dissolution of the Soviet Union was included in thesubsequent treaty signed in Almaty, Kazakhstan, by all former Soviet republicsexcept the Baltic states and Georgia. Azerbaijan initially refused to ratify thetreaty, but by December 1993 both Georgia and Azerbaijan had joined thecommonwealth. The CIS thus includes all the former Soviet republics exceptthe Baltic states.
The CIS sought to fill the institutional vacuum resulting from thedisintegration of the Soviet Union. The main organ of the CIS is the Council ofthe Heads of State, the supreme body of the organisation; it is convened no lessthan twice a year. The Council co-ordinates the co-operation of the executiveauthorities of the states in economic, social and other spheres. The activities ofthe CIS are logistically supported by the Executive Committee, which acts as asecretariat and has its seat in Minsk, Belarus. The organisation also has anInter-parliamentary Assembly. The perception of the CIS and its role variesconsiderably among the participating states. Those that have an alternative toRussian leadership and prospects for economic independence tend to favour aloose framework. States that are reliant on Russia are more inclined to want theCIS to be a close alliance. Belarus, as an exceptional case, follows a policy ofcloser integration with Russia, which is intended to lead eventually to a re-unification of the two states.
The CIS introduced a certain order into post-Soviet affairs. It has also served asa useful forum for discussion and “networking” of the former Soviet elites.However, the overall record of the CIS has been disappointing. Integration andlevels of co-operation have lagged behind some initial expectations. Manymembers remain wary that a closer union could become the instrument ofRussia’s post-imperial ambitions. Moreover, Russia has been reluctant andincapable of bearing the costs of a more ambitious reintegration process. TheCIS has also been unable either to prevent or resolve numerous regionalconflicts. On the economic front, the CIS has also fallen short of the expec-tations of many of its members. After almost ten years of existence, the CIS hasnot implemented a customs union or a free-trade area covering all memberstates. In 1995 Belarus, Kazakhstan, the Kyrgyz Republic and Russia formed aCustoms Union, which was joined by Tajikistan in 1999. A treaty on the settingup of a Eurasian Economic Community was signed by the five in October 2000.
The European Bank for Reconstruction and Development (EBRD) was set up in1991 to help finance the development of central and eastern Europe after thefall of communism. By contrast with most other multilateral organisations
Commonwealth ofIndependent States
European Bank forReconstruction and
Development
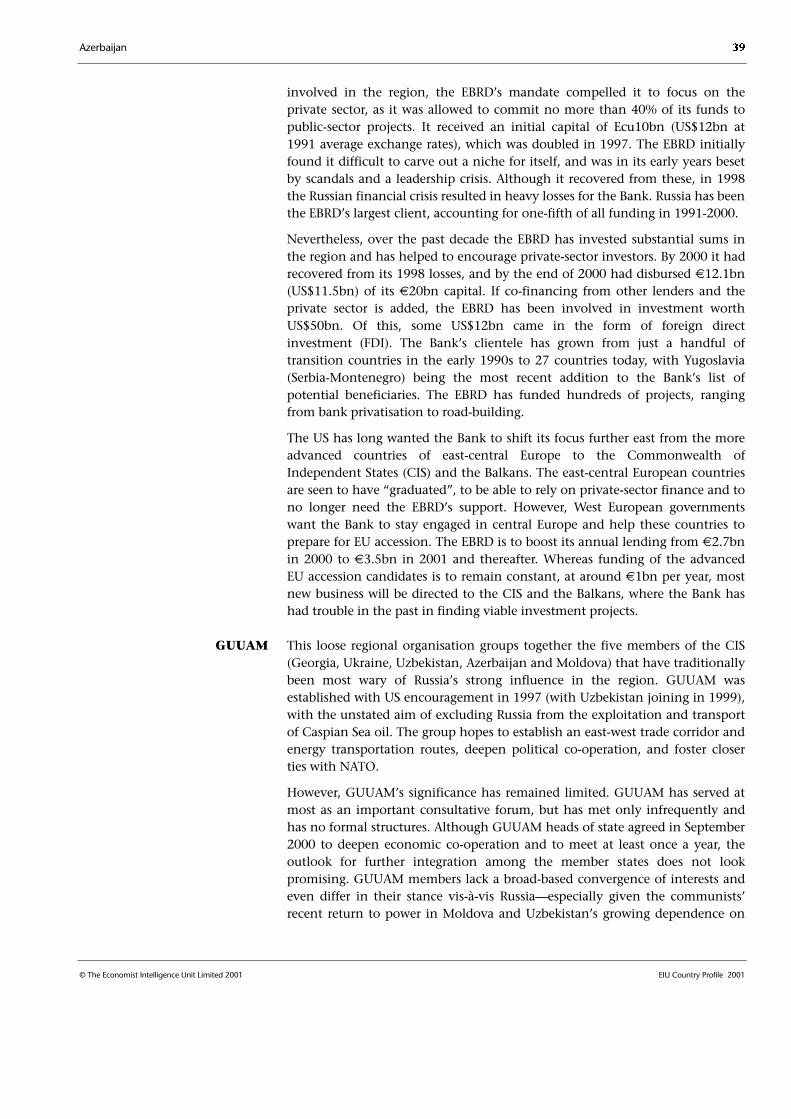
Azerbaijan 39
© The Economist Intelligence Unit Limited 2001 EIU Country Profile 2001
involved in the region, the EBRD’s mandate compelled it to focus on theprivate sector, as it was allowed to commit no more than 40% of its funds topublic-sector projects. It received an initial capital of Ecu10bn (US$12bn at1991 average exchange rates), which was doubled in 1997. The EBRD initiallyfound it difficult to carve out a niche for itself, and was in its early years besetby scandals and a leadership crisis. Although it recovered from these, in 1998the Russian financial crisis resulted in heavy losses for the Bank. Russia has beenthe EBRD’s largest client, accounting for one-fifth of all funding in 1991-2000.
Nevertheless, over the past decade the EBRD has invested substantial sums inthe region and has helped to encourage private-sector investors. By 2000 it hadrecovered from its 1998 losses, and by the end of 2000 had disbursed €12.1bn(US$11.5bn) of its €20bn capital. If co-financing from other lenders and theprivate sector is added, the EBRD has been involved in investment worthUS$50bn. Of this, some US$12bn came in the form of foreign directinvestment (FDI). The Bank’s clientele has grown from just a handful oftransition countries in the early 1990s to 27 countries today, with Yugoslavia(Serbia-Montenegro) being the most recent addition to the Bank’s list ofpotential beneficiaries. The EBRD has funded hundreds of projects, rangingfrom bank privatisation to road-building.
The US has long wanted the Bank to shift its focus further east from the moreadvanced countries of east-central Europe to the Commonwealth ofIndependent States (CIS) and the Balkans. The east-central European countriesare seen to have “graduated”, to be able to rely on private-sector finance and tono longer need the EBRD’s support. However, West European governmentswant the Bank to stay engaged in central Europe and help these countries toprepare for EU accession. The EBRD is to boost its annual lending from €2.7bnin 2000 to €3.5bn in 2001 and thereafter. Whereas funding of the advancedEU accession candidates is to remain constant, at around €1bn per year, mostnew business will be directed to the CIS and the Balkans, where the Bank hashad trouble in the past in finding viable investment projects.
This loose regional organisation groups together the five members of the CIS(Georgia, Ukraine, Uzbekistan, Azerbaijan and Moldova) that have traditionallybeen most wary of Russia’s strong influence in the region. GUUAM wasestablished with US encouragement in 1997 (with Uzbekistan joining in 1999),with the unstated aim of excluding Russia from the exploitation and transportof Caspian Sea oil. The group hopes to establish an east-west trade corridor andenergy transportation routes, deepen political co-operation, and foster closerties with NATO.
However, GUUAM’s significance has remained limited. GUUAM has served atmost as an important consultative forum, but has met only infrequently andhas no formal structures. Although GUUAM heads of state agreed in September2000 to deepen economic co-operation and to meet at least once a year, theoutlook for further integration among the member states does not lookpromising. GUUAM members lack a broad-based convergence of interests andeven differ in their stance vis-à-vis Russia—especially given the communists’recent return to power in Moldova and Uzbekistan’s growing dependence on
GUUAM
40 Azerbaijan
EIU Country Profile 2001 © The Economist Intelligence Unit Limited 2001
Russian military co-operation. All of the GUUAM states are constrained bytheir considerable economic dependence on Russia. Russia remains theprincipal energy supplier in the region, as well as a dominant export marketand, in most cases, a sizeable creditor.
The Organisation of Islamic Conference (OIC), an intergovernmentalorganisation with 56 members, was established in 1971 in Saudi Arabia.Among the transition countries, Azerbaijan joined in 1991; Albania, the KyrgyzRepublic and Tajikistan and Turkmenistan in 1992; and Kazakhstan andUzbekistan in 1995. Bosnia and Hercegovina (BiH) has observer status. TheOIC’s aim is to promote Islamic solidarity by fostering co-operation in thepolitical, economic, social, cultural and scientific fields. The main organ of theOIC is the Conference of Kings and Heads of States and Governments (theIslamic Summit), which meets every three years. The activities of the OIC areimplemented by the Conference of Foreign Ministers, which meets annually,and by a permanent General Secretariat.
The OIC aims to facilitate political co-operation among member states, inaddition to mediating in international events in which Muslim communitiesare affected; it has also been a strong supporter of the Palestinian case. AnotherOIC aim is the co-ordination and facilitation of economic co-operation amongmember states. The OIC supports education in Muslim communities and workfor the preservation of Islamic cultural heritage. It has a web of specialised andaffiliated institutions whose activities range from broadcasting to upgradingthe standards of public services.
The Organisation of the Black Sea Economic Co-operation (BSEC) beganoperating in 1999, several years after regional leaders established a frameworkfor co-operation at a summit in 1992. The organisation’s supreme body is thePresidential Summit, which comprises the heads of states and government ofthe member states (Albania, Armenia, Azerbaijan, Bulgaria, Georgia, Greece,Moldova, Romania, Russia, Turkey, and Ukraine). The main decisions in theBSEC are taken by the Council of Ministers of Foreign Affairs, which meets onan annual basis.
The BSEC was formed with the goal of extending economic co-operation byfacilitating contacts between businesses and eliminating barriers to trade. BSECmember states have set up a number of bodies to meet these goals, althoughresults to date have been limited. The Black Sea Trade and Development Bankwas set up in 1998 to finance and implement joint regional projects. A BSECCo-ordination Centre was established in Ankara to promote the exchange ofstatistical data, and the Istanbul-based BSEC Business Council is charged withidentifying private and public investment projects.
Initially a non-institutionalised multilateral forum for Cold War East-Westdialogue, the Conference for Security and Co-operation in Europe (CSCE)gradually expanded in aim and strengthened its organisational structure in the1990s. Established in 1972, the CSCE served for almost twenty years as aconvenient and flexible arrangement for easing Cold War tensions. After theend of the Cold War the role of the CSCE started to change quickly, and in
Organisation of IslamicConference
Organisation of the BlackSea Economic Co-operation
Organisation for Securityand Co-operation in Europe
Azerbaijan 41
© The Economist Intelligence Unit Limited 2001 EIU Country Profile 2001
December 1994 the conference was officially renamed the Organisation forSecurity and Co-operation in Europe (OSCE). With 55 member states, theOSCE is the only inclusive pan-European security organisation. Canada andthe US are also members of the organisation.
The OSCE has played a key role in conflict prevention and resolution, as wellas post-conflict reconstruction in Europe. Its activities embrace threedimensions: security, economy, and human rights. The OSCE is engaged inpreventive diplomacy, arms control and confidence-building activities. Itundertakes fact-finding and conciliation missions and crisis management. TheOSCE is a component of the European security architecture. It is a “regionalarrangement” in the sense of Chapter VIII of the UN Charter, which gives itauthority to try to resolve a conflict in the region before referring it to the UNSecurity Council. In the course of the 1990s the OSCE has been heavilyinvolved in the Balkans and the Transcaucasus.
The activities of the OSCE are performed by a web of specialised agencies. TheHigh Commissioner on National Minorities, based in The Hague, is theprimary source of “early warning”, with responsibility for identifying ethnictensions that might endanger peace. The Office for Democratic Institutionsand Human Rights (ODIHR), based in Warsaw, focuses on promoting humanrights, democracy and the rule of law. It monitors elections, assists atdeveloping national electoral and legal institutions, promotes the developmentof non-governmental organisations (NGOs) and civil society, conductsmeetings, seminars and special projects. The Office of the Representative onFreedom of the Media, based in Vienna, assesses the implementation of themember states’ commitments concerning freedom of journalism, broadcastingand access to information.
Sources of information
The availability of statistical information on Azerbaijan is improving. The bestdata are from the IMF, but are available annually. The EU through its TACISprogramme publishes a useful quarterly, Azerbaijan Economic Trends, althoughthe time lag on the publication of data is quite long. Information from theEBRD and the World Bank both tend to be of poorer quality. Remarkably, datafrom the annual state statistical yearbook match those from the IMF andAzerbaijan Economic Trends. Academic coverage of post-independenceAzerbaijan is weak, often suffering from partisanship resulting from theNagorny Karabakh war. The James Baker Institute at Rice University, Texas, hasundertaken the most extensive review of the oil sector in Central Asia and theCaspian in a series of reports that are more in-depth and thoughtful than theInternational Energy Agency’s Caspian Oil and Gas report.
Azerbaijan State Statistical Committee, Statistical Yearbook
TACIS, Azerbaijan Economic Trends (http://www.economic-trends.org)
EBRD, Transition Report, London, annual (with an annual update)International sources
National sources

42 Azerbaijan
EIU Country Profile 2001 © The Economist Intelligence Unit Limited 2001
Energy Data Associates, Bishops Walk House, 19-23 High Street, Pinner,Middlesex HA5 5PJ
EU/TACIS programme, Azerbaijan Economic Trends, Brussels, quarterlysince 1998
IMF, Azerbaijan Republic: Recent Economic Developments, Washington, 2000
UN Development Programme, Azerbaijan Human Development Report, New York,annual
World Bank, Azerbaijan Financial Sector Review, New York, 1997
World Bank, Global Development Finance, annual
Audrey Altstadt, The Azerbaijani Turks: Power and Identity under RussianRule, 1992
J Aves, Post-Soviet Transcaucasia, Royal Institute of International Affairs,London, 1996
Ali Banuazizi & Myron Weiner (eds), The New Geopolitics of Central Asia and itsBorderlands, I B Tauris, London, 1994
Karen Dawisha & Bruce Parrott (eds), Conflict, Cleavage and Change in CentralAsia and the Caucasus, Cambridge University Press, 1997
Anoushiravan Ehteshami (ed), From the Gulf to Central Asia, ExeterUniversity, 1995
Suzanne Goldenberg, Pride of Small Nations: The Caucasus and Post-SovietDisorder, Zed Books, London, 1994
International Energy Agency, Caspian Oil and Gas, Paris, 1998
US Department of Commerce Business Information Service for the NewlyIndependent States (BISNIS),http://www.bisnis.doc.gov/bisnis/country/Azerbaijan.htm
United Nations Development Programme (UNDP), http://www.un-az.org/
Energy Information Administration, http://www.eia.doe.gov/emeu/cabs/azerbjan.html
State Statistical Committee of the Azerbaijan Republic, http://www.statcom.baku-az.com/
Inside World provides daily briefings of political and economic developments:http://www.insideworld.com
The Interstate Committee of the Commonwealth of Independent Statesprovides a range of annual and quarterly statistics, although analysis of thedata is not included: http://www.unece.org/stats/cisstat/mainpage.htm
Select bibliography
Selected websites

Azerbaijan 43
© The Economist Intelligence Unit Limited 2001 EIU Country Profile 2001
Reference tables
These reference tables provide the most up-to-date statistics available at the timeof publication
Reference table 1
Population
1996 1997 1998 1999 2000
Population (year-end; ‘000) 7,800 7,877 7,953 8,016 8,081
Annual growth (%) 0.96 0.99 0.96 0.79 0.81
Male (% of total population) 49.3 49.3 48.8 48.8 48.8
Female (% of total population) 50.7 50.7 51.2 51.2 51.2
Rural (% of total population) 48.0 48.2 49.0 49.0 49.0Urban (% of total population) 52.0 51.8 51.0 51.0 51.0
Birth rate (per ‘000 population) 17.1 17.4 15.7 14.9 14.6
Death rate (per ‘000 population) 6.4 6.2 5.9 5.9 5.9
Rate of natural increase (per ‘000 population) 10.7 11.2 9.8 9.0 8.7
Life expectancy at birth (years) 70.0 70.9 71.4 72.0 n/a
Infant mortality (per 1,000 live births) 19.9 19.6 16.6 16.5 12.6
Maternal mortality in childbirth (per 100,000 births) 44.1 31.0 41.1 43.4 37.6
Source: State Statistical Committee, Statistical Yearbook of Azerbaijan, 1999; TACIS, Azerbaijan Economic Trends.
Reference table 2
Population by age(‘000; year-end)
1994 1995 1996 1997 1998
Age (years) 0-14 2,538.8 2,569.0 2,556.8 2,582.1 2,605.915-19 680.2 687.9 707.2 714.2 720.820-39 2,585.5 2,612.5 2,628.7 2,654.5 2,678.840-59 1,168.6 1,178.7 1,206.5 1,218.3 1,229.760-69 440.1 444.7 459.7 464.3 468.570+ 230.3 233.4 240.9 243.3 245.6Total 7,643.5 7,726.2 7,799.8 7,876.7 7,953.3
Source: State Statistical Committee, Statistical Yearbook of Azerbaijan, 1999.
Reference table 3
Labour force(‘000 unless otherwise indicated)
1996 1997 1998 1999 2000a
Agriculture 1,172 1,071 1,139 1,267 1,567
Industry 283 242 251 255 259
Government 659 651 650 650 n/a
Other 1,572 1,730 1,661 1,530 n/a
Total employed 3,687 3,694 3,702 3,702 3,705
Labour force 4,193 4,232 4,248 4,300 n/a
continued

44 Azerbaijan
EIU Country Profile 2001 © The Economist Intelligence Unit Limited 2001
1996 1997 1998 1999 2000a
Registered unemployed 32 38 42 45 n/a % of labour force 0.8 0.9 1.0 1.0 n/a
Unemployed 506 538 546 598 n/a % of labour force 12.1 12.7 12.9 13.9 n/a
Working-age populationb 4,661 4,762 4,838 4,878 n/a % of total population 59.8 60.5 60.8 60.9 n/a
Pension claimants 1,245 1,206 1,177 1,202 n/a % of total population 16.0 15.3 14.8 15.0 n/a
a TACIS data. b IMF data.
Sources: IMF, Azerbaijan Republic: Recent Economic Developments and Selected Issues, 2000; TACIS, Azerbaijan Economic Trends.
Reference table 4
Production of energy(m tonnes unless otherwise indicated)
1996 1997 1998 1999 2000
Total oil production 9.1 9.1 11.4 13.8 14.0 SOCAR 9.1 9.1 9.1 9.0 n/a AIOC 0 0a 2.4 4.8 n/a of which: offshore oil production 7.5 7.5 9.7 12.3 12.5
Total oil production (‘000 b/d) 182.7 185.2 229.4 277.2 282.9
Gas production (bn cu metres) 6.3 6.0 5.6 6.0 5.7 SOCAR 6.3 6.0 5.2 5.8 n/a AIOC 0.0 0.0a 0.4 0.2 n/a of which: offshore gas production 6.1 5.7 5.3 5.8 5.4
Refined oil 8.7 8.6 8.3 7.9 8.2
Diesel 2.1 2.1 2.0 1.9 2.0
Petrol 1.0 1.1 0.6 0.4 0.5
Fuel oil 4.0 3.8 4.0 3.9 4.0
Lubricants 0.1 0.1 0.1 0.5 0.9
Electricity (bn kwh) 17.0 16.8 18.0 18.1 n/a
Thermal energy (m kcal) 5.0 3.3 n/a n/a n/a
a AIOC produced small quantities of oil and gas in 1997, when its output began.
Sources: SOCAR; Profile Analytical Centre, Baku; IMF, Azerbaijan Republic: Recent Economic Developments; TACIS, Azerbaijan EconomicTrends; State Statistical Committee, Statistical Yearbook of Azerbaijan, 1999.
Reference table 5
Gross domestic product
1996 1997 1998 1999 2000
TotalAt current prices (Manat bn) 13,663 15,791 17,203 18,927 23,566US$ ma 3,177 3,962 4,446 4,594 5,267Real change (%) 1.3 5.8 10.0 7.4 11.1
Per headAt current prices (Manat ‘000) 1,699 1,781 1,941 2,066 2,274US$a (market exchange rate) 409 506 562 575 654Real changea (%) 0.3 4.8 9.0 6.5 10.5
a EIU calculations.
Sources: TACIS, Azerbaijan Economic Trends; EIU calculations.
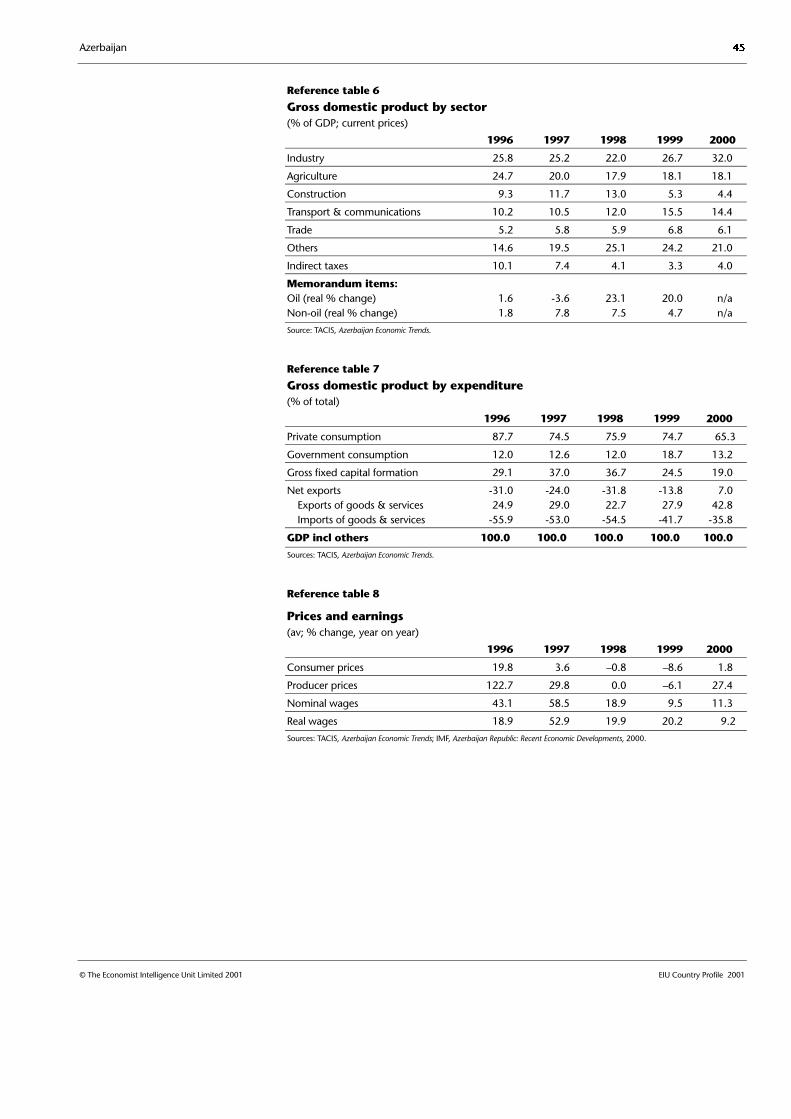
Azerbaijan 45
© The Economist Intelligence Unit Limited 2001 EIU Country Profile 2001
Reference table 6
Gross domestic product by sector(% of GDP; current prices)
1996 1997 1998 1999 2000
Industry 25.8 25.2 22.0 26.7 32.0
Agriculture 24.7 20.0 17.9 18.1 18.1
Construction 9.3 11.7 13.0 5.3 4.4
Transport & communications 10.2 10.5 12.0 15.5 14.4
Trade 5.2 5.8 5.9 6.8 6.1
Others 14.6 19.5 25.1 24.2 21.0
Indirect taxes 10.1 7.4 4.1 3.3 4.0
Memorandum items:Oil (real % change) 1.6 -3.6 23.1 20.0 n/a Non-oil (real % change) 1.8 7.8 7.5 4.7 n/a
Source: TACIS, Azerbaijan Economic Trends.
Reference table 7
Gross domestic product by expenditure(% of total)
1996 1997 1998 1999 2000
Private consumption 87.7 74.5 75.9 74.7 65.3
Government consumption 12.0 12.6 12.0 18.7 13.2
Gross fixed capital formation 29.1 37.0 36.7 24.5 19.0
Net exports -31.0 -24.0 -31.8 -13.8 7.0 Exports of goods & services 24.9 29.0 22.7 27.9 42.8 Imports of goods & services -55.9 -53.0 -54.5 -41.7 -35.8
GDP incl others 100.0 100.0 100.0 100.0 100.0
Sources: TACIS, Azerbaijan Economic Trends.
Reference table 8
Prices and earnings(av; % change, year on year)
1996 1997 1998 1999 2000
Consumer prices 19.8 3.6 –0.8 –8.6 1.8
Producer prices 122.7 29.8 0.0 –6.1 27.4
Nominal wages 43.1 58.5 18.9 9.5 11.3
Real wages 18.9 52.9 19.9 20.2 9.2
Sources: TACIS, Azerbaijan Economic Trends; IMF, Azerbaijan Republic: Recent Economic Developments, 2000.

46 Azerbaijan
EIU Country Profile 2001 © The Economist Intelligence Unit Limited 2001
Reference table 9
Consolidated operations of the general government, IMF series(Manat bn; % of GDP in brackets)
1995 1996 1997 1998 1999
Revenue 1,873.0 2,401.0 3,023.0 2,755.0 3,206.0(17.6) (17.6) (19.1) (17.0) (19.4)
Tax revenue 1,113.6 1943.0 2,665.0 2,466.2 2,732.0(12.2) (15.1) (17.3) (14.7) (14.9)
Income tax 117.0 213.0 331.0 408.0 448.0 (1.1) (1.6) (2.1) (2.5) (2.7)
Social security contributions 250 310 388 405 422(2.3) (2.3) (2.5) (2.5) (2.6)
Profit tax 409.0 586.0 444.0 327.0 368.0 (3.8) (4.3) (2.8) (2.0) (2.2)
Land & property tax 4.0 6.0 50.0 48.0 91.0(0.1) (0.1) (0.2) (0.3) (0.5)
VAT 176.0 468.0 654.0 719.2 791.0 (1.7) (3.4) (4.1) (4.4) (4.8)
Excises 88.6 206.0 222.0 95.0 114.0 (0.8) (1.5) (1.4) (0.6) (0.7)
Royalties 0.0 42.0 342.0 171.0 180.0 (0.0) (0.3) (2.2) (1.1) (1.1)
Customs 69.0 112.0 234.0 293.0 318.0(0.6) (0.8) (1.5) (1.8) (1.9)
Other revenue 760.0 459.0 359.0 289.0 475.0 (7.1) (3.4) (2.3) (1.8) (2.9)
Expenditure incl net lending 2,396.0 2,780.0 3,280.0 3,430.0 4,105.0 (18.7) (19.7) (20.2) (20.4) (22.2)
of which: Wages & salaries 390.0 483.0 701.0 813.0 959.0
(3.7) (3.5) (4.4) (5.0) (5.8) Purchases of goods & services 732.0 944.0 1,161.0 943.0 1,036.0
(6.9) (6.9) (7.4) (5.8) (6.3) Interest payments 11.0 44.0 19.0 17.0 24.0
(0.1) (0.3) (0.1) (0.1) (0.1) Transfers to households 539.0 872.0 984.0 1,096.0 1,335
(5.1) (6.4) (6.2) (6.8) (8.1) Subsidies 233.0 285.0 106.0 20.0 19.0
(2.2) (2.1) (0.7) (0.1) (0.1) Other current expenditure 8.0 0.0 17.0 12.0 27.0
(0.1) (0.0) (0.1) (0.1) (0.2) Capital investment 79.0 68.0 201.0 185.0 261.0
(0.7) (0.5) (1.3) (1.1) (1.6) Other 0.0 1.0 0.0 214.0 -8.0
(0.0) (0.0) (0.0) (1.3) (0.0)
Foreign financed project spending 404.0 83.0 92.0 130.0 452.0(3.8) (0.6) (0.6) (0.8) (2.7)
of which net lending 404.0 83.0 92.0 130.0 406.0
(3.8) (0.6) (0.6) (0.8) (2.5)
Overall fiscal balance –523.0 –379.0 –257.0 –675.0 –895.0(–4.9) (–2.8) (–1.6) (–4.2) (–5.4)
Memorandum item: Nominal GDPa 10,669.0 13,663.0 15,791.0 16,177.0 16,489.0 a IMF data differ from Azerbaijan Economic Trends.Source: IMF, Azerbaijan Republic: Recent Economic Developments and Selected Issues, 2000.

Azerbaijan 47
© The Economist Intelligence Unit Limited 2001 EIU Country Profile 2001
Reference table 10
Money supply and credit(Manat bn unless otherwise indicated; end-period)
1996 1997 1998 1999 2000
Domestic credit 1,780.1 2,046.2 2,226.9 1,995.8 2,265.4
Money (M1) 1,119.7 1,524.1 1,183.3 1,390.1 1,156.8
Broad money (M3) 1,538.5 2,175.9 1,845.7 2,216.2 3,843.1
Memorandum items (% change, year on year):Domestic credit 33.0 14.9 8.8 –10.4 13.5Money (M1) 30.4 36.1 –22.4 17.5 –16.8Broad money (M3) 17.1 41.4 –15.2 20.1 73.4Consumer prices 19.8 3.6 –0.8 –8.6 1.8
Note. M1 is cash in circulation (M0) plus demand deposits of firms and households. M2 is M1 plustime deposits of firms and households. M3 is M2 plus the foreign-currency deposits of firms andhouseholds.
Sources: IMF, International Financial Statistics; EIU calculations for percentage change.
Reference table 11
Production of major crops(‘000 tonnes unless otherwise indicated)
1996 1997 1998 1999 2000
Cereals 1,018.3 1,127.1 950.3 1,098.3 1,540.2
Cotton 274.4 124.6 112.6 96.8 91.5
Tobacco 11.2 15.1 15.2 8.6 17.3
Potatoes 214.6 223.4 312.5 394.1 469.0
Other vegetables 570.0 495.4 502.3 670.8 780.8
Grapes 275.0 145.3 144.2 112.5 76.8
Tea 3.0 1.6 0.9 2.7 1.1
Gross agricultural output (% real change) 3.1 –6.9 3.9 7.1 12.1
Source: TACIS, Azerbaijan Economic Trends.
Reference table 12
Yields of major crops(tonnes/ha)
1996 1997 1998 1999 2000
Cereals 1.6 1.7 1.6 2.1 2.4
Cotton 1.3 0.6 0.7 1.0 0.9
Tobacco 1.4 1.9 1.8 1.9 2.2
Potatoes 10.1 8.3 9.5 9.5 8.4
Other vegetables 17.8 15.6 14.0 13.7 13.3
Grapes 3.5 2.2 3.2 3.6 3.8
Tea 0.4 0.2 0.1 0.5 0.2
Source: TACIS, Azerbaijan Economic Trends.
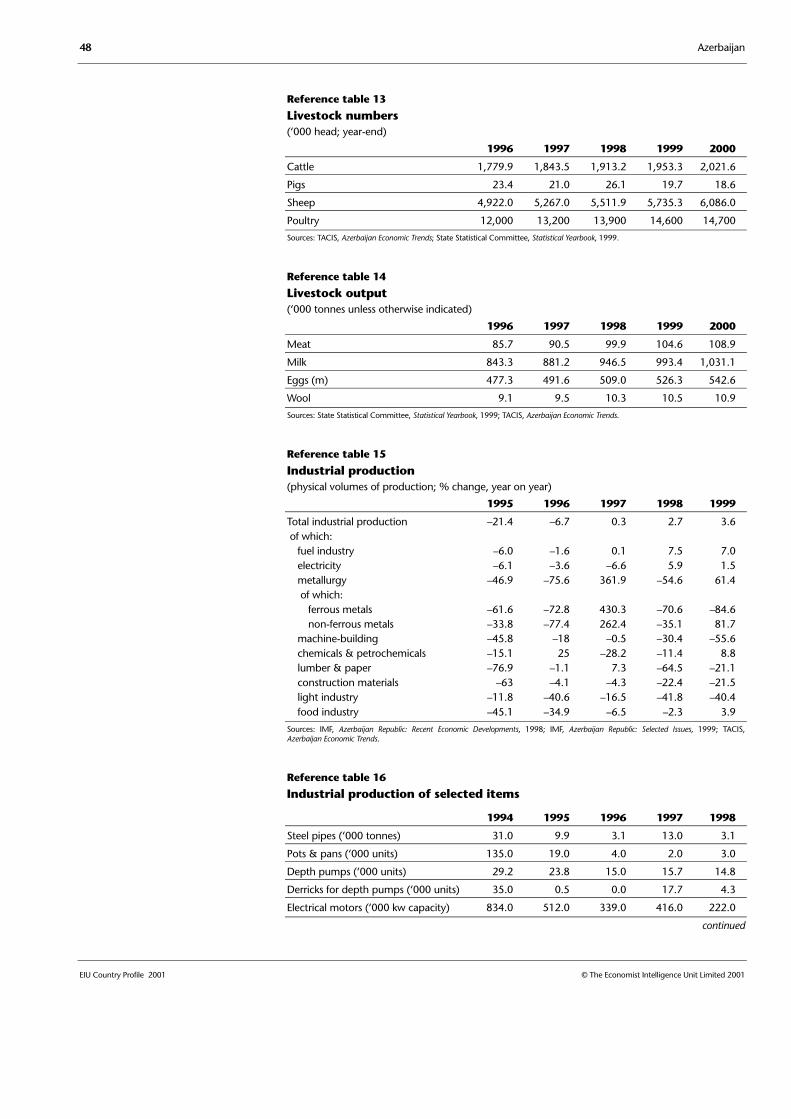
48 Azerbaijan
EIU Country Profile 2001 © The Economist Intelligence Unit Limited 2001
Reference table 13
Livestock numbers(‘000 head; year-end)
1996 1997 1998 1999 2000
Cattle 1,779.9 1,843.5 1,913.2 1,953.3 2,021.6
Pigs 23.4 21.0 26.1 19.7 18.6
Sheep 4,922.0 5,267.0 5,511.9 5,735.3 6,086.0
Poultry 12,000 13,200 13,900 14,600 14,700
Sources: TACIS, Azerbaijan Economic Trends; State Statistical Committee, Statistical Yearbook, 1999.
Reference table 14
Livestock output(‘000 tonnes unless otherwise indicated)
1996 1997 1998 1999 2000
Meat 85.7 90.5 99.9 104.6 108.9
Milk 843.3 881.2 946.5 993.4 1,031.1
Eggs (m) 477.3 491.6 509.0 526.3 542.6
Wool 9.1 9.5 10.3 10.5 10.9
Sources: State Statistical Committee, Statistical Yearbook, 1999; TACIS, Azerbaijan Economic Trends.
Reference table 15
Industrial production(physical volumes of production; % change, year on year)
1995 1996 1997 1998 1999
Total industrial production –21.4 –6.7 0.3 2.7 3.6 of which: fuel industry –6.0 –1.6 0.1 7.5 7.0 electricity –6.1 –3.6 –6.6 5.9 1.5 metallurgy –46.9 –75.6 361.9 –54.6 61.4 of which: ferrous metals –61.6 –72.8 430.3 –70.6 –84.6 non-ferrous metals –33.8 –77.4 262.4 –35.1 81.7 machine-building –45.8 –18 –0.5 –30.4 –55.6 chemicals & petrochemicals –15.1 25 –28.2 –11.4 8.8 lumber & paper –76.9 –1.1 7.3 –64.5 –21.1 construction materials –63 –4.1 –4.3 –22.4 –21.5 light industry –11.8 –40.6 –16.5 –41.8 –40.4 food industry –45.1 –34.9 –6.5 –2.3 3.9
Sources: IMF, Azerbaijan Republic: Recent Economic Developments, 1998; IMF, Azerbaijan Republic: Selected Issues, 1999; TACIS,Azerbaijan Economic Trends.
Reference table 16
Industrial production of selected items
1994 1995 1996 1997 1998
Steel pipes (‘000 tonnes) 31.0 9.9 3.1 13.0 3.1
Pots & pans (‘000 units) 135.0 19.0 4.0 2.0 3.0
Depth pumps (‘000 units) 29.2 23.8 15.0 15.7 14.8
Derricks for depth pumps (‘000 units) 35.0 0.5 0.0 17.7 4.3
Electrical motors (‘000 kw capacity) 834.0 512.0 339.0 416.0 222.0
continued
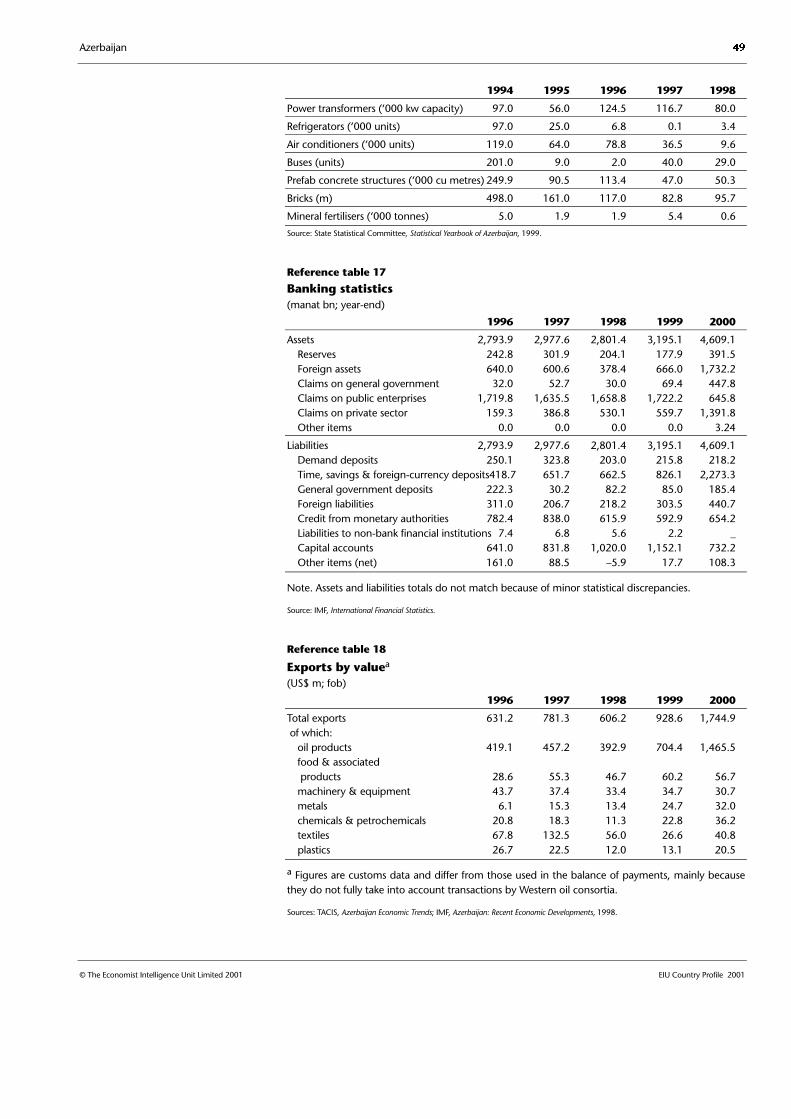
Azerbaijan 49
© The Economist Intelligence Unit Limited 2001 EIU Country Profile 2001
1994 1995 1996 1997 1998
Power transformers (‘000 kw capacity) 97.0 56.0 124.5 116.7 80.0
Refrigerators (‘000 units) 97.0 25.0 6.8 0.1 3.4
Air conditioners (‘000 units) 119.0 64.0 78.8 36.5 9.6
Buses (units) 201.0 9.0 2.0 40.0 29.0
Prefab concrete structures (‘000 cu metres) 249.9 90.5 113.4 47.0 50.3
Bricks (m) 498.0 161.0 117.0 82.8 95.7
Mineral fertilisers (‘000 tonnes) 5.0 1.9 1.9 5.4 0.6
Source: State Statistical Committee, Statistical Yearbook of Azerbaijan, 1999.
Reference table 17
Banking statistics(manat bn; year-end)
1996 1997 1998 1999 2000
Assets 2,793.9 2,977.6 2,801.4 3,195.1 4,609.1 Reserves 242.8 301.9 204.1 177.9 391.5 Foreign assets 640.0 600.6 378.4 666.0 1,732.2 Claims on general government 32.0 52.7 30.0 69.4 447.8 Claims on public enterprises 1,719.8 1,635.5 1,658.8 1,722.2 645.8 Claims on private sector 159.3 386.8 530.1 559.7 1,391.8 Other items 0.0 0.0 0.0 0.0 3.24
Liabilities 2,793.9 2,977.6 2,801.4 3,195.1 4,609.1 Demand deposits 250.1 323.8 203.0 215.8 218.2 Time, savings & foreign-currency deposits418.7 651.7 662.5 826.1 2,273.3 General government deposits 222.3 30.2 82.2 85.0 185.4 Foreign liabilities 311.0 206.7 218.2 303.5 440.7 Credit from monetary authorities 782.4 838.0 615.9 592.9 654.2 Liabilities to non-bank financial institutions 7.4 6.8 5.6 2.2 _ Capital accounts 641.0 831.8 1,020.0 1,152.1 732.2 Other items (net) 161.0 88.5 –5.9 17.7 108.3
Note. Assets and liabilities totals do not match because of minor statistical discrepancies.
Source: IMF, International Financial Statistics.
Reference table 18
Exports by valuea
(US$ m; fob)
1996 1997 1998 1999 2000
Total exports 631.2 781.3 606.2 928.6 1,744.9 of which: oil products 419.1 457.2 392.9 704.4 1,465.5 food & associated products 28.6 55.3 46.7 60.2 56.7 machinery & equipment 43.7 37.4 33.4 34.7 30.7 metals 6.1 15.3 13.4 24.7 32.0 chemicals & petrochemicals 20.8 18.3 11.3 22.8 36.2 textiles 67.8 132.5 56.0 26.6 40.8 plastics 26.7 22.5 12.0 13.1 20.5
a Figures are customs data and differ from those used in the balance of payments, mainly becausethey do not fully take into account transactions by Western oil consortia.
Sources: TACIS, Azerbaijan Economic Trends; IMF, Azerbaijan: Recent Economic Developments, 1998.
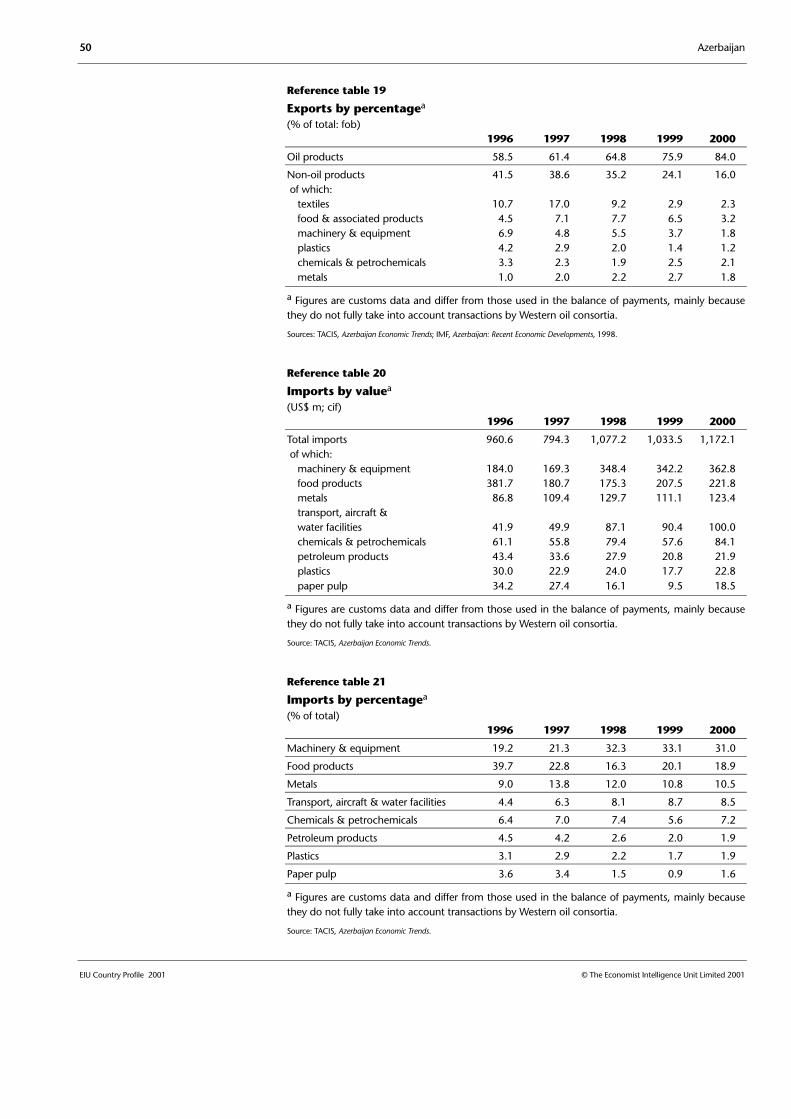
50 Azerbaijan
EIU Country Profile 2001 © The Economist Intelligence Unit Limited 2001
Reference table 19
Exports by percentagea
(% of total: fob)1996 1997 1998 1999 2000
Oil products 58.5 61.4 64.8 75.9 84.0
Non-oil products 41.5 38.6 35.2 24.1 16.0 of which: textiles 10.7 17.0 9.2 2.9 2.3 food & associated products 4.5 7.1 7.7 6.5 3.2 machinery & equipment 6.9 4.8 5.5 3.7 1.8 plastics 4.2 2.9 2.0 1.4 1.2 chemicals & petrochemicals 3.3 2.3 1.9 2.5 2.1 metals 1.0 2.0 2.2 2.7 1.8
a Figures are customs data and differ from those used in the balance of payments, mainly becausethey do not fully take into account transactions by Western oil consortia.
Sources: TACIS, Azerbaijan Economic Trends; IMF, Azerbaijan: Recent Economic Developments, 1998.
Reference table 20
Imports by valuea
(US$ m; cif)1996 1997 1998 1999 2000
Total imports 960.6 794.3 1,077.2 1,033.5 1,172.1 of which: machinery & equipment 184.0 169.3 348.4 342.2 362.8 food products 381.7 180.7 175.3 207.5 221.8 metals 86.8 109.4 129.7 111.1 123.4 transport, aircraft & water facilities 41.9 49.9 87.1 90.4 100.0 chemicals & petrochemicals 61.1 55.8 79.4 57.6 84.1 petroleum products 43.4 33.6 27.9 20.8 21.9 plastics 30.0 22.9 24.0 17.7 22.8 paper pulp 34.2 27.4 16.1 9.5 18.5
a Figures are customs data and differ from those used in the balance of payments, mainly becausethey do not fully take into account transactions by Western oil consortia.
Source: TACIS, Azerbaijan Economic Trends.
Reference table 21
Imports by percentagea
(% of total)1996 1997 1998 1999 2000
Machinery & equipment 19.2 21.3 32.3 33.1 31.0
Food products 39.7 22.8 16.3 20.1 18.9
Metals 9.0 13.8 12.0 10.8 10.5
Transport, aircraft & water facilities 4.4 6.3 8.1 8.7 8.5
Chemicals & petrochemicals 6.4 7.0 7.4 5.6 7.2
Petroleum products 4.5 4.2 2.6 2.0 1.9
Plastics 3.1 2.9 2.2 1.7 1.9
Paper pulp 3.6 3.4 1.5 0.9 1.6
a Figures are customs data and differ from those used in the balance of payments, mainly becausethey do not fully take into account transactions by Western oil consortia.
Source: TACIS, Azerbaijan Economic Trends.

Azerbaijan 51
© The Economist Intelligence Unit Limited 2001 EIU Country Profile 2001
Reference table 22
Exports by destinationa
(% of total)
1996 1997 1998 1999 2000
CIS total 46.0 48.4 38.3 22.7 13.5 of which: Russia 17.6 23.1 17.5 8.9 5.6 Georgia 14.5 17.1 12.7 7.7 4.3 Ukraine 3.5 4.1 2.0 2.6 1.4 Turkmenistan 5.4 1.1 2.3 1.0 0.5 Kazakhstan 2.4 1.1 1.7 0.4 0.4
Non-CIS total 54.0 51.6 61.7 77.3 86.5 of which: Italy 1.6 4.2 7.4 33.7 43.7 France 0.1 0.0 1.9 6.3 11.8 Turkey 6.2 5.3 22.4 7.4 6.0 US 0.8 0.3 2.3 3.2 0.5 Iran 35.8 24.3 7.3 2.4 0.4
a Figures are customs data and differ from those used in the balance of payments, mainly becausethey do not fully take into account transactions by Western oil consortia.
Source: TACIS, Azerbaijan Economic Trends.
Reference table 23
Imports by country of origina
(% of total)
1996 1997 1998 1999 2000
CIS total 35.4 44.2 37.6 31.4 32.0 of which: Russia 16.5 19.1 18.0 21.9 21.3 Ukraine 9.8 10.8 8.6 3.7 3.1 Kazakhstan 2.0 3.7 4.1 2.4 4.9 Georgia 2.9 4.6 2.3 0.9 0.9 Turkmenistan 1.5 3.2 2.4 1.2 0.8
Non-CIS total 64.6 55.8 62.4 68.6 68.0 of which: Turkey 22.5 22.6 20.4 13.8 11.0 US 1.8 2.8 3.7 8.0 8.9 UK 1.5 1.8 6.4 6.5 5.0 Japan 0.3 0.1 0.0 5.4 1.4 Iran 6.9 6.1 4.0 4.6 4.8 Germany 8.0 4.9 4.3 4.5 5.8 UAE 11.3 5.3 4.2 1.2 1.7
a Figures are customs data and differ from those used in the balance of payments, mainly becausethey do not fully take into account transactions by Western oil consortia.
Source: TACIS, Azerbaijan Economic Trends.
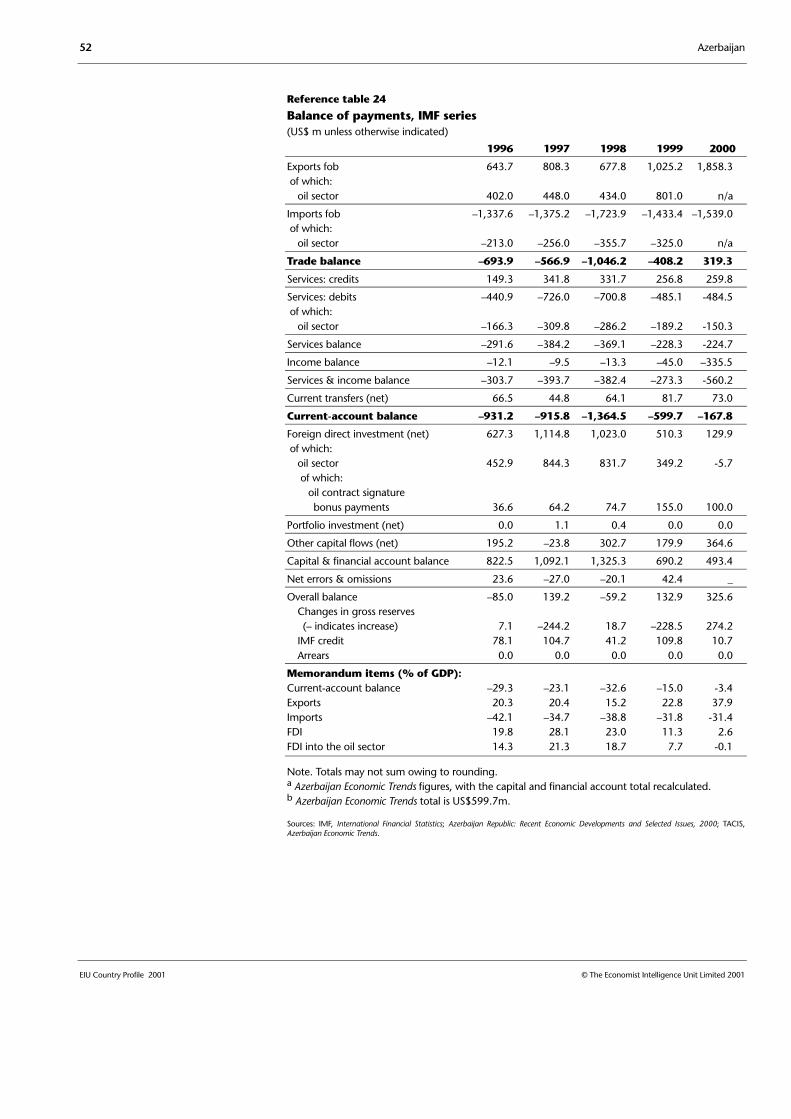
52 Azerbaijan
EIU Country Profile 2001 © The Economist Intelligence Unit Limited 2001
Reference table 24
Balance of payments, IMF series(US$ m unless otherwise indicated)
1996 1997 1998 1999 2000
Exports fob 643.7 808.3 677.8 1,025.2 1,858.3 of which: oil sector 402.0 448.0 434.0 801.0 n/a
Imports fob –1,337.6 –1,375.2 –1,723.9 –1,433.4 –1,539.0 of which: oil sector –213.0 –256.0 –355.7 –325.0 n/a
Trade balance –693.9 –566.9 –1,046.2 –408.2 319.3
Services: credits 149.3 341.8 331.7 256.8 259.8
Services: debits –440.9 –726.0 –700.8 –485.1 -484.5 of which: oil sector –166.3 –309.8 –286.2 –189.2 -150.3
Services balance –291.6 –384.2 –369.1 –228.3 -224.7
Income balance –12.1 –9.5 –13.3 –45.0 –335.5
Services & income balance –303.7 –393.7 –382.4 –273.3 -560.2
Current transfers (net) 66.5 44.8 64.1 81.7 73.0
Current-account balance –931.2 –915.8 –1,364.5 –599.7 –167.8
Foreign direct investment (net) 627.3 1,114.8 1,023.0 510.3 129.9 of which: oil sector 452.9 844.3 831.7 349.2 -5.7 of which: oil contract signature bonus payments 36.6 64.2 74.7 155.0 100.0
Portfolio investment (net) 0.0 1.1 0.4 0.0 0.0
Other capital flows (net) 195.2 –23.8 302.7 179.9 364.6
Capital & financial account balance 822.5 1,092.1 1,325.3 690.2 493.4
Net errors & omissions 23.6 –27.0 –20.1 42.4 _
Overall balance –85.0 139.2 –59.2 132.9 325.6 Changes in gross reserves (– indicates increase) 7.1 –244.2 18.7 –228.5 274.2 IMF credit 78.1 104.7 41.2 109.8 10.7 Arrears 0.0 0.0 0.0 0.0 0.0
Memorandum items (% of GDP):Current-account balance –29.3 –23.1 –32.6 –15.0 -3.4 Exports 20.3 20.4 15.2 22.8 37.9 Imports –42.1 –34.7 –38.8 –31.8 -31.4 FDI 19.8 28.1 23.0 11.3 2.6 FDI into the oil sector 14.3 21.3 18.7 7.7 -0.1
Note. Totals may not sum owing to rounding.a Azerbaijan Economic Trends figures, with the capital and financial account total recalculated.b Azerbaijan Economic Trends total is US$599.7m.
Sources: IMF, International Financial Statistics; Azerbaijan Republic: Recent Economic Developments and Selected Issues, 2000; TACIS,Azerbaijan Economic Trends.

Azerbaijan 53
© The Economist Intelligence Unit Limited 2001 EIU Country Profile 2001
Reference table 25
External debt, World Bank series(US$ m unless otherwise indicated; debt stocks as at year-end)
1995 1996 1997 1998 1999
Public medium- & long-term 206.1 247.9 235.9 313.1 493.3
Private medium- & long-term 0 0 0 72.3 106.5
Total medium- & long-term debt 206.1 247.8 235.9 385.4 599.8 Official creditors 206.1 247.8 227.8 307.7 449.2 Bilateral 107.3 110.3 75.9 108.3 165.9 Multilateral 98.8 137.5 151.9 199.4 283.3 Private creditors 0 0 8.1 77.7 150.6
Short-term debt 14.0 15.5 4.0 1.5 29.0 of which: interest arrears 6.0 2.5 0.0 0.0 0.0
Use of IMF credit 100.9 175.0 266.8 321.2 407.3
Total external debt 321.0 438.3 506.7 708.2 1,036.1
Principal repayments 0 0 57.6 2.7 57.6
Interest payments 10.1 9.8 20.2 21.1 27.9
Total debt service 10.1 9.8 77.9 23.8 85.5
Ratios (%)Total external debt/GDP 13.3 13.8 12.8 16.9 25.9Debt-service ratio, paida 0.0 0.0 1.5 0.1 1.4
Note. Long-term debt is defined as having original maturity of more than one year.a Debt service as a percentage of earnings from exports of goods and services.
Source: World Bank, Global Development Finance.
Reference table 26
Foreign reserves(US$ m unless otherwise indicated; end-period)
1996 1997 1998 1999 2000
Total international reserves excl gold 211.3 466.1 447.3 672.6 679.6
Gold (valued at 75% of 4 Qtr London price) 0.0 0.0 0.0 0.0 0.0
Total reserves incl gold 211.3 466.1 447.3 672.6 679.6
Memorandum items:Gold (national valuation) 2.4 1.4 1.4 – –Gold (m fine troy oz) 0.0 0.0 0.0 0.0 0.0
Source: IMF, International Financial Statistics.
Reference table 27
Exchange rates(Manat per unit of currency unless otherwise indicated; annual averages)
1996 1997 1998 1999 2000
US$ 4,301.3 3,985.4 3,869.0 4,120.2 4,474.2
£ 6,710.7 6,524.5 6,407.5 6,668.0
Rb 839.96 688.94 398.66 167.39
Source: IMF, International Financial Statistics.
Editors: Leila Butt (editor); Stuart Hensel (consulting editor)Editorial closing date: November 20th 2001
All queries: Tel: (44.20) 7830 1007 E-mail: [email protected]