Axisymmetric numerical simulation of plastic damage in aluminum alloy induced by long pulsed laser
7
Axisymmetric numerical simulation of plastic damage in aluminum alloy induced by long pulsed laser Yuan Qin a , Yanbei Chen a , Xiaowu Ni a, , Zhonghua Shen a , Juan Bi b , Xihe Zhang b a Department of Applied Physics, Nanjing University of Science and Technology, Nanjing 210094, People’s Republic of China b School of Science, Changchun University of Science and Technology, Changchun 130022, People’s Republic of China article info Article history: Received 3 May 2009 Received in revised form 15 August 2009 Accepted 12 October 2009 Available online 10 November 2009 Keywords: Long pulsed laser Thermal stress Plastic damage abstract An axisymmetric mathematical model was established for long pulsed Nd:YAG laser heating of a 2024 aluminum alloy plate. The temperature and thermal stress in the plate were obtained by using the finite element method. In particular, the plastic damage induced by thermal stress was investigated. Meanwhile, the influence of laser intensity distribution (Gaussian and top hat) on the plastic damage was also considered. The results indicate that the plastic damage occurs in the top layer of the plate, where the residual radial stress is tensile and can even reach 250 MPa, approximately. In addition, the plastic damage for the top hat beam judged by the yield time, the range of plastic damage region and the magnitude of residual radial stress is severer than that of the Gaussian beam. & 2009 Elsevier Ltd. All rights reserved. 1. Introduction Thermal stress will be generated in a metallic material when irradiated by a laser beam. As known, the plastic damage will occur once the thermal stress reaches the yield strength of the metal. After the laser heating, residual stress will exist in the plastic damage region. The 2024 alloy aluminum is an aerospace material with superior fatigue crack propagation resistance [1]. Its fatigue life will be shortened if tensile residual stress exists [2]. Nowadays, lasers are developing in two main directions: high peak power and large energy. As expected, the thermal stresses induced by these two kinds of lasers are different. Zhang et al. [3] indicated that the maximum tensile residual stress was about 600MPa in an AISI1010 low carbon steel work piece after it was scanned by a continuous-wave (CW) laser with power 800 W. Chen et al. [4] investigated the plastic penetration in a 2024 alloy plate irradiated by a 20 kW CW laser numerically. Based on the assumption that yield strength is almost equal to residual stress [5], the maximum residual stress in his research is about 150MPa. Hsieh and Lin [6] concluded that a 304 stainless steel sheet began to yield after it was irradiated for 5.8 ms by a CO 2 laser with power 300 W, and the maximum residual stress of the sheet was 240 MPa. Chen et al. [7] pointed out that the maximum residual stress was more than 1 GPa in a 301 stainless steel sheet target after a short pulsed laser heating, whose magnitude of power intensity was in the order 10 6 W/cm 2 . Similar order of residual stress which was induced by short pulsed laser was also obtained by Zhang and Xu [8]. It can be seen that laser parameters, especially the power intensity, affect plastic damage greatly. Higher magnitude of residual stress is induced by short pulsed laser with high power intensity than by CW laser. However, high power intensity laser will lead to air breakdown when it transmits in the atmosphere. Plasma will absorb the laser energy and be opaque to the laser beam [9]. Thus, it is difficult for high power intensity laser to cause plastic damage to a remote target. The power intensity of long-pulsed laser with milliseconds pulse width is medium. The plastic damage caused by the long pulsed laser might be severer than that of the CW laser with low power intensity, and air breakdown will hardly occur during the laser transmission. Consequently, the long pulsed laser might be an ideal tool to cause the plastic damage. Till date, only a few researchers have investigated the thermal effect induced by milliseconds pulsed laser such as fusion and vaporization [10,11]. In this study, the plastic damage in a 2024 aluminum alloy plate induced by long pulsed laser was investigated. An axisymmetric mathematical model was established for the laser-metal interac- tion and based on this, numerical solution of temperature and of thermal stress were obtained by using the finite element method (FEM). For the sake of verification, the FEM results of temperature were compared with the analytical solutions. Moreover, the yield time, the range of plastic damage region and the magnitude of residual radial stress were indicated and applied to judge the plastic damage effect. Besides, the plastic damage for the Gaussian beam and the top hat beam were compared. 2. Mathematical model The schematic view of a 2024 aluminum alloy plate irradiated by Nd:YAG long pulsed laser is shown in Fig. 1 . The plate is finite ARTICLE IN PRESS Contents lists available at ScienceDirect journal homepage: www.elsevier.com/locate/optlaseng Optics and Lasers in Engineering 0143-8166/$ -see front matter & 2009 Elsevier Ltd. All rights reserved. doi:10.1016/j.optlaseng.2009.10.006 Corresponding author. Tel.: +8602584315013. E-mail address: [email protected] (X. Ni). Optics and Lasers in Engineering 48 (2010) 361–367
Transcript of Axisymmetric numerical simulation of plastic damage in aluminum alloy induced by long pulsed laser

ARTICLE IN PRESS
Optics and Lasers in Engineering 48 (2010) 361–367
Contents lists available at ScienceDirect
Optics and Lasers in Engineering
0143-81
doi:10.1
� Corr
E-m
journal homepage: www.elsevier.com/locate/optlaseng
Axisymmetric numerical simulation of plastic damage in aluminum alloyinduced by long pulsed laser
Yuan Qin a, Yanbei Chen a, Xiaowu Ni a,�, Zhonghua Shen a, Juan Bi b, Xihe Zhang b
a Department of Applied Physics, Nanjing University of Science and Technology, Nanjing 210094, People’s Republic of Chinab School of Science, Changchun University of Science and Technology, Changchun 130022, People’s Republic of China
a r t i c l e i n f o
Article history:
Received 3 May 2009
Received in revised form
15 August 2009
Accepted 12 October 2009Available online 10 November 2009
Keywords:
Long pulsed laser
Thermal stress
Plastic damage
66/$ - see front matter & 2009 Elsevier Ltd. A
016/j.optlaseng.2009.10.006
esponding author. Tel.: +86 02584315013.
ail address: [email protected] (X. Ni).
a b s t r a c t
An axisymmetric mathematical model was established for long pulsed Nd:YAG laser heating of a 2024
aluminum alloy plate. The temperature and thermal stress in the plate were obtained by using the finite
element method. In particular, the plastic damage induced by thermal stress was investigated.
Meanwhile, the influence of laser intensity distribution (Gaussian and top hat) on the plastic damage
was also considered. The results indicate that the plastic damage occurs in the top layer of the plate,
where the residual radial stress is tensile and can even reach 250 MPa, approximately. In addition, the
plastic damage for the top hat beam judged by the yield time, the range of plastic damage region and
the magnitude of residual radial stress is severer than that of the Gaussian beam.
& 2009 Elsevier Ltd. All rights reserved.
1. Introduction
Thermal stress will be generated in a metallic material whenirradiated by a laser beam. As known, the plastic damage willoccur once the thermal stress reaches the yield strength of themetal. After the laser heating, residual stress will exist in theplastic damage region. The 2024 alloy aluminum is an aerospacematerial with superior fatigue crack propagation resistance [1]. Itsfatigue life will be shortened if tensile residual stress exists [2].
Nowadays, lasers are developing in two main directions: highpeak power and large energy. As expected, the thermal stressesinduced by these two kinds of lasers are different. Zhang et al. [3]indicated that the maximum tensile residual stress was about600 MPa in an AISI1010 low carbon steel work piece after it wasscanned by a continuous-wave (CW) laser with power 800 W.Chen et al. [4] investigated the plastic penetration in a 2024 alloyplate irradiated by a 20 kW CW laser numerically. Based on theassumption that yield strength is almost equal to residual stress[5], the maximum residual stress in his research is about 150 MPa.Hsieh and Lin [6] concluded that a 304 stainless steel sheet beganto yield after it was irradiated for 5.8 ms by a CO2 laser with power300 W, and the maximum residual stress of the sheet was240 MPa. Chen et al. [7] pointed out that the maximum residualstress was more than 1 GPa in a 301 stainless steel sheet targetafter a short pulsed laser heating, whose magnitude of powerintensity was in the order 106 W/cm2. Similar order of residualstress which was induced by short pulsed laser was also obtainedby Zhang and Xu [8]. It can be seen that laser parameters,
ll rights reserved.
especially the power intensity, affect plastic damage greatly.Higher magnitude of residual stress is induced by short pulsedlaser with high power intensity than by CW laser. However, highpower intensity laser will lead to air breakdown when it transmitsin the atmosphere. Plasma will absorb the laser energy and beopaque to the laser beam [9]. Thus, it is difficult for high powerintensity laser to cause plastic damage to a remote target.
The power intensity of long-pulsed laser with millisecondspulse width is medium. The plastic damage caused by the longpulsed laser might be severer than that of the CW laser with lowpower intensity, and air breakdown will hardly occur during thelaser transmission. Consequently, the long pulsed laser might bean ideal tool to cause the plastic damage. Till date, only a fewresearchers have investigated the thermal effect induced bymilliseconds pulsed laser such as fusion and vaporization [10,11].In this study, the plastic damage in a 2024 aluminum alloy plateinduced by long pulsed laser was investigated. An axisymmetricmathematical model was established for the laser-metal interac-tion and based on this, numerical solution of temperature and ofthermal stress were obtained by using the finite element method(FEM). For the sake of verification, the FEM results of temperaturewere compared with the analytical solutions. Moreover, the yieldtime, the range of plastic damage region and the magnitude ofresidual radial stress were indicated and applied to judge theplastic damage effect. Besides, the plastic damage for the Gaussianbeam and the top hat beam were compared.
2. Mathematical model
The schematic view of a 2024 aluminum alloy plate irradiatedby Nd:YAG long pulsed laser is shown in Fig. 1. The plate is finite

ARTICLE IN PRESS
Nomenclature
A absorptivitya0 beam radius (m)[B] element geometric matrixcp specific heat (J/kg K)[C] heat capacity matrixD thermal diffusivity (m2/s)[D]e elastic matrix[D]ep elastic–plastic matrixE elastic modulus (GPa){Fth} element thermal load vectorH thickness (m)H0 hardening modulus (GPa)I laser power intensity (W/m2)J0, J1 Bessel functionsk thermal conductivity (W/m K)[K] element stiffness matrix[K]th heat conduction matrix{Q} heat source vector
R radius (m)Dt time interval (s)T temperature (K)T0 ambient temperature (K){T} temperature vectorf _T g temperature rise rate vector{U} displacement vectora thermal expansion coefficient (10�5 K-1){a} thermal expansion coefficient vector{e} strain vector{Dee} elastic strain increment vector{Dep} plastic strain increment vector{Deth} thermal expansion vector{De} total strain increment vectorm Poisson’s ratior density (kg/m3)s equivalent stress (MPa)s0.2 yield strength (MPa){Ds} stress increment vectort pulse width (ms)
Y. Qin et al. / Optics and Lasers in Engineering 48 (2010) 361–367362
with radius R and thickness H. To make the problem manageable,six assumptions were made: (1) laser energy was absorbed by thetop surface of the plate; (2) no phase change happened; (3) theplate was homogeneous and isotropic; (4) the initial temperaturewas uniform and equal to the ambient temperature; (5) the plateis large enough such that heat energy will not transfer to itsboundary during laser irradiation; and (6) the end of the bottomsurface of the plate was clamped. The roz plane was taken as thecalculation plane due to the axial symmetry of the plate in thecylindrical coordinates as shown in Fig. 1. The thermal conductionequation in this plane can be written as [12]
rcp@Tðr; z; tÞ
@t¼
1
r
@
@rrk@Tðr; z; tÞ
@r
� �þ@
@zk@Tðr; z; tÞ
@z
� �ð1Þ
where T is the transient temperature at (r, z, t), r, cp and k are thedensity, specific heat and thermal conductivity of the material,respectively. The boundary conditions are:
�k@Tðr; z; tÞ
@z z ¼ 0 ¼ AIðr; tÞ�� ð2Þ
�k@Tðr; z; tÞ
@z z ¼ H ¼ � k@Tðr; z; tÞ
@r r ¼ R ¼ 0j
���� ð3Þ
where A and I(r, t) are the absorptivity and laser intensity,respectively. Besides, there is no heat flux transfer along the radial
Laser beam
r
z
H
Aluminum alloy plate
R
oTop surface
Bottom surface
Fig. 1. Schematic diagram of long pulsed laser irradiation.
direction on the z-axis in the case of the axisymmetric model:
�k@Tðr; z; tÞ
@r r ¼ 0 ¼ 0j ð4Þ
The initial condition is
Tðr; z;0Þ ¼ T0 ð5Þ
where T0 is the ambient temperature. As is known, the intensity oflaser output beam in the fundamental TEM00 mode is Gaussianover beam’s cross section. A uniform laser beam called top hat orflattop is also needed in many applications [13,14]. Top hat beamcan be transformed from Gaussian beam by some methods.Ideally, the intensity distribution of the Gaussian beam can beexpressed as
IGðr; tÞ ¼ IG0 exp �r2
a20
!gðtÞ ð6Þ
The intensity distribution of the top hat beam can be written as
ITðr; tÞ ¼IT0gðtÞ; 0rrra0
0; r4a0
(ð7Þ
Here,
gðtÞ ¼1;0otrt0; t4t
(ð8Þ
where a0 and t are beam radius and pulse width, respectively. Toestimate the influence of intensity distribution on plastic damage,the output energy, pulse width and beam radius are the same forthe two laser beams. The total energy of a single laser pulse isgiven by
EG ¼ IG0pa20t¼ ET ð9Þ
Consequently, IG0 equals to IT0.In our calculation, laser pulse width is 1 ms, beam radius is
1�10�3 m and laser power intensity I0 is 1.7�109 W/m2. More-over, thickness of plate is 1.5�10�3 m and radius is 3�10�3 m.The ambient temperature is 293 K. Detailed thermal and mechan-ical properties of 2024 aluminum alloy are obtained by linearlyinterpolating the data provided in Table 1 [15,16]. That is to say,set two adjacent points of temperature as X and the correspondingvariable of property as Y, then draw a straight line linking the twopoints of (x1, y1) and (x2, y2). The material property at the

ARTICLE IN PRESS
Table 1Thermal and mechanical properties of 2024 alloy aluminum
Temperature T (K) 293 373 473 573 673
Density r (kg/m3) 2795.6 2778 2756 2734 2712
Specific heat cp (J/kg K) 930.6 969 1017 1065 1113
Thermal conductivity k (W/m K) 119.4 113 105 97 89
Elastic modulus E (GPa) 72 64 54 42 30
Hardening modulus H0 (GPa) 7.2 6.4 5.4 4.2 3
Yield strength s0.2 (MPa) 290 275 255 115 15
Poisson’s ratio m 0.33 0.33 0.33 0.33 0.33
Thermal expansion coefficient a (10�5 K-1) 2.3 2.3 2.3 2.3 2.3
Absorptivity A354:67
ffiffiffiffiffiffiffiffiffiffiffiffiffiffiffiffiffiffiffiffiffiffiffiffiffiffiffiffiffiffiffiffiffiffiffiffiffiffiffiffiffiffiffiffiffiffiffiffiffiffiffiffiffiffiffiffiffiffiffiffið�1þ1:25� 10�2TÞ � 10�8
q
Y. Qin et al. / Optics and Lasers in Engineering 48 (2010) 361–367 363
temperature between x1 and x2 can be gotten from the straightline.
3. Calculation method
There were two steps for the calculation process by using theFEM. At first, transient temperature was obtained. Afterthat,thermal stress was obtained by loading the temperature on thecalculation plane in the next step. With the purpose of verifyingthe FEM results, analytical solutions of temperature which arerepresented by Eqs. (1)–(5) were also introduced.
3.1. FEM calculation of temperature
According to Eqs. (1)–(5), the FEM controlling equation fortemperature can be written as [17]
½K�thfTgþ½C�f _T g ¼ fQg ð10Þ
where [K]th, [C], {T} and f _T g are the heat conduction matrix, heatcapacity matrix, temperature vector and temperature rise ratevector, respectively. The absorbed laser energy is expressed by theheat source vector {Q}. Crank–Nicolson method [18] is used tosolve Eq. (10). The temporal discrete form of Eq. (10) can bederived now:
1
Dt½C�þy½K�th
� �fTgt ¼
1
Dt½C� � ð1� yÞ½K�th
� �TgtþDt
�þyfQgtþð1� yÞfQgtþDt ð11Þ
where Dt is the time interval and y=1/2.
3.2. Analytical solution of temperature
At the end of laser irradiation, temperature rise only occurs in alocal region from the top surface to the depth
ffiffiffiffiffiffiffiffiffi6Dtp
within theplate [19], where D=k/rcp is the thermal diffusivity. It can befound that the depth is far less than the thickness H. Also, theradius R is three times more than the beam radius. Hereby, the roz
calculation plane can be treated as a semi-infinite model, and theanalytical solutions of temperature at the center of top surfaceare [12]:
TGð0;0; tÞ ¼AI0a0
kffiffiffiffipp arctan
ffiffiffiffiffiffiffiffi4Dt
a20
sð12Þ
TTð0;0; tÞ ¼AI0a0
k
ffiffiffiffiffiffiDtp 1ffiffiffiffi
pp � ierfc
a0
2ffiffiffiffiffiffiDtp
� �� �ð13Þ
where J0 and J1 are Bessel functions of the first kind. It should benoted that Eqs. (12) and (13) are just the solutions for the inputstep of a single long pulsed laser heating.
3.3. FEM calculation of thermal stress
Temperature increment is given up {DT}={T}t +Dt�{T}t as thetemperature increases from {T}t to {T}t +Dt during the time intervalDt. For an element, thermal strain induced by thermal expansioncan be written in the incremental form like [20]
fDethg ¼ fagDT ð14Þ
where {a} is the vector of thermal expansion coefficient. However,thermal expansion is restricted by surrounding material, whichinduces thermal stress. The magnitude of thermal stress continuesgrowing in the elastic stage. Stress increment {Ds} leads to elasticstrain increment {Dee}. On the basis of the Von Mises yield criterion[21], the plastic yield happens once the equivalent stress s reachesthe yield strength of material at corresponding temperature, and theplastic strain increment {Dep} is induced. The total strain increment{De} of the element can be expressed by [22]
fDeg ¼ fDethgþfDeegþfDepg ð15Þ
In elastic region, the stress–strain relation is [23]
fDsg ¼ ½D�eðfDeg � fDethg � fDe0gÞ ð16Þ
In plastic region, on the basis of the Prandtl–Reuss incrementaltheory of plastic flow and Von Mises yield criterion, the thermalelastic plastic constitutive equation is
fDsg ¼ ½D�epðfDeg � fDethg � fDe0gÞþfDs0g ð17Þ
where {De0} and {Ds0} are introduced by temperature-dependentelastic modulus E and hardening modulus H0, respectively and theirexpressions are:
De0
� ¼@ð½D�eÞ�1
@Tsf gdT ð18Þ
Ds0
� ¼
½D�e @s@fsg
@H0
@T dT
H0 þ @s@fsg
n oT½D�e @s
@fsg
ð19Þ
Also, [D]e and [D]ep are the elastic matrix and elastic–plasticmatrix, respectively
½D�e ¼E
ð1þmÞð1� 2mÞ
1� m m m 0
m 1� m m 0
m m 1� m 0
0 0 01� 2m
2
2666664
3777775 ð20Þ
½D�ep ¼ ½D�e �½D�e @s
@fsg@s@fsg
n oT½D�e
H0 þ @s@fsg
n oT½D�e @s
@fsg
ð21Þ
where m is the Poisson’s ratio. The incremental form ofgeometric equation about strain {e} and displacement {U} can

ARTICLE IN PRESS
Y. Qin et al. / Optics and Lasers in Engineering 48 (2010) 361–367364
be written as [21]
fDeg ¼ ½B�fDUg ð22Þ
The equilibrium equation which describes the relationbetween the displacement {U} and element thermal load vector{Fth} can also be written in the incremental form [23,24]:
½K�fDUg ¼ fDFthg ð23Þ
½K� ¼
ZV½B�T½D�ep½B�dV ð24Þ
In elastic region : fDFthg ¼
ZV½B�T½D�eðfDethgþfDe0gÞdV ð25Þ
In plastic region : fDFthg ¼
ZV½B�T½D�epðfDethgþfDe0gÞdV
�
ZV½B�TfDs0gdV ð26Þ
where [B] and [K] are the element geometric matrix and elementstiffness matrix, respectively.
The [K] and {DFth} of every element were assembled first.Afterward, the incremental displacement of every node wasobtained by solving the total equilibrium equation. Furthermore,the strain increment De of every element was obtained bysubstituting the results into Eq. (22). At last, element stressincrement was calculated by Eqs. (16) and (17).
4. Results and discussions
4.1. Temperature evolution
To verify the FEM results, the temperature at the centralpoint of the top surface was calculated in three cases described in
Fig. 2. Evolution of temperature at the central point of the top surface.
Table 2The cases of temperature calculation
Method Thermal parameters Calculation time
Analytical
solution
Constant 1 ms heating time
FEM Constant 1 ms heating time and 99 ms cooling
time
FEM Temperature
dependent
1 ms heating time and 99 ms cooling
time
Table 2. The variations of these three temperatures with laserirradiation time are plotted in Fig. 2. The temperature keepsincreasing during the laser irradiation and then nearly decreasesto the initial temperature at 100 ms.
Fig. 2 demonstrates a good agreement between the analyticalsolution and the FEM result in the constant thermal parameterscase. By contrast, the obtained FEM result of temperature in thetemperature-dependent case is higher than the others. Accordingto the further analysis this phenomenon can be attributed to twomain reasons. The thermal diffusivity D decreases with tempera-ture according to Table 1, which means that the conduction abilityof the central point declines. As a result, the proportion of totalabsorbed energy used for temperature rise is increased. Mean-while, the absorptivity increases with increase in temperature,which makes more laser energy convert into heat energy. Hence,the temperature calculated by using FEM is more accurate. Thefollowing results are all obtained in the temperature dependentcase with FEM.
4.2. Temperature distribution
4.2.1. On the surface
Fig. 3 describes the temperature distribution along the radialdirection on the top surface at 1 ms. In the case of Gaussian beam,the temperature reaches the maximum value TG=575 K at thecentral point, and decreases to the ambient temperature withradius gradually. In the case of top hat beam, the temperature isuniform, i.e. TT=595 K in the laser irradiation region and decreasesrapidly beyond this region. It can be found that the temperaturedistribution on the top surface is mainly determined by the spatialdistribution of laser intensity.
In addition, the temperature TT is always higher than TG in thelaser beam region as presented in Fig. 3. The intensity distributionof top hat beam is uniform. Part of heat energy in a micro-volumeof the plate is used to rise temperature itself, the rest transfersalong the axial direction. However, in the case of Gaussian beam,radial heat conduction also consumes part of heat energy, whichmakes the temperature lower.
4.2.2. On the z-axis
The temperature distribution along the axial direction on thecentral axis r=0 m at 1 ms is described in Fig. 4. The temperaturedecreases with depth exponentially, which can be written asT�exp(�z). If the temperature in a micro-volume dV has
Fig. 3. Temperature distribution along the radial direction at the end of laser
irradiation.

ARTICLE IN PRESS
Fig. 5. Evolution of equivalent stress at the central point of the top surface.
Fig. 4. Temperature distribution along the axial direction at the end of laser
irradiation.
Y. Qin et al. / Optics and Lasers in Engineering 48 (2010) 361–367 365
increased by dT during the time dt, the heat energy absorbed bydV is dQ=rcpdT. Then the absorbed heat energy used fortemperature rise versus depth can be expressed byQ=Q0 exp(�mz), where Q0 and m represent the absorbed heatenergy in a point of top surface and modulus decay, respectively.Furthermore, based on the Beer–Lambert law, light intensity alsodecreases exponentially with depth when the light traverses amaterial. It can be assumed that each equal part of the plateabsorbs an equal proportion of the heat energy transferring thatpart. Therefore, the temperature distribution along the axialdirection is mainly determined by the heat conduction ability ofthe material. That is why the variations of temperature with depthbelow the top surface are similar for the two laser beams.
Fig. 6. Radial stress distribution on the top surface for the Gaussian beam.
4.3. Equivalent stress evolution and yield time
The equivalent stress s at the central point of top surfaceversus time is displayed in Fig. 5. The equivalent stress increasesinitially, then decreases almost to zero, and at last increases againuntil it reaches a stable value.
In the case of Gaussian beam, the equivalent stress sG keepsincreasing in the elastic stage until it reaches the maximum value
of 248 MPa at 0.5 ms and then it decreases. At 0.5 ms, thetemperature of the central point is 478 K (Fig. 2), and thecorresponding yield strength is 248 MPa (Table 1) which is equalto the equivalent stress. It can be predicted that the central pointbegins to yield at that time. The phenomenon that the elasticmodulus, hardening module and yield strength decrease withtemperature is known as the thermal softening effect [25].Metallic material seems to be softened at high temperature. Asa result, the yield point begins to release stress, which leads to thedecrease in the equivalent stress sG.
For the top hat beam, the equivalent stress sT reaches themaximum value of 258 MPa with a temperature of 457 K at0.39 ms. At that time, plastic damage occurs as the yield strengthat 457 K (Table 1), which agrees well with the correspondingequivalent stress. By comparing, the equivalent stress sT does notdecrease immediately but nearly keeps constant about 0.07 msafter the central point yields. This phenomenon might beattributed to the uniform temperature distribution (Fig. 3), whichinduces severe thermal expansion in the laser irradiation region.The thermal expansion restricts the stress release at the yieldcentral point. Hence, the equivalent stress will not decrease untilthe yield region is large enough such that the stress release cannotbe restricted anymore. Besides, in the elastic stage, the magnitudeof equivalent stress sT is higher than that of sG accounting for thehigher temperature TT, which leads to earlier yielding of thecentral point in the top hat beam case.
4.4. Plastic damage region and radial residual stress
4.4.1. On the top surface
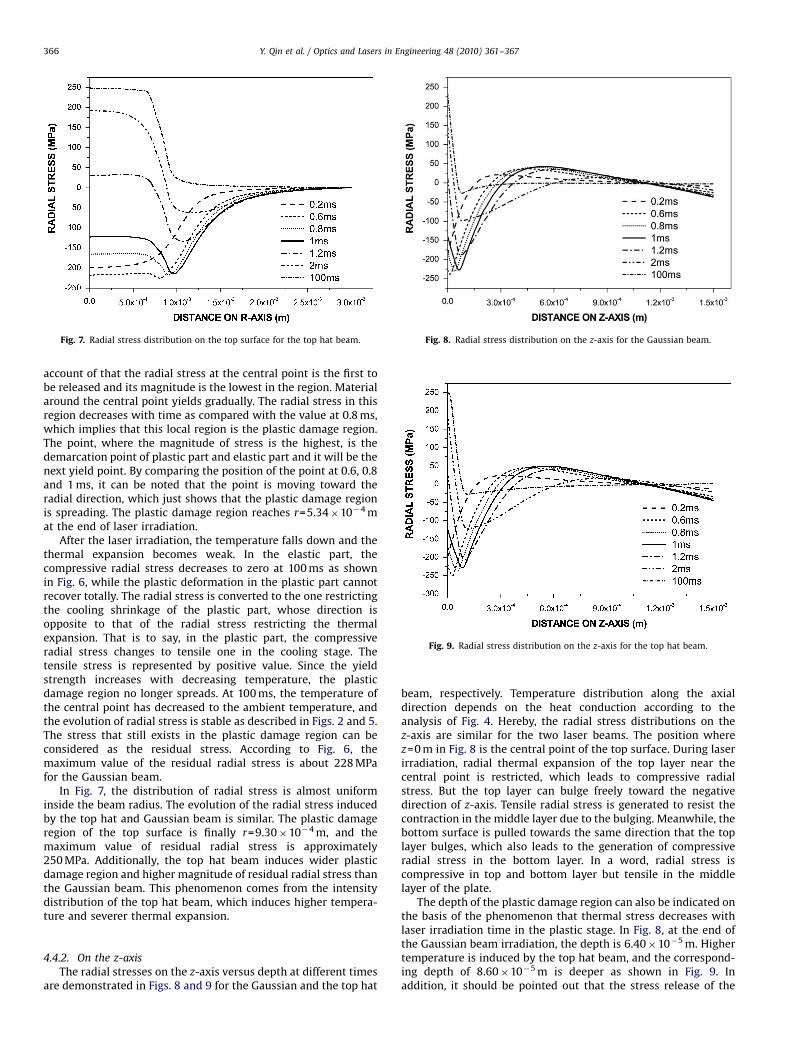
The radial stresses on the top surface versus radius at differenttimes are plotted in Figs. 6 and 7 for the Gaussian and top hatbeam, respectively. During laser irradiation, the temperaturedecreases along with radial direction as described in Fig. 3.Radial thermal expansion of high temperature part is alwaysrestricted by low part, which induces compressive radial stress.Compressive stress is represented by negative value.
At 0.2 ms, the maximum radial stress appears at the centralpoint of the top surface, where the thermal expansion is theseverest and the yield strength is the lowest as plotted in Fig. 6.Hence, the central point is the first yield point, which yields at0.5 ms according to the analysis of Fig. 5. It can be seen that theradial stress distribution has a trend similar to that of spatialdistribution of laser intensity in the elastic stage. In contrast, theradial stress increases with radius in a local region at 0.6 ms. On
ARTICLE IN PRESS
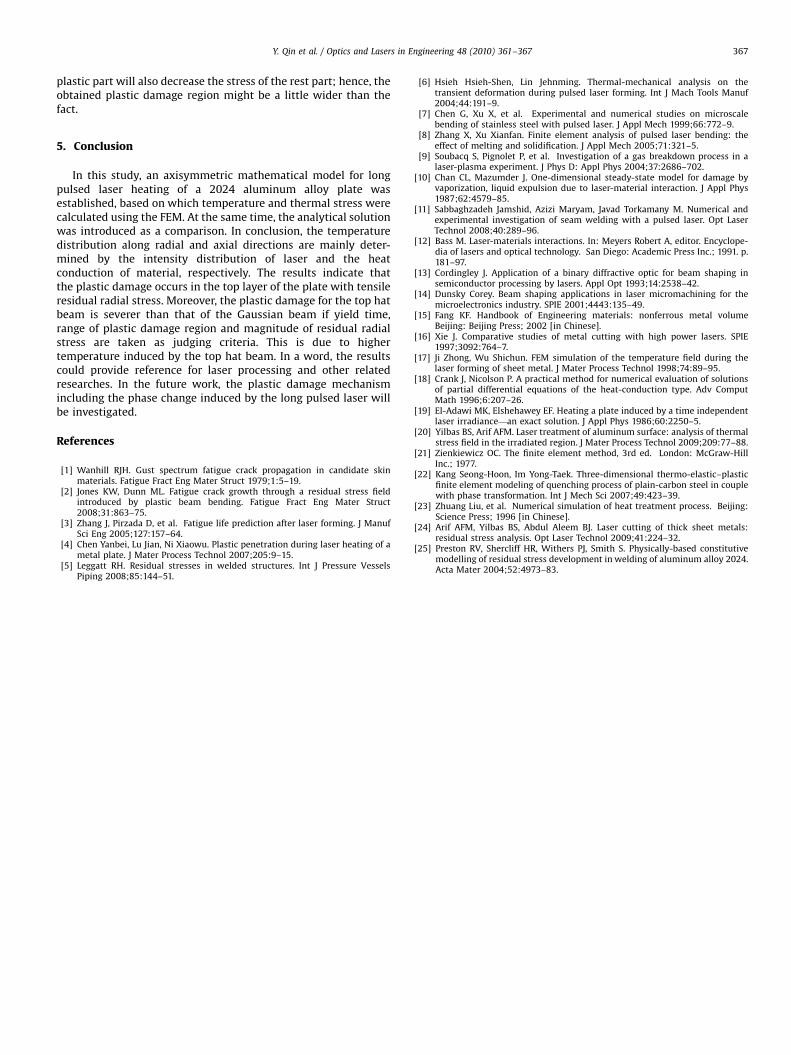
Fig. 8. Radial stress distribution on the z-axis for the Gaussian beam.
Fig. 9. Radial stress distribution on the z-axis for the top hat beam.
Fig. 7. Radial stress distribution on the top surface for the top hat beam.
Y. Qin et al. / Optics and Lasers in Engineering 48 (2010) 361–367366
account of that the radial stress at the central point is the first tobe released and its magnitude is the lowest in the region. Materialaround the central point yields gradually. The radial stress in thisregion decreases with time as compared with the value at 0.8 ms,which implies that this local region is the plastic damage region.The point, where the magnitude of stress is the highest, is thedemarcation point of plastic part and elastic part and it will be thenext yield point. By comparing the position of the point at 0.6, 0.8and 1 ms, it can be noted that the point is moving toward theradial direction, which just shows that the plastic damage regionis spreading. The plastic damage region reaches r=5.34�10�4 mat the end of laser irradiation.
After the laser irradiation, the temperature falls down and thethermal expansion becomes weak. In the elastic part, thecompressive radial stress decreases to zero at 100 ms as shownin Fig. 6, while the plastic deformation in the plastic part cannotrecover totally. The radial stress is converted to the one restrictingthe cooling shrinkage of the plastic part, whose direction isopposite to that of the radial stress restricting the thermalexpansion. That is to say, in the plastic part, the compressiveradial stress changes to tensile one in the cooling stage. Thetensile stress is represented by positive value. Since the yieldstrength increases with decreasing temperature, the plasticdamage region no longer spreads. At 100 ms, the temperature ofthe central point has decreased to the ambient temperature, andthe evolution of radial stress is stable as described in Figs. 2 and 5.The stress that still exists in the plastic damage region can beconsidered as the residual stress. According to Fig. 6, themaximum value of the residual radial stress is about 228 MPafor the Gaussian beam.
In Fig. 7, the distribution of radial stress is almost uniforminside the beam radius. The evolution of the radial stress inducedby the top hat and Gaussian beam is similar. The plastic damageregion of the top surface is finally r=9.30�10�4 m, and themaximum value of residual radial stress is approximately250 MPa. Additionally, the top hat beam induces wider plasticdamage region and higher magnitude of residual radial stress thanthe Gaussian beam. This phenomenon comes from the intensitydistribution of the top hat beam, which induces higher tempera-ture and severer thermal expansion.
4.4.2. On the z-axis
The radial stresses on the z-axis versus depth at different timesare demonstrated in Figs. 8 and 9 for the Gaussian and the top hat
beam, respectively. Temperature distribution along the axialdirection depends on the heat conduction according to theanalysis of Fig. 4. Hereby, the radial stress distributions on thez-axis are similar for the two laser beams. The position wherez=0 m in Fig. 8 is the central point of the top surface. During laserirradiation, radial thermal expansion of the top layer near thecentral point is restricted, which leads to compressive radialstress. But the top layer can bulge freely toward the negativedirection of z-axis. Tensile radial stress is generated to resist thecontraction in the middle layer due to the bulging. Meanwhile, thebottom surface is pulled towards the same direction that the toplayer bulges, which also leads to the generation of compressiveradial stress in the bottom layer. In a word, radial stress iscompressive in top and bottom layer but tensile in the middlelayer of the plate.
The depth of the plastic damage region can also be indicated onthe basis of the phenomenon that thermal stress decreases withlaser irradiation time in the plastic stage. In Fig. 8, at the end ofthe Gaussian beam irradiation, the depth is 6.40�10�5 m. Highertemperature is induced by the top hat beam, and the correspond-ing depth of 8.60�10�5 m is deeper as shown in Fig. 9. Inaddition, it should be pointed out that the stress release of the
ARTICLE IN PRESS
Y. Qin et al. / Optics and Lasers in Engineering 48 (2010) 361–367 367
plastic part will also decrease the stress of the rest part; hence, theobtained plastic damage region might be a little wider than thefact.
5. Conclusion
In this study, an axisymmetric mathematical model for longpulsed laser heating of a 2024 aluminum alloy plate wasestablished, based on which temperature and thermal stress werecalculated using the FEM. At the same time, the analytical solutionwas introduced as a comparison. In conclusion, the temperaturedistribution along radial and axial directions are mainly deter-mined by the intensity distribution of laser and the heatconduction of material, respectively. The results indicate thatthe plastic damage occurs in the top layer of the plate with tensileresidual radial stress. Moreover, the plastic damage for the top hatbeam is severer than that of the Gaussian beam if yield time,range of plastic damage region and magnitude of residual radialstress are taken as judging criteria. This is due to highertemperature induced by the top hat beam. In a word, the resultscould provide reference for laser processing and other relatedresearches. In the future work, the plastic damage mechanismincluding the phase change induced by the long pulsed laser willbe investigated.
References
[1] Wanhill RJH. Gust spectrum fatigue crack propagation in candidate skinmaterials. Fatigue Fract Eng Mater Struct 1979;1:5–19.
[2] Jones KW, Dunn ML. Fatigue crack growth through a residual stress fieldintroduced by plastic beam bending. Fatigue Fract Eng Mater Struct2008;31:863–75.
[3] Zhang J, Pirzada D, et al. Fatigue life prediction after laser forming. J ManufSci Eng 2005;127:157–64.
[4] Chen Yanbei, Lu Jian, Ni Xiaowu. Plastic penetration during laser heating of ametal plate. J Mater Process Technol 2007;205:9–15.
[5] Leggatt RH. Residual stresses in welded structures. Int J Pressure VesselsPiping 2008;85:144–51.
[6] Hsieh Hsieh-Shen, Lin Jehnming. Thermal-mechanical analysis on thetransient deformation during pulsed laser forming. Int J Mach Tools Manuf2004;44:191–9.
[7] Chen G, Xu X, et al. Experimental and numerical studies on microscalebending of stainless steel with pulsed laser. J Appl Mech 1999;66:772–9.
[8] Zhang X, Xu Xianfan. Finite element analysis of pulsed laser bending: theeffect of melting and solidification. J Appl Mech 2005;71:321–5.
[9] Soubacq S, Pignolet P, et al. Investigation of a gas breakdown process in alaser-plasma experiment. J Phys D: Appl Phys 2004;37:2686–702.
[10] Chan CL, Mazumder J. One-dimensional steady-state model for damage byvaporization, liquid expulsion due to laser-material interaction. J Appl Phys1987;62:4579–85.
[11] Sabbaghzadeh Jamshid, Azizi Maryam, Javad Torkamany M. Numerical andexperimental investigation of seam welding with a pulsed laser. Opt LaserTechnol 2008;40:289–96.
[12] Bass M. Laser-materials interactions. In: Meyers Robert A, editor. Encyclope-dia of lasers and optical technology. San Diego: Academic Press Inc.; 1991. p.181–97.
[13] Cordingley J. Application of a binary diffractive optic for beam shaping insemiconductor processing by lasers. Appl Opt 1993;14:2538–42.
[14] Dunsky Corey. Beam shaping applications in laser micromachining for themicroelectronics industry. SPIE 2001;4443:135–49.
[15] Fang KF. Handbook of Engineering materials: nonferrous metal volumeBeijing: Beijing Press; 2002 [in Chinese].
[16] Xie J. Comparative studies of metal cutting with high power lasers. SPIE1997;3092:764–7.
[17] Ji Zhong, Wu Shichun. FEM simulation of the temperature field during thelaser forming of sheet metal. J Mater Process Technol 1998;74:89–95.
[18] Crank J, Nicolson P. A practical method for numerical evaluation of solutionsof partial differential equations of the heat-conduction type. Adv ComputMath 1996;6:207–26.
[19] El-Adawi MK, Elshehawey EF. Heating a plate induced by a time independentlaser irradiance—an exact solution. J Appl Phys 1986;60:2250–5.
[20] Yilbas BS, Arif AFM. Laser treatment of aluminum surface: analysis of thermalstress field in the irradiated region. J Mater Process Technol 2009;209:77–88.
[21] Zienkiewicz OC. The finite element method, 3rd ed. London: McGraw-HillInc.; 1977.
[22] Kang Seong-Hoon, Im Yong-Taek. Three-dimensional thermo-elastic–plasticfinite element modeling of quenching process of plain-carbon steel in couplewith phase transformation. Int J Mech Sci 2007;49:423–39.
[23] Zhuang Liu, et al. Numerical simulation of heat treatment process. Beijing:Science Press; 1996 [in Chinese].
[24] Arif AFM, Yilbas BS, Abdul Aleem BJ. Laser cutting of thick sheet metals:residual stress analysis. Opt Laser Technol 2009;41:224–32.
[25] Preston RV, Shercliff HR, Withers PJ, Smith S. Physically-based constitutivemodelling of residual stress development in welding of aluminum alloy 2024.Acta Mater 2004;52:4973–83.