axahachie INDEPENDENT SCHOOL DISTRICT
21
axahachie INDEPENDENT SCHOOL DISTRICT Long Range Facility Planning Committee Presentation October 2, 2014
-
Upload
nina-lawrence -
Category
Documents
-
view
18 -
download
0
description
axahachie INDEPENDENT SCHOOL DISTRICT. Long Range Facility Planning Committee Presentation October 2, 2014. BOND MARKET UPDATE. Current Bond Market Conditions. Permanent School Fund Guaranteed AAA Market Approximate Yields to Maturity: 1-year = 0.25% 5-year = 1.15% 10-year = 2.35% - PowerPoint PPT Presentation
Transcript of axahachie INDEPENDENT SCHOOL DISTRICT

axahachieINDEPENDENT SCHOOL DISTRICT
Long Range Facility Planning Committee Presentation
October 2, 2014

BOND MARKETUPDATE

3Southwest Securities
2.50%
2.75%
3.00%
3.25%
3.50%
3.75%
4.00%
4.25%
4.50%
4.75%
5.00%
5.25%
5.50%
5.75%
6.00%
6.25%
6.50%
BOND BUYERS INDEX OF MUNICIPAL BONDS
January 2001 - October 2014
4.11%
Historical High = 6.01% on October 15th 2008
Average = 4.53%
Historical Low = 3.27% on December 6th 2012

4Southwest Securities
Current Bond Market Conditions Permanent School Fund Guaranteed AAA Market
Approximate Yields to Maturity:
1-year = 0.25%
5-year = 1.15%
10-year = 2.35%
15-year = 3.30%20-year = 3.70%
25-year = 4.00%
30-year = 4.20%

VOTED BOND DEBT SERVICE

6Southwest Securities
$0
$2,500,000
$5,000,000
$7,500,000
$10,000,000
$12,500,000
$15,000,000
$17,500,000
$20,000,000
Deb
t Ser
vice
Fiscal Year Ending
WAXAHACHIE INDEPENDENT SCHOOL DISTRICTOutstanding Voted Bond Debt Service
Series 1997 - BLDG & REF Series 2002 - BLDG & REF Series 2007 - BLDGSeries 2010 - REF Series 2010 - BLDG Series 2011 - REFSeries 2011 - QSCB Net D/S Series 2013 - REF

HISTORICAL STATISTICS
8Southwest Securities
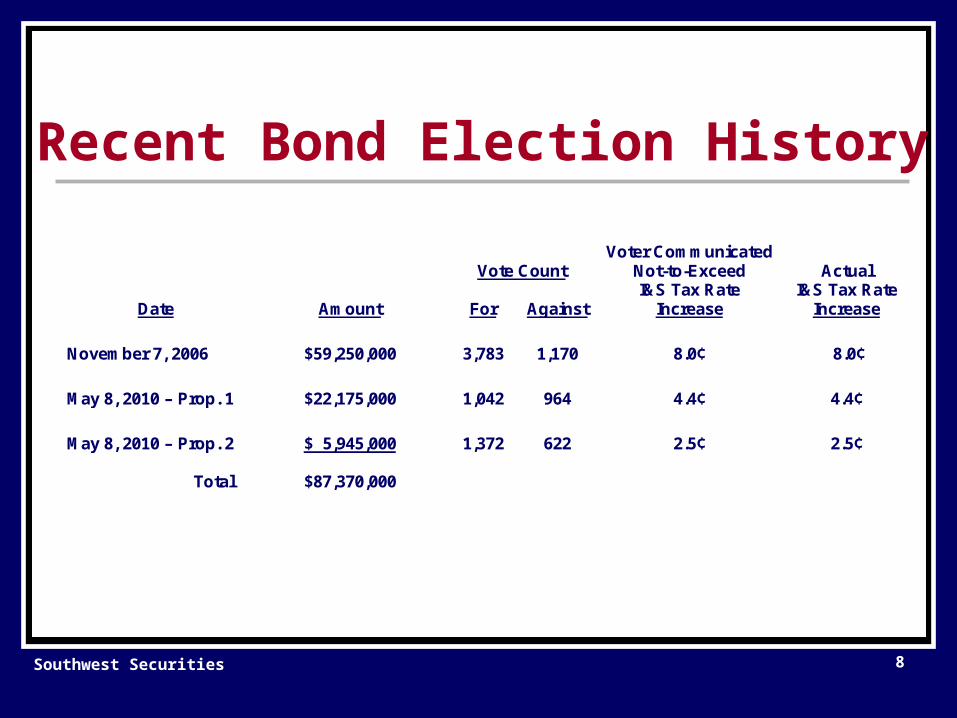
Recent Bond Election History
Voter Communicated Vote Count Not-to-Exceed Actual I&S Tax Rate I&S Tax Rate
Date Amount For Against Increase Increase
November 7, 2006 $59,250,000 3,783 1,170 8.0¢ 8.0¢
May 8, 2010 – Prop. 1 $22,175,000 1,042 964 4.4¢ 4.4¢
May 8, 2010 – Prop. 2 $ 5,945,000 1,372 622 2.5¢ 2.5¢
Total $87,370,000

9Southwest Securities
Recent Bond Rating History
Year Moody’s Fitch Status
2007 A3 A Stable
2010 Aa3 AA- Upgrade Moody’s & Fitch
2011 Aa3 AA- Stable
2013 Aa3 AA- Stable
10Southwest Securities
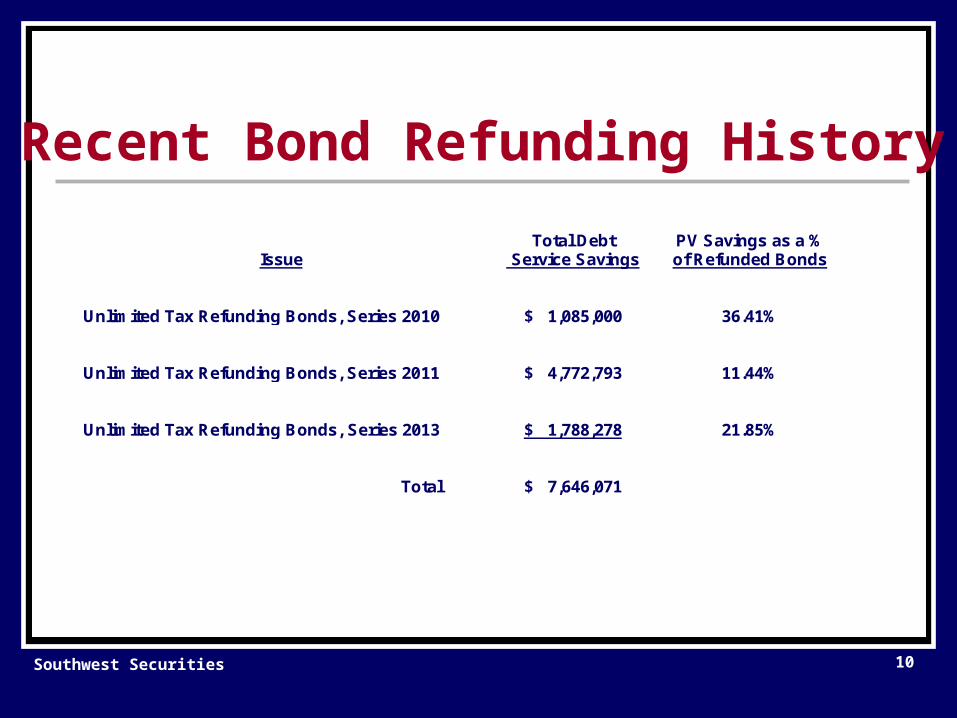
Recent Bond Refunding History
Issue
Total Debt Service Savings
PV Savings as a % of Refunded Bonds
Unlimited Tax Refunding Bonds, Series 2010 $ 1,085,000 36.41% Unlimited Tax Refunding Bonds, Series 2011 $ 4,772,793 11.44% Unlimited Tax Refunding Bonds, Series 2013 $ 1,788,278 21.85%
Total $ 7,646,071

11
Taxable Value History(1) (2) (3) (4) (5)
Fiscal Net TaxableYear Taxable Value 5-Year 10-Year
Ending Value Growth Average Average
2004/05 1,982,719,636$
2005/06 2,126,125,437$ 7.23%
2006/07 2,260,370,285$ 6.31%
2007/08 2,484,821,353$ 9.93%
2008/09 2,692,600,031$ 8.36%
2009/10 2,769,273,709$ 2.85% 6.94%
2010/11 2,741,686,962$ -1.00%
2011/12 2,728,265,668$ -0.49%
2012/13 2,746,008,719$ 0.65%
2013/14 2,785,501,065$ 1.44%
2014/15 2,950,000,000$ 5.91% 1.30% 4.12%
12
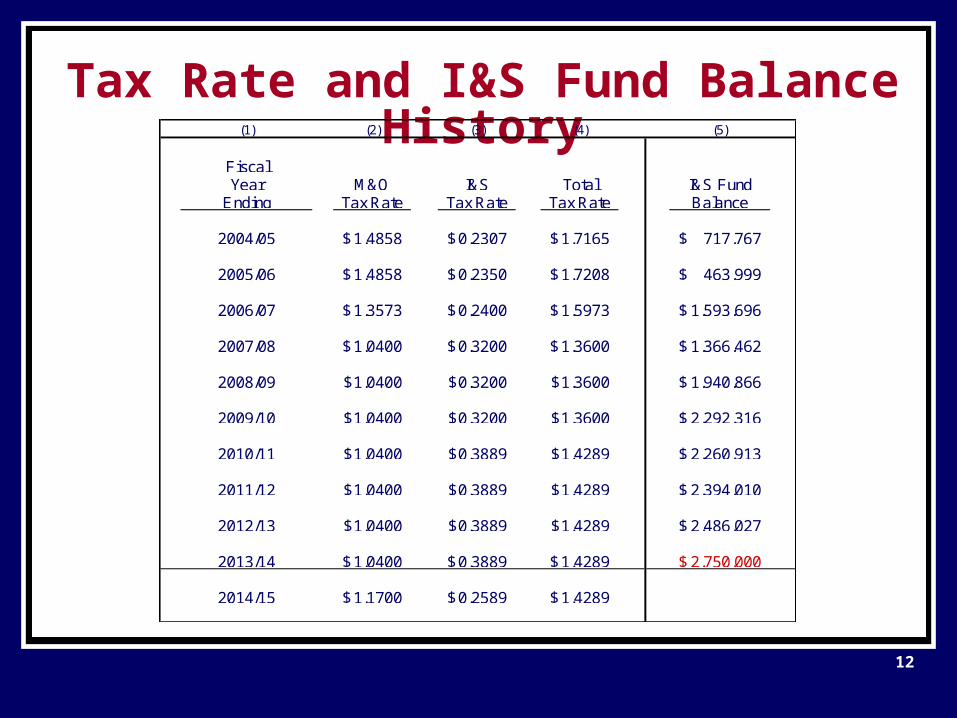
Tax Rate and I&S Fund Balance History(1) (2) (3) (4) (5)
FiscalYear M&O I&S Total I&S Fund
Ending Tax Rate Tax Rate Tax Rate Balance
2004/05 1.4858$ 0.2307$ 1.7165$ 717,767$
2005/06 1.4858$ 0.2350$ 1.7208$ 463,999$
2006/07 1.3573$ 0.2400$ 1.5973$ 1,593,696$
2007/08 1.0400$ 0.3200$ 1.3600$ 1,366,462$
2008/09 1.0400$ 0.3200$ 1.3600$ 1,940,866$
2009/10 1.0400$ 0.3200$ 1.3600$ 2,292,316$
2010/11 1.0400$ 0.3889$ 1.4289$ 2,260,913$
2011/12 1.0400$ 0.3889$ 1.4289$ 2,394,010$
2012/13 1.0400$ 0.3889$ 1.4289$ 2,486,027$
2013/14 1.0400$ 0.3889$ 1.4289$ 2,750,000$
2014/15 1.1700$ 0.2589$ 1.4289$

13Southwest Securities
Surrounding District ComparisonRed Oak ISD Ennis ISD Waxahachie ISD Midlothian ISD Crowley ISD
2014/15 Taxable Value 1,411,626,025$ 1,771,832,606$ 2,989,789,853$ 3,294,631,539$ 5,093,938,415$ (Before Freeze)
Average Daily Attendance 5,690 5,380 7,500 7,700 15,000
(State % = 40%) (State % = 7%) (State % = 0%) (State % = 0%) (State % = 8%)
Principal Outstanding 107,667,143$ 139,951,909$ 114,597,537$ 243,304,663$ 306,970,433$
Debt to AV Percentage 7.63% 7.90% 3.83% 7.38% 6.03%
M&O Tax Rate 1.1700$ 1.0400$ 1.1700$ 1.0400$ 1.1700$ I&S Tax Rate 0.3700 0.5000 0.2589 0.5000 0.5000
Total Tax Rate 1.5400$ 1.5400$ 1.4289$ 1.5400$ 1.6700$
Underlying Bond Rating(s) A1 AA- / A1 AA- / Aa3 A+ / A1 A+ / Aa3
PRELIMINARY BOND PROGRAM ANALYSIS

15Southwest Securities
Preliminary Bond Program AnalysisScenario 1: $85,000,000 Structured for Level Total Debt Service
Assumptions:
Taxable Value – Assumed to Remain Constant at $2.95 Billion
Use of TRE Revenues – Assumed to be $3,790,000 Per Year
Interest Rate – Assumed to be 4.25%
Amortization – Assumed to be 30 Years
Tax Collection % – Assumed to be 99%
Result:
I&S Tax Rate = 37.0ȼ (An I&S Tax Rate Increase of 11.11ȼ )
16Southwest Securities
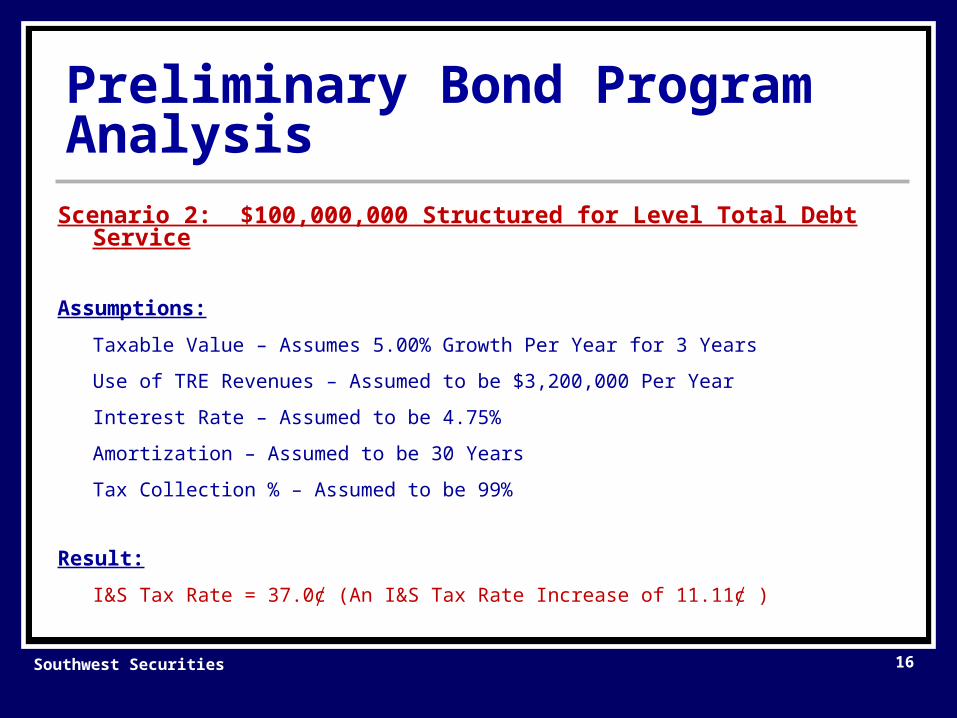
Preliminary Bond Program AnalysisScenario 2: $100,000,000 Structured for Level Total Debt Service
Assumptions:
Taxable Value – Assumes 5.00% Growth Per Year for 3 Years
Use of TRE Revenues – Assumed to be $3,200,000 Per Year
Interest Rate – Assumed to be 4.75%
Amortization – Assumed to be 30 Years
Tax Collection % – Assumed to be 99%
Result:
I&S Tax Rate = 37.0ȼ (An I&S Tax Rate Increase of 11.11ȼ )
17Southwest Securities
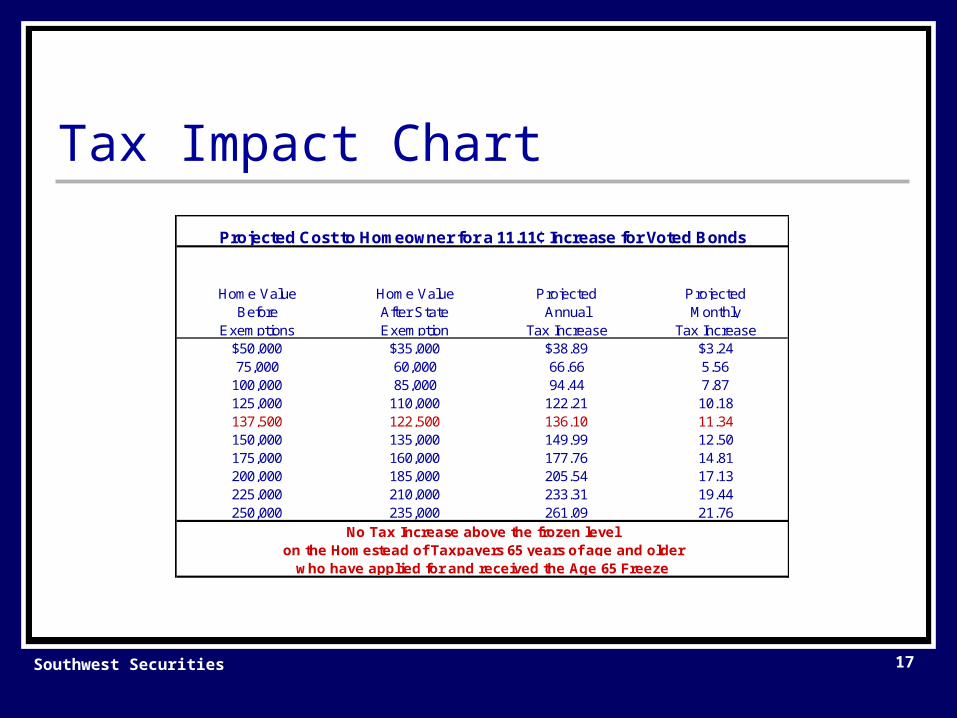
Tax Impact Chart
21.76
149.9914.81
137,500
75,000 60,000 66.66 5.56
122,500 136.10 11.34
ProjectedAnnual
19.44
100,000 85,000 94.44 7.87125,000
135,000 12.50177.76
Tax Increase
Home Value Projected
110,000 122.21 10.18
250,000 261.09235,000
175,000 160,000
225,000 210,000 233.31
Tax Increase$38.89
Exemption
150,000
200,000 185,000 17.13205.54
Monthly
Projected Cost to Homeowner for a 11.11¢ Increase for Voted Bonds
Before
who have applied for and received the Age 65 Freeze
No Tax Increase above the frozen levelon the Homestead of Taxpayers 65 years of age and older
After StateHome Value
Exemptions$50,000 $35,000 $3.24
18Southwest Securities
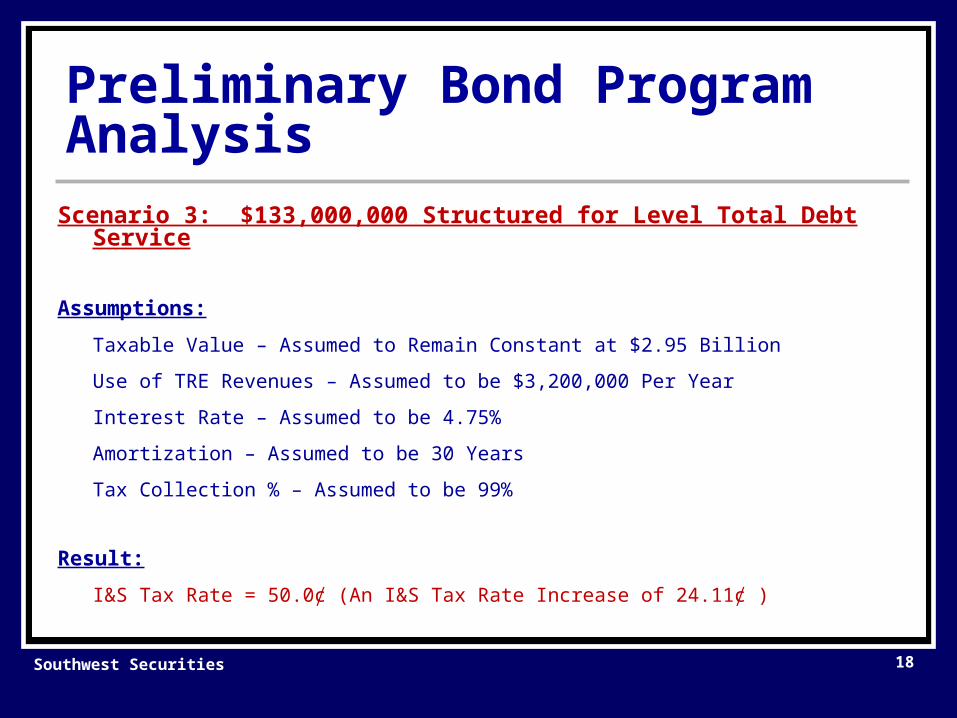
Preliminary Bond Program AnalysisScenario 3: $133,000,000 Structured for Level Total Debt Service
Assumptions:
Taxable Value – Assumed to Remain Constant at $2.95 Billion
Use of TRE Revenues – Assumed to be $3,200,000 Per Year
Interest Rate – Assumed to be 4.75%
Amortization – Assumed to be 30 Years
Tax Collection % – Assumed to be 99%
Result:
I&S Tax Rate = 50.0ȼ (An I&S Tax Rate Increase of 24.11ȼ )

19Southwest Securities
Tax Impact Chart
who have applied for and received the Age 65 Freeze
No Tax Increase above the frozen levelon the Homestead of Taxpayers 65 years of age and older
After StateHome Value
Exemptions$50,000 $35,000 $7.03
Monthly
Projected Cost to Homeowner for a 24.11¢ Increase for Voted Bonds
BeforeTax Increase
$84.39Exemption
150,000
47.22
200,000 185,000 37.17446.04
250,000 566.59235,000
175,000 160,000
225,000 210,000 506.31
385.76
Tax Increase
Home Value Projected
110,000 265.21 22.10
ProjectedAnnual
42.19
100,000 85,000 204.94 17.08125,000
135,000 27.12325.4932.15
137,500
75,000 60,000 144.66 12.06
122,500 295.35 24.61

BOND ELECTION TIMING
21Southwest Securities
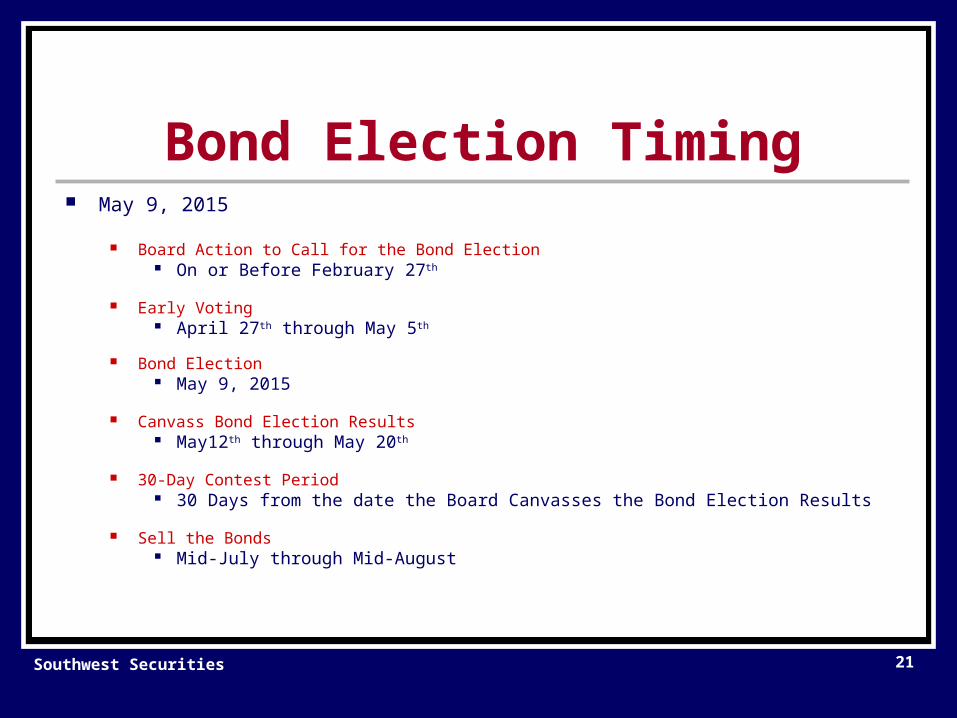
Bond Election Timing May 9, 2015
Board Action to Call for the Bond Election On or Before February 27th
Early Voting April 27th through May 5th
Bond Election May 9, 2015
Canvass Bond Election Results May12th through May 20th
30-Day Contest Period 30 Days from the date the Board Canvasses the Bond Election Results
Sell the Bonds Mid-July through Mid-August