AWARENESS STATUS AND ASSOCIATED RISK FACTORS OF ...
82
AWARENESS STATUS AND ASSOCIATED RISK FACTORS OF HYPERTENSION AMONG ADULT PATIENTS ATTENDING YALA SUB-COUNTY HOSPITAL, SIAYA COUNTY, KENYA BY AWINO BOB OTIENO A Thesis Submitted in Partial Fulfillment of the Requirements for the Degree of Master of Public Health (Epidemiology and Population Health) in the School of Public Health and Community Development Department of Public Health Maseno University © 2016
Transcript of AWARENESS STATUS AND ASSOCIATED RISK FACTORS OF ...

AWARENESS STATUS AND ASSOCIATED RISK FACTORS OF HYPERTENSION
AMONG ADULT PATIENTS ATTENDING YALA SUB-COUNTY HOSPITAL,
SIAYA COUNTY, KENYA
BY
AWINO BOB OTIENO
A Thesis Submitted in Partial Fulfillment of the Requirements for the Degree of
Master of Public Health (Epidemiology and Population Health)
in the School of Public Health and Community Development
Department of Public Health
Maseno University
© 2016

ii
DECLARATION
This thesis is my original work and has not been presented by any other person in any university
for the award of a certificate, diploma or degree. Where other people’s work has been used
(either from a printed source, internet or any other source) this has been carefully acknowledged
and referenced in accordance with Departmental requirements.
Awino Bob Otieno
PG/MPH/0025/2012 Sign…………………… Date……………………….
This thesis has been submitted with our approval as University Supervisors:
SUPERVISORS
1. Dr. Ng’wena Magak Sign…………………… Date……………………….
Department of Human Physiology
Maseno University, Kenya.
2. Dr. Lillian A. Ogonda Sign …………………… Date………………………
Department of Biomedical Sciences and Technology
Maseno University, Kenya.
iii
ACKNOWLEDGEMENTS
My journey towards the completion of this thesis could not have materialized without the
blessings of the Almighty God. To the valuable time, academic counsel and patience of my
supervisors, Dr. Ng’wena Magak and Dr. Lilian Ogonda.
My sincere gratitude goes to my lecturers, at Maseno University School of Public Health, for
their overwhelming support during my course work.
Last but not least, special thanks go to the Medical superintendent- Yala Sub-County hospital,
for allowing me carry out the study at the hospital.

iv
DEDICATION
To my wife Linet, whose prayers, encouragements, financial support and fortitude served as a
driving force to continue with my studies, my son, Jayden for understanding and accommodating
my busy schedule during this research, my late father Solomon Awino and to my mum
Mrs. Rusanael Awino, for always trusting in my potential.

v
ABSTRACT
Hypertension is a major public health problem that affects approximately 26% of adult
population worldwide. It is a significant risk factor for cardiovascular diseases, stroke and renal
failure, and causes about 7.1 million deaths per year worldwide. The prevalence of hypertension
is suggested to be increasing worldwide, particularly in developing countries due to nutritional
transition and westernization. Moreover, lack of awareness regarding the disease status
increases incidence of complications and mortality. Although modifiable through lifestyle
interventions and medical management, hypertension accounts for approximately 64% of stroke
cases in Kenya. There is little information regarding awareness of hypertension status and risk
factors among patients seeking healthcare from public hospitals in Kenya, including Yala sub
county hospital. The study aimed to determine the awareness of hypertension status and risk
factors among adult patients attending Yala sub-county hospital, in Siaya County. The study
used hospital-based cross-sectional design. A sample of 393 participants aged 18 years and
above presenting at the out -patient clinic of the hospital for treatment between February and
March 2015, were selected using systematic sampling with a random start. Blood pressure and
anthropometric measurements were taken for all participants. A field-tested, structured
questionnaire was used to collect information on demographics, awareness and risk factors for
hypertension. Descriptive statistics was used to calculate percentage of participants who were
classified to be aware of their hypertension status, with the total hypertensive participants as the
denominator. Logistic regression analysis was used to test the association between significant
variables and hypertension. All tests were two-tailed and a p-value < 0.05 was considered as
statistically significant. Of the 145 (36.9%) study participants who were hypertensive, 60
(41.4%) were not aware of their hypertension status. Binary logistic regression showed that age
above 30 years (OR=12.0; 95% CI=2.7 to 52.3), marital status (Widowed OR= 16; 95%
CI=6.34 to 40.52), smoking, BMI (overweight OR 2.98; 95% CI= 1.85 to 4.79 Obese OR=
4.23; 95% CI= 2.15 to 8.30 p <0.001), waist circumference (OR= 2.39; 95% CI= 1.57 to 3.64
p< 0.001) were independent predictors of hypertension. However, increasing level of education
was inversely related to hypertension. In conclusion, the high proportion unaware of their
hypertension status could lead to delay in treatment initiation which ultimately increases
complications arising from the disease. All the identified risk factors except age are modifiable
through lifestyle change interventions. Therefore there is need for the health care workers to
hold regular health education to increase awareness of hypertension status and promote healthy
lifestyle.

vi
TABLE OF CONTENTS
CONTENT PAGE
DECLARATION.............................................................................................................................. ii
ACKNOWLEDGEMENTS ........................................................................................................... iii
DEDICATION................................................................................................................................. iv
ABSTRACT .......................................................................................................................................v
TABLE OF CONTENTS ............................................................................................................... vi
LIST OF ABBREVIATIONS ..........................................................................................................x
LIST OF TABLES ...........................................................................................................................xi
LIST OF FIGURES ....................................................................................................................... xii
LIST OF APPENDICES ............................................................................................................. xiiii
CHAPTER ONE: INTRODUCTION .............................................................................................1
1.1 Background of the Study ...........................................................................................................1
1.2 Statement of the Problem ..........................................................................................................3
1.3 Significance of this Study .........................................................................................................4
1.4 Objectives of the Study .............................................................................................................5
1.4.1 General Objective ...................................................................................................................5
1.4.2 Specific Objectives .................................................................................................................5
1.5 Research Questions ...................................................................................................................5
CHAPTER TWO: LITERATURE REVIEW ................................................................................6
2.1 Introduction ...............................................................................................................................6
2.2 Awareness of Hypertension Status ............................................................................................6
2.3 Non modifiable Risk Factors for Hypertension ........................................................................9
2.3.1 Sex…………………………………………………………………………………………..9
2.3.2 Age………………………………………………………………………………………...10

vii
2.4 Modifiable Risk Factors ..........................................................................................................11
2.4.1 Socioeconomic Factors ........................................................................................................11
2.4.1.1Education ............................................................................................................................11
2.4.1.2 Occupation ........................................................................................................................12
2.4.1.3 Marital Status ....................................................................................................................13
2.4.2 Behavioural Factors..............................................................................................................14
2.4.2.1 Physical Activity ...............................................................................................................14
2.4.2.2Alcohol Consumption ........................................................................................................16
2.4.2.3 Tobacco Use ......................................................................................................................18
2.4.3. Physical Factors...................................................................................................................19
2.4.3.1 Body Mass Index ...............................................................................................................19
2.5 Operational Framework...........................................................................................................21
2.6 Measurement of Variables ......................................................................................................23
CHAPTER THREE: MATERIALS AND METHODS ..............................................................25
3.1 Introduction .............................................................................................................................25
3.2 The Study Area........................................................................................................................25
3.3 Study Population .....................................................................................................................26
3.4 Study Design ...........................................................................................................................26
3.5 Sample Size and Sample Size determination ..........................................................................26
3.6 Inclusion Criteria .....................................................................................................................27
3.7 Exclusion Criteria ....................................................................................................................27
3.8 Sampling Procedure ................................................................................................................27
3.9 Study Instruments ....................................................................................................................27
3.10 Data Collection ......................................................................................................................28
3.10.1 Blood Pressure Measurement .............................................................................................28

viii
3.10.2 Anthropometric Measurement............................................................................................29
3.11 Data Entry .............................................................................................................................30
3.12 Data Analysis ........................................................................................................................30
3.13 Ethical Considerations...........................................................................................................30
3.14 Study Limitations and Potential Biases ...............................................................................31
3.14.1 Limitations .........................................................................................................................31
3.14.2 Minimization of Observer Bias ..........................................................................................32
CHAPTER FOUR: RESULTS ......................................................................................................33
4.1 Introduction .............................................................................................................................33
4.2 Characteristics of the Study Participants .................................................................................33
4.3 Awareness of Hypertension Status among Study Participants................................................35
4.4 Non Modifiable Risk Factors for Hypertension ......................................................................36
4.5 Modifiable Risk Factors for Hypertension ..............................................................................37
CHAPTER FIVE: DISCUSSION ..................................................................................................41
5.1 Awareness of Hypertension Status ..........................................................................................41
5.2 Non Modifiable Risk Factors for Hypertension ......................................................................43
5.3 Modifiable Risk Factors for Hypertension ..............................................................................43
CHAPTER SIX: SUMMARY, CONCLUSIONS AND RECOMMENDATIONS ...................47
6.1 Introduction .............................................................................................................................47
6.2 Summary of the Main Findings ...............................................................................................47
6.2.1 Awareness of Hypertension Status .......................................................................................47
6.2.2 Non Modifiable Risk Factor for Hypertension ....................................................................47
6.2.3 Modifiable Risk Factors for Hypertension ...........................................................................47
6.3 Conclusion ...............................................................................................................................48
6.3.1 Awareness of Hypertension Status .......................................................................................48

ix
6.3.2 Associated Risk Factors for Hypertension ...........................................................................48
6.4 Recommendations ...................................................................................................................48
6.4.1 Recommendation on Awareness of Hypertension ...............................................................48
6.4.2 Recommendations on the Non Modifiable Risk Factors for Hypertension .........................48
6.4.3 Recommendations on the modifiable risk factor for hypertension .....................................49
REFERENCES ................................................................................................................................50
APPENDICES .................................................................................................................................60

x
LIST OF ABBREVIATIONS
AOR: Adjusted Odds Ratio
AWP: Annual work Plan
BMI: Body Mass Index
BP: Blood Pressure
CVD: Cardiovascular diseases
DBP: Diastolic blood Pressure
DHIS: District Health Information System
HT: Hypertension
JNC: Joint National Committee on Prevention, Detection, Evaluation and Treatment of
High BP
KHSSPI Kenya Health Sector Strategic and Investment Plan
MOH: Ministry of Health
NCD: Non-communicable diseases
OR: Odds Ratio
RR: Relative Risk
SBP: Systolic Blood Pressure
SSA: Sub Saharan Africa
WC: Waist circumference
WHO: World Health Organization
WHR: Waist Hip Ratio
MUERC: Maseno University Ethical review Committee

xi
LIST OF TABLES
Table 4.1: Characteristics of Study Participants……………………………..……………...… 34
Table 4.2: Non Modifiable Risk Factors for Hypertension…………...……………..……..…. 37
Table 4.3: Modifiable Risk Factors for Hypertension ……………………………..……….….38
Table 4.4: Logistic Regression of Statistically Significant Risk Factors in Bivariate Analysis
………………..........………………………………………………………………...……….…..40
xii
LIST OF FIGURES
Figure 2.1: Operational Framework of associated risk factors for Hypertension ........................ 22
Figure 4.1: Awareness of hypertension status among patients in Yala Sub county hospital. ..... 35
Figure 4.2: Age and Sex Distributed Hypertension Awareness Status........................................ 36

xiii
LIST OF APPENDICES
Appendix 1: Introduction and Consent ........................................................................................ 60
Appendix 2: Questionnaire .......................................................................................................... 61
Appendix 3: Map of Study Area .................................................................................................. 65
Appendix 4: Work Plan ............................................................................................................... 66
Appendix 5: Research Budget ..................................................................................................... 67
Appendix 6: MUERC Approval Letter ........................................................................................ 68
Appendix 7: Research Authorization Letter from the Hospital ................................................... 69

1
CHAPTER ONE: INTRODUCTION
1.1 Background of the Study
Hypertension is the intermittent or sustained elevation in diastolic or systolic blood pressure
above the normal. It is defined as having a systolic blood pressure (SBP) of ≥140 and/or a
diastolic blood pressure (DBP) of ≥90 mm Hg. (WHO, 2003). Hypertension is a significant
public health problem, with prevalence estimates of approximately 1 billion individuals
worldwide (WHO 2008). It is the main risk factor for stroke, renal failure and also
cardiovascular disease mortality, which accounts for 20 – 50% of all deaths (Kearney et al.
2004).
Epidemiological studies have shown that the prevalence of HTN varies between different
countries (Kearney et al. 2004). Several studies have also shown rural versus urban differences
on blood pressure levels throughout sub-Saharan Africa (Fuentes et al. 2000; Agyemang 2006;
Addo et al. 2007). The rapid increase in prevalence of hypertension in developing countries is
most marked in the urban population, and is likely related to changing life-styles (Godfrey et al.
2005). Although once considered a lifestyle disease in urban setting (Ezzati et al. 2005; Addo et
al. 2007), the modern technological advances and economic development have led to reduction
in level of physical activity, increase in stresses of life and unhealthy diets amongst the rural
population as well (Mittal and Singh 2008; Maletnlema 2002; Adedoyin et al. 2008). This in turn
may increase the risk of conditions such as hypertension in rural areas (Ejim et al. 2011). Yala in
Gem sub-county Kenya is a rural area where rapid urbanization, economic development and rise
in affluence are being witnessed. This study therefore, aimed to identify the possible risk factors
for hypertension among adult patients seeking health care at Yala sub-county hospital.

2
Individual’s awareness of their hypertension status is an important component required for
adopting preventive and therapeutic measures for this illness and hence reduction in occurrence
of its detrimental sequel (Knight et al. 2001). In some sub-Saharan Africa countries like Malawi,
population based studies have reported up to 95% of hypertension cases being undiagnosed and
about three quarters of the participants reported to have never had their blood pressure checked
(Msyamboza et al., 2012). In Kenya, there is limited data on awareness of hypertension status
among clients visiting hospitals. The few documented community hypertension surveys in Kenya
showed varied awareness of hypertension status. For instance a study done by Hendriks et al.,
(2012) in rural areas of Nandi district showed an awareness status of hypertension at 6%, and
among slum dwellers in Nairobi revealed an overall awareness status of hypertension at 19.5%.
(Van de Vijver et al., 2013).
Hypertension data from Kenya Health Sector Strategic and Investment Plan (KHSSPI) 2013-
2017, ranks hypertension at number nine cause of mortality (1.6% of total deaths) and number
five (3.1% of total DALYs) in terms of risk factor for DALYS (KHSSPI-MOH 2013). In
addition, a study by Ogeng’o et al., 2015 showed that the most common comorbidity for
ischemic stroke was hypertension at 64.1%. With this background, coupled with paucity of data
from other hospitals in Kenya, the present study aimed to determine the awareness of
hypertension status among clients attending Yala sub-county hospital.

3
1.2 Statement of the Problem
Despite being modifiable through lifestyle interventions and medical management, hypertension
accounts for approximately 64% of stroke cases in Kenya, thus suggesting inadequately
controlled blood pressure of most patients in Kenya.
The prevalence of hypertension is suggested to be increasing in Kenya where modern
technological advances and economic development have led to rise in adoption of unhealthy
lifestyles including reduction in level of physical activity and unhealthy diets amongst both
urban and rural population. Yala, in Gem sub-county, is one of the rural places where rapid
urbanization, economic development and rise in affluence are being witnessed in Kenya. This in
turn increases the risk of conditions such as hypertension.
In Kenya, episodic health education is usually done in the health care facilities for the few
patients already diagnosed with hypertension. Such an approach makes self-management
strategies and other cost effective interventions inaccessible to those at risk or those with
undiagnosed hypertensive individuals (Kiberenge et al., 2010). Individual’s awareness of
hypertension status and identification of its associated risk factors is important in order to adopt
preventive and therapeutic measures for this illness (Knight et al. 2001).

4
1.3 Significance of this Study
Hypertension in adults has a great impact on the quality of life of individuals with important
implications on the economy (Lloyd-Jones et al.; Knight et al. 2001; Lopez et al. 2006).
Uncontrolled hypertension may also result in detrimental illnesses ((Kearney et al. 2004;
Kearney et al. 2005; Gaddam et al. 2009; Murphy et al. 2009) that place a great strain on health
care delivery system. Indeed coronary heart disease (CHD) has emerged as the leading cause of
death among older Africans (Alberts et al. 2005). However, hypertension represents one of the
most preventable cause of death in humans (WHO 2008) and one of the most significant
modifiable risk factors for cardiovascular diseases (Kengne et al. 2009).
Lifestyle interventions (Haslam et al. 2005; Dickinson et al. 2006; He et al. 2013) and effective
medical management of hypertension are well-established targets to decrease morbidity, prevent
its complications and mortality in patients (Law et al. 2003). Effective interventions will
therefore require increased individual’s awareness of hypertension status and the identification of
its associated risk factors.
The study aimed to assess the awareness of hypertension status and associated risk factors of
hypertension among patients seeking health care from Yala Sub-County hospital, in Gem Sub-
County. Data obtained from the study could be used by policy makers in the development and
implementation of effective hypertension prevention and control strategies to reduce the
detrimental sequel of the disease.
5
1.4 Objectives of the Study
1.4.1 General Objective
To determine the awareness of hypertension status and associated risk factors among adult
patients attending Yala sub-county hospital.
1.4.2 Specific Objectives
1. To determine the awareness of hypertension status among adult patients attending Yala
sub-county hospital.
2. To assess the non-modifiable risk factors for hypertension among adult patients attending
outpatient services at Yala sub-county hospital.
3. To assess the modifiable risk factors for hypertension among adult patients attending
outpatient services at Yala sub-county hospital.
1.5 Research Questions
1. What is the awareness of hypertension status among adult patients attending Yala sub-
county hospital.?
2. What are the non-modifiable risk factors for hypertension among adult patients attending
outpatient services at Yala sub-county hospital?
3. What are the modifiable risk factors for hypertension among adult patients attending
outpatient services at Yala sub-county hospital?
6
CHAPTER TWO: LITERATURE REVIEW
2.1 Introduction
This chapter presents a review of the relevant literature deemed necessary in helping
understanding the subject under review. It provides a critical review of literature related to
awareness of hypertension status and its associated risk factors. It is discussed under the
following sub-headings: awareness of hypertension status, non-modifiable risk factors and
modifiable risk factors. An operational framework was used to explain the relationships amongst
the various variables.
2.2 Awareness of Hypertension Status
The World Health Organization has identified hypertension, or high blood pressure, as the
leading cause of cardiovascular mortality. The World Hypertension League (WHL), an umbrella
organization of 85 national hypertension societies and leagues, recognized that more than 50% of
the hypertensive populations worldwide were unaware of their condition (Chockalingam, 2007).
In economically developed countries like USA, Canada and England, awareness of hypertension
status was at 81%, 83% and 65% respectively (Joffres et al., 2013). This could be due to massive
health campaigns and community sensitization about hypertension through mass media in these
developed countries.
In a systematic review and meta-analysis to assess the recent burden of hypertension in sub-
Saharan Africa, Ataklte et al., (2014), found awareness of hypertension status between 7% and
56%. This was based on studies published between 2000 and 2013. In Southwest Ethiopia, a

7
hospital-based cross-sectional survey conducted on 734 participants aged 15 years or older, only
35.1% of them were aware of their hypertension status (Gudina et al., 2013). In Angola, though
community based survey of 1,464 adults aged 18 to 64 years conducted in Bengo province,
amongst the hypertensive individuals, only 21.6% were aware of their status (Pires et al. 2013).
Awareness of hypertension status was more in the females than the males, and increase with
advance in age. This low awareness of hypertension status reported in this study could have been
attributed to the lower cut off for the upper age limit of the study participants and since
awareness increases with advance age (Mathenge et al., 2010), the study could have included
more of the elderly participants. In terms of sex distribution of awareness of hypertension status,
it is true females were more aware of their status because generally females tend to be more
concerned about their health than their male counterparts (Vlassoff, 2007).
However, the awareness of hypertension status was much higher than that found in South
Eastern Nigeria which was at 2.8% (Andy et al., 2012). This was a cross-sectional study
involving 3869 participants 15 years and above in three rural communities in the Cross River and
Akwa Ibom states of Nigeria. The difference could be due to inclusion of more of the elderly in
the Angola study than the Nigeria study and also the Angola study had a smaller sample size.
The Nigeria study had a limitation in that there was no age and sex categorization of
hypertension awareness status.
8
Across East Africa, awareness of hypertension status varies from country to country. For
instance, in a study done in adults of urban Ilala district and Rural Shari village of Kilimanjaro
Tanzania by Edwards et al., (2000), just fewer than 20% of the hypertensive participants were
aware of their diagnosis. This was a two linked cross-sectional population base survey done. The
awareness between the urban and the rural participants was not differentiated and may be it
could have been higher in the urban residents due to easy access to information in the urban than
in the rural areas. Comparably, a community-based cross-sectional study among 842 adult
residents aged 20 years or older of the rural district of Rukungiri in Uganda between January and
February 2006, awareness status of hypertension was very low, with nine out of ten unaware of
their condition (Wamala et al., 2009). However, in both studies hypertension awareness was not
categorized with respect to age and sex.
In Kenya, there is limited data on awareness of hypertension status among clients visiting
hospitals. The few documented community hypertension surveys in Kenya showed varied
awareness of hypertension status. For instance a study done by Hendriks et al., (2012) showed an
awareness status at 6%. This was a cross-sectional survey involving 800 households members
aged 18 years or more of dairy cooperative farmers and their families of rural Nandi district. The
study population in this survey consisted of individuals and their household members,
participating in a microcredit program and in a dairy cooperative respectively. These specific
characteristics preclude generalization of conclusion regarding hypertension awareness status in
the rural population of Kenya. Like some other studies done across Africa, there was no
characterization of awareness with reference to sex and age. Comparably, a cross-sectional
population-based survey conducted among 5190 adults aged 18 years and older slum dwellers in

9
Nairobi revealed an overall awareness of hypertension status at 19.5%. Awareness was more in
the females (30.7%) than the males (10.8%).
In a study of ischemic cortical stroke in a Kenyan referral hospital, Ogeng’o et al., 2015, found
that hypertension was the most common (64.1%) comorbidity to cortical stroke. This was a
retrospective study done at Kenyatta National Hospital in Nairobi. It involved retrieval of records
from registry of black adult patients aged 18 years and above with a diagnosis of cortical stroke
during a five year period extending from January 2007 to December 2011. In Kenya, episodic
health education is usually done in the health care facilities for the few patients already
diagnosed with hypertension. Such an approach makes self-management strategies and other cost
effective interventions inaccessible to those at risk or those with undiagnosed hypertensive
individuals (Kiberenge et al., 2010). With this background, coupled with paucity of data, the
present study aimed to determine the awareness of hypertension status among clients attending
Yala sub-county hospital which might help policy makers in planning for preventive programs
reduce the detrimental sequel of the disease.
2.3 Non modifiable Risk Factors for Hypertension
2.3.1 Sex
Studies across Africa have shown varied results with respect to relationship between
hypertension and sex. For instance, in a cross-sectional population based study of 2120 adults
aged 18 years or older in the regional capitals of Cameroon, male sex was identified as a
significant predictor of hypertension (Dzudie et al., 2012). In this study the population was self
selected hence generalization of the study findings might not be possible.

10
Similar findings were also demonstrated by (Pires et al. 2013), this was a community based
survey of 1,464 adults aged 18 to 64 years in northern Angola. The proportion of hypertension
was higher in men (26.4%) than women (19.8%). The reason of this male preponderance could
be due a gene possessed by males which makes them more prone to hypertension. These findings
are also supported by research studies in animals. For instance, male hypertensive rats were
found to have significantly higher systolic and diastolic blood pressures compared with
hypertensive female rats; normotensive male and female rats had similar diastolic blood
pressure, but males had slightly higher systolic blood pressure than females (Maris et al. 2005).
Although males have a gene that influence hypertension more than females, when compared at
the same age, no differences in findings were noted between postmenopausal women and men of
the same age (Vasan et al. 2002).
However, contrary to the above findings, in a study by Wamala et al., 2009, female participants
were 1.5 times more likely to be hypertensive than their male counterparts. This was a
community-based cross-sectional study of adults aged 20 years or older in rural district of
Rukunguri, Uganda.
2.3.2 Age
With respect to age, in a community-based survey of 1464 adults aged 18-64 years conducted in
Bengo Province, Nothern Angola, the study found that younger women had the lowest
hypertension prevalence followed by younger men and the prevalence of hypertension was
shown to be strongly associated with older age with an OR of 7.2 in women and an OR of 1.7 in
11
men (Pires et al., 2013). The advanced age increases the risk of exposure to the lifestyle risk
factors for hypertension and hence the observed increase in hypertensive risk with aging. The
other reason could be due to stiffening of the walls of blood vessels as one advances in age thus
increases the likely hood of being hypertensive.
Similar results was found in studies by (Wamala et al. 2009), in a community-based cross-
sectional study of 842 adults aged 20 years or older in Rukunguri district, Uganda. Participants
with hypertension were significantly older with an average age of 44.5 years, compared to
normal- tensive participants who had an average age of 37.6 years. Indeed, hypertension is the
most frequent cause of heart failure above the age of 50 years and a major cause of death among
the elderly (Ezzati et al. 2002; Lawes et al. 2008). However, detection and control of
hypertension at any age can significantly decrease the risk of developing complications such as
CVD, stroke and kidney failure (Neal et al., 2000), in addition to the mortality with which it is
associated (Lawes et al. 2006; WHO 2008).
2.4 Modifiable Risk Factors
2.4.1 Socioeconomic Factors
2.4.1.1Education
In the developed world, in a multi-country study by Stamler (1992), found that age-adjusted
systolic blood pressure was 1.3mmHg higher (p-value = 0.05) for men and 4.5mmHg (p-value <
0.001) for women with 10 fewer years of education. The less educated were found to have higher
sodium excretion, greater body mass, and a higher alcohol intake leading to increased blood
pressure (Stamler etal 1992)
12
In a community based survey of 1,464 adults aged 18 to 64 years in northern Angola Pires et al.,
(2013), the prevalence of hypertension was found to increase as the level of education
decreased, those with lowest education were twice much likely to be hypertensive than those
with highest education.
Similarly, in a community-based cross-sectional study of 842 adults aged 20 years or older in
Rukunguri district, Uganda. Participants reporting to had attained tertiary level of education
were more likely to be hypertensive, compared to those reporting to have never received any
formal education. Participants reporting to had attained tertiary education were nearly 3 times
more likely to be hypertensive compared to those reporting to have never gone to school Wamala
et al., (2009)
Contrary to the above findings, in a population based survey of 4801 participants aged 13 years
above carried in rural Uganda, Maher et al., (2011), found that extremes of education (none and
secondary or above) among men was independently associated with high blood pressure. The
difference in this study finding could be due to differences in sample size and age categorization.
Similarly, study done by Alwan et al., (2014) which was a family-based cross-sectional study
that examined the genetic determinants (SKIPOGH study) of adults 18 years or older, there was
no association between education and hypertension.
2.4.1.2 Occupation
Chronic diseases incur costs for drugs, health insurance, medical consultations, laboratory tests,
transportation and food (Dias da Costa et al. 2002). Low socioeconomic status and financial

13
difficulties have been found to be associated with high blood pressure (Mendez et al. 2003;
Steptoe et al. 2005). In a study which was undertaken in an urban area of Jamaica, a middle-
income developing country; found that blood pressure was substantially higher in poor men with
a low level of education. Conversely, women with a high income experienced higher blood
pressure than did those with a low income (Mendez et al., 2003).
Similarly in a study done in Mexico by Fernald and Adler (2008) found that women in low-
income rural populations were found to be more likely to have higher SBP, as were those who
perceived that they had higher status in the community. In the developed world, there is a well-
established inverse association between socioeconomic status (SES) and blood pressure. In the
developing world, however, these relationships are not as clear, particularly in the middle-
income countries undergoing epidemiologic and nutritional transition. Association of low
income and hypertension could be due to stressful situations experienced by this group of
persons which might indirectly increase the chances of being hypertensive.
2.4.1.3 Marital Status
Literature on marital status and hypertension is inconclusive and some focused on comparing
currently married to never married persons (McCausland et al., 2014, Lipowitcz and
Lopuzanska, 2005). For instance, in a cross-sectional study of 325 adults aged 20 years or older
Mc Causeland et al., (2014), found out that in adjusted models, being married was associated
with lower night time systolic blood pressure, and was greater in married men than women.
Though, this study only the married was compared against the unmarried, the widowed and the
divorced which are special type of the unmarried was not considered.

14
In a similar study which compared hypertension among the married and the unmarried Lopowicz
et al., (2005), found that never married men had on average higher SDP and DBP than married
men. This study involved a bigger sample size of 2,271 Polish men aged 25-60 but still it was
found that never married had a higher risk of hypertension when compared to married men. In a
larger community-based study conducted among 17,230 participants aged 30 to 7o years in Saudi
Arabia Al-Nozha et al., (2007) found out that hypertension was highest among the widowed than
single participants. Contrary to above findings, El Bcheraoui et al., (2014) in a national
multistage survey of individuals aged 15 years or older in Saudi, found no association between
marital status and high blood pressure after adjusting for confounders. The difference could have
been due to difference in study setting and sampling procedure. The widowed are more prone to
hypertension; this could be associated with the psychological stress faced by this group of
people. Capell et al., (2001), showed that psychological factors could affect the entire
neuroendocrine system ultimately leading to hypertension.
2.4.2 Behavioural Factors
2.4.2.1 Physical Activity
Adequate physical activity has been shown to have many health-promoting effects and has a
direct, independent role in reducing hypertension Rodgers et al., (2004). Findings from large and
well-controlled epidemiological studies support an inverse, independent, and graded association
between exercise capacity and mortality risk in pre hypertensive and hypertensive individuals
(Kokkinos et al., 2009, Faselis et al., 2012).

15
For example, in a cohort of 4631 hypertensive veterans with multiple cardiovascular risk factors,
who successfully completed a graded exercise, test mortality risk was 13% lower for every 1-
MET increase in exercise capacity Kokkinos et al., (2009). When compared with the least-fit
individuals (exercise capacity ≤5 METs), mortality risk was 34% lower for those in the next
fitness category (5.1–7.0 METs) and progressively declined to over 70% for individuals with the
highest exercise capacity (>10 METs). When the presence or absence of additional risk factors
within fitness categories (least-fit to most-fit) was considered, the least-fit individuals (≤5 METs)
with additional risk factors had a 47% higher mortality risk than those without risk factors. This
increased risk was eliminated in the next fitness category (5.1–7.0 METs) and declined to
≈≥50% in those with an exercise capacity >7.0 METs, regardless of cardiovascular risk factor
status.
A decrease in daily activity is related to hypertension. A seven year study of 2548 middle-aged
Japanese men who either had no hypertension or took hypertensive drugs assessed the
relationship between daily activities and the risk of hypertension. The study found that daily
activity was inversely related to the incidence of hypertension ((Nakanishi et al. 2005).
Similarly (Kruk 2007) demonstrated that physical activity could be helpful in the prevention of
the most frequent chronic diseases. This study involved review of published research from 2004
through to March 2007. The results showed that the maximal magnitude of the risk reduction
reported was 49% for cardiovascular and heart diseases. However, in a family-based cross-
sectional study that examined the genetic determinants (SKIPOGH study) of adults 18 years or
older, there was no association of physical activity and hypertension Alwan et al., (2014). This
could have been due to difference in study design and setting.

16
2.4.2.2Alcohol Consumption
Several studies have demonstrated a non-linear relationship between alcohol and blood pressure.
In a study of Healthy normotensive men entered a 4-period crossover study comparing in random
order 4 weeks of control–abstinence with similar periods of daily consumption of red wine (375
mL; 39 grams alcohol), de-alcoholized red wine (375 mL), or beer (1125 mL; 41 grams alcohol).
Both blood pressure and the heart rate significantly increased in healthy normotensive men after
drinking 40 grams of red wine or beer ((Zilkens et al. 2005).
In a prospective cohort study by Baik and Chol, 2008, which included 3833 male and female
Koreans aged 40-69 years and free of metabolic syndrome at baseline. Upon follow-up, heavy
drinking, in particular among liquor drinkers, was associated with an increased risk of metabolic
syndrome by influencing its components. Compared with nondrinkers, the multivariate relative
risk of the metabolic syndrome for very light drinkers consuming 0.1 to 5 g of alcohol per day
(g/d) was 1.06, that for light drinkers consuming 5.1 to 15 g/d was 1.13, that for moderate
drinkers consuming 15.1 to 30 g/d was 1.25, and that for heavy drinkers consuming >30 g/d was
1.63. All individual components of the metabolic syndrome were significantly associated with
heavy drinking, particularly among heavy liquor drinkers. Several mechanisms have been
proposed for the relationship between heavy drinkers and elevated BP. Suggested mediators of a
direct effect include: 1) stimulation of the sympathetic nervous system, endothelin, renin-
angiotensin-aldosterone system, insulin (or insulin resistance), or cortisol; 2) inhibition of
vascular relaxing substances, e.g., nitric oxide; 3) calcium or magnesium depletion.

17
Similarly, (Fuchs et al. 2001) in a cohort study of 8334 participants aged 45 to 64 years in Porto
Alegre, Brazil, who were free of hypertension and coronary heart disease at baseline. The results
showed that consumption of 210g or more of ethanol per week (approx. 3 drinks per day) was
associated with an increased risk of hypertension. The odds ratio was 1.47 after adjustment for
race, age, BMI, education, and diabetes. The same was demonstrated by (Sesso et al. 2008) in a
prospective study of 28,848 women from the Women’s prospective study and 13,455 men from
the physician’s health study in USA free of baseline hypertension, cardiovascular disease and
cancer. In men, alcohol intake was positively and significantly associated with the risk of
hypertension and persisted after multivariate adjustment. Models stratified by baseline systolic
blood pressure (<120 versus ≥120 mm Hg) or diastolic blood pressure (<75 versus ≥75 mm Hg)
did not alter the relative risks in women and men. Light-to-moderate alcohol consumption
decreased hypertension risk in women and increased risk in men. The threshold above which
alcohol became deleterious for hypertension risk emerged at ≥4 drinks per day in women versus
a moderate level of ≥1 drink per day in men.
On the effect of moderate alcohol consumption on hypertension, (Thadhani et al. 2002)
prospectively examined the association between alcohol consumption and subsequent risk of
hypertension among 70,891 women 25 to 42 years of age. The results found that in the age-
adjusted analysis, the relative risk of hypertension according to level of alcohol consumption
followed a J-shaped curve. After adjustment for other confounding factors including BMI, the J-
shaped relationship became more pronounced. Compared with women who abstained, the
relative risk of hypertension was lowest among women drinking 0.25 to 0.50 drinks per day and
highest among women drinking more than 2 drinks per day. This low to moderate alcohol intake

18
association with lower incidence of hypertension could be due to increases in high-density
lipoprotein (HDL) and apolipoproteins A 1 and A 2, antioxidant effects, and reduced platelet
aggregability.
In conclusion, excess alcohol consumption is related to high blood pressure and its
complications, whereas light to moderate alcohol consumption is a factor in maintaining good
health. However, higher intake levels are associated with increased risk for hypertension,
cardiomyopathy and other cardiac complications, hemorrhagic and thrombotic strokes, certain
kinds of cancer, hepatitis, cirrhosis, pancreatitis, gastritis, suicide, accidents, violence, and
alcohol abuse and dependence. Because of these risks, alcohol intake should not be encouraged.
2.4.2.3 Tobacco Use
In spite of the great number of observations which show the certainty of cardiovascular damage
from smoking, the opinions on that are not yet unanimous (Aureio, 2011). In a study to
determine the pressor response to smoking, (De Cesaris et al. 1992) studied 10 normotensive and
10 mild or moderate essential-hypertensive smokers ( > 20 cigarettes daily) were compared with
2 comparable groups of non-smokers. All participants were asked to smoke 4 cigarettes during 1
hour; blood pressure (BP) and heart rate (HR) were monitored beat-to-beat by a non-invasive
device (Finapres Ohmeda) during the smoking period and during the immediately preceding non-
smoking hour. Furthermore, all subjects underwent 24-hour ambulatory BP monitoring. In all
groups, each cigarette induced a similar and statistically significant increase from baseline for
both BP and HR.

19
Similarly in another study of the relationship between smoking and hypertension was a 14-year
longitudinal study which was conducted in Japanese male workers at a steel company between
1991 and 2005. The study revealed that smoking is independently related to the onset of
hypertension and systolic hypertension in Japanese male workers. The significant odds ratios of
smoking were 1.13 for hypertension and 1.15 for systolic hypertension (Dochi et al. 2009).
Smoking increases the built ups of unsaturated fats in the blood vessels, a condition called
atherosclerosis which might lead to hypertension. Cigarette smoke also contains nicotine which
raises heart rate, narrows blood arteries and hardens their walls; this might lead to increased
blood pressure.
In Kenya, a population-based cross-sectional survey of participants aged 18 years and older
study done in two major slums in Nairobi, by van de Vijver et al., (2013), current smokers were
almost two times more likely to be hypertensive than the non smokers in both sexes. Though in
this study the ex smokers were not analysed.
2.4.3. Physical Factors
2.4.3.1 Body Mass Index
Several studies done across the globe have shown that as the body mass index increases, blood
pressure also increases. For instance, in a cohort study of 300 Japanese-Americans, using a 10 to
11 year follow-up, (Hayashi et al. 2003) found that intra-abdominal fat measured using
computed tomography was significantly related to hypertension.

20
Similarly (Goma et al. 2011), in a cross-sectional study with multy stage cluster sampling
technique of adults aged 25 years and above in Lusaka, urban Zambia, found that the obese were
approximately 2.5 times more likely to be hypertensive than those with the normal weight.
Likewise in a nationwide cluster-specific cross-sectional study of adults aged 16 years and above
carried out in ten regions of Cameroon in 2013, Kingue et al., (2015) observed that the
prevalence of hypertension increased with advancement of body mass index.
In rural Uganda, Wamala et al., (2009), noted that having a BMI greater than 25 was
significantly associated with hypertension, the association being highest in subjects with BMI of
30 or higher, with an adjusted OR of 5.07 [95% CI= 2.79 – 9.21], compared to subjected with
BMI less than 25. In Kenya, in a population-based household survey in Kibera slums of Nairobi,
Kenya, Joshi et al., 2014, observed that per unit increase in BMI, SBP increased by 0.2 mmHg in
both gender, and DBP increased by 0.08 mmHg (0.12 mmHg males, 0.06 mmHg females).
The above observations could be due to the rapid weight gain increases regional blood flow,
cardiac output and heart rate and the increased cardiac output could be due increased
extracellular volume expansion. All these partly explain the increased likelihood of hypertension
in the obese than their normal-weight counterparts.
In summary, some of the above risk factors have been determined in few documented
community studies in Kenya. But still there was need to establish the associated risk factors for
hypertension among hospital clients because the risk factors are not homogenous and to
prioritize on prevention strategies for hypertension.

21
2.5 Operational Framework
For the study on cardiovascular diseases (CVD), an adaptation of the conceptual framework of
Wong and colleagues (Wong et al., 2005) is used. This is quite a complete framework on CVD.
Since the study only focused on the hypertension part of the CVD and only specific risk factors
were considered (see figure 2.1)
The boxes on the left were independent variables i.e., awareness of hypertension status and risk
factors for hypertension which were considered in terms of non-modifiable factors, socio-
economic factors, behavioural factors . These factors were analyzed to determine their
association with hypertension.

22
INDEPENDENT VARIABLES DEPENDENT VARIABLES
Figure 2.1: Operational Framework of associated risk factors for Hypertension
(Modified from Wong et al., 2005)
Awareness of hypertension
status
Risk factors
Non-Modifiable Risk Factors
Age
Sex
Family History
Modifiable Risk Factors
Socio-economic Factors
Occupation
Education
Marital Status
Behavioural Factors
Physical activity
Alcohol Consumption
Tobacco use
Physical factors
Body mass index
Hypertension/
No Hypertension

23
2.6 Measurement of Variables
Age : Subjective response in years from 18 years of age.
Sex : Recorded as male or female as observed
Family History : Indication whether there is or there is not a nuclear family member with
hypertension.
Occupation : What best describes participant’s main work status over past 12 months
Education : The highest level of education attained
Marital Status : Described response as never married, married, divorced or widowed
Physical activity : Assessed as a continuous variable by asking participants to report the
number of hours per week they spend playing sports. Adequate physical
activity was considered in participants who reported at least 150 hours per week
Alcohol Consumption
Current drinkers : Those reported to have taken alcohol within the last 30 days before the
study interview day.
Ex- drinkers : Those who reported to have stopped taking alcohol in the past 12 months
prior to this study
None drinkers : Adults who reported no history of drinking alcohol in their lifetime.
Tobacco use
Non-smokers : Adults who have never smoked a cigarette in their entire life.
Current smokers : Adults who smoke cigarettes every day (daily) or some days (nondaily).
Former smokers : Those who had stopped smoking at least 12 months before this study
interview.

24
Body mass index : was calculated as weight (kg)/ (height (m) ×height (m)). In kg/m2
Underweight : Body Mass Index of less than 18.5 kg/m2
Normal weight : Body mass index of 18.5 kg/m2 - 24.9 kg/m
2
Overweight : Body Mass Index of between 25.0 kg/m2 – 29.9 kg/m
2
Obesity : Body Mass Index equal to or greater than 30 kg/m2.
Waist circumference: measured in centimeters at the midpoint between the inferior margin of
the last rib and the crest of the ilium
High waist circumference: in male above 94 centimeters and in the females above 80
centimeters
Hypertension : Systolic (and/ or diastolic) BP of 140 (90) mmHg or higher or if
they were on BP lowering medications over the last 15 consecutive days
Awareness of
hypertension status : Participants responding Yes or No to the question ‘Have you ever
been told by a doctor or health professional that you had
hypertension?’

25
CHAPTER THREE: MATERIALS AND METHODS
3.1 Introduction
This chapter discusses the research materials and methods that were applied for the study. The
key sections include study area, study population, study design, sampling strategy, data
instruments, data collection, data analysis, limitations, and ethical considerations.
3.2 The Study Area
The study was carried out at Yala Sub county hospital. The hospital is situated in Yala division,
Gem Sub County, of Siaya County. It is situated 42 kilometers northwest of Kisumu City and is
approximately 500 metres off Kisumu- Busia road. It is the largest facility in the sub county with
a catchment population of approximately 24,000 persons (Annual work plan 2014/2015). It is a
government owned facility which provides both outpatient services including but not limited to
general outpatient services, MCH services, dental services, comprehensive care clinic and
inpatient care services. Daily adult outpatient attendance is between 140 and 200 clients. The
hospital is the only referral facility within Gem Sub County serving 33 other small facilities.
Yala hospital has 22 nursing staff against standard norm of 50, medical officers are 2 against a
standard norm of 6, and clinical officers are 3 against a standard norm of 10. Generally there is
one nurse and clinical officer serving the outpatient department at any particular time. There is
usually one automated blood pressure machine at the outpatient department which occasionally
breaks down making adherence to service protocols difficult.

26
Yala is one of two divisions of Gem Constituency, Siaya County, has a population of 83,823
with an urban population of 2,438 (KNBS, 2009). Yala is situated at 0.1° North latitude, 34.53°
East longitude and 1373 meters elevation above the sea level (See Appendix 3 for study area
map).
3.3 Study Population
The study population was adult clients aged 18 years or older attending outpatient services at the
hospital.
3.4 Study Design
This was a hospital based cross-sectional study.
3.5 Sample Size and Sample Size determination
Sample size of study was calculated using the formula Z2Pq/d
2 (Mugenda et al. 2003).
n= Z2Pq
d2
Where:
n = the desired sample size (when the target population is greater than 10,000)
Z = standard normal deviation set at 1.96 which corresponds to 95% confidence interval
p = proportion of the target population estimated to have a characteristic that is being measured.
(No documented hospital prevalence studies in Kenyan, therefore p taken at 50% to maximize
sample size.)
q = 1-p (1-0.5) = 0.5
d = degree of accuracy desired set at 0.05
Therefore, 1.962 x 0.5 x 0.5
n = ________________ = 384
0.052
Including 10% non response n was 1.1 × 384= 422 Respondents

27
3.6 Inclusion Criteria
Male and female outpatient clients aged 18 years and above attending Yala hospital willing to
participate in the survey.
3.7 Exclusion Criteria
All patients with severe illnesses, acute life-threatening conditions, and severe injury, including
patients with head injuries, were excluded from the study.
3.8 Sampling Procedure
The study participants were selected through both simple random and systematic sampling. The
first study participant of the day was selected through simple random procedure. This was done
by giving the first five participants random papers labeled one to five, the client who picked
paper number one became participant number one in the study. After which the subsequent
participants of the day was through systematic sampling (after every 14th
patient). The sampling
interval was obtained by dividing 6000 (previous year’s two months outpatient visit, as sampling
frame) by 422 (the sample size). This procedure of interval selection was repeated daily until a
sample size of 422 participants was met. This took two months.
3.9 Study Instruments
Face-to-face interview was used, during which data was collected using a field tested
standardized questionnaire (Appendix II).

28
One data assistant that had a diploma in clinical medicine was recruited to help in data
collection. He was trained for three days on how to conduct the interview and to do
anthropometric measurements.
3.10 Data Collection
Information was collected on various socio-demographic factors such as age, sex and marital
status, level of education, employment status and education. In addition to questions on these
socio-demographic information, the questionnaire also included questions on smoking habits,
alcohol consumption, physical activity, parental history of hypertension and personal medical
history (where the diagnosis was made by a physician) of hypertension.
3.10.1 Blood Pressure Measurement
The physical examination included blood pressure (BP) and anthropometric measurements. The
blood pressure (systolic and diastolic) was measured using a standardized protocol (Appendix 2)
with the participant in a seated position, and after at least 3 min rest. The BP measurements were
performed on the right arm (for the purpose of standardization) using automated
sphygmomanometers (OMRON M3 HEM-7200-E Omron Matsusaka Co Ltd, Kyoto, Japan).
Special attention was given to the use of appropriate cuff sizes (13×23 cm or 16×30 cm). Three
blood pressure readings were taken 1 minute apart. The average of the last 2 readings was used
in the analysis (Cappuccio et al. 2004).

29
3.10.2 Anthropometric Measurement
Weight (to the nearest 0.5 kg) was measured using the Heine Portable Professional Adult Scale
737 (Seca gmbh & Co. kg Humburg, German). Participants were asked to stand still, face
forward, and place arms on the sides of the body.
The Seca Brand 214 Portable Stadiometer (Seca gmbh & Co. kg Humburg, German) was used to
measure the height of the participant. Height was measured without the participant wearing foot
or head gear. Before the reading was taken, the participant was requested to have feet together,
heels against the back board, knees straight, and look straight ahead. Height was recorded in
meters to the nearest 0.5 cm.
The Figure Finder Tape Measure was used to measure the waist circumference in centimeters.
This measurement was taken in a private room. The midpoint between the inferior margin of the
last rib and the crest of the ilium were marked using a tape measure. With the assistance of the
participant, the tape measure was wrapped around the waist directly over the skin or light
clothing. Just before the measurement was taken, the participant was requested to stand with
their feet together, place their arms at their side of their body with the palms of their hands facing
inwards, and breathe out gently
Body mass index (BMI) in kg/m2) was calculated as weight (kg)/ (height (m) ×height (m)).

30
3.11 Data Entry
Collected data was entered using Epi Data version 3.1. Data was double entered and validated.
The data entry template had consistency and range checks embedded in it. The validated data
was exported to SPSS version 20 for analysis.
3.12 Data Analysis
Data was analyzed using both descriptive and inferential statistics. Overall prevalence of
hypertension was calculated as the percentage of participants classified as hypertensive, with all
study participants as the denominator. Comparisons, among groups for quantitative data and
prevalence of hypertension were done with the χ2 test. Chi square test was used to determine
significance between independent variables (age, sex, level of education, marital status, waist
circumference, BMI, occupation, smoking status, alcohol drinking status, family history of
hypertension, physical activity) and hypertension. Significant variables at p≤0.3 were entered
into logistic regression model to determine factors predictive of hypertension. Finally, factors
which remained significant at p≤0.05 after adjusting for all others were considered independently
associated with hypertension. Associations are reported in terms of odds ratios (OR) with 95%
confidence intervals (CIs).
3.13 Ethical Considerations
Authority to conduct this study was obtained from the School of Graduate Studies (SGS) of
Maseno University. Ethical approval was sought and granted by Maseno University Ethics and
Review Committee, (ERC).
31
Permission to conduct the study was obtained from Yala sub-county health department and
hospital administration. The purpose of the study was explained to the study participants, after
which written consent for voluntary participation obtained from them before administration of
the questionnaire (See appendix 1, consent form).
Confidentiality of the respondents was maintained throughout the study by ensuring that names
or identifications numbers do not appear on the questionnaires and that the data collected is
stored in a safe password protected data base. Consented participants were allowed to; withdraw
from the study at any point before completion of interview. Participants with hypertension
(known or screened-detected) received on-site medical counseling and referred back to their
attending physician (known cases), or to specialists within the hospital for workup and long-term
management.
3.14 Study Limitations and Potential Biases
3.14.1 Limitations
Hypertension was defined based on a mean figure of repeated measurements at only one visit. In
a community-based survey for hypertension, this procedure is correct. However, as a true
diagnosis of hypertension should be based on repeated measurements, with at least at one
additional visit showing BP >140/90 mm Hg (Weber et al., 2014) the estimated prevalence of
hypertension from this study may have been slightly overestimated.
Furthermore, not all important risk factors were studied such as race, religion and salt
consumption. Other risk factors that could only be diagnosed through a chemical panel were not
studied. Thus, hypertension could not be fully characterized in this study.
32
Treatment and control of hypertension was not assessed. However, the study reports on a major
outcome of hypertension: the awareness of hypertension status and some risk factors in a hospital
set up. This has provided valuable insights with baseline information for future intervention
targets and in-depth research
3.14.2 Minimization of Observer Bias
This was done through the following measures
a. Development of a protocol for the collection, measurement and interpretation of
information
b. Use of standardized questionnaire or calibrated instruments, such as use of automated BP
measuring machine
c. Training of one interviewer who had a diploma in clinical to act as data assistant.

33
CHAPTER FOUR: RESULTS
4.1 Introduction
The study aimed to determine the awareness of hypertension status and its associated risk factors
among patients attending Yala sub county hospital. Therefore, this chapter presents the findings
of the study. The results are in pie charts and tables.
4.2 Characteristics of the Study Participants
Data collected from 393 out of 422, who consented to participate in the study, was analyzed.
This was 93.1 % response rate. The sex distribution of the study population was 249 (63.4%)
females and 144 (36.6%) males. The overall mean age was 39.53±16.43 years (Males =
40.21±16.46 years, Females = 39.14±16.42 years)
The majority (63.6%, n=250) of the participants were married. In terms of education, most of
the study participants completed primary school (30.3%, n=119), those with no formal schooling
were the least at 15.8%, n=62. Most (35.4%, n=139) of the study participants were self
employed, while government employees were the least (13%, n=51). In terms of smoking status,
non smokers were the majority (82.4%, n=324). Non alcohol drinkers were the majority at
87.8%, n=308 of the study participants (See Table 4.1).

34
Table 4.1: Characteristics of Study Participants
Males
n (%)
Females
n (%)
Totals
N (%)
Age (in years)
18-19
20-29
30-39
40-49
50-59
60-69
70years and above
Marital status
Never married
Widowed
Married
Education
No formal
Primary
Secondary
Tertiary
Occupation
Government employee
Self employed
Non employee
Student
Family history
Yes
No
Adequate Physical activity
Yes
No
BMI
Normal
Underweight
Overweight
Obese
Waist circumference
High
Normal
5 (3.5)
45(31.2)
27(18.8)
19(13.2)
24(16.7)
18(12.5)
6(4.2)
39(27.1)
7(4.9)
98(68.1)
18(12.5)
40(27.8)
32(22.2)
53(36.8)
26(18.1)
58(40.3)
27(18.8)
33(22.9)
33(22.9)
110(76.4)
81(56.2)
63(43.8)
87(60.4)
10(6.9)
34(23.6)
13(9.0)
19(13.2)
125(86.8)
17(6.8)
77(30.9)
44(17.7)
35(14.1)
42 (16.9)
25(10.0)
9 (3.6)
53(21.3)
42(17.7)
152(61.0)
44(17.7)
79(31.7)
66(26.5)
60(24.1)
25(10.0)
81(32.5)
90(36.1)
53(21.3)
68(27.3)
181(72,7)
141(56.6)
108(43.4)
127(52.0)
8(3.2)
80(32.1)
34(13.7)
153(61.4)
96(38.6)
22(5.6)
122(31.0)
71(18.1)
54 (13.7)
66 (16.8)
43 (10.9)
15 (3.8)
92(23.4)
51(13.0)
250(63.6)
62(15,8)
119(30.3)
98(24.9)
113(28.8)
51(13.0)
139(35.4)
117(29.8)
86(21.9)
291(74.0)
102(26.0)
222(56.6)
171(43.5)
214(54.5)
18(4.6)
114(29.0)
47(12.0)
172(56.2)
221(56.2)
35
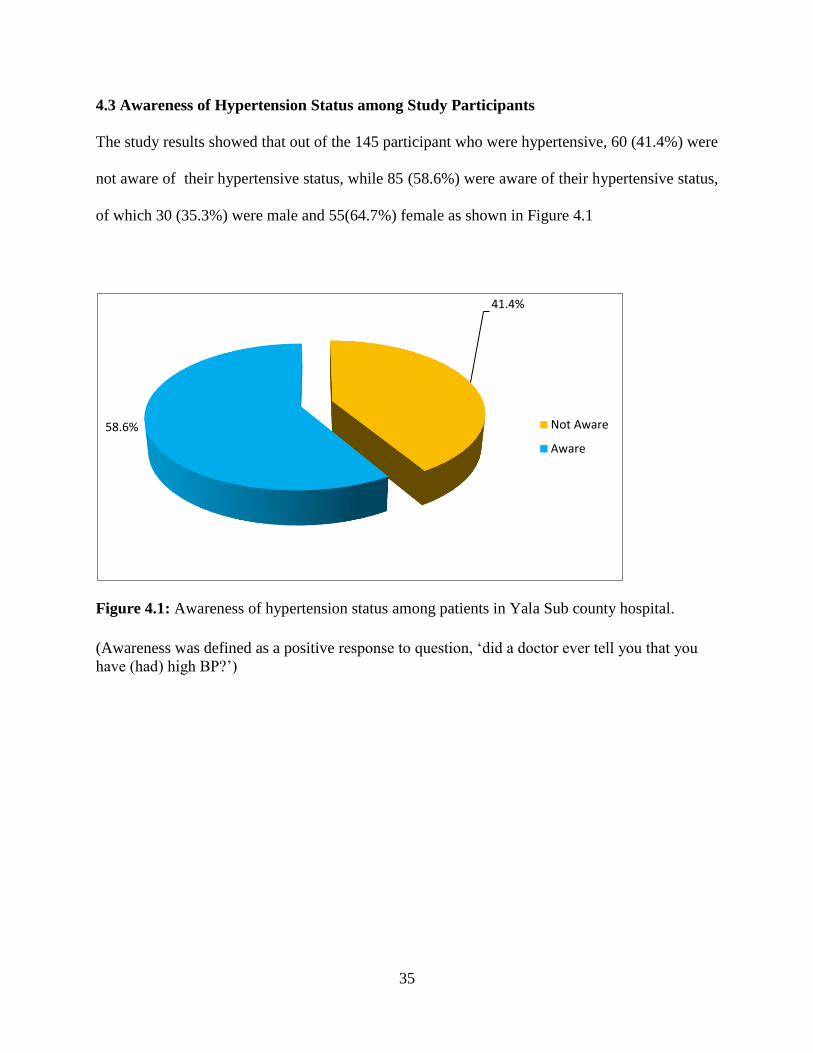
4.3 Awareness of Hypertension Status among Study Participants
The study results showed that out of the 145 participant who were hypertensive, 60 (41.4%) were
not aware of their hypertensive status, while 85 (58.6%) were aware of their hypertensive status,
of which 30 (35.3%) were male and 55(64.7%) female as shown in Figure 4.1
Figure 4.1: Awareness of hypertension status among patients in Yala Sub county hospital.
(Awareness was defined as a positive response to question, ‘did a doctor ever tell you that you
have (had) high BP?’)
41.4%
58.6% Not Aware
Aware

36
Awareness of hypertension status increased with advancing age, peaked at the age group
between 50-59 years old. In terms of sex distribution awareness status was slightly more in the
females 64.7% (n=55) than their male counterparts (see Figure 4.2).
Figure 4.2: Age and Sex Distributed Hypertension Awareness Status
4.4 Non Modifiable Risk Factors for Hypertension
Age was the only non modifiable risk factor for hypertension (X2=154.393, p <0.001) as shown
in table 4.2
0.0%
2.8%
4.8% 5.5%
13.1%
9.7%
2.8% 1.4%
2.8% 4.1%
13.1%
21.4%
13.8%
4.8%
Less than 20years
20 - 29 years 30 - 39 years 40 - 49 years 50 - 59 years 60 - 69 years 70 years andabove
Males Females

37
Table 4.2: Non Modifiable Risk Factors for Hypertension
Parameter HT
No Yes
n (%) n (%)
Total (N) X2 df P value
Gender
Male
Female
Age(Years)
18-19
20-29
30-39
40-49
50-59
60-69
>=70 yrs
Family history of
HT
Yes
No
88(61.1) 56(38.6)
160(64.3) 89(35.7)
20 (90.9) 2(9.1)
115(93.3) 8(6.6)
57(83.1) 13(16.9)
27(50.0) 27(50.0)
16(22.7) 50(77.3)
9(20.9) 34(79.1)
4(26.7) 11(73.3)
63(15.8) 39(38.6)
185(63.6) 06(36.4)
144(36.6)
249(63.4)
22(5.6)
123(31.0)
70(18.1)
54(13.7)
66(16.8)
43(10.9)
15(3.8)
102(26.0)
291(74.0)
0.388
154.393
0.154
1
6
1
0.533
<0.001
0.695
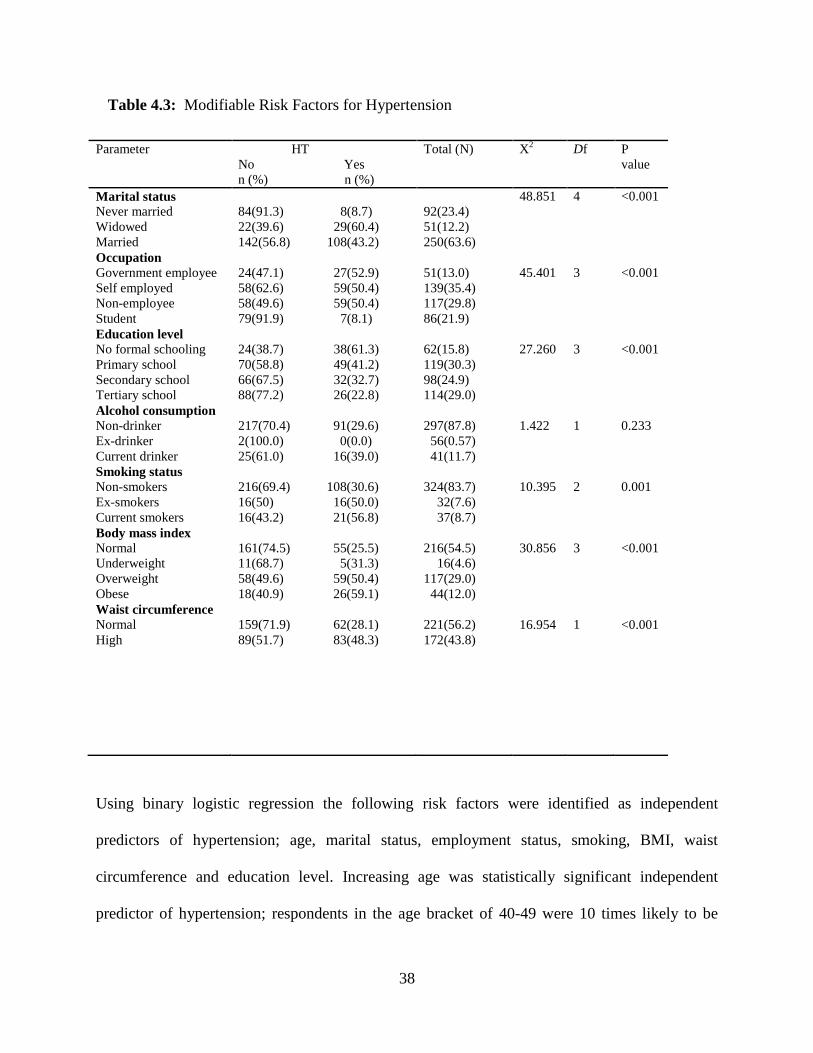
4.5 Modifiable Risk Factors for Hypertension
The study found the following risk factors significantly associated with hypertension marital
status (X2=47.478, p <0.001); inverse relationship was observed between level of education and
prevalence of hypertension (X2= 27.260, P <0.001); occupation (X
2=45.401, p <0.001); tobacco
use (X2=10.395, p 0.001); body mass index (X
2=30.856, p < 0.001) and waist circumference
(X2=16.954, p <0.001).
However, there was no significant statistical association between alcohol consumption
(X2=1.422, p=0.233), physical activity (X
2=0.413, p=0.520) and hypertension. The summary of
the results are as shown in Table 4.3
38
Table 4.3: Modifiable Risk Factors for Hypertension
Parameter HT
No Yes
n (%) n (%)
Total (N) X2 Df P
value
Marital status
Never married
Widowed
Married
Occupation
Government employee
Self employed
Non-employee
Student
Education level
No formal schooling
Primary school
Secondary school
Tertiary school
Alcohol consumption
Non-drinker
Ex-drinker
Current drinker
Smoking status
Non-smokers
Ex-smokers
Current smokers
Body mass index
Normal
Underweight
Overweight
Obese
Waist circumference
Normal
High
84(91.3) 8(8.7)
22(39.6) 29(60.4)
142(56.8) 108(43.2)
24(47.1) 27(52.9)
58(62.6) 59(50.4)
58(49.6) 59(50.4)
79(91.9) 7(8.1)
24(38.7) 38(61.3)
70(58.8) 49(41.2)
66(67.5) 32(32.7)
88(77.2) 26(22.8)
217(70.4) 91(29.6)
2(100.0) 0(0.0)
25(61.0) 16(39.0)
216(69.4) 108(30.6)
16(50) 16(50.0)
16(43.2) 21(56.8)
161(74.5) 55(25.5)
11(68.7) 5(31.3)
58(49.6) 59(50.4)
18(40.9) 26(59.1)
159(71.9) 62(28.1)
89(51.7) 83(48.3)
92(23.4)
51(12.2)
250(63.6)
51(13.0)
139(35.4)
117(29.8)
86(21.9)
62(15.8)
119(30.3)
98(24.9)
114(29.0)
297(87.8)
56(0.57)
41(11.7)
324(83.7)
32(7.6)
37(8.7)
216(54.5)
16(4.6)
117(29.0)
44(12.0)
221(56.2)
172(43.8)
48.851
45.401
27.260
1.422
10.395
30.856
16.954
4
3
3
1
2
3
1
<0.001
<0.001
<0.001
0.233
0.001
<0.001
<0.001
Using binary logistic regression the following risk factors were identified as independent
predictors of hypertension; age, marital status, employment status, smoking, BMI, waist
circumference and education level. Increasing age was statistically significant independent
predictor of hypertension; respondents in the age bracket of 40-49 were 10 times likely to be

39
hypertensive than those below 30 years OR (95% CI) = 10.0 (2.13-47.04) p= 0.004. In terms of
marital status, the widowed were 16 times more likely to be hypertensive than those never
married, OR (95 CI) = 16.01 (6.34-40.52) p = <0.001. With regards to smoking status, the
current smokers were approximately 3 times likely to be hypertensive than the non smokers, OR
(95% CI) = 2.63 (1.32-5.23), p= 0.006. Increasing BMI, was also an independent predictor for
hypertension; the obese were 4 times likely to be hypertensive than those with normal weight,
OR (95% CI) = 4.23 (2.15-8.30) p = 0.001. Participants with high waist circumference were 2
times likely to have hypertension than those with normal waist circumference OR (95 %CI) =
2.39 (1.57-3.64) p = <0.001. The summary of the results are as shown in Table 4.4

40
Table 4.4: Logistic Regression of Statistically Significant Risk Factors in Bivariate Analysis
Characteristic OR (95% CI) S.E Wald df p value
Age group
18- 19 years Reference
20 - 29 year 0.70 (0.14 - 3.52) 0.83 0.19 1 0.661
30 - 39 years 2.28 (0.47 - 11.00) 0.80 1.05 1 0.304
40 - 49 years 10.00 (2.13 - 47.04) 0.79 8.50 1 0.004
50 - 59 years 31.25 ( 6.58 -
148.53)
0.80 18.73 1 <0.001
60 - 69 years 37.78 (7.41 -
192.56)
0.83 19.10 1 <0.001
>=70 years 27.50 ( 4.32 -
174.89)
0.94 12.33 1 0.004
Level of education
No formal schooling Reference
Primary school 0.44 ( 0.24 - 0.83) 0.32 6.48 1 0.011
Secondary school 0.31 (0.16 - 0.59) 0.34 12.24 1 0.001
Tertiary 0.19 (0.10 - 0.37) 0.34 23.92 1 <0.001
Marital status
Never married Reference
Widowed 16.01 (6.34 - 40.52) 0.47 34.36 1 <0.001
Married 7.99 (3.71 - 17.20) 0.39 28.17 1 <0.001
Smoking status
Non smokers Reference
Ex-smokers 2.00 (0.96 - 4.15) 0.37 3.46 1 0.063
Current smokers 2.63 (1.32 - 5.23) 0.35 7.51 1 0.006
Waist circumference
Normal Reference
High 2.39 (1.57 - 3.64) 0.21 16.63 1 <0.001
Body mass index
Normal Reference
Under weight 1.33 (0.44 - 4.0) 0.56 0.26 1 0.61
Overweight 2.98 (1.85 - 4.79) 0.24 20.32 1 <0.001
Obese 4.23 (2.15 - 8.30) 0.34 17.55 1 <0.001

41
CHAPTER FIVE: DISCUSSION
5.1 Awareness of Hypertension Status
Correct knowledge of blood pressure status can be regarded as the first step in the prevention of
the cardiovascular complications of hypertension as such knowledge could serve as a platform
for making necessary health decisions and developing adequate healthy behavior and lifestyle
(Kengne et al., 2011).
In this study, 58.6% of the hypertensive was aware of their hypertension status. Slightly half of
the participants were unaware of their hypertension status. This could imply a delay in initiation
of treatment and could lead to increased complications associated with hypertension. Though
this awareness of hypertension status was higher than that found in studies done in Southwest
Ethiopia (35.1%) (Gudina et al., 2013), Angola (21.6%) (Pires et al., 2013), in Uganda (10%)
(Wamala et al., 2009) and in rural Kenya of Nandi district (6%) (Hendriks et al., 2012). This
difference could be due to heterogeneity of the study setting and methodologies. However the
awareness is lower than that found by studies done in developed countries. In the USA, for
instance, awareness of hypertension status is as high as 76%, (Mittal et al., 2002), reflecting the
success achieved by a coordinated policy to detect individuals with higher-than-optimal BP
levels.

42
Awareness of hypertension status in this study was significantly higher among female
participants. This could be explained by the fact that females appear to be more concerned with
their health compared to males, and this is expected since health status may affect body image
which is more important for females (Vlassoff, 2007). This difference among the sexes could
also be explained by the fact that women are more in contact with healthcare services than men
through maternal child health programs. Similar findings were also demonstrated by Van de
Vijver et al., 2013; Pires et al., 2013. The study demonstrated that awareness of hypertension
status increased with increasing age in men and women. Older people tend to be more at risk of
developing hypertension are also expected to be more concerned with their health status
compared to the younger age group. This result was similar to that found by Mathenge et al.,
(2010); Dzudie et al., 2012. .
Awareness of hypertension status in Africa is lagging behind many world regions. A possible
contributory factor would be the affordability of the cost of health care, which remains a major
barrier in the African setting as out-of-pocket spending is the main source of funding for health
care costs (Pereira et al., 2009). Significant numbers of individuals with hypertension in Africa
are unaware of their condition and, among those with diagnosed hypertension, treatment is
frequently inadequate (UN 2011)

43
5.2 Non Modifiable Risk Factors for Hypertension
Out of the three factors, this study found age as the only non modifiable risk factor for
hypertension.
With respect to age, adults aged 40 years or older were more likely to be hypertensive compared
to those in the younger age groups. This is consistent with findings from Gudina et al., 2013,
who found out that the advanced age were more likely to be hypertensive than their younger
counter part. Edwards et al., (2000), too determined that hypertensive men and women in rural
and urban areas in Tanzania tended to be significantly older compared to those who were not
hypertensive. Likewise, study done by Wamala et al., (2009), Participants with hypertension
were significantly older with an average age of 44.5, compared to normal- tensive participants
who had an average age of 37.6. This could be due to the fact that advance age increases the risk
of exposure to the lifestyle risk factors for hypertension and hence the observed increase in
hypertensive risk with aging.
5.3 Modifiable Risk Factors for Hypertension
This study observed several risk factors which were associated with hypertension, including
educational level, marital status, alcohol use, smoking status and weight. It should be noted
three modifiable factors including tertiary education, alcohol use and being overweight or obese
were identified in the World Health Report of 1997 as risk factors for hypertension (WHO 1998).
Several studies have reported alcohol use to be a risk factor for hypertension. Here in Africa,
many researchers (Agyemang, 2006; Aubert, 1998; Baik et al., 2008; Fuchs et al., 2001; Sesso et
al., 2008) among others have demonstrated an association between alcohol use (moderate to
44
heavy consumption) and hypertension. Though in this study there was no statistical significance
in association between alcohol consumption and hypertension. This could be due to the fact that
only alcohol drinkers and non drinkers were analyzed, no attention to quantity i.e., moderate to
heavy consumption was considered.
This study found an inverse relationship between hypertension and education, those participants
with higher the education level had a lower the chance of having hypertension. This could be
due to the fact that in this study most of the overweight and obese participants were less
educated. This observation could also be explained by the less awareness of dietary habits among
the less educated that reduce the incidence of hypertension, particularly the amount of salt intake
that was found to play an important role in the development and control of hypertension (Sacks
et al., 2001). This finding was supported by previous studies done Pires et al., (2013), and
Wamala et al., (2009). The study findings were also similar to those from a study conducted in
an urban population in early epidemiological transition in Tanzania where Bovet et al., (2002),
reported that non-educated men were more likely to have higher systolic blood pressure than
those with primary education (p< 0.01). Likewise in the developed world, for instance in a multi-
country study by Stamler (1992), it was found that age-adjusted systolic blood pressure was
1.3mmHg higher (p-value = 0.05) for men and 4.5mmHg (p-value < 0.001) for women with 10
fewer years of education.
This study also revealed an increased hypertension prevalence among the widowed, OR 16.01
(95% CI) (6.34-40.52), p = <0.001. This may be associated with the psychological stress faced
by this group of people. Capell et al., (2001), showed that psychological factors could affect the

45
entire neuroendocrine system ultimately leading to hypertension. Similar observation was also
noted by Al-Nozha et al., (2007) in a larger community-based study conducted among 17,230
participants aged 30 to 7o years in Saudi Arabia, it was found out that hypertension was highest
among the widowed than single participants. Contrary to above findings, El Bcheraoui et al.,
(2014) in a national multistage survey of individuals aged 15 years or older in Saudi, found no
association between marital status and high blood pressure after adjusting for confounders.
The findings in this study showed an association between cigarette smoking and hypertension,
with current smokers being 2 times more likely to be hypertensive than the non-smokers.
Cigarette smoking makes blood vessels and blood cells sticky, allowing cholesterol to build up
inside them. This was called atherosclerosis (Winstanley et al., 1995). This in turn could lead to
raised blood pressure and clot formation. Likewise it can cause increased BP by increasing
sympathetic activity (Kong et al., 2002). This finding was similar to those obtained by previous
studies, (De Cesaris et al., 1992; Dochi et al., 2009).
Participants with a BMI greater than 25 were more likely to be hypertensive compared to those
with a BMI of 25 or lower. These findings imply that having a normal weight, or losing weight
among those who were overweight or obese, would reduce the chances of developing
hypertension. BMI was also greatly influenced by dietary practices like high intake of saturated
fatty acids, tobacco use and low physical activity (Brundtland 2002). However, in this study
only two were determined i.e., tobacco use and physical activity. Tobacco use was significantly

46
associated with hypertension (p <0.001). Perhaps the risk imposed by these is all reflected in the
BMI of the individual.
In Tanzania, Bovet et al., (2002) found that body mass index was strongly and independently
associated with systolic and diastolic blood pressure (1.01 mmHg systolic BP per 1 kg/m2
increase in BMI). In Nigeria, Agyemang (2006) has also reported an independent association
between BMI and BP. Similar results were reported by Önal et al., (2004) who found that
hypertensive adults aged 25 years or older were twice more likely to be overweight or obese in
Istanbul, Turkey.
47
CHAPTER SIX
SUMMARY, CONCLUSIONS AND RECOMMENDATIONS
6.1 Introduction
This chapter presents summary of the main findings, conclusions drawn, recommendations and
suggestions for further research.
6.2 Summary of the Main Findings
6.2.1 Awareness of Hypertension Status
Awareness of hypertension status was at 58.6% (n=85), of which 64.7% (n=55) were females.
Awareness of hypertension status was high among the elderly than the younger study
participants.
6.2.2 Non Modifiable Risk Factor for Hypertension
Only age was the identified non modifiable risk factor for hypertension
6.2.3 Modifiable Risk Factors for Hypertension
Independent modifiable predictors of hypertension identified included BMI (X2=30.856,
p<0.001), waist circumference (X2=16.954, p<0.001), smoking (X2=10.395, p0.001),
educational level (X2=27.260, p<0.001), employment (X2=45.401, p<0.001) and marital status
(X2=48.851, p<0.001)

48
6.3 Conclusion
6.3.1 Awareness of Hypertension Status
Approximately a half of the study participants were unaware of their hypertension status. This
could lead to delay in treatment initiation which ultimately increases complications arising from
the disease.
6.3.2 Associated Risk Factors for Hypertension
All the identified risk factors except age are modifiable either through behavior or lifestyle
modification
6.4 Recommendations
6.4.1 Recommendation on Awareness of Hypertension
Health workers should be encouraged to sensitize clients attending hospital through regular
health education on hypertension. This initiative could help in improving awareness of
hypertension status among hospital attending clients.
6.4.2 Recommendations on the Non Modifiable Risk Factors for Hypertension
Health workers should prioritize the elderly clients who visit the hospitals in terms of health talks
and promotional messages on hypertension.

49
6.4.3 Recommendations on the modifiable risk factor for hypertension
Regular health promotion talks in hospitals. This should involve topics on health benefits of
weight reduction, smoking cessation and health benefits higher education.

50
REFERENCES
Addo,J., Smeeth, L., & Leon, D. (2007). Hypertension in sub-Saharan Africa: a systematic
review. Hypertension 50(6): 1012-8.
Adedoyin, R., Mbada, M., Balogun, T., Martins, R., Adebayo, A. Akintomide,P., & Akinwusi,P.
(2008). Prevalence and pattern of hypertension in a semi urban community in Nigeria.
Eur J Cardiovasc Prev Rehabil 15(6): 683-7.
Agyemang, C. (2006). Rural and urban differences in blood pressure and hypertension in Ghana,
West Africa. Public Health 120(6): 525-33.
Al-Nozha, M. M., Abdullah, M., Arafah, M. R., Khalil, M. Z., Khan, N. B., Al-Mazrou, Y. Y., ...
Al-Harthi, S. S. (2007). Hypertension in Saudi Arabia.Saudi medical journal, 28(1), 77-
84.
Alwan, H., Pruijm, M., Ponte, B., Ackermann, D., Guessous, I., Ehret, G., ... Paccaud, F. (2014).
Epidemiology of masked and white-coat hypertension: the family-based SKIPOGH
study. PloS one, 9(3), e92522.
Andy, J., Peters,E., Ekrikpo,U., Akpan,N., Unadike, B.,& Ekott. (2012). Prevalence and
correlates of hypertension among the Ibibio/Annangs, Efiks and Obolos: a cross sectional
community survey in rural South-South Nigeria. Ethn Dis 22(3): 335-9.
Ataklte, F., Erqou, S., Kaptoge S., Taye, B., Echouffo-Tcheugui, J.B., Kengne, A.P. (2014)
Burden of undiagnosed hypertension in sub-saharan Africa: a systematic review and
meta-analysis. Hypertension;65:291–8.
Bacon, S., Sherwood,A., Hinderliter, A., & Blumenthal, J. (2004). Effects of exercise, diet and
weight loss on high blood pressure. Sports Med 34(5): 307-16.
Baik, I., & Shin, C. (2008). Prospective study of alcohol consumption and metabolic
syndrome. The American Journal of Clinical Nutrition, 87(5), 1455-1463.
Bovet, P., Shamlaye,C., Gabriel, A., Riesen, W.,& Paccaud,F. (2006). Prevalence of
cardiovascular risk factors in a middle-income country and estimated cost of a treatment
strategy. BMC Public Health 6: 9.
Capell, C.L., Merman J., McGee N., & Rosenfield D. (2001) The quality of life in the Chicago
Collar countries: work, family and well-being. The annual meetings of the Midwest
sociological society, St. Louis.

51
Cappuccio, F., Micah,F., Emmett,L., Kerry, S., Antwi,S., Martin-Peprah, R., … Eastwood, B.
(2004). Prevalence, detection, management, and control of hypertension in Ashanti, West
Africa. Hypertension 43(5): 1017-22.
Chobanian, A., Bakris, G., Black, H., Cushman, W., Green, L., Izzo, J., ... Roccella, J. (2003).
The Seventh Report of the Joint National Committee on Prevention, Detection,
Evaluation, and Treatment of High Blood Pressure: the JNC 7 report. Jama 289(19):
2560-72.
Chockalingam, A. (2007). Impact of World Hypertension Day. Canadian Journal of Cardiology
23 (7): 517–9.
Cutler, J., Follmann,D., & Allender, P. (1997). Randomized trials of sodium reduction: an
overview. Am J Clin Nutr 65(2 Suppl): 643S-651S.
Dalal, S., Beunza, J., Volmink, J., Adebamowo, C., Bajunirwe, F., Njelekela, M., & Holmes, D.
(2011). Non-communicable diseases in sub-Saharan Africa: what we know now. Int J
Epidemiol 40(4): 885-901.
De Cesaris, R., Ranieri, G., Filitti, G., Bonfantino, M., & Andriani, A. (1992). Cardiovascular
effects of cigarette smoking. Cardiology 81(4-5): 233-7.
Dias da Costa, J. ., Fuchs, S., Olinto, M., Gigante, D., Menezes, A., Macedo,S., & Gehrke, S.
(2002). Cost-effectiveness of hypertension treatment: a population-based study. Sao
Paulo Med J 120(4): 100-4.
Dickinson, H. O., Mason,J., Nicolson, D., Campbell, F., Beyer, F., Cook, J., …Ford, G. (2006).
Lifestyle interventions to reduce raised blood pressure: a systematic review of
randomized controlled trials. J Hypertens 24(2): 215-33.
Dochi, M., Sakata, K., Oishi, K., Tanaka, K., Kobayashi,E., & Suwazono, Y.(2009). Smoking as
an independent risk factor for hypertension: a 14-year longitudinal study in male
Japanese workers. Tohoku J Exp Med 217(1): 37-43.
Dzudie A., Kengne, A.P., Muna, W.F., Ba H., Menanga A., Kouam Kouam C., … Kathleen B N.
(2012). Prevalence, awareness, treatment and control of hypertension in a self-selected
Sub-Saharan African urban population: a cross-sectional study. BMJ Open ,2(4):2012–
001217.
Edwards, R., Unwin, N., Mugusi, F., Whiting, D., Rashid, S., Kissima, J., & Alberti, G. (2000).
Hypertension prevalence and care in an urban and rural area of Tanzania. J Hypertens
18(2): 145-52.

52
Ejim, E., Okafor, C., Emehel, A., Mbah, A., Onyia, U.,Egwuonwu, T., … Onwubere, J. (2011).
Prevalence of cardiovascular risk factors in the middle-aged and elderly population of a
nigerian rural community. J Trop Med 2011: 308687.
Elmer, P., Obarzanek, E., Vollmer, W., Simons-Morton, D., Stevens, V., Young, D., … Appel, J.
(2006). Effects of comprehensive lifestyle modification on diet, weight, physical fitness,
and blood pressure control: 18-month results of a randomized trial. Ann Intern Med
144(7): 485-95.
Ezzati, M., Lopez, A., Rodgers, A., Vander Hoorn, S., & Murray, C.(2002). Selected major risk
factors and global and regional burden of disease. Lancet 360(9343): 1347-60.
Fernald, L. C., & Adler, N. E. (2008). Blood pressure and socioeconomic status in low-income
women in Mexico: a reverse gradient?. Journal of epidemiology and community
health, 62(5), e8-e8.
Faselis, C., Doumas, M., Panagiotakos, D., Kheirbek R., Korshak, L., Manolis, A., … Kokkinos
P. (2012) Body mass index, exercise capacity, and mortality risk in male veterans with
hypertension. Am J Hypertens. 2012; 25:444–450.
Ford, E., & DeStefano, F. (1991). Risk factors for mortality from all causes and from
coronaryheart disease among persons with diabetes. Findings from the National Health
and Nutrition Examination Survey I Epidemiologic Follow-up Study. Am J Epidemiol
133(12): 1220-30.
Fuchs, S. C., Petter, J. G., Accordi, M. C., Zen, V. L., Pizzol-Jr, A. D., Moreira, L. B., & Fuchs,
F. D. (2001). Establishing the prevalence of hypertension. Influence of sampling
criteria. Arquivos brasileiros de cardiologia, 76(6), 449-452.
Fuentes, R., Ilmaniemi, N., Laurikainen, E., Tuomilehto, J., & Nissinen, A. (2000). Hypertension
in developing economies: a review of population-based studies carried out from 1980 to
1998. J Hypertens 18(5): 521-9.
Gaddam, K., Verma, A., Thompson, M., Amin, R., & Ventura, H. (2009). Hypertension and
cardiac failure in its various forms. Med Clin North Am 93(3): 665-80.
Gaziano, T., Bitton, A., Anand, S., & Weinstein, M. (2009). The global cost of nonoptimal
blood pressure. J Hypertens 27(7): 1472-7.
Glynn, R. J., Brock, D., Harris, T., Havlik, R.,Chrischilles, E., Ostfeld, A., … Hennekens, H.
(1995).Use of antihypertensive drugs and trends in blood pressure in the elderly. Arch
Intern Med 155(17): 1855-60.

53
Godfrey, R., & Julien,M. (2005). Urbanisation and health. Clin Med 5(2): 137-41.
Goma, FM., Nzala, SH., Babaniyi, O.,Songolo, P., Zyaambo, C., Rudatsikira, E., … Muula, SA.
(2011). Prevalence of hypertension and its correlates in Lusaka urban district of Zambia:
a population based survey. Int Arch Med 4: 34.
Graudal, N., Hubeck-Graudal,T., & Jurgens, G. (2006). Effects of low sodium diet versus high
sodium diet on blood pressure, renin, aldosterone, catecholamines, cholesterol, and
triglyceride. Cochrane Database Syst Rev(11): CD004022.
Gueyffier, F., Bulpitt, C., Boissel, J., Schron, E., Ekbom, T., Fagard, R., … Coope, J. (1999).
Antihypertensive drugs in very old people: a subgroup meta-analysis of randomised
controlled trials. INDANA Group. Lancet 353(9155): 793-6.
Gudina, E. K., Michael, Y., & Assegid, S. (2013). Prevalence of hypertension and its risk factors
in southwest Ethiopia: a hospital-based cross-sectional survey. Integrated Blood Pressure
Control, 6, 111–117.
Gupta, R., Joshi, P., Mohan, V., Reddy, K., &Yusuf, S. (2008). Epidemiology and causation of
coronary heart disease and stroke in India. Heart 94(1): 16-26.
Guyton, A., &Hall, J. (2006). Medical Physiology, Elsaver
Haslam, D., &James, W. (2005). Obesity. Lancet 366(9492): 1197-209.
Hayashi, T., Boyko, E., Leonetti, D., McNeely, M., Newell-Morris, L., Kahn, S., & Fujimoto,
W. (2003). Visceral adiposity and the prevalence of hypertension in Japanese Americans.
Circulation 108(14): 1718-23.
He, F., Li, J., & Macgregor, G. (2013). Effect of longer-term modest salt reduction on blood
pressure. Cochrane Database Syst Rev 4: CD004937.
He, J., Muntner, P., Chen, J., Roccella, E., Streiffer, R., & Whelton, P. (2002). Factorsassociated
with hypertension control in the general population of the United States. Arch Intern Med
162(9): 1051-8.
Hendriks, M., Wit, F., Roos, M., Brewster, L., Akande, T., de Beer, I., … Schultsz, C. (2012).
Hypertension in sub-Saharan Africa: cross-sectional surveys in four rural and urban
communities. PLoS One 7(3): e32638.

54
Hubert, H., Feinleib, M., McNamara, P., & Castelli, W.P (1983). Obesity as an independent risk
factor for cardiovascular disease: a 26-year follow-up of participants in the Framingham
Heart Study. Circulation 67(5): 968-77.
Joffres, M., Falaschetti E., Gillespie C., Robitaille C.,Loustalot F., Poulter N., … Campbell N.
(2013). Hypertension prevalence, awareness, treatment and control in national surveys
from England, the USA and Canada, and correlation with stroke and ischaemic heart
disease mortality: a cross-sectional study. BMJ Open 2013; 3:e003423.
Joshi, M.D., Ayah R., Njau,E.K., Wanjiru, R., Kayima, J.K., Njeru, E.K., … Mutai
K,K. Prevalence of hypertension and associated cardiovascular risk factors in an urban
slum in Nairobi, Kenya: a population-based survey. BMC Public Health. 2014;14:1177
Kaplan, N.M & Opie, L.H (2006). Controversies in hypertension. Lancet. 2006; 367:168–76.
Kayima, J., Wanyenze, R., Katamba, A., Leontsini, E., & Nuwaha, F. (2013). Hypertension
awareness, treatment and control in Africa: a systematic review. BMC Cardiovasc Disord
13: 54.
Kearney, P., Whelton, M., Reynolds, K., Whelton, P., & He, J. (2004). Worldwide prevalence of
hypertension: a systematic review. J Hypertens 22(1): 11-9.
Kearney, P., Whelton, M., Reynolds, K., Muntner, P., Whelton, P., & He, J. (2005). Global
burden of hypertension: analysis of worldwide data. Lancet 365(9455): 217-23.
Kengne, A. P., Awah, P.K., Fezeu LL.,Sobngwi,E., & Mbanya,J.C. (2009) Primary health care
for hypertension by nurses in rural and urban sub-Saharan Africa. J Clin Hypertens
(Greenwich);11:564–72.
Kenya National Bureau of Statistics (KNBS) (2009). Kenya Population and Housing Census.
Nairobi: Kenya National Bureau of Statistics.
Kiberenge, Z.M., Ndegwa, E.W., Njenga, E.W., & Muchemi. (2010) Knowledge, attitude and
practices related to diabetes among community members in four provinces in
Kenya: A cross-sectional study The Pan African Medical Journal, 7, p. 2
Kingue, S., Ngoe, C. N., Menanga, A. P., Jingi, A. M., Noubiap, J. J. N., Fesuh, B., ... Muna, W.
F. (2015). Prevalence and Risk Factors of Hypertension in Urban Areas of Cameroon: A
Nationwide Population‐Based Cross‐Sectional Study. The Journal of Clinical
Hypertension, 17(10), 819-824.

55
Knight, E., Bohn, R., Wang, P., Glynn, R., Mogun, H., &Avorn, J. (2001). Predictors of
uncontrolled hypertension in ambulatory patients. Hypertension 38(4): 809-14.
Kokkinos, P., Manolis A., Pittaras A., Doumas M., Giannelou A., Panagiotakos D.B.,… Myers J
(2009). Exercise capacity and mortality in hypertensive men with and without additional
risk factors. Hypertension.2009;53:494–499.
Kotsis, V., Stabouli, S., Bouldin, M., Low, A., Toumanidis, S., & Zakopoulos, N. (2005). Impact
of obesity on 24-hour ambulatory blood pressure and hypertension. Hypertension 45(4):
602-7.
Krambeck, A., Gettman, M., Rohlinger, A., Lohse, C., Patterson, D., & Segura, J. (2006).
Diabetes mellitus and hypertension associated with shock wave lithotripsy of renal and
proximal ureteral stones at 19 years of followup. J Urol 175(5): 1742-7.
Kruk, J. (2007). Lifetime physical activity and the risk of breast cancer: a case-control study.
Cancer Detect Prev 31(1): 18-28.
Law, M., Wald, N., & Morris, J. (2003).Lowering blood pressure to prevent myocardial
infarction and stroke: a new preventive strategy. Health Technol Assess 7(31): 1-94.
Lawes, C.,Vander Hoorn, S., Law, M., Elliott, P., MacMahon, S., & Rodgers, A. (2006). Blood
pressure and the global burden of disease 2000. Part II: estimates of attributable burden. J
Hypertens 24(3): 423-30.
Lawes, C., Vander Hoorn, S., & Rodgers, A. (2008). Global burden of blood-pressure-related
disease, 2001. Lancet 371(9623): 1513-8.
Lea, J., & Nicholas, S. (2002). Diabetes mellitus and hypertension: key risk factors for kidney
disease. J Natl Med Assoc 94(8 Suppl): 7S-15S.
Leone A: Does Smoking Act as a Friend or Enemy of Blood Pressure? Let Release Pandora's
Box. Cardiol Res Pract 2011, 2011:264894.
Levenstein, S., Smith, M., & Kaplan, G. (2001). Psychosocial predictors of hypertension in men
and women. Arch Intern Med 161(10): 1341-6.
Lloyd-Jones, D., Adams, R., Brown, T., Carnethon, M., Dai, S., De Simone, G., … Wylie-
Rosett, J. (2010). Heart disease and stroke statistics--2010 update: a report from the
American Heart Association. Circulation 121(7): e46-e215.

56
Lipowicz, A., & Lopuszanska, M. (2005). Marital differences in blood pressure and the risk of
hypertension among Polish men. European journal of epidemiology, 20(5), 421-427.
Lopez, A., & Mathers, C. (2006). Measuring the global burden of disease and epidemiological
transitions: 2002-2030. Ann Trop Med Parasitol 100(5-6): 481-99.
Maletnlema, T. (2002). A Tanzanian perspective on the nutrition transition and its implications
for health. Public Health Nutr 5(1A): 163-8.
Maris, M., Melchert, R., Joseph, J., & Kennedy, R. (2005). Gender differences in bloodpressure
and heart rate in spontaneously hypertensive and Wistar-Kyoto rats. Clin Exp Pharmacol
Physiol 32(1-2): 35-9.
Mathenge, W., Foster, A., & Kuper, H. (2010). Urbanization, ethnicity and cardiovascular risk in
a population in transition in Nakuru, Kenya: a population-based survey. BMC Public
Health 10: 569.
Mc Causland, F. R., Sacks, F. M., & Forman, J. P. (2014). Marital status, dipping and nocturnal
blood pressure: results from the dietary approaches to stop hypertension trial. Journal of
hypertension, 32(4), 756-761.
Mendez, M., Cooper, R., Wilks, R., Luke., A. & Forrester., T. (2003). Income, education, and
blood pressure in adults in Jamaica, a middle-income developing country. Int J Epidemiol
32(3): 400-8.
Mittal, B., & Singh, A. (2008). Hypertension in the developing world: challenges and
opportunities. Am J Kidney Dis 55(3): 590-8.
Msyamboza, K.P., Kathyola, D., Dzowela, T., & Bowie,C. (2012) The burden of hypertension
and its risk factors in Malawi: Nationwide population-based STEPS survey International
Health, 4 (4), pp. 246–252
Mugenda, O., & Mugenda, A. (2003). Research Methods: Quantitative & Qualitative
Approaches. Nairobi, African Centre for Technology Studies.
Murphy, B., Stanton., T & Dunn, F. (2009). Hypertension and myocardial ischemia. Med Clin
North Am 93(3): 681-95.
Nakanishi, N., & Suzuki, K. (2005). Daily life activity and the risk of developing hypertension in
middle-aged Japanese men. Arch Intern Med 165(2): 214-20.

57
NHFA. (2003). A review of the relationship between dietary fat and overweight/obesity,
National Heart Foundation of Australia.
Norman, M., Lieberman, E., & Neal, W. (2002). Kaplan's Clinical Hypertension, Lippincott
Williams & Wilkins Hardcover.
Nwankwo, T., Yoon, S.S., Burt, V., & Gu, Q. (2013). Hypertension among adults in the United
States: National Health and Nutrition Examination Survey, 2011–2012. NCHS Data Brief
2013: 1–8.
Ogeng'o, J., Olabu, B.O., Ong'era, D., & Sinkeet, S.R. (2010). Pattern of acute myocardial
infarction in an African country. Acta Cardiol 65(6): 613-8.
Ogeng’o J., Olabu B.O., Mburu A.N., Sinkeet S.R., & Ogeng’o, N.M. (2015). Ischemic Cortical
Stroke in a Kenyan Referral Hospital. J Mol Biomark Diagn 5: 238.
Oparil S., Zaman M., & Calhoun D. ( 2003). Pathogenesis of hypertension. Ann. Intern. Med.
139 (9): 761–76
Palatini, P. (2009). Elevated heart rate in cardiovascular diseases: a target for treatment? Prog
Cardiovasc Dis 52(1): 46-60.
Pelzel, H., Schlamp, C., Poulsen, G., Ver Hoeve, J., Nork, T., & Nickells, R. (2006). Decrease
of cone opsin mRNA in experimental ocular hypertension. Mol Vis 12: 1272-82.
Pereira M., Lunet N., Azevedo A., & Barros H. (2009). Differences in prevalence, awareness,
treatment and control of hypertension between developing and developed countries. J
Hypertens.27(5):963-75
Pickering, T. (1996). Job strain and the prevalence and outcome of coronary artery disease.
Circulation 94(5): 1138-9.
Pires, J., Sebastiao, Y., Langa, A., & Nery, S. (2013). Hypertension in Northern
Angola:prevalence, associated factors, awareness, treatment and control. BMC Public
Health 13: 90.
Rodgers, A., Ezzati, M., Vander Hoorn, S., Lopez, A. D., Lin, R. B., & Murray, C. J. (2004).
Distribution of major health risks: findings from the Global Burden of Disease
study. PLoS Med, 1(1), e27.
Rutledge, T., Reis, S., Olson, M., Owens, J., Kelsey, S., Pepine, C.,… & Matthews, A. (2003).
Socioeconomic status variables predict cardiovascular disease risk factors and

58
prospective mortality risk among women with chest pain. The WISE Study. Behav Modif
27(1): 54-67.
Sacks, F.M., Svetkey L.P., Vollmer, W.M., Appel, L.J., Bray, G.A., Harsha, D., &Cuttler, J.A.
(2001). Effects on Blood Pressure of Reduced Dietary Sodium and the Dietary
Approaches to Stop Hypertension (DASH) Diet. N Engl J Med 344: 3-10.
Sesso, H. D., Cook, N. R., Buring, J. E., Manson, J. E., & Gaziano, J. M. (2008). Alcohol
consumption and the risk of hypertension in women and men. Hypertension, 51(4), 1080-
1087.
Shaw, W., Patterson, T., Semple, S.,Dimsdale, J., Ziegler, M., & Grant, I. (2003). Emotional
expressiveness, hostility and blood pressure in a longitudinal cohort of Alzheimer
caregivers. J Psychosom Res 54(4): 293-302.
Schnabel, R.B., Adeloye, D., & Basquill,C. (2014) Estimating the prevalence and awareness
rates of hypertension in Africa: A systematic analysis PLoS ONE, 9 (8) (2014), p. e104300
Skoog, I. (1997). The relationship between blood pressure and dementia: a review. Biomed
Pharmacother 51(9): 367-75.
Steptoe, A., Kunz-Ebrecht, S., Wright, C., & Feldman, P. J. (2005). Socioeconomic position and
cardiovascular and neuroendocrine responses following cognitive challenge in old age.
Biol Psychol 69(2): 149-66.
Thadhani, R., Camargo, C., Stampfer, M., Curhan, G., Willett. W., & Rimm, E. (2002).
Prospective study of moderate alcohol consumption and risk of hypertension in young
women. Arch Intern Med 162(5): 569-74.
Van de Vijver, S. J., Oti, S. O., Agyemang, C., Gomez, G. B., & Kyobutungi, C. (2013).
Prevalence, awareness, treatment and control of hypertension among slum dwellers in
Nairobi, Kenya. Journal of hypertension, 31(5), 1018-1024.
Vasan, R., Beiser, A., Seshadri, S., Larson, M., Kannel, W., D'Agostino, R., & Levy, D. (2002).
Residual lifetime risk for developing hypertension in middle-aged women and men: The
Framingham Heart Study. Jama 287(8): 1003-10.
Vlassoff, C. (2007). Gender Differences in Determinants and Consequences of Health and
Illness. Journal of Health, Population, and Nutrition, 25(1), 47–61.

59
Wamala, J., Karyabakabo, Z., Ndungutse, D., & Guwatudde, D. (2009). Prevalence factors
associated with hypertension in Rukungiri district, Uganda--a community-based study.
Afr Health Sci 9(3): 153-60.
Weber, M. A., Schiffrin, E. L., White, W. B., Mann, S., Lindholm, L. H., Kenerson, J. G., &
Harrap, S. B. (2014), Clinical Practice Guidelines for the Management of Hypertension in
the Community. The Journal of Clinical Hypertension, 16: 14–26.
Whelton, P. K., He, J., Appel, L., Cutler, L., Havas, S., Kotchen, T., … Karimbakas, J. (2002).
Primary prevention of hypertension: clinical and public health advisory from The
National High Blood Pressure Education Program. Jama 288(15): 1882-8.
WHO. (2003). Diet, nutrition and the prevention of chronic disease. Report of a Joint WHO/
FAO Expert Consultation. Geneva, World Health Organization (WHO),.
WHO. (2007). Task shifting to tackle health worker shortage: 2007 update, Geneva: World
Health Organization.
WHO. (2008). The Global Burden of Disease: 2004 Update, Geneva: World Health
Organization.
WHO. 2010: Description of the global burden of NCDs, their risk factors and determinants,
Geneva: World Health Organization.
Wilkins, K., Campbell, N., Joffres, M.,McAlister, F.,Nichol M.,Quach S., …Tremblay M (2010).
Blood pressure in Canadian adults. Health Rep 2010; 21:37–46.
Winstanley, M., Woodwaed, S., & Walker, N. (1995). Tobacco Australia: Facts and issues 1995.
Victoria: Victorian Smoking and Health Program.
Zheng, X., Yao, D., Zhuo-Ma, C., Tang, J., Wang, T., Zhang, H., & Wang, L. (2012).
Prevalence, self-awareness, treatment, and control of hypertension in Lhasa, Tibet. Clin
Exp Hypertens 34(5): 328-33.
Zilkens, R.R., Burke, V., Hodgson, J.M., Barden, A., Beilin, L.J., & Puddey, I.B. (2005). Red
wine and beer elevate blood pressure in normotensive men. Hypertension 45(5): 874-9.

60
APPENDICES
Appendix 1: Introduction and Consent
Hello,
My name is Awino Bob Otieno. I am conducting a survey on awareness and determinants of
hypertension among clients attending the hospital. I would very much appreciate your
participation in this survey. Findings of this study will therefore be useful to raise awareness
among policy makers and the public at large, about the magnitude of high blood pressure and its
related determinants, and thereby contribute to the design and implementation of appropriate
interventions. The survey usually takes between 10 to 20 minutes to complete.
Your participation is purely voluntary; we will keep your answers as confidential as possible.
Your name will not be written on the survey, neither will it be used during the production of the
final report and will only be used for the purpose of the study. If I should come to any question
you don't want to answer, just let me know and I will go on to the next question; or you can stop
the interview at any time. However, we hope that you will participate in this survey since your
views are important.
At this time, do you want to ask me anything about the survey?
Signature of interviewee:
RESPONDENT AGREES TO BE INTERVIEWED . . . . . …………........1
RESPONDENT DOES NOT AGREE TO BE INTERVIEWED. . ………2
Secretary- MUERC Researcher: - Bob O. Awino
Cell phone +254 721 543 976, +254 733 230 878 Cell: +254720328750
Email: [email protected] Email: [email protected]

61
Appendix 2: Questionnaire
Questionnaire No…… Date……………………… Time of interview……………….....
Demographic Information
Code
1. Sex (Record male/Female as observed) Male……..1 C1
Female..….2
2. How old are you? Years
C2
3. What is the highest level of education you completed C3
No formal schooling……………………1
Primary school completed……………...2
Secondary school……………………….3
Tertiary…………………………………4
4. What is our marital status? C4
Never married…………………………1
Separated………………………………2
Divorced.........................................…...3
Widowed………………………..……..4
Married……………………………..….5
5. Which of the following describes your main work status over past 12 months? C5
Government employee……………………1
Self-employee……………………………..2
Non-employee…………………………….3
Student………………………………….…4
6. Taking the past year, can you tell me what the average earnings of the household C6
Per week
Or per month
Or per year
Step 1: Behavioral Measurements
Tobacco Use
7. Do you currently smoke any tobacco products such as cigarettes, cigars/pipes T1
Yes…..1
No……2 If No go to T4
8. Do you currently smoke tobacco products daily? T2
Yes…..1

62
No……2 If No go to T4
9. How old were you when you first started smoking daily? Age (Years) T3
10. In the past, did you ever smoke daily? T4
Yes…..1
No…….2
Alcohol Consumption
11. Have you ever consumed an alcoholic drink such beer, wine, spirits, chang’aa A1a
Yes……1
No…….2 If No, go to D1
12. Have you consumed an alcoholic drink within the past 12 months? A1b
Yes……1
No…….2 If No, go to D1
13. During the 12 months, how frequently have you had at least 1 alcoholic drink? A2
Daily…………………………………..1
5-6 days per week…………………….2
1-2 days per week................................3
1-3 days per month…………………..4
Less than once a month………………5
14. Have you consumed an alcoholic drink within the past 30 days? A3
Yes…….1
No……..2 If No go to D1
15. During the past 30 days, on how many occasions did you at least have one alcoholic
drink? A4
Diet
16. In a typical week, on how many days do you eat fruits? D1
Number of days …………………….
17. In a typical week, on how many days do you eat vegetables? D2
Number of days ……………………
18. What type of cooking oil do you often use for meal preparation in your household? D3
Liquid oil…………1
Cooking fat……….2
Physical Activity
19. Does your work involve vigorous intensity activity that causes large increases in
breathing or heart rate like (carrying heavy loads, digging or construction work)? P1
Yes……1
No…….2 If No, go to P3

63
20. In a typical week, on how many days do you do vigorous-intensity activities as part of
your work? P2
Number of days……………
21. How much time do spend doing vigorous-intensity activities at work on a typical day?
P3
Hours……
Minutes…
22. Do you walk or use bicycle for at least 10 minutes continuously to get to and from
places? P4
Yes…….1-
No……..2
23. Do you do any vigorous-intensity sports, fitness or recreational activities that cause large
increases in breathing or heart rate like (running or football) for at least 10 minutes
continuously? P5
Yes………1
No……….2
History of raised blood pressure
24. Have you ever had your blood pressure measured by a doctor or health worker? H1
Yes………1
No……….2
25. Have you ever been told by a doctor/health worker that you have raised blood pressure or
hypertension? H2
Yes………1
No……….2
26. Are you currently receiving any treatment for high blood pressure prescribed by a
doctor/health worker? H3
Yes………1
No……….2
27 Any member of your family with or has had high blood pressure H4
Yes
No if No sk-ip 28
28 What is your relation with the family member who had? H5
Mother Only
Father Only
Both Mother and Father
Sisters only

64
Brother only
Both Brother and Sister
Grand Father only
Grand Mother Only
Both Grand Mother and Father
Step 2: Physical Measurements
29 Height in centimeters ………. M1
30 Weight in kilograms ……….. M2
31 Waist circumference in centimeters……… M3
Blood Pressure
32 Cuff size used Small M4
Medium
Large
33 Reading 1 Systolic(mmHg) M5a
Diastolic (mmHg) M5b
Reading 2 Systolic (mmHg) M6a
Diastolic (mmHg) M6b
Reading 3 Systolic (mmHg) M7a
Diastolic (mmHg) M7b
THE END
Thank you for participating!
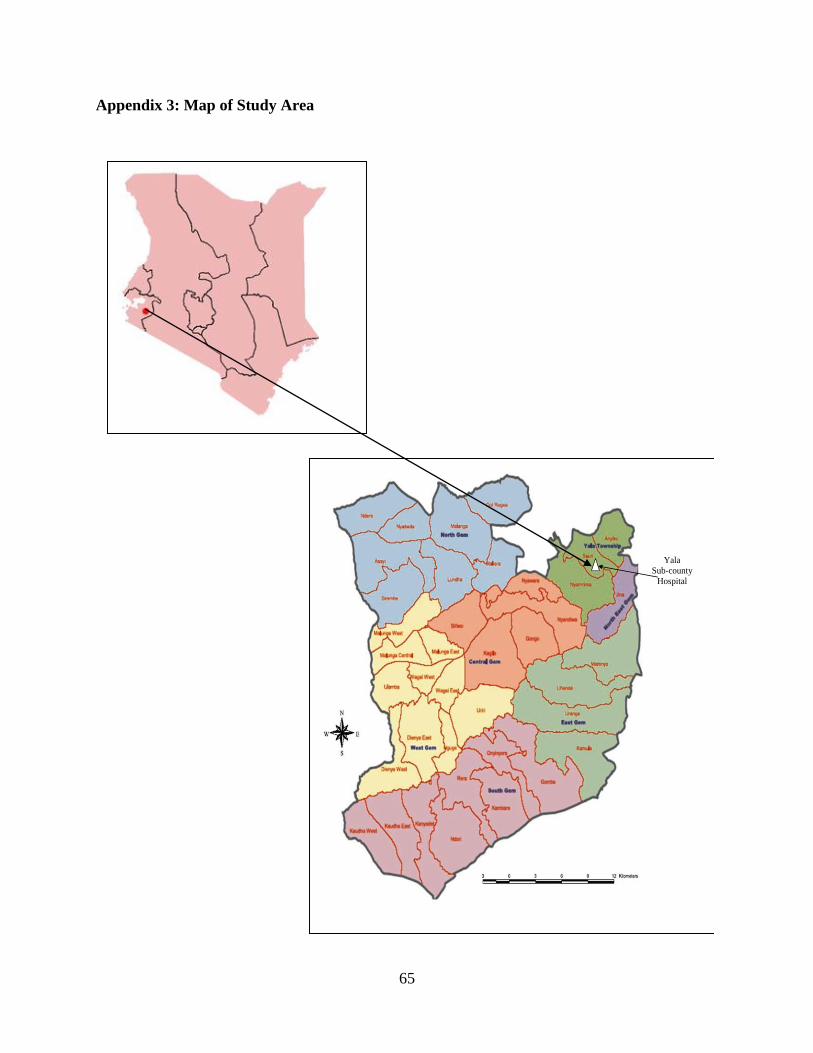
65
Appendix 3: Map of Study Area
Yala
Sub-county
Hospital

66
Appendix 4: Work Plan
YR. 2013/14 YR 2015
Activity
Jan
Mar
Apr
May
June
Aug
Oct
Nov
Dec
Jan-
July
Concept
Note
Development
Concept
Note Presentation
Proposal
Writing/Presentat
ion
Piloting
Data Collection
Data Analysis
Presentation of
Results
Thesis Writing
Thesis
Submission

67
Appendix 5: Research Budget
Item
Total Cost (Kshs)
Development of Research tools
Stationery 10,000
Production of draft tools 5,000
Piloting 5,000
Revision and correction of research instruments 6,000
Sub total 26,000
Data Collection
Sub total 25,000
Data Analysis
Coding and Analysis of data 10,000
Production of first thesis draft 5,000
Production of final thesis copy 5,000
Conferences and publication 10,000
Sub total 30,000
Total
96,000
Miscellaneous (10%) 9,600
Grand total
95,600

68
Appendix 6: MUERC Approval Letter

69
Appendix 7: Research Authorization Letter from the Hospital