AWALI 2014 National Report - University of South...
56
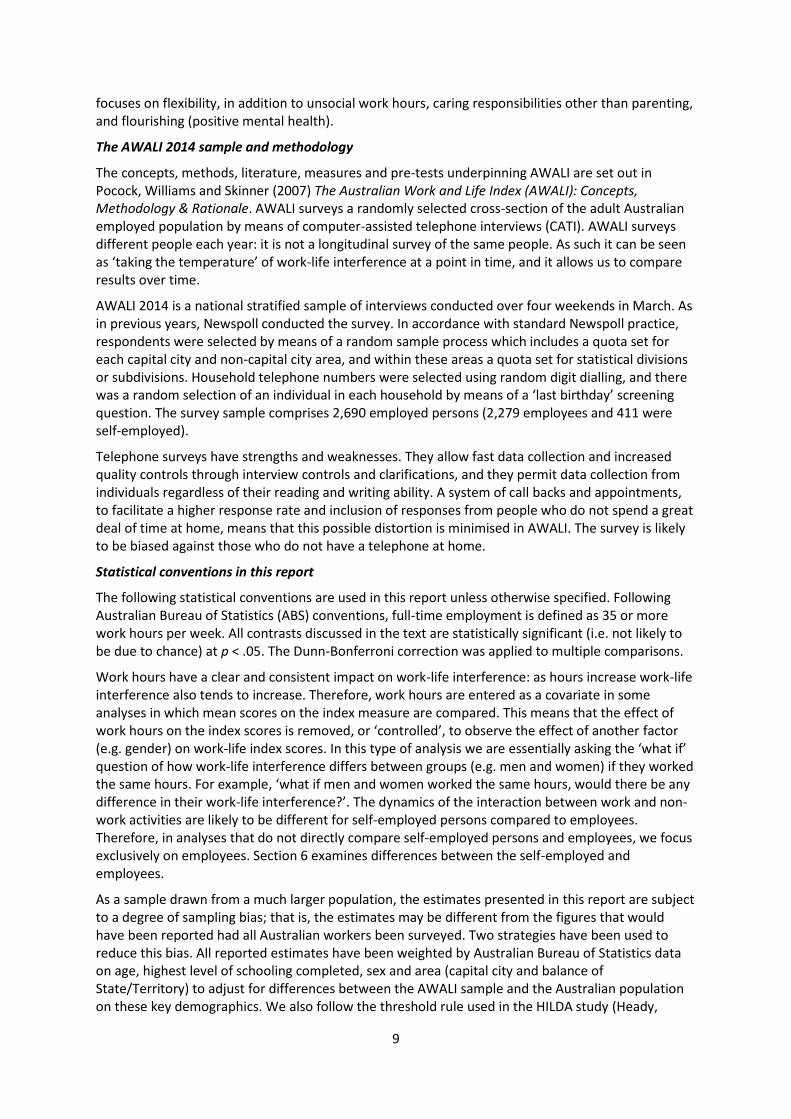
The Australian Work and Life Index 2014 The Persistent Challenge: Living, Working and Caring in Australia in 2014 Natalie Skinner and Barbara Pocock Centre for Work + Life University of South Australia A I L A W
Transcript of AWALI 2014 National Report - University of South...
The Australian Work and Life Index 2014
The Persistent Challenge:Living, Working and Caring
in Australia in 2014
Natalie Skinner and Barbara Pocock
Centre for Work + LifeUniversity of South Australia
A ILA W

unisa.edu.au/research/centre-for-work-life
Partners
‘Making a living is not the same as making a life’
Maya Angelou, 1928-2014
© September 2014
Published by the Centre for Work + Life
University of South Australia
http://www.unisa.edu.au/Research/Centre-for-Work-Life
STREET ADDRESS
St Bernards Road
Magill SA 5072
Adelaide
POSTAL ADDRESS
GPO Box 2471
Adelaide, SA 5001 Australia
Authors: Natalie Skinner and Barbara Pocock
Title: The Persistent Challenge: Living, Working and Caring in Australia in 2014. The Australian Work and Life Index
ISBN: 978-0-9875120-5-5
ACKNOWLEDGEMENTS
AWALI 2014 was funded through an Australian Research Council Linkage grant in partnership with the South Australian Government through SafeWork SA and the Australian Government through the Department of Employment.
We thank Zoe Gray for her editing assistance. Of course, responsibility for the final text rests with the authors.
i
Contents
Contents ..................................................................................................................................................................................... i Tables .......................................................................................................................................................................................... ii Figures ........................................................................................................................................................................................ ii Executive summary .................................................................................................................................................................... 1 Section 1: Introduction .............................................................................................................................................................. 8
What AWALI measures ......................................................................................................................................................... 8 The work-life index ............................................................................................................................................................... 8 Past AWALI surveys .............................................................................................................................................................. 8 The AWALI 2014 sample and methodology .......................................................................................................................... 9 Statistical conventions in this report .................................................................................................................................... 9 What we know from previous AWALI surveys .................................................................................................................... 10 Structure of this report ....................................................................................................................................................... 10
Section 2: The AWALI 2014 sample ......................................................................................................................................... 11 Section 3: Work-life interference: a gendered analysis ........................................................................................................... 13
Work-life interference in 2014: Individual work-life index items ....................................................................................... 13 Work interferes with activities outside work ..................................................................................................................... 14 Time with family and friends .............................................................................................................................................. 15 Community engagement .................................................................................................................................................... 16 Time pressure ..................................................................................................................................................................... 17 Satisfaction with work-life balance ..................................................................................................................................... 19 Australians’ work-life interference from 2008 to 2014 ...................................................................................................... 20 Key trends by gender and work hours ................................................................................................................................ 20 Summary ............................................................................................................................................................................ 21
Section 4: Actual and preferred working hours and work-life interference ............................................................................ 22 Working hours and work-life interference – comparing men and women ........................................................................ 22 How many hours would Australian workers prefer to work? ............................................................................................. 24 Half a day less: preferences to reduce work hours by at least four hours.......................................................................... 25 Work-life interference and hours ‘fit’ ................................................................................................................................. 26 Not all working hours are the same: working non-standard or unsocial hours .................................................................. 27 Who works unsocial work hours? ....................................................................................................................................... 27 Unsocial work hours and work-life interaction ................................................................................................................... 28 Summary ............................................................................................................................................................................ 29
Section 5: Work-life interference: caring responsibilities, age, income and location .............................................................. 30 Caring responsibilities......................................................................................................................................................... 30 Age ...................................................................................................................................................................................... 32 Household income .............................................................................................................................................................. 32 Geographic location............................................................................................................................................................ 32 Summary ............................................................................................................................................................................ 33
Section 6: Employment characteristics and work-life interference ......................................................................................... 34 Type of employment contract ............................................................................................................................................ 34 Self-employment ................................................................................................................................................................ 35 Occupation ......................................................................................................................................................................... 35 Industry .............................................................................................................................................................................. 36 Summary ............................................................................................................................................................................ 37
Section 7: Requests for flexible work arrangements ............................................................................................................... 38 Awareness of a legal right to request flexibility ................................................................................................................. 39 Requesting flexibility .......................................................................................................................................................... 40 Mechanism under which employees requested flexibility ................................................................................................. 41 Requests and hours of work ............................................................................................................................................... 41 Requests by occupation ...................................................................................................................................................... 41 Requests by industry .......................................................................................................................................................... 42 Outcome of request: granted or declined .......................................................................................................................... 42 Reasons for not making a request ...................................................................................................................................... 43 Outcome of requests and work-life interference ............................................................................................................... 45 Summary ............................................................................................................................................................................ 45
Section 8: Flourishing ............................................................................................................................................................... 47 Work-life interference and flourishing ............................................................................................................................... 47 Socio-demographic predictors of flourishing...................................................................................................................... 48 Employment predictors of flourishing ................................................................................................................................ 48 Endnote .............................................................................................................................................................................. 49
References ............................................................................................................................................................................... 50
ii
Tables
Table 1 Overview of the AWALI 2014 sample (per cent) ...................................................................................... 11 Table 2 Household demographics of the AWALI sample, (per cent) .................................................................... 12 Table 3 Work-life index items by gender, 2009 - 2014 (per cent) ........................................................................ 14 Table 4 Actual and preferred work hours by part-time/full-time work status and gender .................................. 24 Table 5 Regular (often/almost always) unsocial work hours by gender, per cent ............................................... 28 Table 6 Work hours and work-life index scores by type of employment contract and gender ........................... 34 Table 7 Work-life index scores by industry (from highest to lowest index score) ................................................ 37 Table 8 Aware of right to request flexible work arrangements, 2012 and 2014 (per cent) ................................. 39 Table 9 Made a request to change work arrangements by gender, age and parenting, 2009, 2012 and 2014 (per cent) ..................................................................................................................................................... 40 Table 10 Requests to change work arrangements by work hours, 2014 (per cent) ............................................. 41 Table 11 Requests to change work arrangements by occupation, 2014 (per cent) ............................................. 42 Table 12 Reasons request not made, by gender, 2009, 2012 and 2014 (per cent of non-requesters) ................ 43 Table 13 Reasons request not made by gender and work hours, 2014 (per cent of non-requesters) ................. 44 Table 14 Proportion requesting flexibility by gender and whether content with current arrangements (per cent of all employees), 2009, 2012 and 2014 (per cent) ..................................................................... 44 Table 15 Flourishing – AWALI 2014 and European Social Survey 2012, per cent flourishing (employees) .......... 47 Table 16 Flourishing by hours fit with preferences, per cent flourishing (employees), AWALI 2014 .................. 48 Table 17 Flourishing by flexibility requests, per cent flourishing (employees), AWALI 2014 ............................... 49
Figures
Figure 1 Work interferes with activities outside work, full-time workers, 2008–2014 (per cent) ....................... 15 Figure 2 Work restricts time with family/friends, full-time workers, 2008–2014 (per cent) ............................... 16 Figure 3 Work interferes with community connections, 2008-2014 (per cent) ................................................... 17 Figure 4 Feeling rushed or pressed for time, full-time workers, 2008-2014 (per cent) ....................................... 18 Figure 5 Feeling rushed or pressed for time, part-time workers, 2008-2014 (per cent) ...................................... 18 Figure 6 Satisfaction with work-life balance, full-time workers, 2008–2014 (per cent) ...................................... 19 Figure 7 Work-life index scores for full-time workers by gender, 2008–2014 ..................................................... 20 Figure 8 Part-time and full-time work hours by gender, AWALI 2014 and ABS (2012) (per cent) ....................... 23 Figure 9 Work-life index scores by work hours and gender ................................................................................. 23 Figure 10 Work hours fit with preferences by gender (per cent) ......................................................................... 25 Figure 11 Work hours fit with preferences by gender and work hours (per cent) ............................................... 26 Figure 12 Work-life index scores by work hours fit .............................................................................................. 27 Figure 13 Work-life scores by regular unsocial work hours (often/almost always) ............................................. 28 Figure 14 Work-life index scores (adjusted for work hours) by household structure and gender ....................... 30 Figure 15 Work-life index scores by child and elder care, and gender ................................................................. 31 Figure 16 Work-life index scores by age and gender ............................................................................................ 32 Figure 17 Work-life index scores by occupation and gender ............................................................................... 36 Figure 18 Request outcomes by gender, 2009, 2012 and 2014 (per cent)........................................................... 43 Figure 19 Work-life index scores by request outcome, 2014 ............................................................................... 45
1
Executive summary
The AWALI 2014 survey
The Australian Work and Life Index (AWALI) survey measures how work intersects with other life activities, as seen by a randomly selected representative group of 2,690 working Australians.
Alongside its usual assessment of work-life interference in Australia, the 2014 AWALI survey offers new insights on four particular themes:
How employee requests for flexibility have changed since immediately prior to and four years subsequent to the Fair Work Act 2009 created new rights to request flexibility for some workers;
Who works on Saturdays, Sundays and weekends, and how unsocial working times (weekends, evenings/nights) affect work-life outcomes;
The work-life outcomes of carers of elders or a person with a chronic illness or disability;
Patterns of flourishing (positive mental health) in the Australian workforce, and associations with social and employment factors.
AWALI 2014 also included questions on workers who currently receive penalty rates for working non-standard hours and wellbeing/thriving, and a longitudinal sample of participants re-contacted from 2012. These findings will be reported in other publications from the Centre for Work + Life.
Key findings
Work-life interference remains a persistent challenge in Australia despite some changes in childcare, parental leave and employment law in the past two decades. Work life interference affects a wide range of workers, their families and communities. Its effects fall particularly hard upon women, mothers and other working carers. AWALI 2014 confirms that the length of working hours and the fit between actual and preferred hours are critical issues. Time strain is common, particularly for women. It is also important to highlight that not all working hours are the same: those who work on Saturday and particularly Sunday have worse work life interference - an issue that is relevant to the current debate about penalty rates in Australia.
Access to flexible work arrangements has also been the subject of policy initiatives and public discussion in recent times. There is now a large body of research evidence regarding the positive contribution flexibility can make to a positive and healthy work-life interaction. As we observe in the AWALI 2014, the level of awareness about the Right to Request a flexible work arrangement embodied in the National Employment Standards has increased since 2012. However, most workers remain unaware of this right, and the rate of request making has not changed significantly since before the right was enacted. AWALI 2014 therefore confirms that this right, as currently enacted, has not substantially impacted on flexibility in Australian workplaces. We now turn to a more detailed summary of key findings from AWALI 2014.
Little change in work-life outcomes over time
Recent decades have seen profound changes in the Australian workforce. Two-thirds of Australians are now participating in the labour force (Australian Bureau of Statistics, 2014) and women’s rate of participation is increasing. Dual earner families are the norm, and the majority of sole-parents are engaged in paid work (Australian Bureau of Statistics, 2009). As the population ages, combining work with elder care will also be a common experience, especially for women (Page et al., 2009).
Despite these profound social changes, the male breadwinner/female caregiver model of the 20th century is alive and well in 21st century Australia, and many workplace cultures are made in the
2
image of the full-time male worker unencumbered by care responsibilities. Australian women work around this image and the practices it embeds – while doing substantially more caring and domestic work than men (Craig & Mullan, 2010). Indeed, Australia is one of the most unequal countries with respect to men’s and women’s sharing of domestic and care work (Sayer et al., 2009; Craig & Mullan, 2010).
This disconnect between changing labour force participation and unchanging gendered patterns of care-giving is likely to account for the consistent observation across AWALI surveys from 2008 to 2014 that women are more likely to experience poor work-life outcomes.
On the work-life index, a composite measure of five work-life items, women have higher scores (worse work-life interference) than men, in both full-time and part-time work;
The greatest gender difference is evident for time pressure: women are more likely than men to feel chronically rushed and pressed for time, regardless of work hours;
There has been little change in work-life index scores over consecutive AWALI surveys;
However, on some individual work-life items, and the work-life index, there is evidence of a decrease in work-life interference from 2012 to 2014 for women working full-time.
Time is of the essence – length of work hours and preference fit
Time strain is at the heart of much work-life strain and interference. Not surprisingly, the number of hours worked, and the extent to which this time commitment fits in with non-work responsibilities and activities, is well established as a major influence on work-life interference (Skinner & Chapman, 2013). Specifically, long hours (or working longer than preferred) can significantly reduce the capacity and opportunity to engage in other life activities such as parenting, family activities, socialising, personal care and pursing hobbies and interests. With regard to working time, in 2014 (as in previous AWALI surveys) we observed that:
Men are more likely to work long hours (48+) than women;
However, regardless of whether working short or long part-time or full-time hours, women have higher work-life interference than men;
For all employees, long hours (48+) are associated with high work-life interference;
Working four or more hours longer than preferred is associated with as much work-life interference as working long hours;
Just over one third of employees, men and women, prefer to work at least four hours fewer; this rises to three quarters of those working long hours;
Men in part-time work are most likely to prefer more hours – over half would prefer to increase their hours by at least half a day (4 hours).
It’s not just how much you work, it’s also when - unsocial hours
In addition to the length of working hours, the scheduling of these hours also has the potential to create substantial work-life demands and strains. Working early mornings, evenings or nights not only presents challenges to biological functions such as sleep, it is often incompatible with the rhythms and schedules of social, family and community activities. We discuss in a separate report and in greater depth the issue of penalty rates (report available from the Centre for Work + Life website http://www.unisa.edu.au/research/centre-for-work-life/).
3
Frequently working a combination of weekends and nights, or just evenings/nights, is associated with the highest work-life interference;
Evening/night work is associated with the greatest negative impact on women’s work-life outcomes;
Working combinations of evenings/nights and weekends has the worst impact on men’s work-life interference;
Regularly (often/almost always) working Sundays is clearly associated with higher work-life interference, whether combined with regular Saturday work or not.
Working carers and work-life strain
From a work-life perspective, paid work and other life circumstances and experiences are assumed to be interconnected. Hence the impact of work on wellbeing will vary to a significant extent with the wider context and circumstances of a worker’s life (Pocock, Skinner & Williams, 2012). In a modern diverse workforce, workers’ caring responsibilities are varied, and include caring for elderly, disabled or chronically ill family and friends. With an ageing workforce, caring for elders is becoming more common; in AWALI 2014 the majority of workers aged 45+ indicated they provide care and assistance to an elder.
In 2014, as in previous AWALI surveys, working mothers report the worst work-life interference, with little evidence of improvement from 2008 to 2014;
Caring for others, such as an elder or a person with a chronic illness or disability, has an equivalent negative effect on work-life outcomes as caring for a child;
Combining two types of care (e.g. elder and child) is associated with the highest work-life interference.
Particular jobs and types of work are associated with higher work-life interference
We have consistently observed across the AWALI surveys that particular types of work, as defined by employment contract, occupation or industry, are associated with worse work-life outcomes:
Overall, employees and the self-employed report equivalent work-life interference, and this is the case for men and women. It is likely that each type of employment arrangement is associated with unique benefits and disadvantages, which produce this overall level of equivalence of work-life outcomes;
Casual employees are more likely to be under-employed (and to prefer more hours). When differences in hours are accounted for, their work-life interference is equivalent to workers on permanent or fixed-term contracts;
The occupations with the highest work-life interference are managers, machinery operators and drivers, professionals and community and personal service workers;
The industries with the highest work-life interference are mining, information media and telecommunications and health care/social assistance.
The Right to Request Flexibility
In Australia from 1 January 2010, working parents of pre-schoolers or children aged under 18 with a disability, gained a Right to Request (RTR) as part of the National Employment Standards (NES) in the Fair Work Act 2009. Eligibility was broadened in mid-2013 to all carers, that is all parents or guardians, of a school aged or younger child, those with a disability, those 55 years or older, those
4
experiencing family or domestic violence, or caring for someone experiencing such violence (Fair Work Ombudsman, 2013).
In a series of AWALI surveys in 2009, 2012 and 2014 we have examined Australians’ patterns of requesting flexibility, the outcomes of such requests and the association with work-life interference. This series of surveys enables us to examine patterns of requesting prior to the RTR, and following changes to the eligibility requirements that occurred between the 2012 and 2014 surveys. AWALI 2014 shows that:
More than four years after its introduction, workers’ awareness of the RTR has increased substantially. However, the majority of employees are still not aware of the RTR;
The rate of request-making does not appear to have changed over the three AWALI surveys of 2009, 2012 and 2014, remaining at around 20 per cent of workers;
Requests were more likely to be made by women, by younger and middle-aged workers and parents;
Those most likely to make a request are mothers of pre-schoolers (40.6 per cent). Only 15.2 per cent of fathers of pre-schoolers made a request;
A substantive proportion of women with other caring responsibilities for an elder or a disabled relative have made a request (28.6 per cent). Few men with such caring responsibilities, 16.5 per cent, had made a flexibility request;
The majority of employees did not identify an industrial mechanism under which they made a request (57.3 percent “just asked” their manager/supervisor) or applied under their organisation’s policy or enterprise/collective agreement (39.9 per cent);
The majority of requests in 2014 (64.3 per cent) were granted, which is comparable to AWALI 2009 and 2012 estimates;
The majority of workers, around 60 per cent, who have not made a request said they are content with their current work arrangements;
15 per cent of respondents said flexibility was not possible or available in their jobs;
Having a flexibility request granted is associated with lower work-life interference;
A partially granted request is associated with equivalent work-life interference as a refusal.
Implications for policy and practice
There are many factors that augment or diminish the impact of government legislation on the work-life balance of its citizens, including prevailing economic conditions and socio-cultural values (Pocock, Charlesworth and Chapman, 2013). Nevertheless, legislation that provides workers with rights and entitlements to access essential resources, such as paid parental leave, flexible work arrangements and good quality childcare, have been shown to positively affect fundamental aspects of gender equality which underpin work-life balance, such as women’s participation in paid work and capacity to combine paid employment with care-giving, and also men’s participation in the care of their children (Hegewisch and Gornick, 2011). Further, Baird (2011) argues that legislative change such as that introduced by the Fair Work Act 2009 also affects social norms related to work and employment, reflected for example in the emphasis on employee-centred flexible work practices by organisations identifying as ‘best practice’ or an ‘employer of choice’. Supporting and enabling women to increase their employment participation has been identified as a significant public policy issue in Australia, given the ageing of the population and the need to maintain productivity and economic growth (Access Economics, 2006; Australian Government, 2010). Our findings indicate that
5
unless the resources and supports available to women, and carers in general, are significantly improved, it is unlikely that their employment participation will significantly increase.
Women and working carers
The chronic work-life strains and pressures consistently reported by working carers of children, and others such as elders and individuals with a disability, are likely to have implications not only for the health of individuals and their families, but are also likely to affect carers’ inclination to participate in paid work in general, and to commit the substantial time required in particular for full-time work.
Similar to other countries, in Australia women make a larger contribution to unpaid care and domestic work, which is likely to be a major factor in their higher rates of work-life interference when working comparable hours as men, (Craig, 2007; Pocock, Skinner & Williams, 2012). It is worth nothing that Australia, along with the U.S., has strongly gendered (and unequal) patterns of domestic time use in comparison to other industrialised countries (Craig & Mullan, 2010). An analysis of the historical and socio-cultural factors that create such gendered patterns of unpaid work, time pressure and fatigue is beyond the scope of this report. In the context of paid employment, it is worth noting cross-national studies which have shown that men’s participation in unpaid care and domestic work is substantially enhanced by government policies that encourage men to take parental leave, combined with paid leave that is to some extent mandated (e.g. ‘use it or lose it’ paid leave for fathers) (Hook, 2006; Fox, Pascall & Warren, 2009). Australia took a step towards such policies by introducing two weeks ‘Dad and Partner Pay’ for children born or adopted from 1 January 2013 (although it is unclear at the time of writing how the Abbott Government’s proposed amendments to parental leave will affect this). Again, these policies are aimed solely at parents caring for infants and very young children. As with the right to request flexibility, there remains substantial scope to widen accessibility of such important leave entitlements, for example to all workers who care for a dependent child or adult. In mid-2014 the UK right was extended to workers who have six months’ tenure in their job, decreased from 12 months’ tenure. This UK measure goes some way to extend the right to request flexibility to workers with more precarious work arrangements, such as those on casual or short-term contracts, many of whom are women and carers.
The Australian right to request would be strengthened by expanding the eligibility criteria in this manner. However, successive AWALI surveys show that the existing RTR is not enlarging the proportion of workers who request flexibility beyond those who felt comfortable ‘just asking’ before the legal RTR was introduced. Ensuring that less confident, less powerful workers, and more fathers and men, can also make effective use of this right will require wider knowledge about the RTR and firmer legal protection around it – such as the right to contest a refusal that seems unreasonable and confidence that requesters will not negative outcomes in the workplace.
Working time
With regard to the length of work hours, the National Employment standards establish 38 hours as the maximum weekly hours, with the exception of ‘reasonable’ requests to work longer hours. Criteria for judging the ‘reasonableness’ of requests include risks to health and safety, employee personal circumstances (including family responsibilities) and the needs of the workplace/enterprise. Whilst it is acknowledged that the ‘reasonable requests’ provision is designed to account for the reality of fluctuations in demand or unusual circumstances, it also significantly weakens the strength of the limit set on maximum hours. In many circumstances it would not be difficult to identify workplace/enterprise needs for employees to work longer hours.
There is a clear need for strengthening protections for Australian workers around long work hours, as Australians work some of the longest full-time hours in the OECD (Pocock, Skinner & Williams, 2012). The key principle being long working hours should be the exception rather than the norm,
6
given the risk to health, wellbeing and welfare that sustained long hours of paid work presents. Therefore, it is worth further consideration and debate as to whether the National Employment Standards should be strengthened to include an upper-limit for ‘reasonable’ hours along the lines of the European Working Time Directive. One approach would be to strengthen workers’ rights to reasonable working hours by setting a legal limit of no more than 47 hours per week on average, with a clear and specific set of exceptions to take into account occasional events such as emergency situations. Australian workers also lack a right to refuse overtime; introducing this right would substantially strengthen workers’ capacity and confidence to negotiate reasonable hours with their employer.
Nor are all hours or days are the same
There is widespread public discussion at present about penalty rates for working at unsocial times. Some assert that in a 24/7 economy, working on a Sunday, for example, is no longer ‘special’ (Carnell, 2014). It is suggested by some that many workers ‘choose’ to work on Saturday or Sunday and that their work-life balance is facilitated by this. If so, they argue they should not be paid penalty rates. In particular, some assert that Sundays are no different from Saturdays and no special Sunday rates should apply. What is the evidence?
Our analysis suggests that most Australian workers continue to work on weekdays between eight and six. Working unsocial hours is a minority experience. However, those who work unsocial hours have worse work-life interference than those who do not. Working on weekends is worse for work-life interference that working weekdays. Furthermore, working on a Sunday is associated with worse work-life interference that on Saturdays or week days. Working nights is also associated with worse work-life interference.
Based on this analysis there is a case for paying workers a premium for Sunday work and for weekend and evening work more generally, given the poorer work-life interference associated with Sunday work.
Flexible work arrangements
In addition to the length of a working day or week per se, a second crucial dimension of working time with regard to health and wellbeing is the extent to which the length and scheduling fit with an individual’s needs, preferences and circumstances (Barnett, 2006). Employee-centred flexibility, in which workers have some input and control over the scheduling and length of their work hours and location of work is an important resource for employee wellbeing (Pocock et al., 2012). The Fair Work Amendment Bill 2013 extends the right to request a flexible work arrangement to all workers with care responsibilities (and workers in certain other circumstances such as those with a disability or aged 55 years or older). Whilst this extended inclusion criteria is an important step in supporting all workers with care responsibilities for children or adults, it remains a relatively weak entitlement as the right to request lacks an effective appeal mechanism to contest an employer’s unreasonable refusal.
Furthermore, there is good evidence that flexible work practices would benefit the health and safety of all workers, whether they have care responsibilities or not (Skinner & Chapman, 2013). As in the Netherlands and Germany, in June 2014 the UK Government extended this right to all employees. There is a case for extending the right to request flexible work arrangements to include all workers regardless of their circumstances. However, such an extension will only be meaningful if workers who have their requests refused or do not make such requests because they lack workplace power, are backed up with a meaningful appeal mechanism.
7
Flourishing
AWALI 2014 included questions on flourishing, which refers to positive mental health encompassing characteristics such as optimism, resilience and engagement (Huppert & So, 2013). These survey items were sourced from a set of established measures that have been included in European surveys. The results suggest that many Australian workers are flourishing at higher rates than their European comparators. Australian women in particular flourish more than those in Europe, while Australian men’s rate of flourishing is comparable to European men.
Not surprisingly, those who record high levels of personal flourishing experience lower levels of work-life interference. Flourishing is more common for older workers and those in rural or regional areas, as well as those with a good fit between their actual and their preferred working hours. For men, regular weekend work (Saturday, Sunday or both) is associated with lower rates of flourishing than not working on weekends. Further, there is a distinctive Sunday-only effect for men: regular Sunday work was associated with a lower rate of flourishing than Saturday work.
Conclusion
In discussing potential policy reforms that may help improve work-life outcomes in the Australian working population, it is appropriate and necessary to acknowledge the limits of such initiatives. The gaps that often emerge between policy and practice are widely observed. Public promotion and management support for policies and procedures are a necessary but not sufficient condition to ensure safe and healthy work practices. Initiatives to address working time require a holistic approach that examines the factors that encourage or require long hours, inflexible schedules or forgoing leave entitlements; they include workloads, performance expectations, implicit and explicit rewards for long hours (i.e. links to promotion and other rewards), staffing levels, job design and organisational culture (Mesmer-Magnus & Viswesvaran, 2006; Callan, 2007; Skinner & Pocock, 2010).
Furthermore, strategies to overcome the much discussed gap between policy and practice must address the real risk of negative consequences that arises for workers who attempt to access policies such as flexibility or carers leave. Such consequences include reduced employment participation of women, reduced career opportunities for flexible or part-time workers, and reduced access to preferred roles, tasks and opportunities that both utilise workers’ full range of skills and provide opportunity for development and advancement. Whether framed as unintended consequences or overt discrimination, it is crucial to recognise that work-life policies will only be effective to the extent that workers do not experience economic, social or career penalties with their use.
In a recent review, Pocock et al., (2013) highlight strong undercurrents of traditional values, observing that the gender culture in Australia has proven particularly resilient, with contradictory norms that support women’s increased employment participation yet insist that mothers’ primary responsibilities are to their families. This norm can be described as the expectation and cultural assumption that workers are willing and able to prioritise work over other life activities and commitments such as care for children or elders. For work-life policies to be truly effective they must be accepted and integrated into the mainstream for all workers – not simply as a special consideration for working mothers. Multifaceted policy approaches are needed that set the foundation for change. More inclusive employment regulation, better quality part-time work and a greater policy focus on men’s uptake of flexible work are likely to alleviate some of the burden and causes of work-life conflict across industries, alongside cultural shifts in workplace gender norms.
8
Section 1: Introduction
What AWALI measures
The AWALI index contains five measures which assess respondents’ perceptions of work-life interference (Pocock, Williams, & Skinner, 2007). Given that our 2007 survey revealed that work-to-life interference is much greater than life-to-work interference, we refined AWALI in 2008 to focus only on work-to-life interference.
AWALI measures two dimensions of that interference: first, the impact of work on respondents’ capacity to satisfactorily engage in the activities and responsibilities of other spheres of life (which we term a ‘general interference’ effect) and, secondly, the time available to spend on activities outside work (which we term a ‘time strain’ effect). AWALI also measures the effects of work on community connections. Putting more hours into paid work affects our relationships beyond home, including our capacity to build friendship networks in the broader community, but these are generally not investigated in assessments of work-life interference. AWALI also employs a commonly used single measure of time pressure in daily life (‘feeling rushed or pressed for time’), which is an indirect measure of work-life fit and strain. Finally, AWALI includes a general assessment of satisfaction with work-life balance. Thus, AWALI measures perceptions of:
‘General interference’ (i.e. the frequency that work interferes with responsibilities or activities outside work);
‘Time strain’ (i.e. the frequency that work restricts time with family or friends);
‘Work-to-community interference’ (i.e. the frequency that work affects workers’ ability to develop or maintain connections and friendships in their local community);
Satisfaction with overall ‘work-life balance’;
Frequency of ‘feeling rushed or pressed for time’.
The work-life index
To arrive at the AWALI composite work-life index measure, we average and standardise the five measures of work-life interference described above. The minimum score on the index is 0 (indicating the lowest work-life interference) and the maximum score is 100 (the highest work-life interference). The five-item work-life index has satisfactory internal consistency (Cronbach’s = .82).
In the 2014 survey, the average (mean) score on the index for the whole sample (employees and self-employed) is 42.1 (very similar to the average in previous years), and the median is 40.0 (the middle score which 50 per cent of respondents’ scores fall above, and fifty per cent fall below). Therefore, scores above the average of around 42 indicate a work-life interference that is worse than average, and scores below this level indicate a better than average work-life relationship.
Past AWALI surveys
Each AWALI survey contains a core set of items relating to employment and social demographics, the work-life index items and an additional set of questions on one or two particular themes. The 2007 data collection featured items on life-to-work interference and the extent of commitments outside work (caring responsibilities, domestic work, and volunteer work). The 2008 data collection featured items on unsocial work hours (weekends and evenings/nights) and organisational culture. The 2009 data collection featured an international comparison of work-life fit, analysis of employee requests for flexibility and their outcomes, and participation in education. The 2010 report explored intergenerational differences in work-life interaction and considered the issues of holidays: who takes them and how they affect work-life interference. The 2012 report had a particular focus on requests for flexibility, working from home, size of firm and parental leave. The 2014 report also
9
focuses on flexibility, in addition to unsocial work hours, caring responsibilities other than parenting, and flourishing (positive mental health).
The AWALI 2014 sample and methodology
The concepts, methods, literature, measures and pre-tests underpinning AWALI are set out in Pocock, Williams and Skinner (2007) The Australian Work and Life Index (AWALI): Concepts, Methodology & Rationale. AWALI surveys a randomly selected cross-section of the adult Australian employed population by means of computer-assisted telephone interviews (CATI). AWALI surveys different people each year: it is not a longitudinal survey of the same people. As such it can be seen as ‘taking the temperature’ of work-life interference at a point in time, and it allows us to compare results over time.
AWALI 2014 is a national stratified sample of interviews conducted over four weekends in March. As in previous years, Newspoll conducted the survey. In accordance with standard Newspoll practice, respondents were selected by means of a random sample process which includes a quota set for each capital city and non-capital city area, and within these areas a quota set for statistical divisions or subdivisions. Household telephone numbers were selected using random digit dialling, and there was a random selection of an individual in each household by means of a ‘last birthday’ screening question. The survey sample comprises 2,690 employed persons (2,279 employees and 411 were self-employed).
Telephone surveys have strengths and weaknesses. They allow fast data collection and increased quality controls through interview controls and clarifications, and they permit data collection from individuals regardless of their reading and writing ability. A system of call backs and appointments, to facilitate a higher response rate and inclusion of responses from people who do not spend a great deal of time at home, means that this possible distortion is minimised in AWALI. The survey is likely to be biased against those who do not have a telephone at home.
Statistical conventions in this report
The following statistical conventions are used in this report unless otherwise specified. Following Australian Bureau of Statistics (ABS) conventions, full-time employment is defined as 35 or more work hours per week. All contrasts discussed in the text are statistically significant (i.e. not likely to be due to chance) at p < .05. The Dunn-Bonferroni correction was applied to multiple comparisons.
Work hours have a clear and consistent impact on work-life interference: as hours increase work-life interference also tends to increase. Therefore, work hours are entered as a covariate in some analyses in which mean scores on the index measure are compared. This means that the effect of work hours on the index scores is removed, or ‘controlled’, to observe the effect of another factor (e.g. gender) on work-life index scores. In this type of analysis we are essentially asking the ‘what if’ question of how work-life interference differs between groups (e.g. men and women) if they worked the same hours. For example, ‘what if men and women worked the same hours, would there be any difference in their work-life interference?’. The dynamics of the interaction between work and non-work activities are likely to be different for self-employed persons compared to employees. Therefore, in analyses that do not directly compare self-employed persons and employees, we focus exclusively on employees. Section 6 examines differences between the self-employed and employees.
As a sample drawn from a much larger population, the estimates presented in this report are subject to a degree of sampling bias; that is, the estimates may be different from the figures that would have been reported had all Australian workers been surveyed. Two strategies have been used to reduce this bias. All reported estimates have been weighted by Australian Bureau of Statistics data on age, highest level of schooling completed, sex and area (capital city and balance of State/Territory) to adjust for differences between the AWALI sample and the Australian population on these key demographics. We also follow the threshold rule used in the HILDA study (Heady,
10
Warren, & Harding, 2006) which sets a minimum of 20 units (i.e. respondents) that must contribute to the value of a cell for that figure to be considered reliable. Estimates that do not meet this threshold requirement are accompanied by an asterisk indicating that the estimate should be interpreted with caution.
What we know from previous AWALI surveys
Previous AWALI surveys have shown that work-life interference affects many Australian workers and that this work-life interference is much more significant than the reverse life-to-work interference effect.
A range of employment factors are associated with poor work-life outcomes: higher work-life interference is associated with jobs that lack flexibility and have high workloads, an unsupportive organisational culture and long hours. However, there is much more to work hours than their length. Unsocial work hours (evenings, weekends) and hours that are a poor fit to preferences are also strongly associated with worse work-life outcomes. Casual work and self-employment are not associated with better work-life outcomes compared to employees on permanent/ongoing contracts. Those in managerial and professional occupations are most likely to have poor work-life outcomes than workers in other occupations.
Particular social-demographic characteristics are also associated with worse work-life outcomes. Not surprisingly, parenting responsibilities significantly increase work-life strains. This most likely explains the higher levels of work-life interference observed for those in their middle years (aged 34-55). AWALI 2009 showed that engaging in education or training increases work-life challenges and strains, especially for women. Further, work-life issues (lack of time, fitting study in with work-family commitments) are prominent barriers to workers’ willingness to engage in education or training. AWALI 2010 showed that many workers stockpile their paid holiday leave, with negative effects on work-life interference for parents, especially mothers.
AWALI surveys in 2009 and 2012 investigated the frequency of workers’ requests for flexibility pre and post the Right to Request (RTR), and the positive impact on work-life of having a request fully agreed. This provides a baseline against which the impact of the Fair Work Act 2009 and its RTR flexibility can be assessed. Section 7 of this report compares request making prior to (2009) and subsequent to (2012, 2014) the introduction of this entitlement.
Structure of this report
This report is set out in eight sections. Section 2 describes the AWALI sample and its representativeness and general characteristics. Section 3 analyses the work-life interference of men and women in 2014, considering the component parts of the AWALI index and its summary measure in comparison with previous years’ findings. Given the significance of working hours to work-life interference, Section 4 focuses on work hours and their fit with workers’ preferences. Section 5 analyses the personal and household characteristics of respondents and their work-life interference. Section 6 considers employment characteristics and work-life interference including unsocial hours. Section 7 compares flexibility requests in 2014 with those reported in the 2009 and 2012 surveys. Section 8 compares rates of flourishing amongst Australian workers compared with their European counterparts, as well as the relationship between flourishing and work-life interference and other demographic and work characteristics.

11
Section 2: The AWALI 2014 sample
The AWALI 2014 sample comprises 2,690 employed persons (2,279 employees and 411 self-employed). Overall, the AWALI sample is representative of the Australian labour market at the time of the survey, although there are a few exceptions. See Table 1 for an overview of the AWALI 2014 sample.
Table 1 Overview of the AWALI 2014 sample (per cent)
Men Women All ABS survey
All 53.7 46.3 100 Men: 54.2;Women: 45.8
State
SA 10.9 10.8 10.9 6.9
WA 12.4 12.3 12.4 11.7
QLD 16.4 17.5 16.9 20.3
NSW 28.3 28.3 28.3 31.4
VIC 26.4 25.2 25.8 24.7
TAS 4.0 3.6 3.8 2.0
ACT 1.6 2.2 1.9 1.9
Age group
18–24 10.2 9.3 9.8 18.3
25–34 14.1 17.8 15.8 25.1
35–44 26.1 26.8 26.4 21.6
45–54 25.2 24.5 24.9 20.3
55–64 16.7 16.9 16.8 12.5
65+ 7.7 4.7 6.3 2.3
Highest level of education
University degree 40.4 43.9 42.0 27.9
TAFE/college 37.1 33.5 35.4 34.7
Secondary school 22.5 22.6 22.6 38.9
Occupation
Manager 16.8 11.5 14.3 9.9
Professional 25.3 29.3 27.1 22.4
Technician/trade 20.3 2.0 11.8 13.6
Community/personal service 9.6 20.8 14.8 11.1
Clerical and administrative 7.9 22.1 14.5 15.6
Sales 6.2 9.2 7.6 10.4
Machinery operators 7.3 0.8* 4.3 7.1
Labourers 6.6 4.4 5.6 10.0
Type of employment
Employee 80.9 89.2 84.7 82.7
Self-employed 19.1 10.8 15.3 17.3
Work hours
Full-time (35+ hours per week) 79.6 48.4 65.2 69.5
Part-time (< 35 hours per week) 20.4 51.6 34.8 30.5
Note. ABS data sources: ABS Cat. No. 6202.0 Labour Force, March 2014; ABS Cat. No. 6227.0 Education & Work Australia, May 2013 and ABS Cat. No. 6359.0 Forms of Employment, November 2013. ABS data includes those aged 15 years and older.
12
The AWALI 2014 sample provides a fair representation of employed Australians by gender, state, and work hours. The sample is also reasonably representative by education and occupation, although there is an over-representation of those with higher qualifications, older workers and those in professional occupations. Self-employed workers are also slightly under-represented in the sample. The AWALI 2014 sample also slightly under-represents casual workers. In the sample 16.7 per cent of employees are employed casually, compared to ABS estimates of 19.4 per cent (Australian Bureau of Statistics, 2013). This probably reflects the inclusion of workers aged 15 to 17 years old in ABS surveys, whereas the AWALI sample is aged 18 and older.
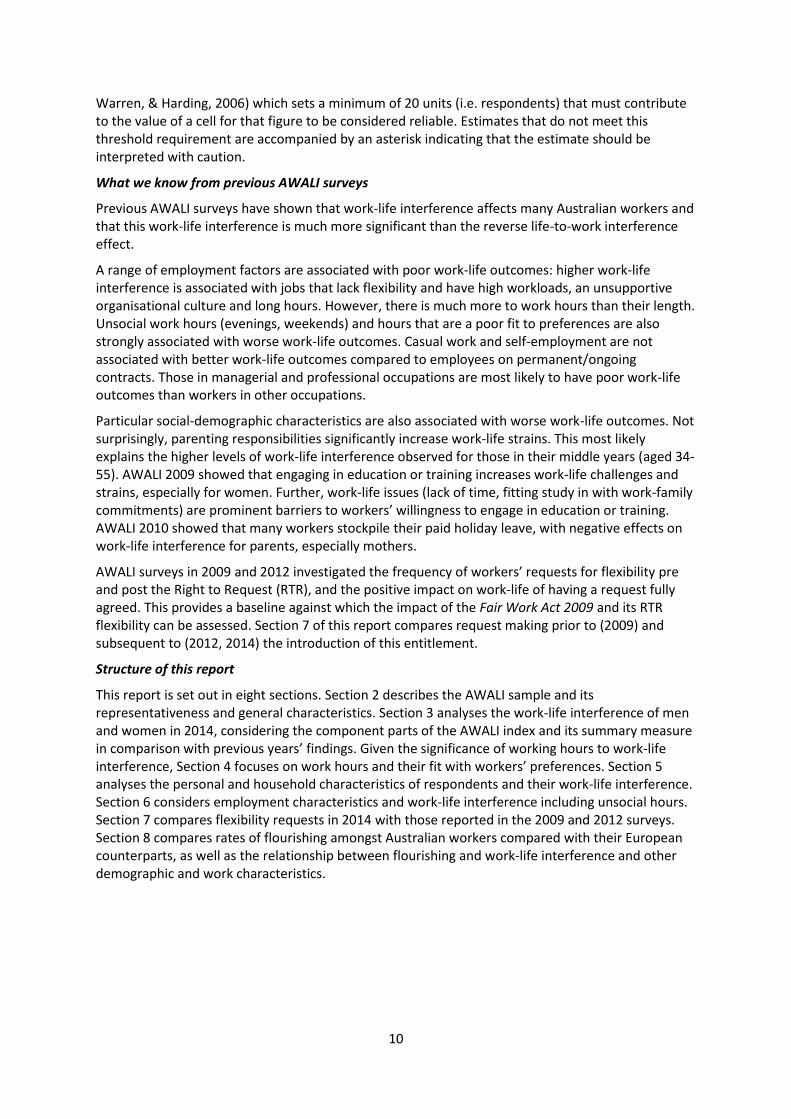
Turning now to the household composition reported by AWALI respondents, Table 2 shows that the majority of respondents are partnered (64.4 per cent). Just under half (42.7 per cent) of respondents are living in households with children. Of those respondents who have children, around one third had a pre-school aged child. Sole parents comprise only a small proportion of the sample (4.1 per cent). The most common household type was partnered with children (38.6 per cent).
Table 2 Household demographics of the AWALI sample, (per cent)
All
Adults in household
1 adult 18.0
2 or more adults 82.0
Marital status
Married/de facto 63.9
Divorced, separated, never married or widowed 36.1
Children in household
No children 54.7
1 child 15.5
2–3 children 28.0
4 or more children 1.7
Ages of children1
≤ 4 14.7
5–12 26.0
13–17 18.6
Type of household
Single parent 4.1
Couple with children 38.6
Single no children 31.5
Couple no children 25.8
Note. 1Percentage as proportion of total sample.

13
Section 3: Work-life interference: a gendered analysis
In the AWALI surveys we have consistently observed substantial gender differences in work-life outcomes. These differences are particularly apparent for working parents, with working mothers most likely to have high work-life interference. These gendered patterns of the interaction between paid work and other life domains are likely to reflect, to a large extent, gender differences in care and domestic work. As Pocock, Chapman and Skinner (2014) observe, over the past decades ‘breadwinning man/caring woman’ has been replaced by ‘male earner/female earner + carer’, with profound implications for how Australian households organise and manage work and care. Women continue to bear the brunt of such challenges and strains; in Australia, like most countries, women continue to spend more time on unpaid care and domestic work, even with comparable work hours to their male counterparts (Australian Bureau of Statistics, 2009a; Budlender, 2010; Sayer, England, Bittman, & Bianchi, 2009). This is a major contributor to how well work fits with other life activities and responsibilities.
In this section we compare men’s and women’s experiences of combining paid work with other life activities, with a particular focus on work-life interference and time pressure. In many of these analyses we consider part-time and full-time workers separately, to provide more meaningful comparisons across the years of AWALI data collections and between men and women.
Men, on average, are more likely to work longer hours than women. Therefore, a direct comparison of men’s and women’s work-life outcomes is effectively a comparison of groups who differ by gender and working hours. In examining men’s and women’s work-life outcomes we take differences in work hours into account by either comparing men and women working similar hours (e.g. all full-timers), or by statistically adjusting for differences in work hours. Analysis in this section includes only employees (the self-employed are considered in Section 6). Here we examine men’s and women’s responses to each of the five items that comprise the work-life index, and the overall AWALI index which is a combined measure of these five items.
Work-life interference in 2014: Individual work-life index items
As Table 3 shows, frequent work-life interference continues to be a common experience for Australian men and women. For around one quarter of all workers, work often or almost always interferes with activities outside work and time with family and friends. A further 28 per cent of workers say that work sometimes interferes with these other life domains. A substantial proportion of workers - around 18 per cent - also report that work frequently interferes with their community connections. These patterns have been consistent across all AWALI surveys. As observed in previous surveys, the largest gender difference continues to be around time pressure, with nearly 60 per cent of women reporting chronic time pressure compared to just under half of men. There were no significant gender differences on the other four index items.
Despite the relatively common experience of work-life interference, the majority of workers – around 70 per cent - report that they are satisfied with their work-life balance, and this has changed little over the past five years. Although there do appear to be small changes between 2012 and 2014 on some items in Table 3, none of these contrasts reached statistical significance. As detailed below, when full-time and part-time workers are considered separately, some differences emerge between 2012 and 2014 on the work-life index items.

14
Table 3 Work-life index items by gender, 2009 - 2014 (per cent)
2009 Often/ almost always
2010 Often/ almost always
2012 Often/ almost always
2014 Often/ almost always
Work interferes with activities outside work
Men 24.8 25.2 25.2 22.5
Women 22.3 23.0 23.3 19.6
All 23.6 24.2 24.3 21.1
Work interferes with enough time with family or friends
Men 26.9 28.2 28.7 26.9
Women 24.1 24.8 24.6 23.7
All 25.6 26.6 26.7 25.3
Work interferes with community connections
Men 17.8 19.3 19.6 19.0
Women 16.7 16.1 17.8 17.3
All 17.3 17.9 18.8 18.2
Feel rushed or pressed for time
Men 47.1 47.2 48.3 45.9
Women 62.0 60.8 60.7 57.7
All 54.2 53.5 54.2 51.6
Satisfaction with work-life balance
Men 67.2 67.0 68.7 69.6
Women 67.7 66.9 69.5 67.9
All 67.5 66.9 69.1 68.8
Note. Response scale on all items except satisfaction scale was never, rarely, sometimes, often, almost always. Table excludes self-employed persons.
Work interferes with activities outside work
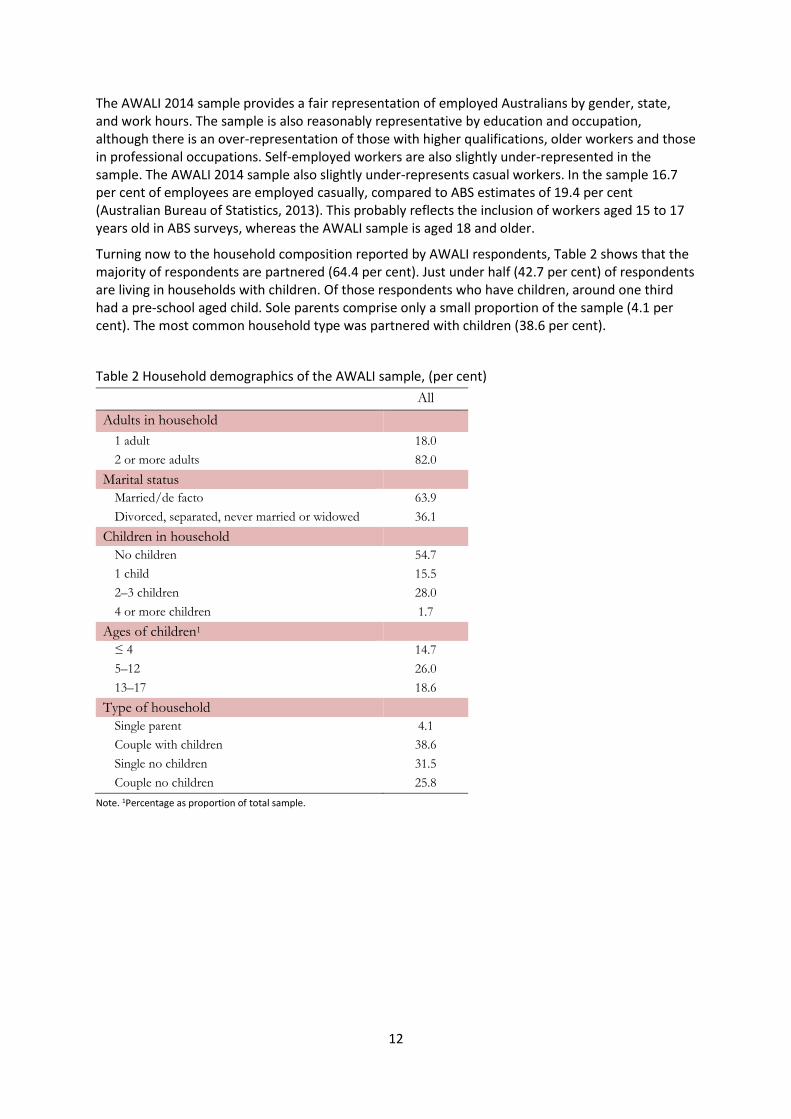
We now turn to an analysis of each of these work-life items, considering full-time and part-time workers separately. As Figure 1 shows, frequent work-life interference is common for full-timers (i.e. those working 35 hours a week or more). Work interferes with activities outside of work ‘sometimes’ or ‘often/almost always’ for around half of these workers in 2014, and this occurs frequently for around one quarter of full-timers, with no statistically significant differences between men and women in 2014.
There is a statistically significant difference in responses to this item between 2012 and 2014. Women working full-time in 2014 were less likely to report work frequently interfered with activities outside of work than full-time women in 2012. This contrast was also statistically significant for all full-time employees, with a non-significant trend in the same direction for full-time men. Indeed, as Figure 1 shows, full-timers’ ratings of work interference are higher through 2009 to 2012, with equivalent lower ratings in 2008 and 2014.
As expected, part-time employees consistently report lower levels of work-life interference on each of the work-life index measures. Between 2008 and 2014, around 15 per cent of part-time employees report that work frequently interferes with their non-work activities, with no significant difference between men and women.
15
Figure 1 Work interferes with activities outside work, full-time workers, 2008–2014 (per cent) Note. Figure excludes self-employed persons.
Time with family and friends
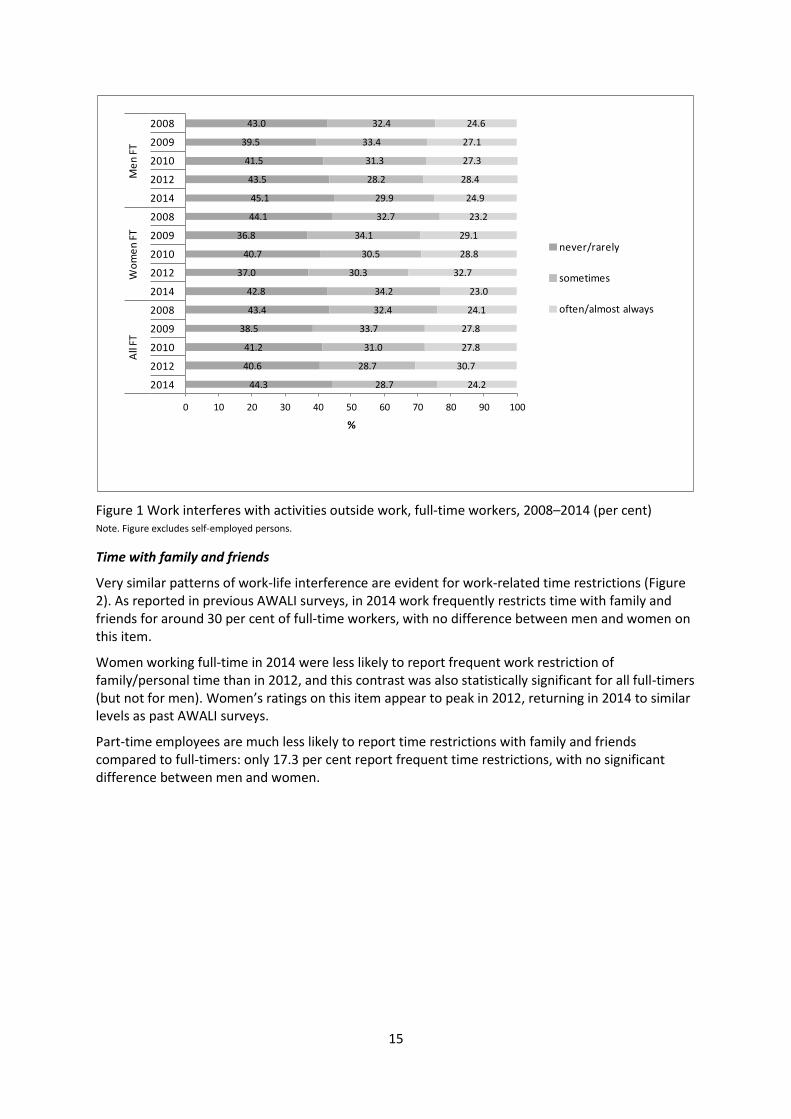
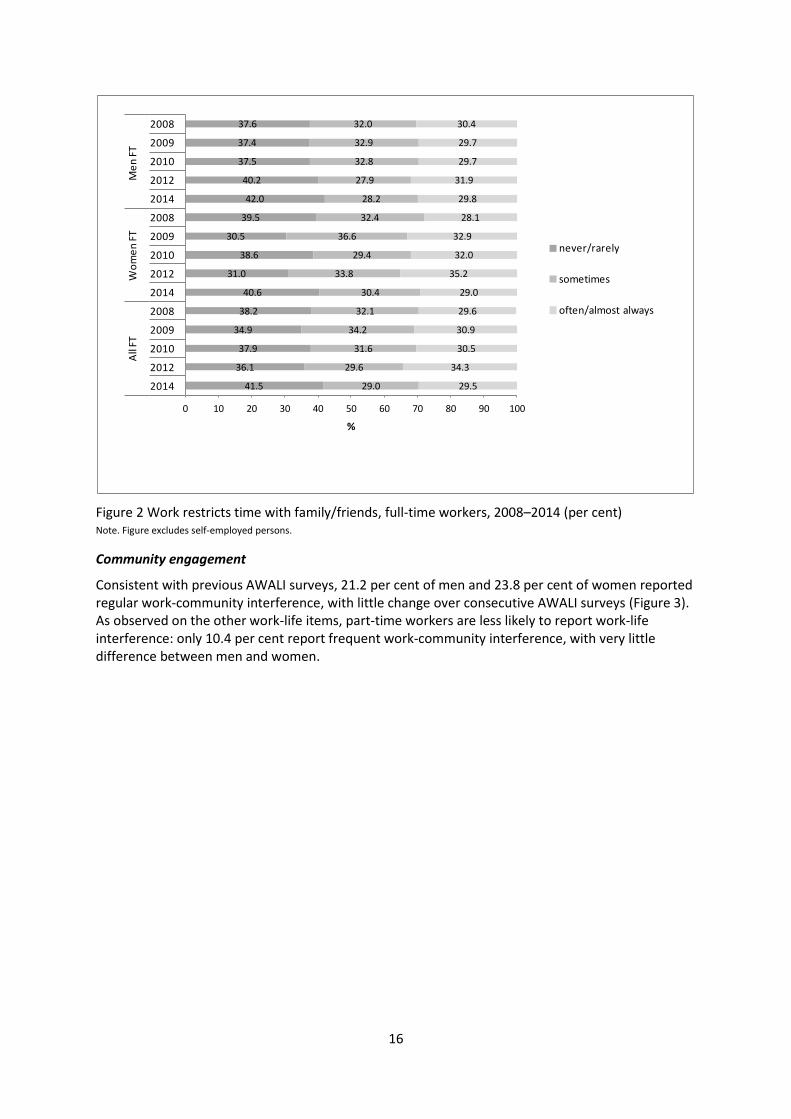
Very similar patterns of work-life interference are evident for work-related time restrictions (Figure 2). As reported in previous AWALI surveys, in 2014 work frequently restricts time with family and friends for around 30 per cent of full-time workers, with no difference between men and women on this item.
Women working full-time in 2014 were less likely to report frequent work restriction of family/personal time than in 2012, and this contrast was also statistically significant for all full-timers (but not for men). Women’s ratings on this item appear to peak in 2012, returning in 2014 to similar levels as past AWALI surveys.
Part-time employees are much less likely to report time restrictions with family and friends compared to full-timers: only 17.3 per cent report frequent time restrictions, with no significant difference between men and women.
44.3
40.6
41.2
38.5
43.4
42.8
37.0
40.7
36.8
44.1
45.1
43.5
41.5
39.5
43.0
28.7
28.7
31.0
33.7
32.4
34.2
30.3
30.5
34.1
32.7
29.9
28.2
31.3
33.4
32.4
24.2
30.7
27.8
27.8
24.1
23.0
32.7
28.8
29.1
23.2
24.9
28.4
27.3
27.1
24.6
0 10 20 30 40 50 60 70 80 90 100
2014
2012
2010
2009
2008
2014
2012
2010
2009
2008
2014
2012
2010
2009
2008A
ll FT
Wo
me
n F
TM
en
FT
%
never/rarely
sometimes
often/almost always
16
Figure 2 Work restricts time with family/friends, full-time workers, 2008–2014 (per cent) Note. Figure excludes self-employed persons.
Community engagement
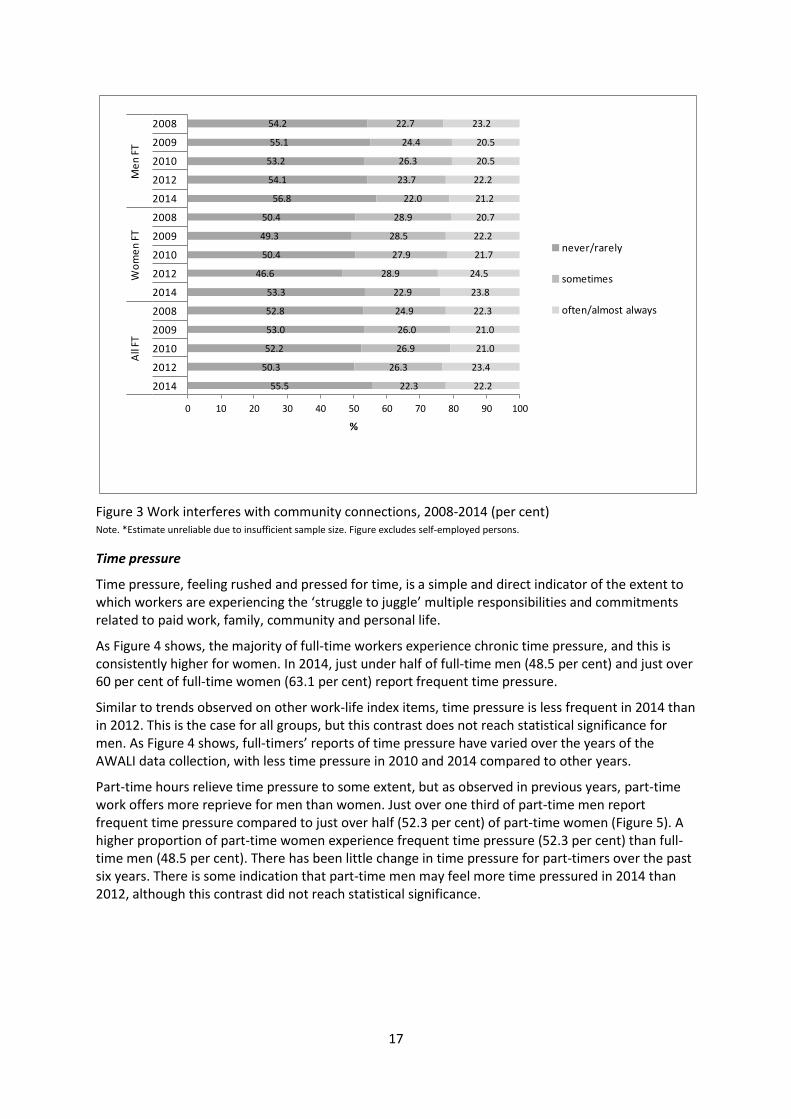
Consistent with previous AWALI surveys, 21.2 per cent of men and 23.8 per cent of women reported regular work-community interference, with little change over consecutive AWALI surveys (Figure 3). As observed on the other work-life items, part-time workers are less likely to report work-life interference: only 10.4 per cent report frequent work-community interference, with very little difference between men and women.
41.5
36.1
37.9
34.9
38.2
40.6
31.0
38.6
30.5
39.5
42.0
40.2
37.5
37.4
37.6
29.0
29.6
31.6
34.2
32.1
30.4
33.8
29.4
36.6
32.4
28.2
27.9
32.8
32.9
32.0
29.5
34.3
30.5
30.9
29.6
29.0
35.2
32.0
32.9
28.1
29.8
31.9
29.7
29.7
30.4
0 10 20 30 40 50 60 70 80 90 100
2014
2012
2010
2009
2008
2014
2012
2010
2009
2008
2014
2012
2010
2009
2008A
ll FT
Wo
me
n F
TM
en
FT
%
never/rarely
sometimes
often/almost always
17
Figure 3 Work interferes with community connections, 2008-2014 (per cent) Note. *Estimate unreliable due to insufficient sample size. Figure excludes self-employed persons.
Time pressure
Time pressure, feeling rushed and pressed for time, is a simple and direct indicator of the extent to which workers are experiencing the ‘struggle to juggle’ multiple responsibilities and commitments related to paid work, family, community and personal life.
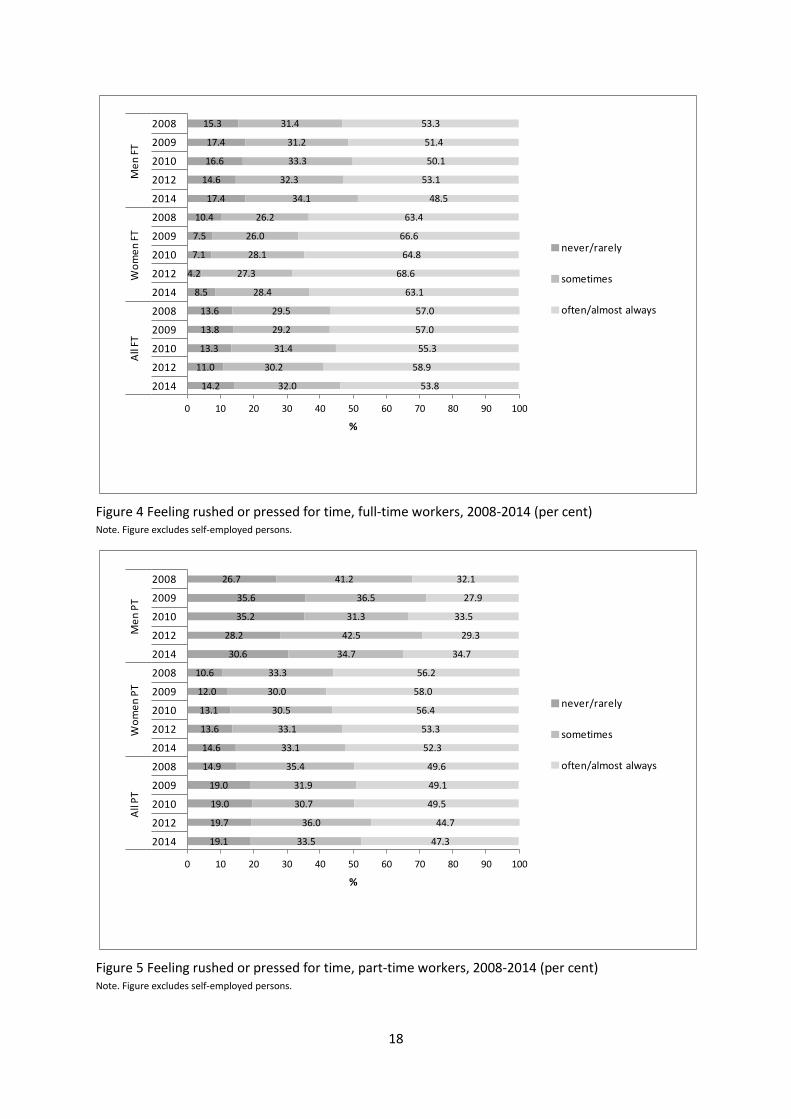
As Figure 4 shows, the majority of full-time workers experience chronic time pressure, and this is consistently higher for women. In 2014, just under half of full-time men (48.5 per cent) and just over 60 per cent of full-time women (63.1 per cent) report frequent time pressure.
Similar to trends observed on other work-life index items, time pressure is less frequent in 2014 than in 2012. This is the case for all groups, but this contrast does not reach statistical significance for men. As Figure 4 shows, full-timers’ reports of time pressure have varied over the years of the AWALI data collection, with less time pressure in 2010 and 2014 compared to other years.
Part-time hours relieve time pressure to some extent, but as observed in previous years, part-time work offers more reprieve for men than women. Just over one third of part-time men report frequent time pressure compared to just over half (52.3 per cent) of part-time women (Figure 5). A higher proportion of part-time women experience frequent time pressure (52.3 per cent) than full-time men (48.5 per cent). There has been little change in time pressure for part-timers over the past six years. There is some indication that part-time men may feel more time pressured in 2014 than 2012, although this contrast did not reach statistical significance.
55.5
50.3
52.2
53.0
52.8
53.3
46.6
50.4
49.3
50.4
56.8
54.1
53.2
55.1
54.2
22.3
26.3
26.9
26.0
24.9
22.9
28.9
27.9
28.5
28.9
22.0
23.7
26.3
24.4
22.7
22.2
23.4
21.0
21.0
22.3
23.8
24.5
21.7
22.2
20.7
21.2
22.2
20.5
20.5
23.2
0 10 20 30 40 50 60 70 80 90 100
2014
2012
2010
2009
2008
2014
2012
2010
2009
2008
2014
2012
2010
2009
2008A
ll FT
Wo
me
n F
TM
en
FT
%
never/rarely
sometimes
often/almost always
18
Figure 4 Feeling rushed or pressed for time, full-time workers, 2008-2014 (per cent) Note. Figure excludes self-employed persons.
Figure 5 Feeling rushed or pressed for time, part-time workers, 2008-2014 (per cent) Note. Figure excludes self-employed persons.
14.2
11.0
13.3
13.8
13.6
8.5
4.2
7.1
7.5
10.4
17.4
14.6
16.6
17.4
15.3
32.0
30.2
31.4
29.2
29.5
28.4
27.3
28.1
26.0
26.2
34.1
32.3
33.3
31.2
31.4
53.8
58.9
55.3
57.0
57.0
63.1
68.6
64.8
66.6
63.4
48.5
53.1
50.1
51.4
53.3
0 10 20 30 40 50 60 70 80 90 100
2014
2012
2010
2009
2008
2014
2012
2010
2009
2008
2014
2012
2010
2009
2008A
ll FT
Wo
me
n F
TM
en
FT
%
never/rarely
sometimes
often/almost always
19.1
19.7
19.0
19.0
14.9
14.6
13.6
13.1
12.0
10.6
30.6
28.2
35.2
35.6
26.7
33.5
36.0
30.7
31.9
35.4
33.1
33.1
30.5
30.0
33.3
34.7
42.5
31.3
36.5
41.2
47.3
44.7
49.5
49.1
49.6
52.3
53.3
56.4
58.0
56.2
34.7
29.3
33.5
27.9
32.1
0 10 20 30 40 50 60 70 80 90 100
2014
2012
2010
2009
2008
2014
2012
2010
2009
2008
2014
2012
2010
2009
2008
All
PT
Wo
me
n P
TM
en
PT
%
never/rarely
sometimes
often/almost always
19
Considering all employees (full-time, part-time combined), 57.7 per cent of women are frequently time pressured in 2014, compared to 45.9 per cent of men. This high level of time pressure for women has been consistent since 2008.
Mothers are particularly affected by these pressures, with 69.0 per cent of mothers frequently time pressured in 2014 (54.6 per cent of fathers). This is consistent with previous years.
Satisfaction with work-life balance
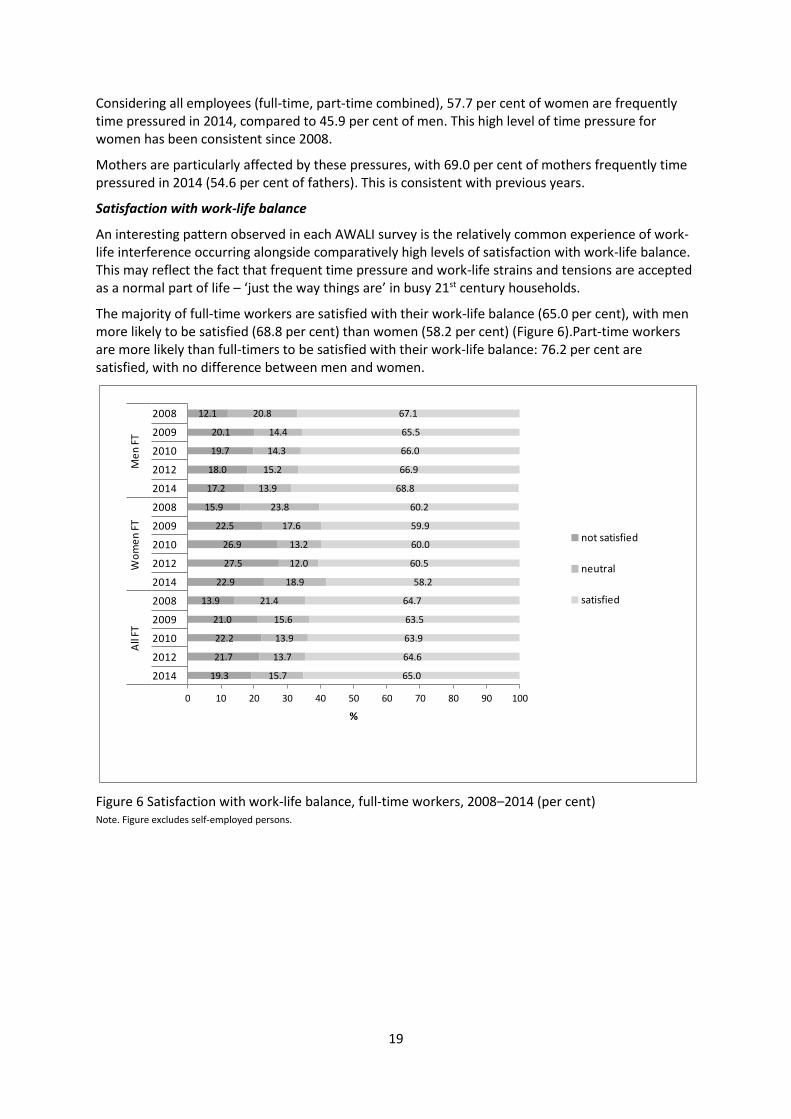
An interesting pattern observed in each AWALI survey is the relatively common experience of work-life interference occurring alongside comparatively high levels of satisfaction with work-life balance. This may reflect the fact that frequent time pressure and work-life strains and tensions are accepted as a normal part of life – ‘just the way things are’ in busy 21st century households.
The majority of full-time workers are satisfied with their work-life balance (65.0 per cent), with men more likely to be satisfied (68.8 per cent) than women (58.2 per cent) (Figure 6).Part-time workers are more likely than full-timers to be satisfied with their work-life balance: 76.2 per cent are satisfied, with no difference between men and women.
Figure 6 Satisfaction with work-life balance, full-time workers, 2008–2014 (per cent) Note. Figure excludes self-employed persons.
19.3
21.7
22.2
21.0
13.9
22.9
27.5
26.9
22.5
15.9
17.2
18.0
19.7
20.1
12.1
15.7
13.7
13.9
15.6
21.4
18.9
12.0
13.2
17.6
23.8
13.9
15.2
14.3
14.4
20.8
65.0
64.6
63.9
63.5
64.7
58.2
60.5
60.0
59.9
60.2
68.8
66.9
66.0
65.5
67.1
0 10 20 30 40 50 60 70 80 90 100
2014
2012
2010
2009
2008
2014
2012
2010
2009
2008
2014
2012
2010
2009
2008
All
FTW
om
en
FT
Me
n F
T
%
not satisfied
neutral
satisfied
20
Australians’ work-life interference from 2008 to 2014
We now consider the overall work-life index, a summated measure which combines responses on the above five work-life items into a single score. This score gives an overall indication of the intensity of work-life strains and pressures. It is a standardised scale with 0 as the lowest score (very low work-life interference) to 100 as the highest score (very high work-life interference).
As we discuss in Section 4, length of work hours has a substantial effect on work-life interference. Therefore, to identify the contribution (independent of work hours) that gender, employment type or other factors have on work-life interference, we statistically adjust index scores for differences in work hours between the groups that are being compared (e.g. men and women). We compare data from five AWALI surveys, conducted from 2008 to 2014.
Key trends by gender and work hours
We begin by reporting on work-life index scores for employee men and women both adjusted and unadjusted for work hours. Work-life interference has been fairly stable between 2008 and 2014. When gender differences in hours are not taken into account (unadjusted scores), employee index scores are similar for men (41.8) and women (42.2) (42.0, all employees). However, when differences in hours are statistically controlled (adjusted scores), we find that women report higher levels of work-life interference (44.4) compared to men (39.7). There has been little change in these index scores, adjusted or unadjusted for work hours, across the AWALI surveys from 2008 to 2014.
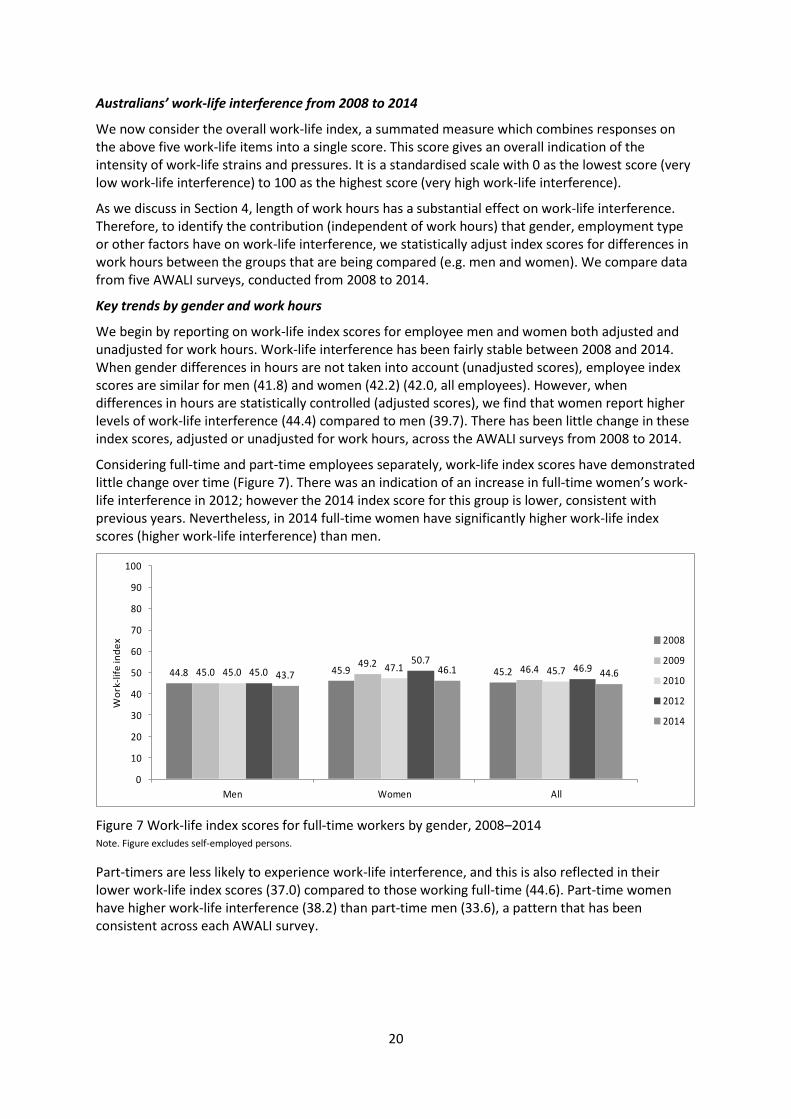
Considering full-time and part-time employees separately, work-life index scores have demonstrated little change over time (Figure 7). There was an indication of an increase in full-time women’s work-life interference in 2012; however the 2014 index score for this group is lower, consistent with previous years. Nevertheless, in 2014 full-time women have significantly higher work-life index scores (higher work-life interference) than men.
Figure 7 Work-life index scores for full-time workers by gender, 2008–2014 Note. Figure excludes self-employed persons.
Part-timers are less likely to experience work-life interference, and this is also reflected in their lower work-life index scores (37.0) compared to those working full-time (44.6). Part-time women have higher work-life interference (38.2) than part-time men (33.6), a pattern that has been consistent across each AWALI survey.
44.8 45.9 45.245.049.2
46.445.0 47.1 45.745.050.7
46.943.7 46.1 44.6
0
10
20
30
40
50
60
70
80
90
100
Men Women All
Wo
rk-l
ife
ind
ex 2008
2009
2010
2012
2014
21
Summary
The 2014 AWALI survey allows us to examine trends over the past seven years. Whilst there have been small changes across the years, the general pattern of findings remains consistent.
Time pressure is the most common work-life strain experienced by men and women.
Around one quarter of workers report that work frequently restricts time with family and friends.
As observed in previous AWALI surveys, the majority of workers report being satisfied with their work-life balance.
Gender differences are most apparent with regard to time pressure and satisfaction with work-life balance; women report significantly poorer outcomes on these items than men (i.e. more time pressured and less satisfied).
On some individual work-life items, and the work-life index, there is evidence of a decrease in work-life interference from 2012 to 2014 for women working full-time.
Part-time workers consistently report better work-life outcomes than full-timers.
On the work-life index, a composite measure of the five separate work-life items, women have higher scores (worse work-life interference) than men, in both full-time and part-time work.
There has been little change in work-life index scores over the AWALI surveys from 2008 to 2014.

22
Section 4: Actual and preferred working hours and work-life interference
The number of hours worked, and the extent to which these hours fit with non-work responsibilities, is well established as a major factor affecting work-life interference (see Skinner & Chapman, 2013 for a review).
In this section we take an in-depth look at working hours, focusing on two aspects of working time: the length of work hours and the extent to which work hours fit with workers’ preferences. This section continues the focus on employees, with a separate analysis of self-employed workers presented in Section 6.
The risks of long work hours with regard to safety, health and wellbeing are recognised in the Australian National Employment Standards, which establish 38 hours as the maximum weekly work hours, with the exception of reasonable requests to work longer hours. Parents or other carers also have a Right to Request a change to their work arrangements which can include a reduction in work hours. Stronger legislation is in place in other countries, such as the 2003 European Working Time Directive which contains a maximum weekly working time provision of 48 hours per week including overtime, although there is provision for some workers to voluntarily opt out of this limit.
In this report we follow international conventions that define long hours as 48+ hours per week. The International Labour Organisation (ILO) defines these working hours as ‘very long’. The European Parliament’s Working Time Directive places an upper limit on weekly working hours of 48 hours including overtime.
In addition to the absolute number of hours worked, we also consider workers’ preferences with regard to their working hours. Australian and international research has consistently shown that working longer hours than preferred is a stronger predictor of health and wellbeing outcomes than length of work hours per se (Barnett, 2006; Wooden, Warren, & Drago, 2009). This most likely reflects the realities of changing needs and preferences over the life course, as capacity and willingness to work particular hours is obviously strongly influenced by workers’ caring responsibilities, and this is especially the case for women. Further, older workers transitioning to retirement may also be less willing or able to work long or full-time hours (Moen, 2011).
Working hours and work-life interference – comparing men and women
In 2014 workers reported that they worked an average of 36.5 hours a week (including paid and unpaid overtime), with men working on average 9.5 more hours each week (41.2 hours) than women (31.7 hours). Beneath these averages lie further significant gender differences.
In the AWALI 2014 survey, less than half (47.4 per cent) of all employees worked ‘standard’ full-time hours of between 35 to 47 hours a week (Figure 8). These hours are more common for men (54.7 per cent) than women (39.6 per cent). Almost one fifth (18.5 per cent) of employees work longer full-time hours (48+ hours per week). Around three times as many men (26.7 per cent) work these long hours than women (9.7 per cent).
Half of women (50.7 per cent) work part-time compared to just 18.6 per cent of men. Longer part-time hours (16 to 34 hours) are also more common for women: 36.3 per cent of all women work these hours compared to only 12.0 per cent of men. A small proportion of women work shorter part-time hours (14.4 per cent) - a work arrangement that is rare for men (6.6 per cent).
This distribution of working hours is close to that detailed in the Australian Bureau of Statistics (ABS) Labour Force survey (Australian Bureau of Statistics, 2012) (Figure 8). The ABS survey includes workers aged 15 to 19 years, whereas the AWALI sample contains respondents aged 18 years and over. This may account for the lower proportion of part-time workers in the AWALI sample compared to the ABS estimate. In addition, more workers in the AWALI 2014 survey report long full-time hours (18.5 per cent) than the national average (12.9 per cent).
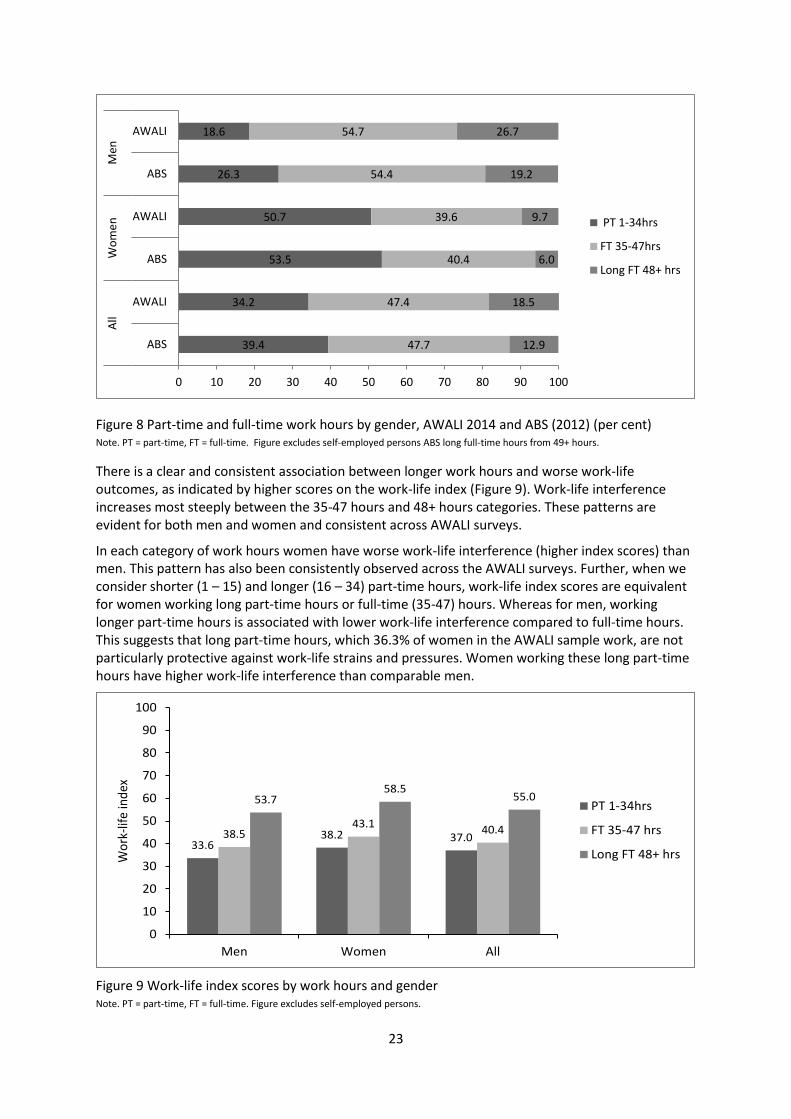
23
Figure 8 Part-time and full-time work hours by gender, AWALI 2014 and ABS (2012) (per cent) Note. PT = part-time, FT = full-time. Figure excludes self-employed persons ABS long full-time hours from 49+ hours.
There is a clear and consistent association between longer work hours and worse work-life outcomes, as indicated by higher scores on the work-life index (Figure 9). Work-life interference increases most steeply between the 35-47 hours and 48+ hours categories. These patterns are evident for both men and women and consistent across AWALI surveys.
In each category of work hours women have worse work-life interference (higher index scores) than men. This pattern has also been consistently observed across the AWALI surveys. Further, when we consider shorter (1 – 15) and longer (16 – 34) part-time hours, work-life index scores are equivalent for women working long part-time hours or full-time (35-47) hours. Whereas for men, working longer part-time hours is associated with lower work-life interference compared to full-time hours. This suggests that long part-time hours, which 36.3% of women in the AWALI sample work, are not particularly protective against work-life strains and pressures. Women working these long part-time hours have higher work-life interference than comparable men.
Figure 9 Work-life index scores by work hours and gender Note. PT = part-time, FT = full-time. Figure excludes self-employed persons.
39.4
34.2
53.5
50.7
26.3
18.6
47.7
47.4
40.4
39.6
54.4
54.7
12.9
18.5
6.0
9.7
19.2
26.7
0 10 20 30 40 50 60 70 80 90 100
ABS
AWALI
ABS
AWALI
ABS
AWALI
All
Wo
me
nM
en
PT 1-34hrs
FT 35-47hrs
Long FT 48+ hrs
33.638.2 37.038.5
43.140.4
53.758.5
55.0
0
10
20
30
40
50
60
70
80
90
100
Men Women All
Wo
rk-l
ife
ind
ex
PT 1-34hrs
FT 35-47 hrs
Long FT 48+ hrs
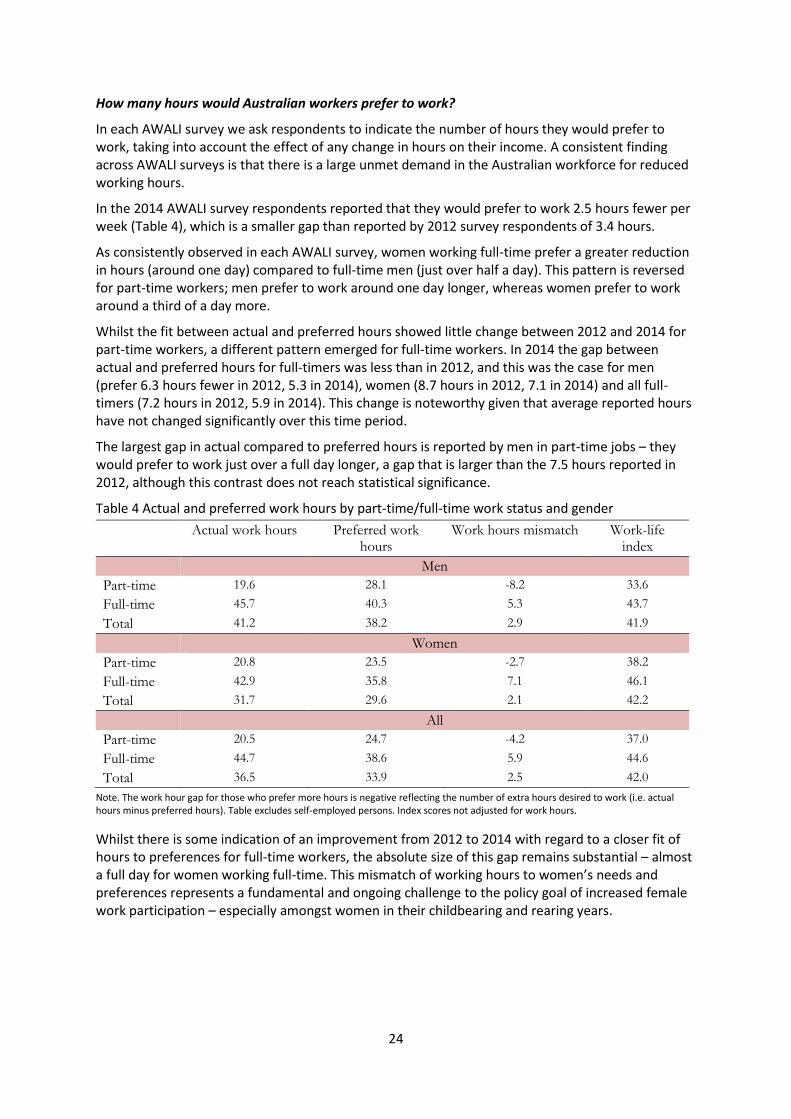
24
How many hours would Australian workers prefer to work?
In each AWALI survey we ask respondents to indicate the number of hours they would prefer to work, taking into account the effect of any change in hours on their income. A consistent finding across AWALI surveys is that there is a large unmet demand in the Australian workforce for reduced working hours.
In the 2014 AWALI survey respondents reported that they would prefer to work 2.5 hours fewer per week (Table 4), which is a smaller gap than reported by 2012 survey respondents of 3.4 hours.
As consistently observed in each AWALI survey, women working full-time prefer a greater reduction in hours (around one day) compared to full-time men (just over half a day). This pattern is reversed for part-time workers; men prefer to work around one day longer, whereas women prefer to work around a third of a day more.
Whilst the fit between actual and preferred hours showed little change between 2012 and 2014 for part-time workers, a different pattern emerged for full-time workers. In 2014 the gap between actual and preferred hours for full-timers was less than in 2012, and this was the case for men (prefer 6.3 hours fewer in 2012, 5.3 in 2014), women (8.7 hours in 2012, 7.1 in 2014) and all full-timers (7.2 hours in 2012, 5.9 in 2014). This change is noteworthy given that average reported hours have not changed significantly over this time period.
The largest gap in actual compared to preferred hours is reported by men in part-time jobs – they would prefer to work just over a full day longer, a gap that is larger than the 7.5 hours reported in 2012, although this contrast does not reach statistical significance.
Table 4 Actual and preferred work hours by part-time/full-time work status and gender
Actual work hours Preferred work hours
Work hours mismatch Work-life index
Men
Part-time 19.6 28.1 -8.2 33.6
Full-time 45.7 40.3 5.3 43.7
Total 41.2 38.2 2.9 41.9
Women
Part-time 20.8 23.5 -2.7 38.2
Full-time 42.9 35.8 7.1 46.1
Total 31.7 29.6 2.1 42.2
All
Part-time 20.5 24.7 -4.2 37.0
Full-time 44.7 38.6 5.9 44.6
Total 36.5 33.9 2.5 42.0
Note. The work hour gap for those who prefer more hours is negative reflecting the number of extra hours desired to work (i.e. actual hours minus preferred hours). Table excludes self-employed persons. Index scores not adjusted for work hours.
Whilst there is some indication of an improvement from 2012 to 2014 with regard to a closer fit of hours to preferences for full-time workers, the absolute size of this gap remains substantial – almost a full day for women working full-time. This mismatch of working hours to women’s needs and preferences represents a fundamental and ongoing challenge to the policy goal of increased female work participation – especially amongst women in their childbearing and rearing years.
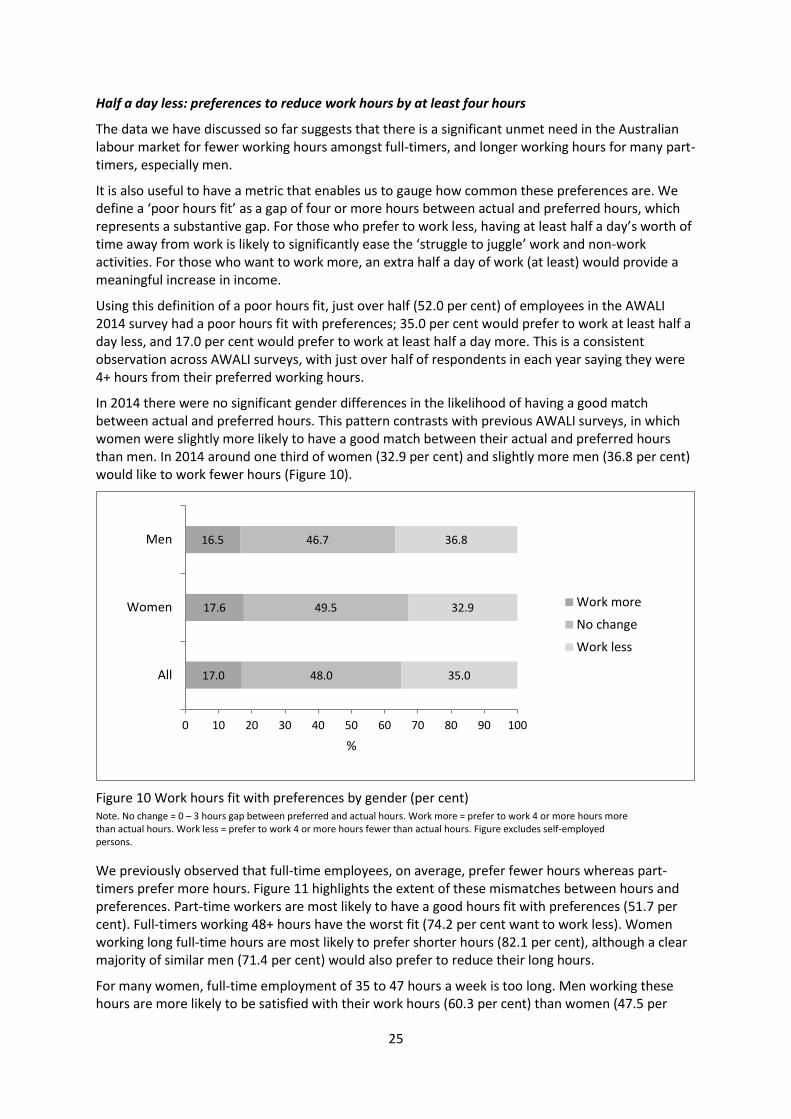
25
Half a day less: preferences to reduce work hours by at least four hours
The data we have discussed so far suggests that there is a significant unmet need in the Australian labour market for fewer working hours amongst full-timers, and longer working hours for many part-timers, especially men.
It is also useful to have a metric that enables us to gauge how common these preferences are. We define a ‘poor hours fit’ as a gap of four or more hours between actual and preferred hours, which represents a substantive gap. For those who prefer to work less, having at least half a day’s worth of time away from work is likely to significantly ease the ‘struggle to juggle’ work and non-work activities. For those who want to work more, an extra half a day of work (at least) would provide a meaningful increase in income.
Using this definition of a poor hours fit, just over half (52.0 per cent) of employees in the AWALI 2014 survey had a poor hours fit with preferences; 35.0 per cent would prefer to work at least half a day less, and 17.0 per cent would prefer to work at least half a day more. This is a consistent observation across AWALI surveys, with just over half of respondents in each year saying they were 4+ hours from their preferred working hours.
In 2014 there were no significant gender differences in the likelihood of having a good match between actual and preferred hours. This pattern contrasts with previous AWALI surveys, in which women were slightly more likely to have a good match between their actual and preferred hours than men. In 2014 around one third of women (32.9 per cent) and slightly more men (36.8 per cent) would like to work fewer hours (Figure 10).
Figure 10 Work hours fit with preferences by gender (per cent) Note. No change = 0 – 3 hours gap between preferred and actual hours. Work more = prefer to work 4 or more hours more than actual hours. Work less = prefer to work 4 or more hours fewer than actual hours. Figure excludes self-employed persons.
We previously observed that full-time employees, on average, prefer fewer hours whereas part-timers prefer more hours. Figure 11 highlights the extent of these mismatches between hours and preferences. Part-time workers are most likely to have a good hours fit with preferences (51.7 per cent). Full-timers working 48+ hours have the worst fit (74.2 per cent want to work less). Women working long full-time hours are most likely to prefer shorter hours (82.1 per cent), although a clear majority of similar men (71.4 per cent) would also prefer to reduce their long hours.
For many women, full-time employment of 35 to 47 hours a week is too long. Men working these hours are more likely to be satisfied with their work hours (60.3 per cent) than women (47.5 per
17.0
17.6
16.5
48.0
49.5
46.7
35.0
32.9
36.8
0 10 20 30 40 50 60 70 80 90 100
All
Women
Men
%
Work more
No change
Work less

26
cent). Indeed, around half of these women would prefer fewer hours (49.1 per cent) compared to just nearly a third of similar men (30.9 per cent).
Very clear gender differences are also evident in the experience of part-time work hours. The majority of women working part-time are satisfied with their hours (57.0 per cent). In contrast, the majority (56.4 per cent) of men working part-time would prefer to change their hours, with almost ten times as many wanting more hours than less.
Figure 11 Work hours fit with preferences by gender and work hours (per cent) Note. *Estimate unreliable due to insufficient sample size. No change = 0 – 3 hours gap between preferred and actual hours. Work more = prefer to work 4 or more hours more than actual hours. Work less = prefer to work 4 or more hours fewer than actual hours. Figure excludes self-employed persons.
Work-life interference and hours ‘fit’
A preference to reduce hours, taking into account the effect on income, is a simple but clear indicator of the extent to which paid work is experienced as taking up too much time in daily life. It is therefore not surprising to find a clear association between a poor hours fit and higher work-life interference. As Figure 12 shows, work-life interference is significantly higher for workers who would prefer to reduce their working week by at least four hours.
3.4
6.6
39.0
3.4*
32.1
4.5*
8.7
56.4
22.5
55.1
51.7
17.9
47.5
57.0
24.0
60.3
38.1
74.2
38.3
9.3
82.1
49.1
10.8
71.4
30.9
5.5*
0 10 20 30 40 50 60 70 80 90 100
Long full-time (48+ hrs)
Full-time (35-47 hrs)
Part-time
Long full-time (48+ hrs)
Full-time (35-47 hrs)
Part-time
Long full-time (48+ hrs)
Full-time (35-47 hrs)
Part-time
All
Wo
men
Men
%
Work more
No change
Work less

27
Figure 12 Work-life index scores by work hours fit Note. No change = 0 – 3 hours gap between preferred and actual hours. Work more = prefer to work 4+ more hours than actual hours. Work less = prefer to work 4 or more hours fewer than actual hours. Figure excludes self-employed persons.
Not all working hours are the same: working non-standard or unsocial hours
We have considered work hours from two perspectives: length of hours and their fit with preferences. Here we look beyond the number of work hours to consider the way in which work is scheduled. This can have a major impact on work-life interaction. Like long work hours, unsocial work hours that involve evening/night or weekend work are associated with a range of negative outcomes for health, family and personal relationships (Caruso, 2006). There is much public discussion about penalty rates in Australia and whether there remains a case for a pay premium for those who work at nights and on Saturday or Sunday, and the appropriate level of these payments. If workers choose to work at these times, and it facilitates their work-life balance, should they be paid penalty rates – and at what level? Some employer organisations have argued strongly against existing penalty rate arrangements. For example, Kate Carnell, Chief Executive of the Australian Chamber of Commerce and Industry, said on 3 June 2014 ‘I think we have to accept that the train's left the station on this. We don't look at Sundays the way we used to’ (Carnell, 2014). We asked a series of relevant questions in AWALI 2014 to bring some additional evidence to bear on these issues.
In AWALI 2014 unsocial work hours were assessed by the reported frequency (never, rarely, sometimes, often, almost always) with which respondents worked on Saturdays, Sundays or evenings/nights past 9pm (three separate questions). ‘Regular unsocial hours’ are defined as responses of ‘often or almost always’ on either of these measures. We define ‘standard’ as work on weekdays before 9pm. This is a fairly generous definition of ‘standard’: most people would probably still define normal hours as between around 8am and 6pm on weekdays.
This analysis replicates the analysis of unsocial working time in the AWALI 2008 survey (Skinner & Pocock, 2008). Substantive differences between 2008 and 2014 are observed in the text below.
Who works unsocial work hours?
The majority of respondents (62.0 per cent) work weekdays, before 9pm (Table 5). The most common form of unsocial work scheduling is weekends (19.1 per cent), followed by a combination of weekends and evenings/nights (13.1 per cent). Only 5.8 per cent of employees work exclusively on night/evening shifts. Men are more likely to work evenings (solely, or in combination with
38.735.7
51.8
0
10
20
30
40
50
60
70
80
90
100
Work more No change Work less
Wor
k-Li
fe In
dex
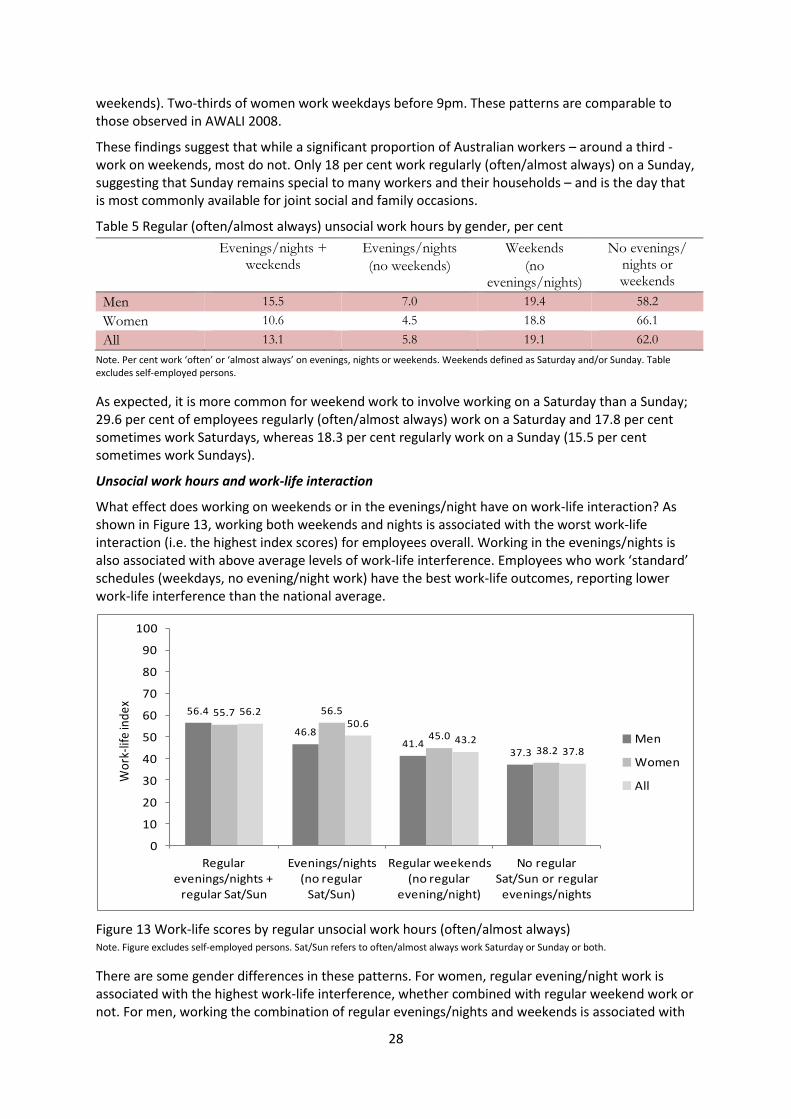
28
weekends). Two-thirds of women work weekdays before 9pm. These patterns are comparable to those observed in AWALI 2008.
These findings suggest that while a significant proportion of Australian workers – around a third - work on weekends, most do not. Only 18 per cent work regularly (often/almost always) on a Sunday, suggesting that Sunday remains special to many workers and their households – and is the day that is most commonly available for joint social and family occasions.
Table 5 Regular (often/almost always) unsocial work hours by gender, per cent
Evenings/nights + weekends
Evenings/nights
(no weekends)
Weekends
(no evenings/nights)
No evenings/ nights or weekends
Men 15.5 7.0 19.4 58.2
Women 10.6 4.5 18.8 66.1
All 13.1 5.8 19.1 62.0
Note. Per cent work ‘often’ or ‘almost always’ on evenings, nights or weekends. Weekends defined as Saturday and/or Sunday. Table excludes self-employed persons.
As expected, it is more common for weekend work to involve working on a Saturday than a Sunday; 29.6 per cent of employees regularly (often/almost always) work on a Saturday and 17.8 per cent sometimes work Saturdays, whereas 18.3 per cent regularly work on a Sunday (15.5 per cent sometimes work Sundays).
Unsocial work hours and work-life interaction
What effect does working on weekends or in the evenings/night have on work-life interaction? As shown in Figure 13, working both weekends and nights is associated with the worst work-life interaction (i.e. the highest index scores) for employees overall. Working in the evenings/nights is also associated with above average levels of work-life interference. Employees who work ‘standard’ schedules (weekdays, no evening/night work) have the best work-life outcomes, reporting lower work-life interference than the national average.
Figure 13 Work-life scores by regular unsocial work hours (often/almost always) Note. Figure excludes self-employed persons. Sat/Sun refers to often/almost always work Saturday or Sunday or both.
There are some gender differences in these patterns. For women, regular evening/night work is associated with the highest work-life interference, whether combined with regular weekend work or not. For men, working the combination of regular evenings/nights and weekends is associated with
56.4
46.841.4
37.3
55.7 56.5
45.0
38.2
56.250.6
43.237.8
0
10
20
30
40
50
60
70
80
90
100
Regular evenings/nights +
regular Sat/Sun
Evenings/nights (no regular
Sat/Sun)
Regular weekends (no regular
evening/night)
No regular Sat/Sun or regular
evenings/nights
Wor
k-lif
e in
dex
Men
Women
All
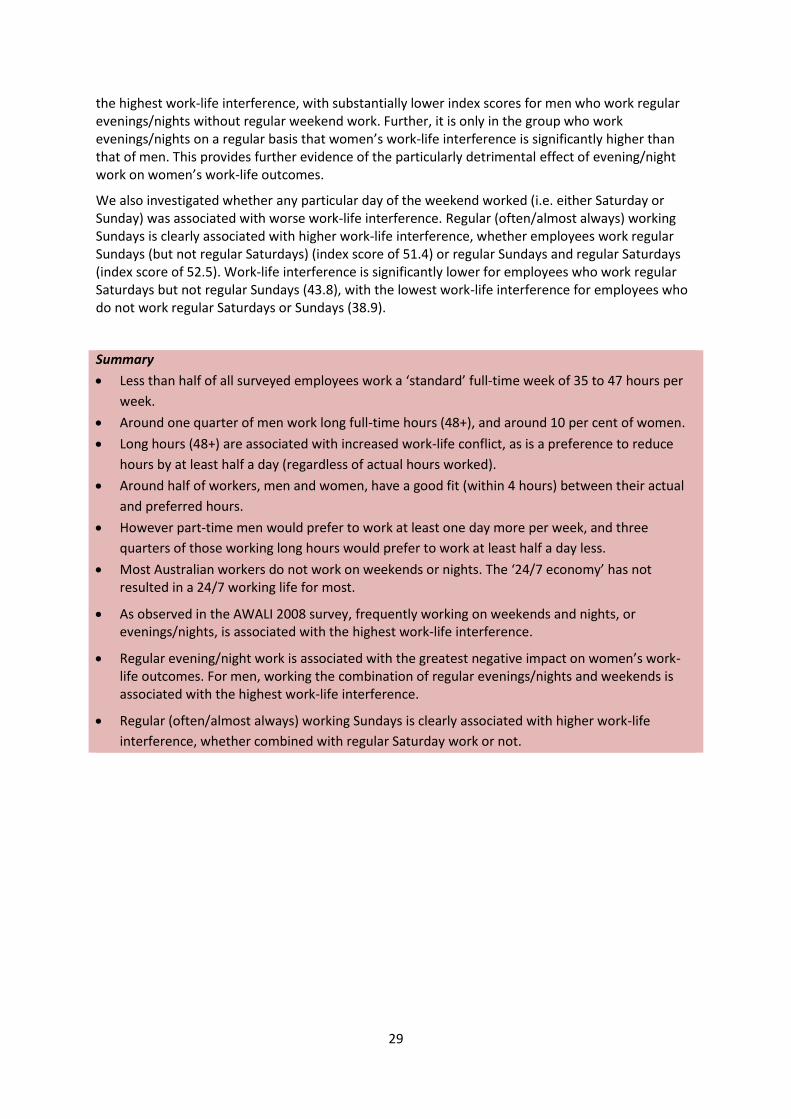
29
the highest work-life interference, with substantially lower index scores for men who work regular evenings/nights without regular weekend work. Further, it is only in the group who work evenings/nights on a regular basis that women’s work-life interference is significantly higher than that of men. This provides further evidence of the particularly detrimental effect of evening/night work on women’s work-life outcomes.
We also investigated whether any particular day of the weekend worked (i.e. either Saturday or Sunday) was associated with worse work-life interference. Regular (often/almost always) working Sundays is clearly associated with higher work-life interference, whether employees work regular Sundays (but not regular Saturdays) (index score of 51.4) or regular Sundays and regular Saturdays (index score of 52.5). Work-life interference is significantly lower for employees who work regular Saturdays but not regular Sundays (43.8), with the lowest work-life interference for employees who do not work regular Saturdays or Sundays (38.9).
Summary
Less than half of all surveyed employees work a ‘standard’ full-time week of 35 to 47 hours per
week.
Around one quarter of men work long full-time hours (48+), and around 10 per cent of women.
Long hours (48+) are associated with increased work-life conflict, as is a preference to reduce
hours by at least half a day (regardless of actual hours worked).
Around half of workers, men and women, have a good fit (within 4 hours) between their actual
and preferred hours.
However part-time men would prefer to work at least one day more per week, and three
quarters of those working long hours would prefer to work at least half a day less.
Most Australian workers do not work on weekends or nights. The ‘24/7 economy’ has not resulted in a 24/7 working life for most.
As observed in the AWALI 2008 survey, frequently working on weekends and nights, or evenings/nights, is associated with the highest work-life interference.
Regular evening/night work is associated with the greatest negative impact on women’s work-life outcomes. For men, working the combination of regular evenings/nights and weekends is associated with the highest work-life interference.
Regular (often/almost always) working Sundays is clearly associated with higher work-life
interference, whether combined with regular Saturday work or not.

30
Section 5: Work-life interference: caring responsibilities, age, income and location
In this section we examine how work-life outcomes are affected by care responsibilities, including those associated with caring for children as well as care for an older relative or a person with a chronic illness or disability. We also consider the work-life outcomes of those in the ‘sandwich generation’ who care for both children and elders (Beutell & Wittig-Berman, 2008). Finally we analyse work-life interference by age, household income and geographic location.
Caring responsibilities
Fathers, whether partnered or sole parents, report the longest hours of paid work (42.7), with no significant difference by relationship status. Men without children (aged under 18 years) work 40.0 hours per week. It is well established that women with children, on average, work shorter hours. In AWALI 2014 mothers reported working 28.7 hours per week, with no significant difference between sole and partnered mothers.
As observed in previous AWALI surveys, even though fathers undertake paid work on average around two days more per week than mothers, these workers report equivalent work-life index scores (44.8 for mothers; 44.6 for fathers).
Given that work hours differ substantially between these household groups, it is important to statistically adjust for these differences to examine the unique impact of household type on work-life interference. As Figure 14 shows, women with children have the worst work-life interference. Partnered women have the highest work-life index scores (adjusted for work hours), although the contrast with sole mothers is of borderline statistical significance.
These findings highlight the ongoing gender inequities that women experience when combining paid work with care. Whether partnered or single, when we statistically control for differences in work hours, Australian mothers experience the greatest work-life strains and pressures.
Figure 14 Work-life index scores (adjusted for work hours) by household structure and gender Note. Figure excludes self-employed persons. Number of sole fathers not sufficient to support analysis, data not provided. Index scores adjusted for work hours.
42.038.8 37.4
44.949.6
40.8 42.146.6 45.8
39.8 39.8
0
10
20
30
40
50
60
70
80
90
100
Sole Parent Couple withchildren
Couple withoutchildren
Single withoutchildren
Wor
k-lif
e in
dex
Men
Women
All
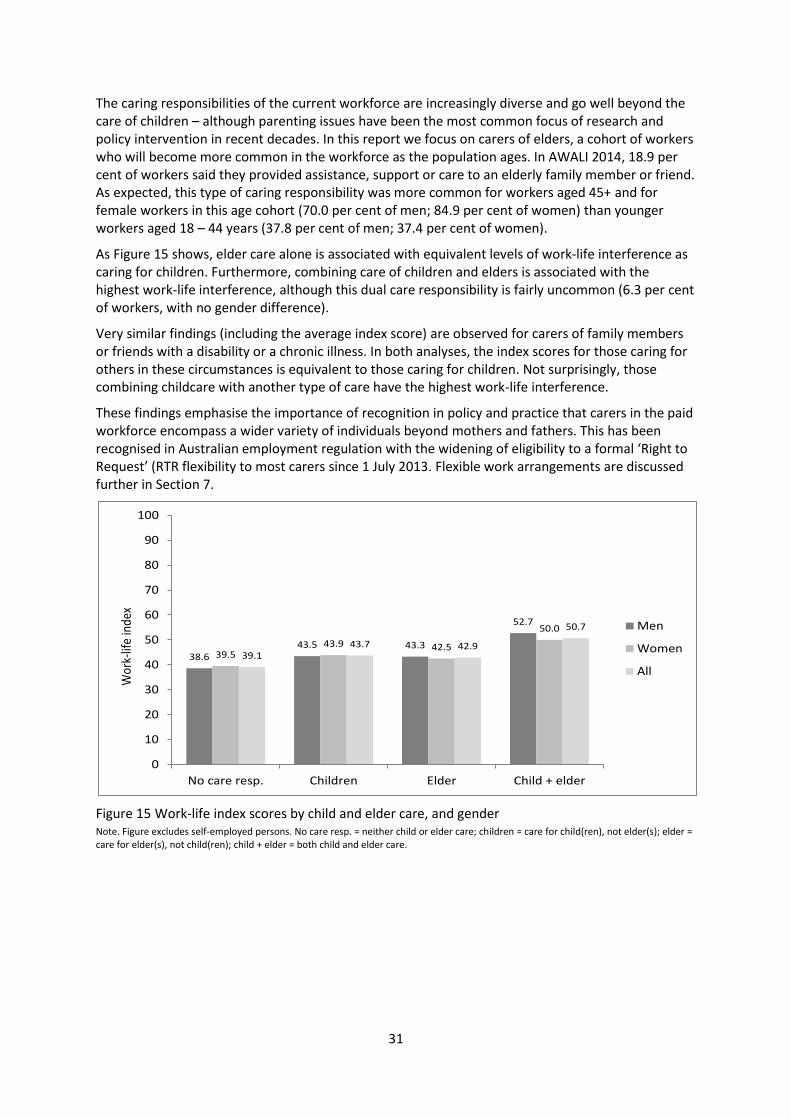
31
The caring responsibilities of the current workforce are increasingly diverse and go well beyond the care of children – although parenting issues have been the most common focus of research and policy intervention in recent decades. In this report we focus on carers of elders, a cohort of workers who will become more common in the workforce as the population ages. In AWALI 2014, 18.9 per cent of workers said they provided assistance, support or care to an elderly family member or friend. As expected, this type of caring responsibility was more common for workers aged 45+ and for female workers in this age cohort (70.0 per cent of men; 84.9 per cent of women) than younger workers aged 18 – 44 years (37.8 per cent of men; 37.4 per cent of women).
As Figure 15 shows, elder care alone is associated with equivalent levels of work-life interference as caring for children. Furthermore, combining care of children and elders is associated with the highest work-life interference, although this dual care responsibility is fairly uncommon (6.3 per cent of workers, with no gender difference).
Very similar findings (including the average index score) are observed for carers of family members or friends with a disability or a chronic illness. In both analyses, the index scores for those caring for others in these circumstances is equivalent to those caring for children. Not surprisingly, those combining childcare with another type of care have the highest work-life interference.
These findings emphasise the importance of recognition in policy and practice that carers in the paid workforce encompass a wider variety of individuals beyond mothers and fathers. This has been recognised in Australian employment regulation with the widening of eligibility to a formal ‘Right to Request’ (RTR flexibility to most carers since 1 July 2013. Flexible work arrangements are discussed further in Section 7.
Figure 15 Work-life index scores by child and elder care, and gender Note. Figure excludes self-employed persons. No care resp. = neither child or elder care; children = care for child(ren), not elder(s); elder = care for elder(s), not child(ren); child + elder = both child and elder care.
38.643.5 43.3
52.7
39.543.9 42.5
50.0
39.143.7 42.9
50.7
0
10
20
30
40
50
60
70
80
90
100
No care resp. Children Elder Child + elder
Wor
k-lif
e in
dex
Men
Women
All
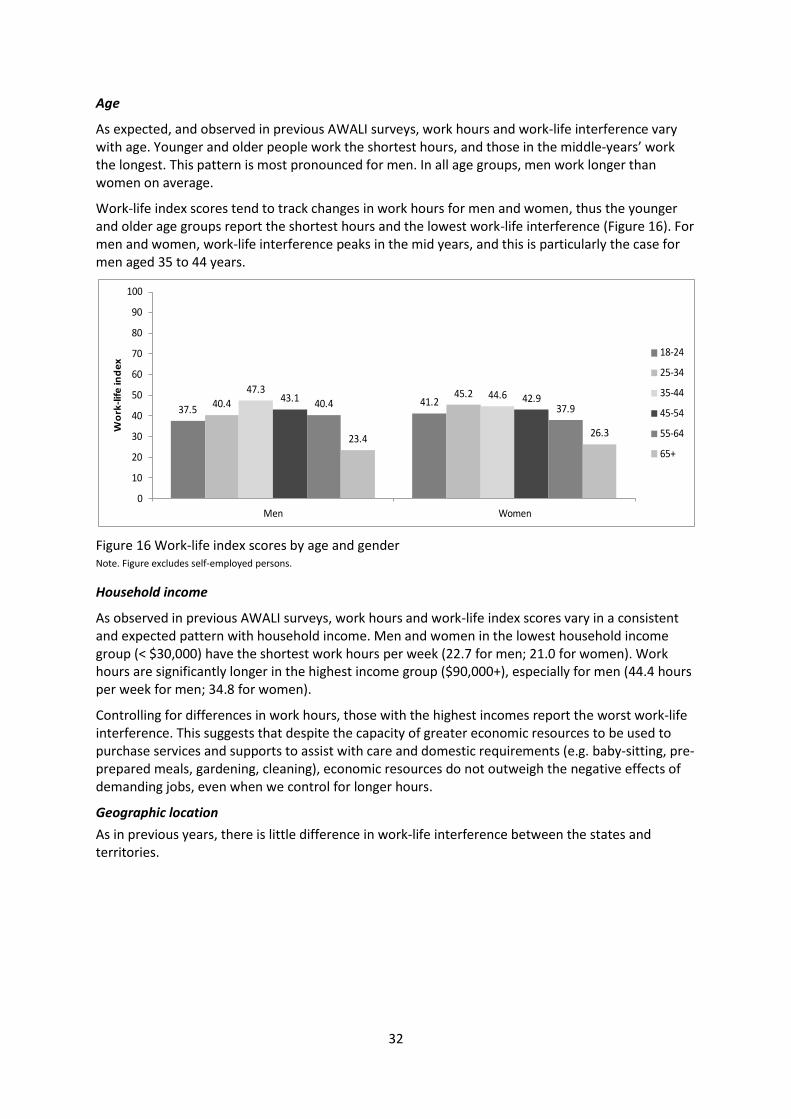
32
Age
As expected, and observed in previous AWALI surveys, work hours and work-life interference vary with age. Younger and older people work the shortest hours, and those in the middle-years’ work the longest. This pattern is most pronounced for men. In all age groups, men work longer than women on average.
Work-life index scores tend to track changes in work hours for men and women, thus the younger and older age groups report the shortest hours and the lowest work-life interference (Figure 16). For men and women, work-life interference peaks in the mid years, and this is particularly the case for men aged 35 to 44 years.
Figure 16 Work-life index scores by age and gender Note. Figure excludes self-employed persons.
Household income
As observed in previous AWALI surveys, work hours and work-life index scores vary in a consistent and expected pattern with household income. Men and women in the lowest household income group (< $30,000) have the shortest work hours per week (22.7 for men; 21.0 for women). Work hours are significantly longer in the highest income group ($90,000+), especially for men (44.4 hours per week for men; 34.8 for women).
Controlling for differences in work hours, those with the highest incomes report the worst work-life interference. This suggests that despite the capacity of greater economic resources to be used to purchase services and supports to assist with care and domestic requirements (e.g. baby-sitting, pre-prepared meals, gardening, cleaning), economic resources do not outweigh the negative effects of demanding jobs, even when we control for longer hours.
Geographic location
As in previous years, there is little difference in work-life interference between the states and territories.
37.541.240.4
45.247.3 44.643.1 42.940.4 37.9
23.426.3
0
10
20
30
40
50
60
70
80
90
100
Men Women
Wo
rk-l
ife
ind
ex
18-24
25-34
35-44
45-54
55-64
65+
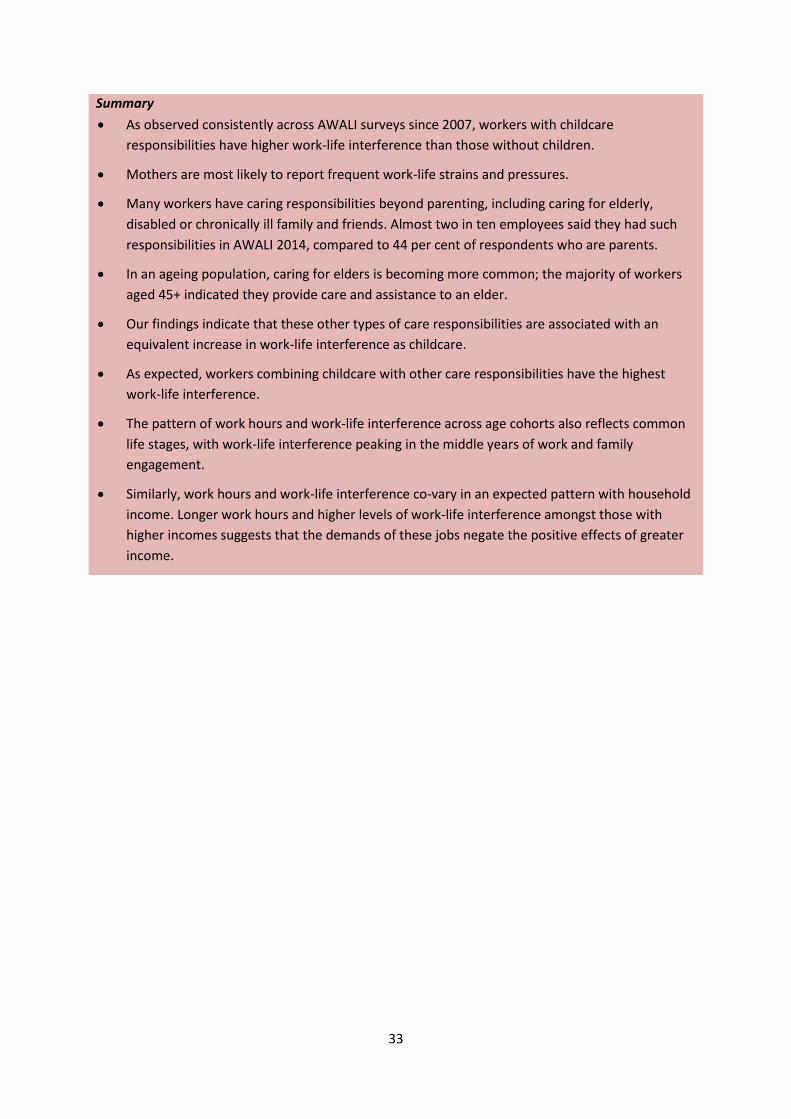
33
Summary
As observed consistently across AWALI surveys since 2007, workers with childcare
responsibilities have higher work-life interference than those without children.
Mothers are most likely to report frequent work-life strains and pressures.
Many workers have caring responsibilities beyond parenting, including caring for elderly,
disabled or chronically ill family and friends. Almost two in ten employees said they had such
responsibilities in AWALI 2014, compared to 44 per cent of respondents who are parents.
In an ageing population, caring for elders is becoming more common; the majority of workers
aged 45+ indicated they provide care and assistance to an elder.
Our findings indicate that these other types of care responsibilities are associated with an
equivalent increase in work-life interference as childcare.
As expected, workers combining childcare with other care responsibilities have the highest
work-life interference.
The pattern of work hours and work-life interference across age cohorts also reflects common
life stages, with work-life interference peaking in the middle years of work and family
engagement.
Similarly, work hours and work-life interference co-vary in an expected pattern with household
income. Longer work hours and higher levels of work-life interference amongst those with
higher incomes suggests that the demands of these jobs negate the positive effects of greater
income.
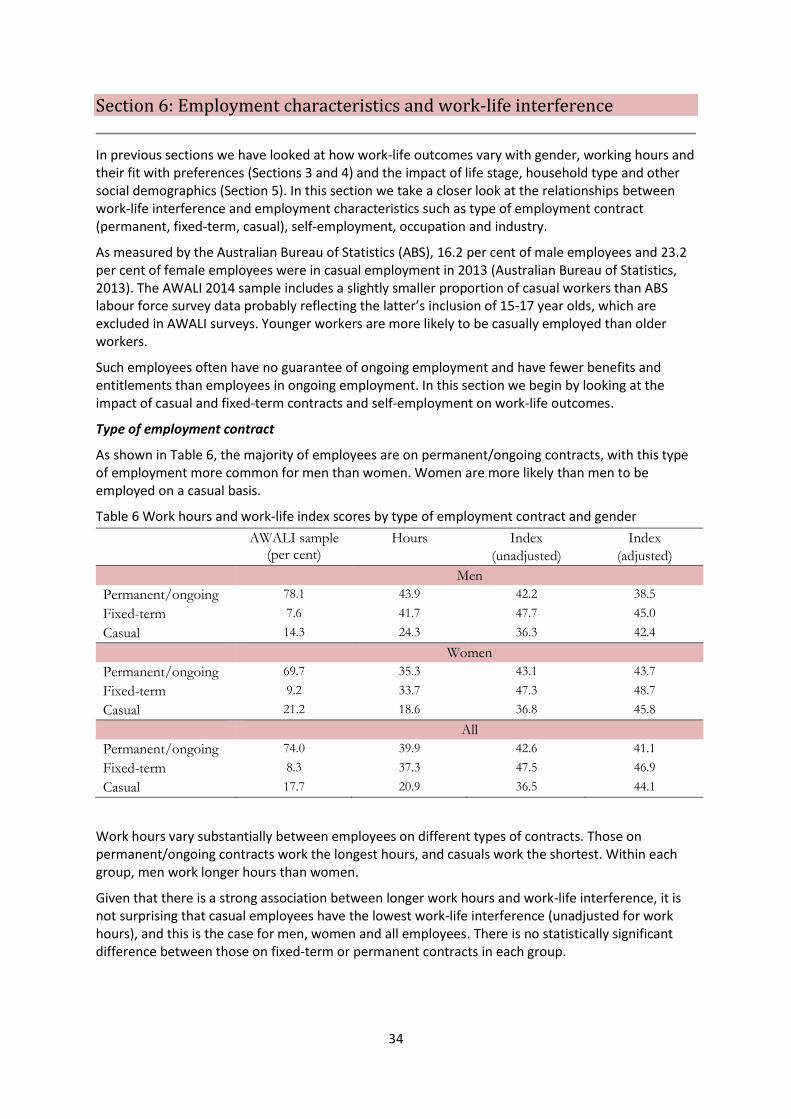
34
Section 6: Employment characteristics and work-life interference
In previous sections we have looked at how work-life outcomes vary with gender, working hours and their fit with preferences (Sections 3 and 4) and the impact of life stage, household type and other social demographics (Section 5). In this section we take a closer look at the relationships between work-life interference and employment characteristics such as type of employment contract (permanent, fixed-term, casual), self-employment, occupation and industry.
As measured by the Australian Bureau of Statistics (ABS), 16.2 per cent of male employees and 23.2 per cent of female employees were in casual employment in 2013 (Australian Bureau of Statistics, 2013). The AWALI 2014 sample includes a slightly smaller proportion of casual workers than ABS labour force survey data probably reflecting the latter’s inclusion of 15-17 year olds, which are excluded in AWALI surveys. Younger workers are more likely to be casually employed than older workers.
Such employees often have no guarantee of ongoing employment and have fewer benefits and entitlements than employees in ongoing employment. In this section we begin by looking at the impact of casual and fixed-term contracts and self-employment on work-life outcomes.
Type of employment contract
As shown in Table 6, the majority of employees are on permanent/ongoing contracts, with this type of employment more common for men than women. Women are more likely than men to be employed on a casual basis.
Table 6 Work hours and work-life index scores by type of employment contract and gender
AWALI sample (per cent)
Hours Index
(unadjusted)
Index
(adjusted)
Men
Permanent/ongoing 78.1 43.9 42.2 38.5
Fixed-term 7.6 41.7 47.7 45.0
Casual 14.3 24.3 36.3 42.4
Women
Permanent/ongoing 69.7 35.3 43.1 43.7
Fixed-term 9.2 33.7 47.3 48.7
Casual 21.2 18.6 36.8 45.8
All
Permanent/ongoing 74.0 39.9 42.6 41.1
Fixed-term 8.3 37.3 47.5 46.9
Casual 17.7 20.9 36.5 44.1
Work hours vary substantially between employees on different types of contracts. Those on permanent/ongoing contracts work the longest hours, and casuals work the shortest. Within each group, men work longer hours than women.
Given that there is a strong association between longer work hours and work-life interference, it is not surprising that casual employees have the lowest work-life interference (unadjusted for work hours), and this is the case for men, women and all employees. There is no statistically significant difference between those on fixed-term or permanent contracts in each group.

35
When we statistically adjust for differences in work hours a different pattern emerges, with the most substantive difference being the increase casual employees’ index scores. When differences in work hours are statistically controlled, casuals have equivalent work-life interference to workers on fixed-term/permanent contracts. Further, statistically adjusting for differences in work hours, men on permanent/ongoing contracts have lower work-life interference than their female counterparts, and men on fixed-term contracts.
These findings show that casual employment contracts do not offer advantages to employees with regard to their work-life relationship. Indeed, even though casuals work substantially fewer hours than workers on other contracts, nearly half of casuals would prefer to work more hours (47.1 per cent), a circumstance indicative of significant economic strain. Men in casual employment are more likely to prefer more hours (53.9 per cent) than women (42.2 per cent). A desire to work more hours is relatively rare for permanent (9.7 per cent) or fixed-term (18.8 per cent) workers, with no significant gender differences.
Self-employment
Self-employment can be a qualitatively different experience than working for an employer in ways that are likely to affect the experience of paid work including the interaction with non-work domains such as family, community and personal life. Self-employment offers the potential for greater autonomy and control over the content, hours, scheduling and location of work. On the other hand, in uncertain economic times self-employed workers may feel obliged to accept all work offered to them because of uncertainty about future work. In addition, business administration, finance and the responsibility for meeting deadlines can add further pressures for the self-employed.
Self-employment is a more common work arrangement for men than women: almost twice as many men as women are self-employed in the 2014 AWALI sample (17.3 per cent and 9.7 per cent, respectively). Here we examine how self-employment affects work-life outcomes, and whether these effects differ for men and women. Similar to findings for employees, self-employed men work longer hours than self-employed women (43.8 and 27.4 hours, respectively).
As observed in previous AWALI surveys, there are no significant differences in work-life interference between self-employed and employee workers, and this is the case for men and women (whether work hours are controlled for or not). Although self-employed men work the longest hours, they do not report significantly higher work-life interference than employed men or women, or self-employed women. This is the case whether work hours are statistically controlled or not.
Occupation
A consistent finding in past AWALI surveys is that managers have the highest work-life interference compared to most other occupational groups. In 2014 this pattern has changed somewhat (Figure 17). Managers remain amongst the group of occupations with the worst work-life interference; in 2014 this group now includes machinery operators and drivers, professionals and community and personal service workers. This change in occupational patterns of work-life outcomes reflects both a lower work-life index score for managers in 2014 than 2012, and higher scores for machinery operators and drivers and professionals.
Gender differences within occupational groups are more common in 2014 than in previous years. Adjusting for differences in work hours, women have higher work-life interference in the labouring, sales, technical and trades and professional occupations. In other occupations men and women have comparable levels of work-life interference, adjusting for differences in work hours.

36
Figure 17 Work-life index scores by occupation and gender
Note. *Estimate unreliable due to insufficient sample size. Figure excludes self-employed persons. Index scores adjusted for work hours.
Industry
As observed in previous AWALI surveys, work hours and work-life outcomes differ across industries. The longest weekly work hours are reported in traditionally male-dominated industries such as mining (52.8 hours), construction (42.8 hours), electricity\gas\water\waste services (41.9 hours) and agriculture\forestry\fishing (44.2 hours). The lowest weekly hours are reported in industries which tend to be female-dominated with a high percentage of casually employed workers, such as accommodation and food services (27.7 hours), retail trade (29.2 hours), health care and social assistance (32.8 hours), and arts and recreation services (33.5 hours).
Compared to the average index score of 42.0 for all employees, Table 7 shows work-life index scores are substantially higher for the mining, information media/telecommunications and health care/social assistance industries. Employees in the accommodation and food services and arts and recreation services also report above-average levels of work-life interference. These industries are quite diverse, representing both male-dominated and female-dominated sectors and very different types of work. One similarity that can be observed is that work in these industries often involves working at non-standard or unsocial times (e.g. weekends, evenings, public holidays). As discussed in the previous section, working at unsocial or non-standard times is associated with high work-life interference.
When these work-life index scores are adjusted for work hours the largest change is observed for the mining industry (adjusted score 34.0). This suggests that a substantial factor contributing to the negative work-life outcomes experienced by mining workers are their long hours. Given the
42.5
43.4
42.5
45.7
38.5
42.4
45.1
40.0
42.9
46.5
47.1
44.9
39.8
49.8
50.5*
44.0
42.1
40.3
37.8
46.5
37.2
35.0
39.6
36.1
0 10 20 30 40 50 60 70 80 90 100
Managers
Professionals
Technicians & trades workers
Community & personal service workers
Clerical and administrative workers
Sales workers
Machinery operators and drivers
Labourers
Men
Women
All
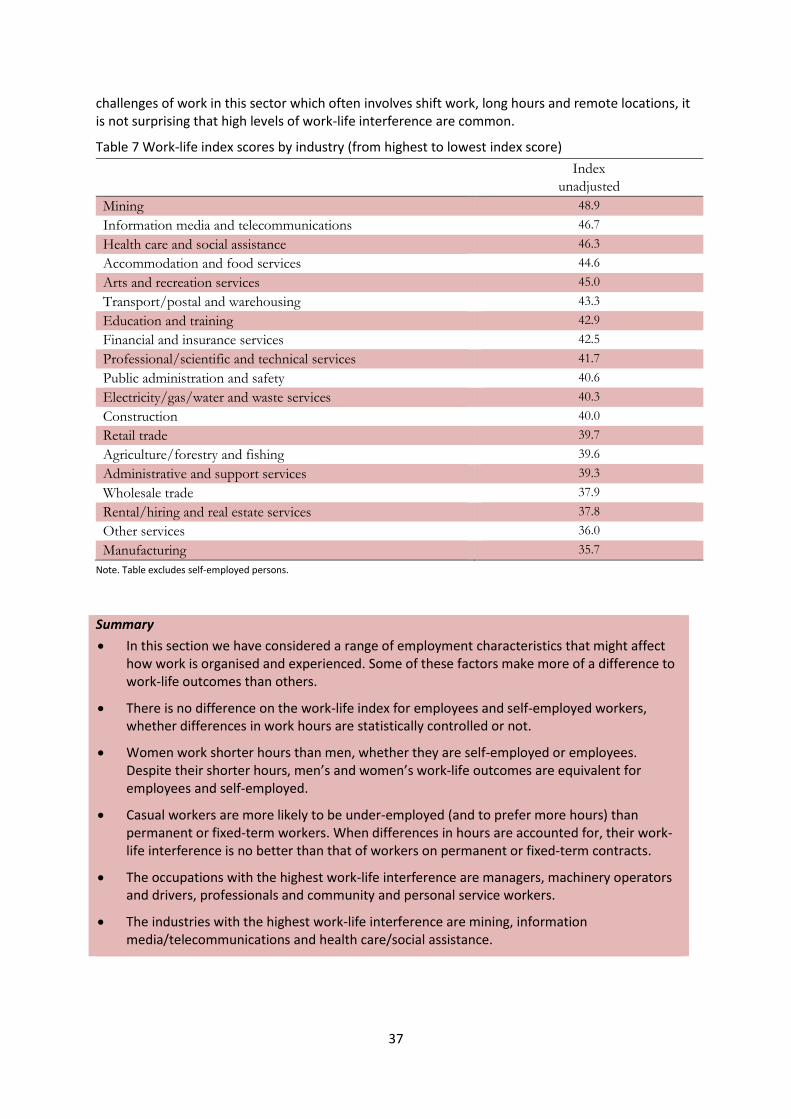
37
challenges of work in this sector which often involves shift work, long hours and remote locations, it is not surprising that high levels of work-life interference are common.
Table 7 Work-life index scores by industry (from highest to lowest index score)
Index
unadjusted
Mining 48.9
Information media and telecommunications 46.7
Health care and social assistance 46.3
Accommodation and food services 44.6
Arts and recreation services 45.0
Transport/postal and warehousing 43.3
Education and training 42.9
Financial and insurance services 42.5
Professional/scientific and technical services 41.7
Public administration and safety 40.6
Electricity/gas/water and waste services 40.3
Construction 40.0
Retail trade 39.7
Agriculture/forestry and fishing 39.6
Administrative and support services 39.3
Wholesale trade 37.9
Rental/hiring and real estate services 37.8
Other services 36.0
Manufacturing 35.7
Note. Table excludes self-employed persons.
Summary
In this section we have considered a range of employment characteristics that might affect how work is organised and experienced. Some of these factors make more of a difference to work-life outcomes than others.
There is no difference on the work-life index for employees and self-employed workers, whether differences in work hours are statistically controlled or not.
Women work shorter hours than men, whether they are self-employed or employees. Despite their shorter hours, men’s and women’s work-life outcomes are equivalent for employees and self-employed.
Casual workers are more likely to be under-employed (and to prefer more hours) than permanent or fixed-term workers. When differences in hours are accounted for, their work-life interference is no better than that of workers on permanent or fixed-term contracts.
The occupations with the highest work-life interference are managers, machinery operators and drivers, professionals and community and personal service workers.
The industries with the highest work-life interference are mining, information media/telecommunications and health care/social assistance.

38
Section 7: Requests for flexible work arrangements
The changing nature of 21st century workforces in OECD countries has seen a plethora of innovative practices and research about flexibility in workplaces (Christensen and Schneider, 2010). There is evidence that flexibility can help reduce labour turnover, and increase employee satisfaction and organisational commitment (Dorio, Bryant and Allen, 2008: 157-76). At the labour market level, flexibility facilitates the workforce participation of women and carers, thus adding to labour supply – a particularly salient fact in the face of an ageing population and rising dependency ratios. At the personal level, international reviews have shown strong evidence for the positive effects of flexible work practices on work-life balance, health and wellbeing (Nijp et al., 2012; Skinner & Chapman, 2013).
In Australia, from 1 January 2010 working parents of pre-schoolers or children under 18 with a disability, gained a Right to Request (RTR) as part of the National Employment Standards (NES) in the Fair Work Act 2009. Eligibility was broadened in mid-2013 to all carers, that is all parents or guardians of a school aged or younger child, those with a disability, those 55 years or older, those experiencing family or domestic violence, or caring for someone experiencing such violence (Fair Work Ombudsman, 2013). The Australian law creates a duty for employers to ‘reasonably consider’ such requests. Employees with more than one year of service, and casuals with long term and ‘reasonable expectation’ of continuing employment on a regular and systemic basis, are eligible to exercise this right. Requests must be in writing, give details of the change sought and reasons for the request. In turn, employers must respond in writing within 21 days, formally granting or refusing the request. They are able to refuse requests on ‘reasonable business grounds’.
The Australian RTR follows the UK ‘soft’ approach, in that it lacks an effective enforcement or appeal mechanism, providing little protection or support to the most vulnerable in the workforce such as precarious, unskilled, low paid or un-unionised workers (Pocock, Charlesworth and Chapman, 2013).
AWALI surveys in 2009, 2012 and 2014 examined patterns of requesting flexibility, the outcomes of such requests and the association with work-life interference. This series of surveys enables us to examine patterns of requesting prior to the enactment of the RTR, and following changes to the eligibility requirements that occurred between the 2012 and 2014 surveys.
Our AWALI survey of 2009 showed that many employees had already made such requests prior to the enactment of the RTR provision. Just over a fifth of respondents had made such requests – twice as many women as men – and most requests were fully granted by employers. The work-life outcomes of those who were granted their requests were – not surprisingly – better than those whose requests were refused. A sizeable group of employees did not make such requests despite being dissatisfied with their current employment arrangements.
Very similar patterns were observed in AWALI 2012, with little evidence the introduction of the RTR 2010 had made a substantive impact on the rate of requests or their outcomes. Low levels of awareness about the legal entitlement to request flexibility provided in the Fair Work Act 2009 were identified as one possible factor accounting for the lack of impact of the RTR in 2012.
As in the 2009 AWALI survey, the positive impact on work-life interference of having a flexibility request granted was clear. However, partially granted requests were of no benefit for work-life outcomes.
AWALI 2014 examines the impact of the RTR four years after its introduction, including an expansion of eligibility in mid-2013. As we discuss below, whilst there has been an increase in awareness of the RTR compared to 2012, there has been no increase in the rate of request making or the outcomes of requests.
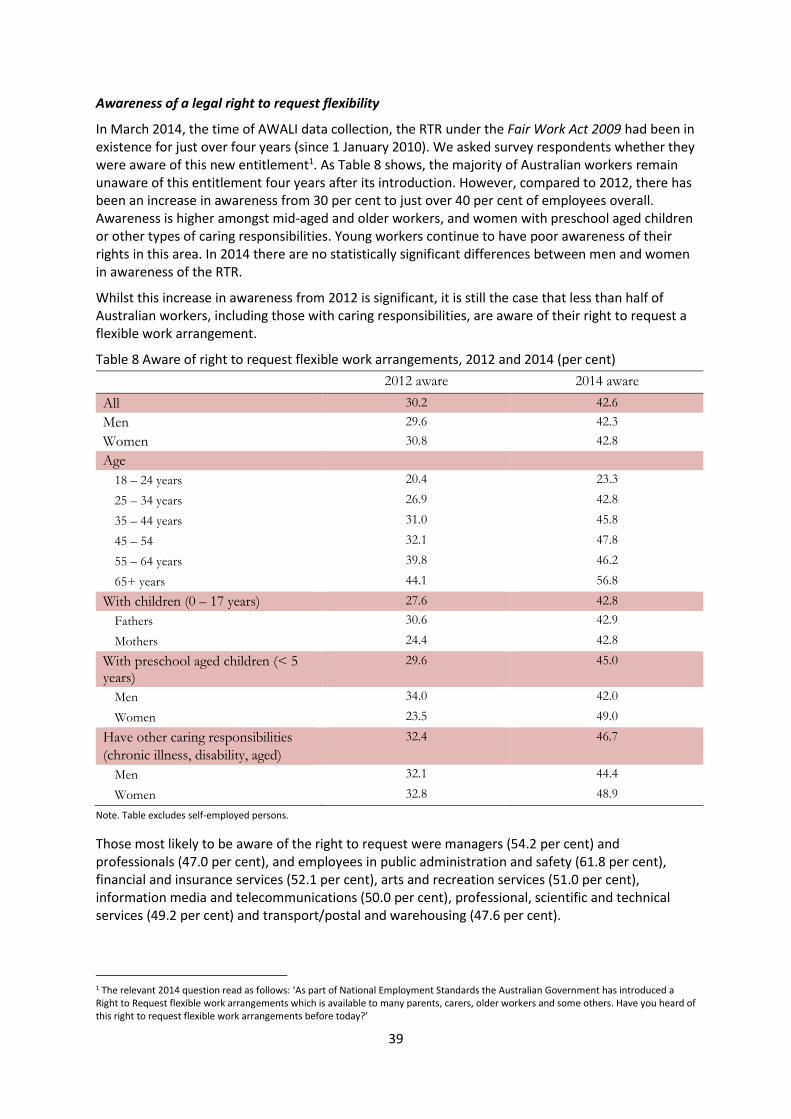
39
Awareness of a legal right to request flexibility
In March 2014, the time of AWALI data collection, the RTR under the Fair Work Act 2009 had been in existence for just over four years (since 1 January 2010). We asked survey respondents whether they were aware of this new entitlement1. As Table 8 shows, the majority of Australian workers remain unaware of this entitlement four years after its introduction. However, compared to 2012, there has been an increase in awareness from 30 per cent to just over 40 per cent of employees overall. Awareness is higher amongst mid-aged and older workers, and women with preschool aged children or other types of caring responsibilities. Young workers continue to have poor awareness of their rights in this area. In 2014 there are no statistically significant differences between men and women in awareness of the RTR.
Whilst this increase in awareness from 2012 is significant, it is still the case that less than half of Australian workers, including those with caring responsibilities, are aware of their right to request a flexible work arrangement.
Table 8 Aware of right to request flexible work arrangements, 2012 and 2014 (per cent)
2012 aware 2014 aware
All 30.2 42.6
Men 29.6 42.3
Women 30.8 42.8
Age
18 – 24 years 20.4 23.3
25 – 34 years 26.9 42.8
35 – 44 years 31.0 45.8
45 – 54 32.1 47.8
55 – 64 years 39.8 46.2
65+ years 44.1 56.8
With children (0 – 17 years) 27.6 42.8
Fathers 30.6 42.9
Mothers 24.4 42.8
With preschool aged children (< 5 years)
29.6 45.0
Men 34.0 42.0
Women 23.5 49.0
Have other caring responsibilities
(chronic illness, disability, aged)
32.4 46.7
Men 32.1 44.4
Women 32.8 48.9
Note. Table excludes self-employed persons.
Those most likely to be aware of the right to request were managers (54.2 per cent) and professionals (47.0 per cent), and employees in public administration and safety (61.8 per cent), financial and insurance services (52.1 per cent), arts and recreation services (51.0 per cent), information media and telecommunications (50.0 per cent), professional, scientific and technical services (49.2 per cent) and transport/postal and warehousing (47.6 per cent).
1 The relevant 2014 question read as follows: ‘As part of National Employment Standards the Australian Government has introduced a Right to Request flexible work arrangements which is available to many parents, carers, older workers and some others. Have you heard of this right to request flexible work arrangements before today?’
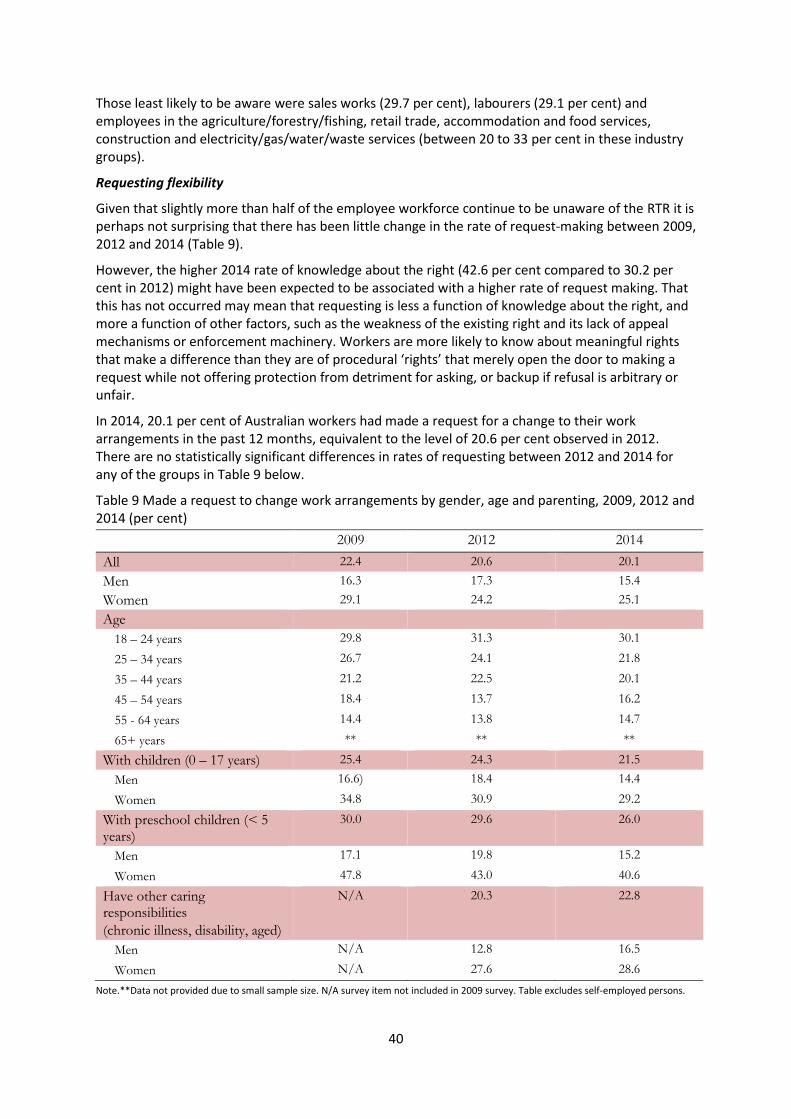
40
Those least likely to be aware were sales works (29.7 per cent), labourers (29.1 per cent) and employees in the agriculture/forestry/fishing, retail trade, accommodation and food services, construction and electricity/gas/water/waste services (between 20 to 33 per cent in these industry groups).
Requesting flexibility
Given that slightly more than half of the employee workforce continue to be unaware of the RTR it is perhaps not surprising that there has been little change in the rate of request-making between 2009, 2012 and 2014 (Table 9).
However, the higher 2014 rate of knowledge about the right (42.6 per cent compared to 30.2 per cent in 2012) might have been expected to be associated with a higher rate of request making. That this has not occurred may mean that requesting is less a function of knowledge about the right, and more a function of other factors, such as the weakness of the existing right and its lack of appeal mechanisms or enforcement machinery. Workers are more likely to know about meaningful rights that make a difference than they are of procedural ‘rights’ that merely open the door to making a request while not offering protection from detriment for asking, or backup if refusal is arbitrary or unfair.
In 2014, 20.1 per cent of Australian workers had made a request for a change to their work arrangements in the past 12 months, equivalent to the level of 20.6 per cent observed in 2012. There are no statistically significant differences in rates of requesting between 2012 and 2014 for any of the groups in Table 9 below.
Table 9 Made a request to change work arrangements by gender, age and parenting, 2009, 2012 and 2014 (per cent)
2009 2012 2014
All 22.4 20.6 20.1
Men 16.3 17.3 15.4
Women 29.1 24.2 25.1
Age
18 – 24 years 29.8 31.3 30.1
25 – 34 years 26.7 24.1 21.8
35 – 44 years 21.2 22.5 20.1
45 – 54 years 18.4 13.7 16.2
55 - 64 years 14.4 13.8 14.7
65+ years ** ** **
With children (0 – 17 years) 25.4 24.3 21.5
Men 16.6) 18.4 14.4
Women 34.8 30.9 29.2
With preschool children (< 5 years)
30.0 29.6 26.0
Men 17.1 19.8 15.2
Women 47.8 43.0 40.6
Have other caring responsibilities
(chronic illness, disability, aged)
N/A 20.3 22.8
Men N/A 12.8 16.5
Women N/A 27.6 28.6
Note.**Data not provided due to small sample size. N/A survey item not included in 2009 survey. Table excludes self-employed persons.
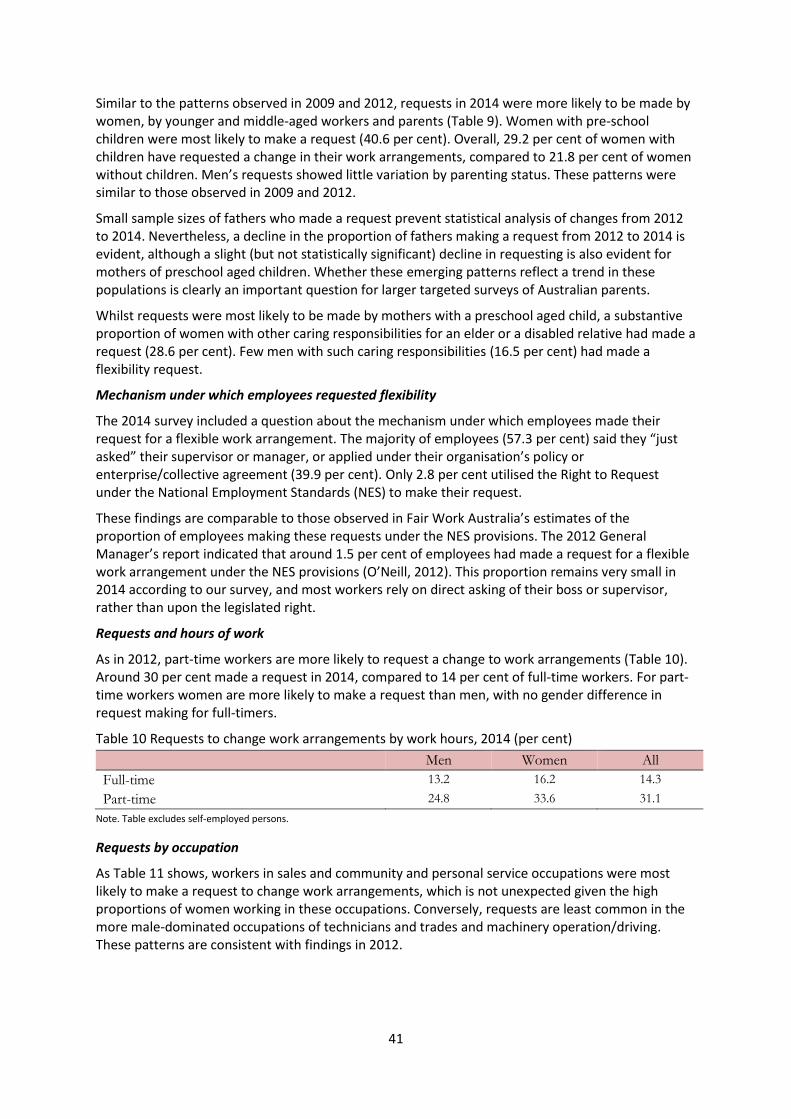
41
Similar to the patterns observed in 2009 and 2012, requests in 2014 were more likely to be made by women, by younger and middle-aged workers and parents (Table 9). Women with pre-school children were most likely to make a request (40.6 per cent). Overall, 29.2 per cent of women with children have requested a change in their work arrangements, compared to 21.8 per cent of women without children. Men’s requests showed little variation by parenting status. These patterns were similar to those observed in 2009 and 2012.
Small sample sizes of fathers who made a request prevent statistical analysis of changes from 2012 to 2014. Nevertheless, a decline in the proportion of fathers making a request from 2012 to 2014 is evident, although a slight (but not statistically significant) decline in requesting is also evident for mothers of preschool aged children. Whether these emerging patterns reflect a trend in these populations is clearly an important question for larger targeted surveys of Australian parents.
Whilst requests were most likely to be made by mothers with a preschool aged child, a substantive proportion of women with other caring responsibilities for an elder or a disabled relative had made a request (28.6 per cent). Few men with such caring responsibilities (16.5 per cent) had made a flexibility request.
Mechanism under which employees requested flexibility
The 2014 survey included a question about the mechanism under which employees made their request for a flexible work arrangement. The majority of employees (57.3 per cent) said they “just asked” their supervisor or manager, or applied under their organisation’s policy or enterprise/collective agreement (39.9 per cent). Only 2.8 per cent utilised the Right to Request under the National Employment Standards (NES) to make their request.
These findings are comparable to those observed in Fair Work Australia’s estimates of the proportion of employees making these requests under the NES provisions. The 2012 General Manager’s report indicated that around 1.5 per cent of employees had made a request for a flexible work arrangement under the NES provisions (O’Neill, 2012). This proportion remains very small in 2014 according to our survey, and most workers rely on direct asking of their boss or supervisor, rather than upon the legislated right.
Requests and hours of work
As in 2012, part-time workers are more likely to request a change to work arrangements (Table 10). Around 30 per cent made a request in 2014, compared to 14 per cent of full-time workers. For part-time workers women are more likely to make a request than men, with no gender difference in request making for full-timers.
Table 10 Requests to change work arrangements by work hours, 2014 (per cent)
Men Women All
Full-time 13.2 16.2 14.3
Part-time 24.8 33.6 31.1
Note. Table excludes self-employed persons.
Requests by occupation
As Table 11 shows, workers in sales and community and personal service occupations were most likely to make a request to change work arrangements, which is not unexpected given the high proportions of women working in these occupations. Conversely, requests are least common in the more male-dominated occupations of technicians and trades and machinery operation/driving. These patterns are consistent with findings in 2012.

42
Table 11 Requests to change work arrangements by occupation, 2014 (per cent)
All
Managers 17.3
Professionals 19.4
Technicians and trades workers 13.4
Community and personal service workers 24.9
Clerical and administrative workers 20.8
Sales workers 30.7
Machinery operators and drivers 14.3*
Labourers 17.0
Note. *Estimate unreliable due to insufficient sample size. Table excludes self-employed persons.
Requests by industry
As in 2012, rates of request-making in 2014 are highest in the retail industry (28.8 per cent), accommodation and food services (34.6 per cent). These industries are more female-dominated with more part-time jobs than other industries in which rates of request-making are lower.
Outcome of request: granted or declined
The majority of requests for flexibility (64.3 per cent) were fully granted (Figure 18), with a further 16.9 per cent of requests partly granted. Only a small proportion of requests (10.8 per cent) were declined. This pattern is comparable to 2009 and 2012.
There is some evidence of change across the three surveys with regard to gender differences. In 2012 men were more likely to have their requests declined. In 2014 this gender difference is no longer evident, although the sample size for men who had a request declined was insufficient to support a reliable estimate. This apparent equalising of men’s and women’s request outcomes from 2012 to 2014 appears to be due to an increase in the acceptance rates of men’s requests rather than a decline in the proportion of women’s requests that are granted. It is important to acknowledge that these observations reflect trends in the data; there were no statistically significant differences between the data collection years for the whole sample, or for men and women considered separately.
The likelihood of a request being granted also differs according to length of work hours, with part-timers more likely to have their requests fully granted (70.6 per cent) than full-time workers (57.1 per cent). Whilst this trend is evident for all groups, the contrast is only statistically significant for all employees and for women. Similar trends were evident in the AWALI 2009 and 2012 surveys.

43
Figure 18 Request outcomes by gender, 2009, 2012 and 2014 (per cent) Note. *Estimate unreliable due to insufficient sample size. Proportion of respondents who made a request to change work arrangements. Figure excludes self-employed persons.
Reasons for not making a request
In 2014 the majority of respondents – 79.9 per cent – have not made a request for flexibility. Of these non-requesters, the majority (60.8 per cent) are content with their current work arrangements, with no difference between men and women (Table 12). This is lower than in 2012 when 70.5 per cent of employees were content with current arrangements, and equivalent to 2009 when 58.5 per cent were content.
A further 15.0 per cent report that flexibility is not possible or available in their job (i.e. the employer would not allow flexibility or that flexibility is not possible/suitable in the job). The remaining portion of non-requesters (24.1 per cent) gave various reasons for not requesting. The sample sizes for each of these groups were too small to enable reliable reporting.
Table 12 Reasons request not made, by gender, 2009, 2012 and 2014 (per cent of non-requesters)
Content with current arrangements
Flexibility not possiblea
2014 60.8 15.1
Men 61.1 15.8
Women 60.5 14.4
2012 70.5 15.0
Men 70.1 14.8
Women 71.0 15.2
2009 58.5 12.1
Men 56.1 12.7
Women 61.8 11.4
Note. Multiple responses possible on this question (i.e. respondents could choose more than one reason). a‘Flexibility not possible’ collated from response options ‘not convinced employer would allow it’, ‘job does not allow it’ and ‘flexibility not possible or available’. Table excludes self-employed persons.
68.8
72.9
62.3
61.9
65.6
57.1
64.3
65.4
62.6
14.4
12.1
18.1
19.1
17.9
20.5
16.9
16.1
18.1
9.8
8.4
12.1
13.2
9.8
17.4
10.8
12.1
8.8*
6.9
6.5
7.5*
5.9
6.7
4.9*
8.0
6.4*
10.4*
0 10 20 30 40 50 60 70 80 90 100
All
Women
Men
All
Women
Men
All
Women
Men2
00
92
01
22
01
4
%
Fully granted
Partly granted
Declined
Waiting on decision
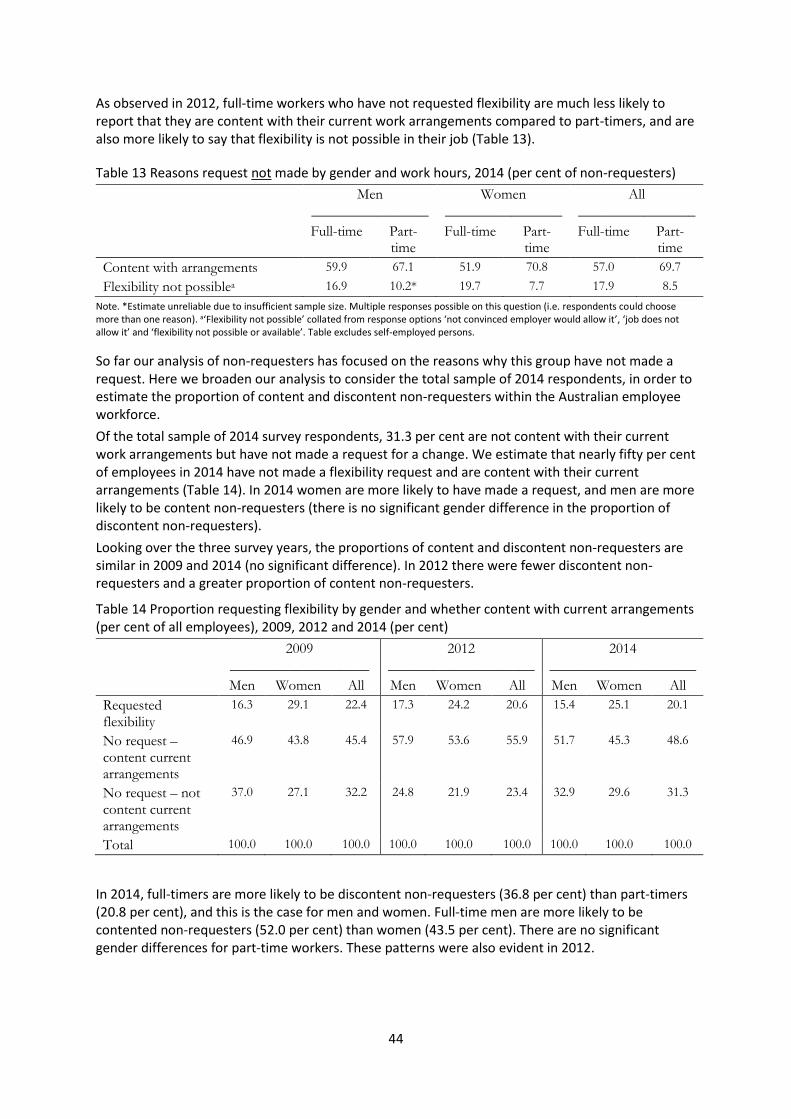
44
As observed in 2012, full-time workers who have not requested flexibility are much less likely to report that they are content with their current work arrangements compared to part-timers, and are also more likely to say that flexibility is not possible in their job (Table 13).
Table 13 Reasons request not made by gender and work hours, 2014 (per cent of non-requesters)
Men
________________
Women
________________
All
________________
Full-time Part-time
Full-time Part-time
Full-time Part-time
Content with arrangements 59.9 67.1 51.9 70.8 57.0 69.7
Flexibility not possiblea 16.9 10.2* 19.7 7.7 17.9 8.5
Note. *Estimate unreliable due to insufficient sample size. Multiple responses possible on this question (i.e. respondents could choose more than one reason). a‘Flexibility not possible’ collated from response options ‘not convinced employer would allow it’, ‘job does not allow it’ and ‘flexibility not possible or available’. Table excludes self-employed persons.
So far our analysis of non-requesters has focused on the reasons why this group have not made a request. Here we broaden our analysis to consider the total sample of 2014 respondents, in order to estimate the proportion of content and discontent non-requesters within the Australian employee workforce.
Of the total sample of 2014 survey respondents, 31.3 per cent are not content with their current work arrangements but have not made a request for a change. We estimate that nearly fifty per cent of employees in 2014 have not made a flexibility request and are content with their current arrangements (Table 14). In 2014 women are more likely to have made a request, and men are more likely to be content non-requesters (there is no significant gender difference in the proportion of discontent non-requesters).
Looking over the three survey years, the proportions of content and discontent non-requesters are similar in 2009 and 2014 (no significant difference). In 2012 there were fewer discontent non-requesters and a greater proportion of content non-requesters.
Table 14 Proportion requesting flexibility by gender and whether content with current arrangements (per cent of all employees), 2009, 2012 and 2014 (per cent)
2009
___________________
2012
____________________
2014
____________________
Men Women All Men Women All Men Women All
Requested flexibility
16.3 29.1 22.4 17.3 24.2 20.6 15.4 25.1 20.1
No request – content current arrangements
46.9 43.8 45.4 57.9 53.6 55.9 51.7 45.3 48.6
No request – not content current arrangements
37.0 27.1 32.2 24.8 21.9 23.4 32.9 29.6 31.3
Total 100.0 100.0 100.0 100.0 100.0 100.0 100.0 100.0 100.0
In 2014, full-timers are more likely to be discontent non-requesters (36.8 per cent) than part-timers (20.8 per cent), and this is the case for men and women. Full-time men are more likely to be contented non-requesters (52.0 per cent) than women (43.5 per cent). There are no significant gender differences for part-time workers. These patterns were also evident in 2012.

45
Outcome of requests and work-life interference
As Figure 19 shows, having a request fully granted is associated with the best work-life outcomes. There is no statistically significant difference in work-life index scores between those who had their request partially granted or declined. This pattern has consistently been observed across AWALI surveys. In 2014 there is little difference between men’s and women’s work-life index scores associated with each request outcome, whether differences in work hours are statistically controlled or not. This is different from 2012, where it was observed that women’s work-life interference was higher than men’s when requests were partially granted.
Figure 19 Work-life index scores by request outcome, 2014 Note. Proportion of respondents who made a request to change work arrangements. Figure excludes self-employed persons.
Summary
Access to flexible work arrangements supports employee health, wellbeing and work-life
outcomes, as well as positively affecting workforce participation.
AWALI 2014 examines Australian employees’ request making four years after the
introduction of a formal Right to Request (RTR) through the Fair Work Act 2009, and almost
one year after the access to the right to request was widened to all carers.
More than four years after its introduction, workers’ awareness of the RTR has increased
from 30.2 per cent to 42.6 per cent of respondents. However, the majority of employees
are still not aware of the RTR.
The rate of request making has not tracked upward with this increase in knowledge about the right.
In fact, the rate of request-making has not increased over the three AWALI surveys of 2009, 2012 and 2014. This must raise some doubts about the effect of this right in assisting those who are not content with current work arrangements but do not make requests.
Those most likely to make a request are mothers of pre-schoolers (40.6 per cent). Only 15.2
per cent of fathers of pre-schoolers made a request.
Other groups most likely to make a request are:
o Women with children (aged 0 – 17 years)
o Women with other caring responsibilities (for an older person, or a person with a
disability or chronic illness)
41.6
58.3 56.4
40.8
60.3 53.2
41.1
59.5 57.1
0
10
20
30
40
50
60
70
80
90
100
Fully granted Partly granted Declined
Wo
rk-l
ife
ind
ex
Men
Women
All
46
o Part-time workers
o Sales and community and personal service workers.
Most employees (57.3 percent “just asked” their manager/supervisor) or applied under
their organisation’s policy or enterprise/collective agreement (39.9 per cent). Only 2.8 per
cent relied on the RTR in making their request.
The majority of requests in 2014 (64.3 per cent) were granted, which is comparable to
AWALI 2009 and 2012 outcomes.
The majority of workers (60.8 per cent) who have not made a request said they are content
with their current work arrangements;
However, almost a third of respondents were ‘discontent non-requesters’ that is, they were
not content with current arrangements but did not make a request for flexibility. The
existing RTR does not appear to be providing them with much help in finding flexibility.
15 per cent of respondents said flexibility was not possible or available in their jobs.
Having a flexibility request granted is associated with lower work-life interference for men
and women. A partially granted request is associated with the same level of work-life
interference as a refusal.
These findings create a case for a firmer RTR, with enforcement and appeal back-up, to
assist workers to achieve more flexible working conditions, including those in workplaces
where culture, practices and management norms are not friendly to flexibility, and amongst
workers who lack workplace power because of their insecurity, low skill, and weak
workplace footing.

47
Section 8: Flourishing
The focus of much of the AWALI research has been on identifying the factors that create difficulties or challenges to workers’ capacity to manage work and non-work responsibilities. The ‘struggle to juggle’ work and care has been a major focus of AWALI research, including analyses of work-life interference, preferences to reduce hours and access to important resources and supports such as flexible work arrangements.
In AWALI 2014 we widened our focus to consider positive mental health. The 2014 survey included a set of question on flourishing, which refers to positive mental health encompassing characteristics such as optimism, resilience and engagement (Huppert & So, 2013).
The notion of thriving or flourishing has received increasing interest not only in psychological research, but also in the fields of childhood/youth education, businesses and organisations and at the broad level of national wellbeing (Seligman, 2011). For example, the OECD has constructed a ‘Better Life Index’ which evaluates quality of life at a national level across various indicators including income/wealth, environmental quality, housing, health, subjective wellbeing and work-life balance. It is noteworthy that compared to other OECD countries and major economies, Australia ranks within, or very close to, the top 20 per cent across 10 of the 11 dimensions. The exception is work-life balance, in which Australia ranks in the lowest 20 per cent of performers (OECD, 2014). Compared to the OECD average, Australians spend less time on personal care and leisure, and long hours (50+) are more common (OECD, 2014).
In AWALI 2014 we included a set of items measuring flourishing that were sourced from a set of established measures that have been included in the European Social Survey (ESS). We created an index of flourishing based on the method of Huppert and So (2013). Eight single-item measures were combined to create a categorical (flourishing/not flourishing) measure. The eight items assessed competence (sense of accomplishment), emotional stability (feelings of calm and peacefulness), meaning (perceive one’s life to be valuable and worthwhile), optimism (optimistic about one’s future), positive emotion (happiness), resilience (capacity to recover when things go wrong in life), self-esteem (feel positive about self) and vitality (feelings of energy) (see endnote for further detail on scale construction).
In Australia 40 per cent of employees are flourishing, with little difference between men and women (Table 15). Compared to the average in select EU countries surveyed in the 2012 European Social Survey (ESS), Australian male employees have comparable levels of flourishing, whereas a greater proportion of Australian female employees are flourishing compared to their EU counterparts. Similar patterns can be observed with regard to UK estimates from the ESS.
Table 15 Flourishing – AWALI 2014 and European Social Survey 2012, per cent flourishing (employees)
AWALI 2014 ESS 2012
EU countries*
ESS 2012
UK
Men 41.3 40.9 38.2
Women 40.9 33.2 33.7
All 41.1 37.0 35.6
Note. Self-employed excluded. ESS survey does not collect data from the EU countries of Greece, Austria, Croatia, Latvia, Luxembourg, Malta and Romania.
Work-life interference and flourishing
As would be expected with two measures that are both broadly related to wellbeing, there was a clear association between flourishing and work-life interference. Employees who were flourishing had substantially lower work-life interference (index score = 34.0) than those who were not
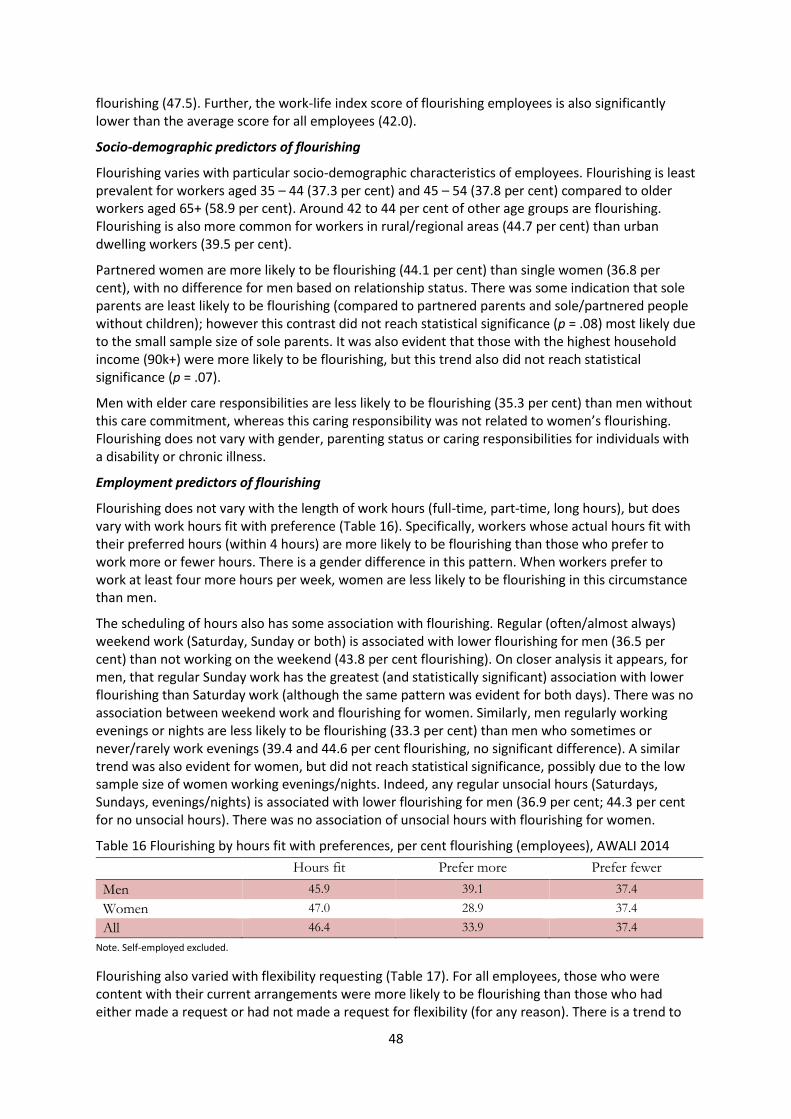
48
flourishing (47.5). Further, the work-life index score of flourishing employees is also significantly lower than the average score for all employees (42.0).
Socio-demographic predictors of flourishing
Flourishing varies with particular socio-demographic characteristics of employees. Flourishing is least prevalent for workers aged 35 – 44 (37.3 per cent) and 45 – 54 (37.8 per cent) compared to older workers aged 65+ (58.9 per cent). Around 42 to 44 per cent of other age groups are flourishing. Flourishing is also more common for workers in rural/regional areas (44.7 per cent) than urban dwelling workers (39.5 per cent).
Partnered women are more likely to be flourishing (44.1 per cent) than single women (36.8 per cent), with no difference for men based on relationship status. There was some indication that sole parents are least likely to be flourishing (compared to partnered parents and sole/partnered people without children); however this contrast did not reach statistical significance (p = .08) most likely due to the small sample size of sole parents. It was also evident that those with the highest household income (90k+) were more likely to be flourishing, but this trend also did not reach statistical significance (p = .07).
Men with elder care responsibilities are less likely to be flourishing (35.3 per cent) than men without this care commitment, whereas this caring responsibility was not related to women’s flourishing. Flourishing does not vary with gender, parenting status or caring responsibilities for individuals with a disability or chronic illness.
Employment predictors of flourishing
Flourishing does not vary with the length of work hours (full-time, part-time, long hours), but does vary with work hours fit with preference (Table 16). Specifically, workers whose actual hours fit with their preferred hours (within 4 hours) are more likely to be flourishing than those who prefer to work more or fewer hours. There is a gender difference in this pattern. When workers prefer to work at least four more hours per week, women are less likely to be flourishing in this circumstance than men.
The scheduling of hours also has some association with flourishing. Regular (often/almost always) weekend work (Saturday, Sunday or both) is associated with lower flourishing for men (36.5 per cent) than not working on the weekend (43.8 per cent flourishing). On closer analysis it appears, for men, that regular Sunday work has the greatest (and statistically significant) association with lower flourishing than Saturday work (although the same pattern was evident for both days). There was no association between weekend work and flourishing for women. Similarly, men regularly working evenings or nights are less likely to be flourishing (33.3 per cent) than men who sometimes or never/rarely work evenings (39.4 and 44.6 per cent flourishing, no significant difference). A similar trend was also evident for women, but did not reach statistical significance, possibly due to the low sample size of women working evenings/nights. Indeed, any regular unsocial hours (Saturdays, Sundays, evenings/nights) is associated with lower flourishing for men (36.9 per cent; 44.3 per cent for no unsocial hours). There was no association of unsocial hours with flourishing for women.
Table 16 Flourishing by hours fit with preferences, per cent flourishing (employees), AWALI 2014
Hours fit Prefer more Prefer fewer
Men 45.9 39.1 37.4
Women 47.0 28.9 37.4
All 46.4 33.9 37.4
Note. Self-employed excluded.
Flourishing also varied with flexibility requesting (Table 17). For all employees, those who were content with their current arrangements were more likely to be flourishing than those who had either made a request or had not made a request for flexibility (for any reason). There is a trend to
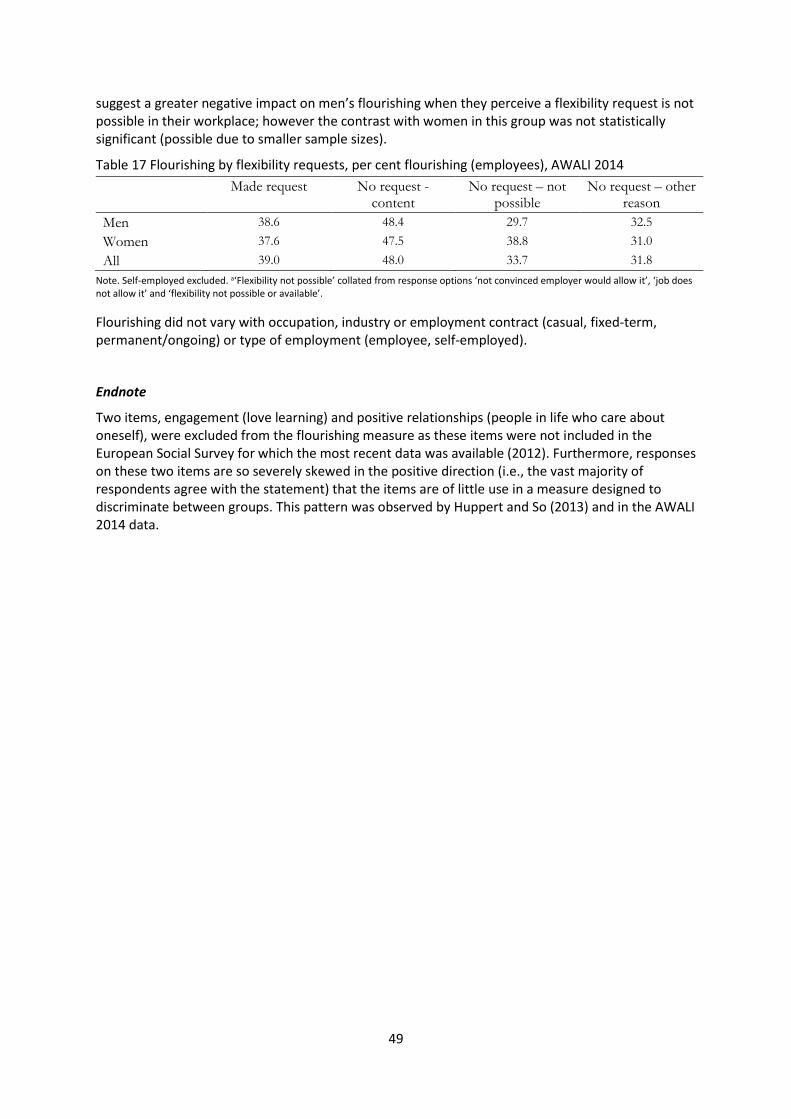
49
suggest a greater negative impact on men’s flourishing when they perceive a flexibility request is not possible in their workplace; however the contrast with women in this group was not statistically significant (possible due to smaller sample sizes).
Table 17 Flourishing by flexibility requests, per cent flourishing (employees), AWALI 2014
Made request No request - content
No request – not possible
No request – other reason
Men 38.6 48.4 29.7 32.5
Women 37.6 47.5 38.8 31.0
All 39.0 48.0 33.7 31.8
Note. Self-employed excluded. a‘Flexibility not possible’ collated from response options ‘not convinced employer would allow it’, ‘job does not allow it’ and ‘flexibility not possible or available’.
Flourishing did not vary with occupation, industry or employment contract (casual, fixed-term, permanent/ongoing) or type of employment (employee, self-employed).
Endnote
Two items, engagement (love learning) and positive relationships (people in life who care about oneself), were excluded from the flourishing measure as these items were not included in the European Social Survey for which the most recent data was available (2012). Furthermore, responses on these two items are so severely skewed in the positive direction (i.e., the vast majority of respondents agree with the statement) that the items are of little use in a measure designed to discriminate between groups. This pattern was observed by Huppert and So (2013) and in the AWALI 2014 data.

50
References
Access Economics (2006) ‘Meeting Australia's Ageing Challenge: The Importance of Women's
Workforce Participation’, Report for the House of Representatives Standing Committee on Family and Human Services, Access Economics, Canberra.
Australian Bureau of Statistics (2009). Australian Social Trends, September 2009 (Cat. No. 4102.0). Canberra: ABS.
Australian Bureau of Statistics (2013). Forms of Employment, November (Cat. No. 6539.0), ABS, Canberra.
Australian Bureau of Statistics (2014). Labour Force, March (Cat. No. 6202.0), ABS, Canberra.
Australian Government (2010) ‘The 2010 Intergenerational Report’, The Treasury, Canberra.
Barnett, R.C. (2006). Relationship of the number and distribution of work hours to health and quality-of-life (QOL) outcomes. Research in Occupational Stress and Wellbeing, 5, 99-138.
Beutell, N. & Wittig-Berman, U. (2008) Work-family conflict and work-family synergy for generation X, baby boomers, and matures: Generational differences, predictors, and satisfaction outcomes. Journal of Managerial Psychology 23(5), 507 - 523.
Callan, S. (2007) Implications of family-friendly policies for organizational culture: Findings from two case studies. Work Employment Society, 21(4), 673-691.
Carnell, K. (2014). Quoted in P McGrath’s article ‘Business groups step up campaign to cut Sunday penalties’, ABC News 3 June 2014. http://www.abc.net.au/news/2014-06-03/business-groups-step-up-campaign-to-cut-sunday-penalties/5497696.
Caruso, C.C. (2006). Possible broad impacts of long work hours. Industrial Health, 44(4), 531-536.
Christensen, K. & Schneider B. (eds) (2010) Workplace Flexibility: Realigning 20th Century Jobs for a 21st Century Workforce. Ithaca, NY: Cornell University Press.
Craig, L. (2007) Contemporary Motherhood: The Impact of Children on Adult Time. Ashgate Publishing, Aldershot, Hampshire.
Craig, L. & Mullan, K. (2010) Parenthood, gender and work-family time in the United States, Australia, Italy, France, and Denmark. Journal of Marriage and Family, 72(5), 1344-1361.
Dorio, J.M., Bryant R..H. & Allen, T.D. (2008) Work-related outcomes of the work-family interface: Why organizations should care. In K. Korabik, D. Lero & D. Whitehead. (eds) Handbook of work-family integration. Amsterdam: Academic Press, pp. 157-76.
Fair Work Ombudsman (2013) ‘Flexible working arrangements’. Canberra: Australian Government.
Fox, E., Pascall, G. & Warren, T. (2009) Work-family policies, participation, and practices: fathers and childcare in Europe. Community, Work & Family, 12(3), 313-326.
Hegewisch, A. & Gornick, J.C. (2011) The impact of work-family policies on women's employment: a review of research from OECD countries. Community, Work and Family, 14(2), 119–138.
Hook, J.L. (2006) Care in context: Men's unpaid work in 20 countries, 1965-2003. American Sociological Review, 71(4), 639-660.
Huppert, F.A. & So, T.T.C. (2013). Flourishing across Europe: Application of a new conceptual framework for defining wellbeing. Social Indicators Research, 110(3), 837-861.
Mesmer-Magnus, J.R. & Viswesvaran, C. (2006) How family-friendly work environments affect work/family conflict: A meta-analytic examination. Journal of Labour Research, 26(4), 555-574.
Moen, P. (2011) From 'work-family' to the 'gendered life course' and 'fit': Five challenges to the field. Community, Work and Family 14(1), 81 - 96.
Nijp, H.H.M., Beckers, D.G.J.P., Geurts, S.E.P., Tucker, P.P. and Kompier, M.J.P. (2012) Systematic review on the association between employee worktime control and work-non-work balance, health and wellbeing, and job-related outcomes. Scandinavian Journal of Work, Environment & Health, 38(4), 299-313.
51
OECD (2014). ‘How’s life in Australia?’ Reports downloaded from www.oecd.org/general/Better-life-index-2014-country-reports.pdf and http://www.oecdbetterlifeindex.org/topics/work-life-balance/, 1 July 2014.
O’Neill, B. (2012). ‘General Manager’s report into the operation of the provisions of the National Employment Standards relating to requests for flexible working arrangements and extensions of unpaid parental leave’. Commonwealth of Australia: Canberra.
Page, A., Baird, M., Heron, A. & Whelan, J. (2009) ‘Taking Care: Mature Age Workers With Elder Care Responsibilites. A Briefing Paper’ Women and Work Research Group, University of Sydney, Sydney
Pocock, B., Charlesworth, S. & Chapman, J. (2013) Work-family and work-life pressures in Australia: Advancing gender equality in ‘good times’? International Journal of Sociology and Social Policy 33(9/10), 594-612.
Pocock, B., Chapman, J and Skinner, N. (2014) Putting together work and care in Australia: time for a new settlement? In L. Orchard & C. Miller (eds) Australian Public Policy: Progressive Ideas in the Neo-Liberal Ascendency. Policy Press: Bristol.
Pocock, B., Skinner, N. & Williams, P. (2012) Time Bomb. Work Rest and Play in Australia Today. Sydney, NewSouth Publishing.
Sayer, L.C., England, P., Bittman, M. & Bianchi, S.M. (2009) 'How long is the second (plus first) shift? Gender differences in paid, unpaid, and total work time in Australia and the United States' Journal of Comparative Family Studies, 40(4), 523-545.
Seligman, M. (2011). Flourish. New York, Free Press.
Skinner, N. & Chapman, J. (2013). Work-life balance and family friendly policies. Evidence Base, 4, 1 - 25.
Skinner, N. & Pocock, B. (2008) ‘Work, Life and Workplace Culture: The Australian Work and Life Index 2008’. Centre for Work + Life, University of South Australia.
Skinner, N. & Pocock, B. (2010) Work, life, flexibility And workplace culture in Australia: Results of the 2008 Australian Work & Life Index (AWALI) survey. Australian Bulletin of Labour, 36(2), 133-153.
Wooden, M., Warren, D., & Drago, R. (2009). Working time mismatch and subjective wellbeing. British Journal of Industrial Relations, 47, 147-179.