Avni Malhotra - UF/IFAS OCI A... · •Carbon patterns and drivers related to internal feedbacks...
17
Transcript of Avni Malhotra - UF/IFAS OCI A... · •Carbon patterns and drivers related to internal feedbacks...
Avni Malhotra McGill University, Montreal [email protected]

• Net Primary Production>>Decomposition
• 2-3% of total land surface; store 25-30% of the world’s soil carbon
• Carbon patterns and drivers related to internal feedbacks and external factors
Peatlands
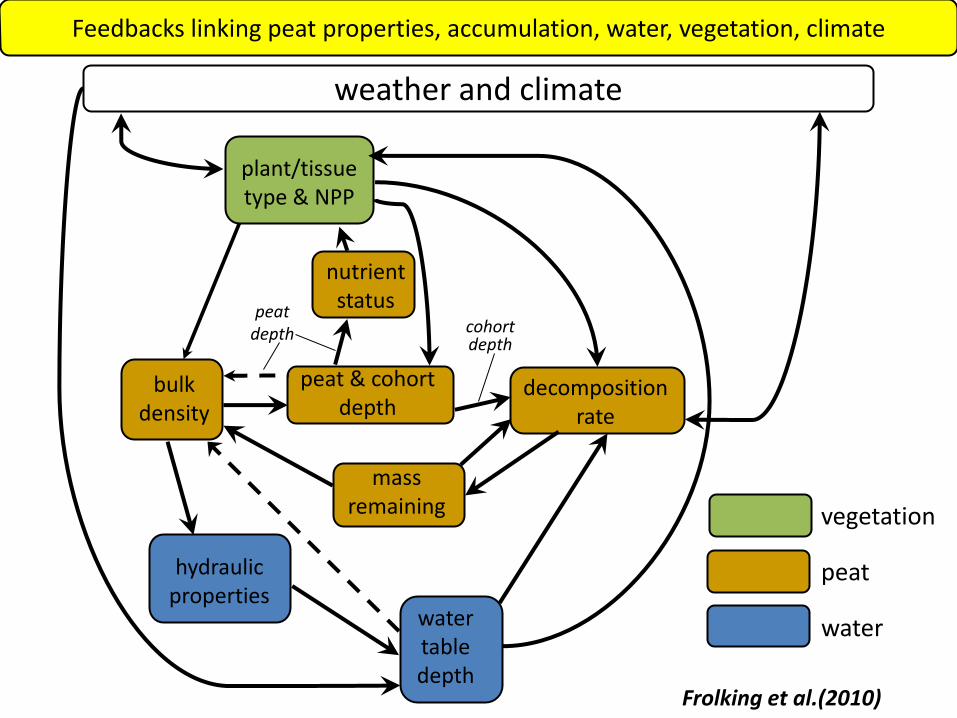
bulk density
decomposition rate
hydraulic properties
peat & cohort depth
water table depth
mass remaining
plant/tissue type & NPP
nutrient status
cohort depth
peat depth
vegetation
peat
water
weather and climate
Feedbacks linking peat properties, accumulation, water, vegetation, climate
Frolking et al.(2010)
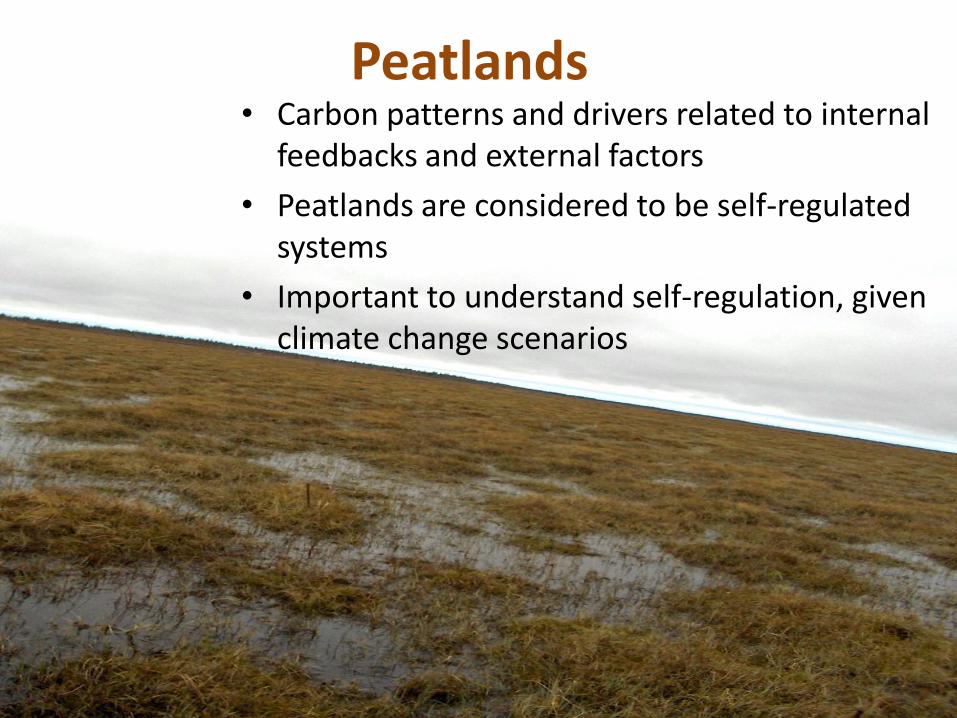
• Carbon patterns and drivers related to internal feedbacks and external factors
• Peatlands are considered to be self-regulated systems
• Important to understand self-regulation, given climate change scenarios
Peatlands

Anaerobic
Aerobic NEE (=GPP - R)
Photosynthesis (GPP) Respiration (R) Decomposition
Water table
Figure modified from Dr. Melanie Vile
Core of research proposal
Structure 1) Vegetation
2) Microtopography
3) Water table
Function 1) Net Ecosystem
Exchange
2) Decomposition Microtopography, Vegetation
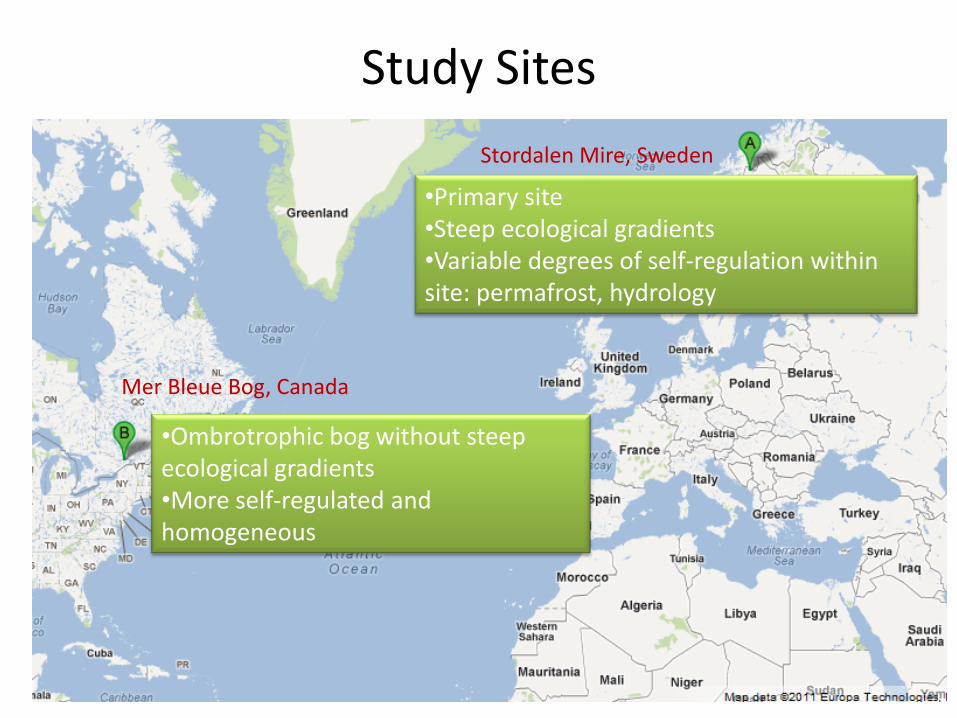
Study Sites
Stordalen Mire, Sweden
Mer Bleue Bog, Canada
•Ombrotrophic bog without steep ecological gradients •More self-regulated and homogeneous
•Primary site •Steep ecological gradients •Variable degrees of self-regulation within site: permafrost, hydrology
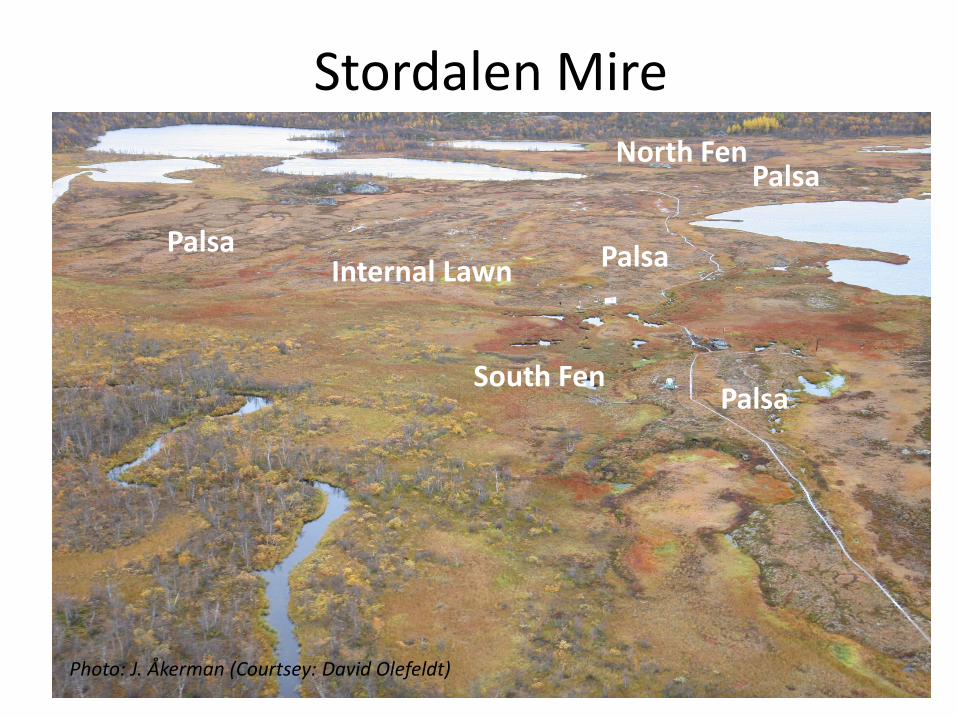
Stordalen Mire
Palsa
Palsa South Fen
North Fen
Internal Lawn Palsa
Photo: J. Åkerman (Courtsey: David Olefeldt)
Palsa

• Point intercept method + Elevation data
• Stordalen and Mer Bleue (different spatial scales)
Preliminary Data: Relationship between Vegetation and Microtopography

Vegetation and Microtopography
Elevation of well (m)
350.4 350.6 350.8 351.0 351.2 351.4 351.6 351.8 352.0 352.2 352.4
Number of species present in quadrat
0
2
4
6
8
10
12
14
16
18
R2= 0.38 (p= 0.0003)
350.4 350.6 350.8 351.0 351.2 351.4 351.6 351.8 352.0 352.2 352.40
2
4
6
8
10
12
14
16
18
Fen
Palsa
Internal lawn
Elevation of well (m)
Number of species present in quadrat
Elevation data courtesy of Dr. Andreas Persson
Elevation and # of species: Significant relationship at Stordalen No longer significant!
Number of species
Elevation of well (m)

Elevation and # of species: No significant relationships at Mer Bleue (sub-site level)
Elevation data courtesy of Paul Wilson
Vegetation and Microtopography

Stordalen veg. overview (Site Level Scale)
Number of hits per species per quadrat 0
5
10
15
20
25
30
Litter
Lichens
Moss
Elevation (m)
350.4 350.8 351.2 351.6 352.0 352.4
0
10
20
30Dicranum elongatum
Polytrichum strictum
Sphagnum spp.
Sedges
0
50
100
150
200
250
Carex aquatilis
Carex rostrata
Eriophorum vaginatum
Shrubs
350.4 350.8 351.2 351.6 352.0 352.4-10
0
10
20
30
40
Andromeda polifolia
Betula nana
Empetrum negrum
Rubus chamaemorus
Vaccinium uliginosum
Vaccinium vitis-idaea
* R2= 0.18 p= 0.0378
* R2= 0.60 p= 0.0004 * R2= 0.27 p= 0.0032
Elevation data courtesy of Dr. Andreas Persson

Mer Bleue veg. overview: sample transect
(Sub-site Level Scale)
Bryophyte layer (percent cover)
Eriophorum vaginatum
Vaccinium myrtilloides
Ledum groenlandicum
Kalmia
angustifolia Oxycoccus
microcarpus
Chamaedaphne calyculata
Maianthemum trifolium
Elevation (m)
Quadrat number
R2= 0.46 (p=0.03)
R2= 0.54 (p=0.01)
Litter R2= 0.56 (p=0.01)
Litter S.magellanicum S.capillifolium P.strictum

Preliminary Data Conclusions
1. Number of species better correlated to elevation at Stordalen at site level than at sub-site level and not at MB sub-site level.
2. More individual species abundance correlated to elevation at MB compared to Stordalen- but at MB spatial autocorrelation included as scale level is lower.
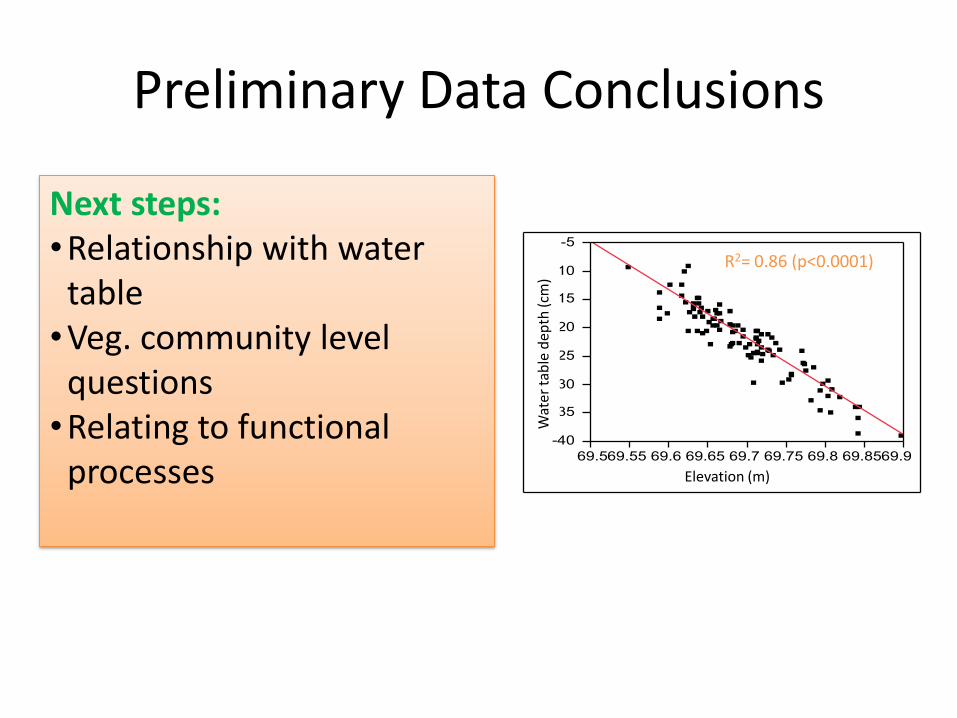
Next steps: •Relationship with water
table •Veg. community level
questions •Relating to functional
processes
Wat
er t
able
dep
th (c
m)
Elevation (m)
R2= 0.86 (p<0.0001)
Preliminary Data Conclusions

Structure
1) Vegetation
2) Microtopography
3) Water table
Function
1) Net Ecosystem Exchange
2) Decomposition
Expect to find that in a more self-regulated system: 1) Stronger structure-function relationship 2) More up-scalability 3) Less steep gradients
Broad Research Objective: Understand self regulation in peatlands by observing the relationship between structure and function across areas of different self regulation.

Thank you!
Acknowledgements • Committee members for valuable feedback- Nigel Roulet, Tim Moore, Jill Bubier and Federic Guichard • Paul Wilson and Dr. Andreas Persson for elevation and WT data • Mike Dalva, Silvie Harder, Nadine Shatilla, Meaghan Murphy and Léa Braschi for help in the lab and field
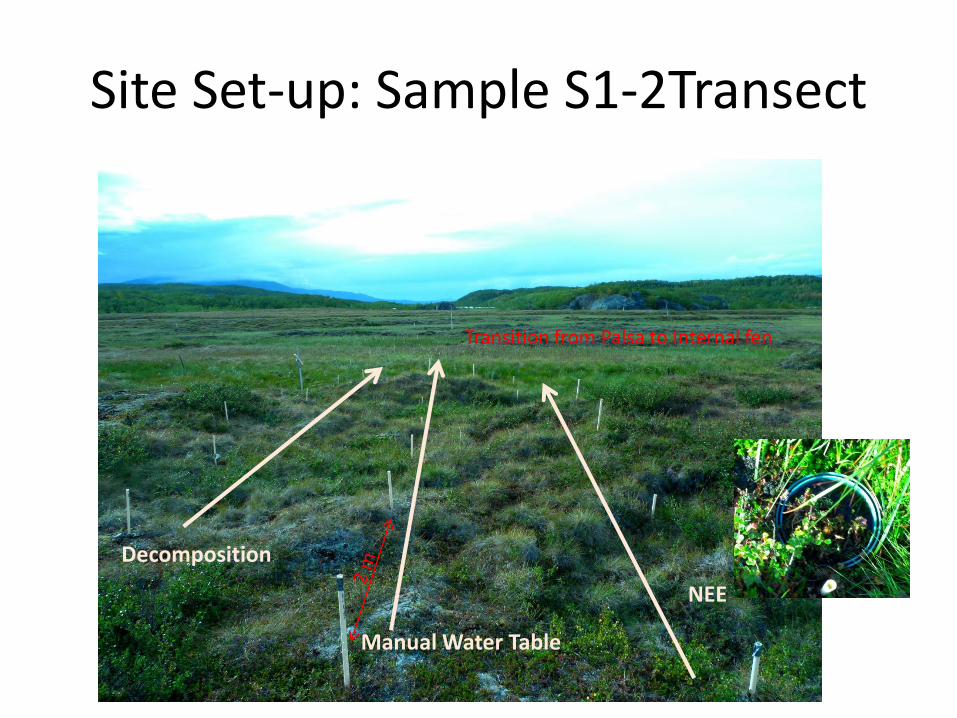
Site Set-up: Sample S1-2Transect
Decomposition
Manual Water Table
NEE
Transition from Palsa to Internal fen