
Avnet PowerPoint Template - Green Color Scheme -...
34
Avnet & Enterprise Effectiveness Pascal Fernandez 1
Transcript of Avnet PowerPoint Template - Green Color Scheme -...

Avnet & Enterprise Effectiveness
Pascal Fernandez
1

2 May 10th, 2016
Content
• Avnet and the HiTech Industry Supply Chain
• Higher level of Collaboration
• Resolving Visibility
• Enterprise effectiveness – Avnet SCOR journey
3 May 10th, 2016
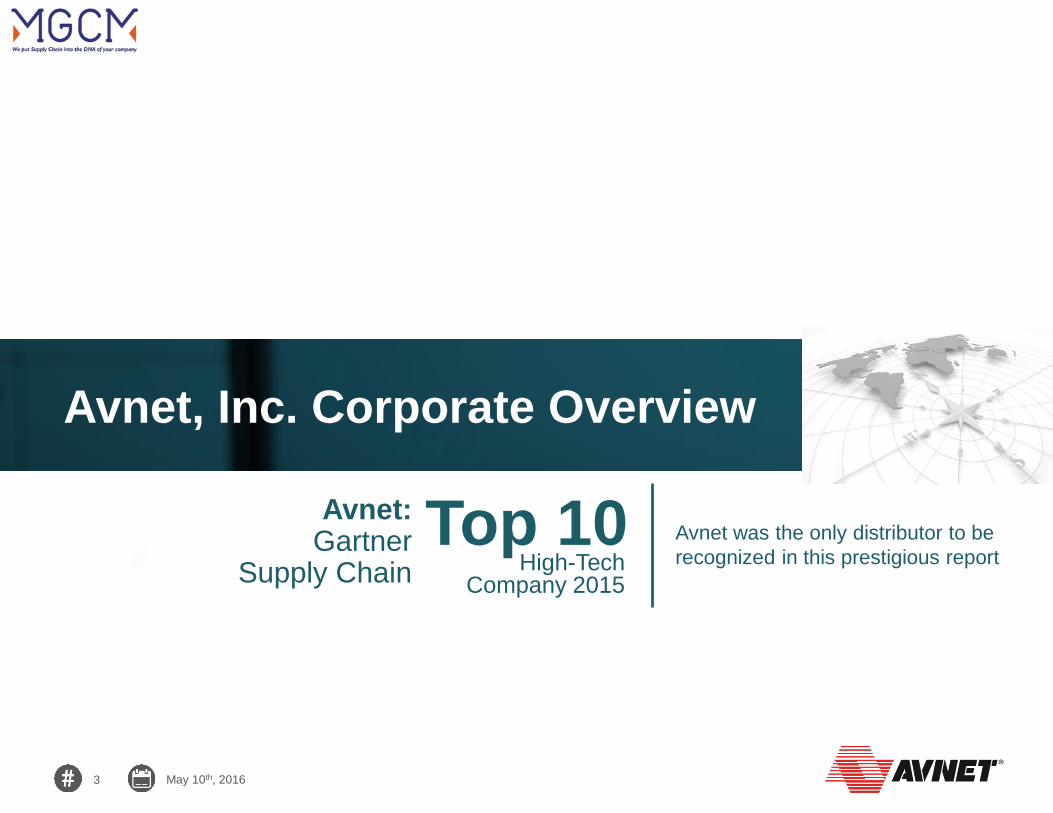
Avnet, Inc. Corporate Overview
Avnet was the only distributor to be
recognized in this prestigious report
Avnet: Gartner
Supply Chain
Top 10High-Tech
Company 2015
4 May 10th, 2016
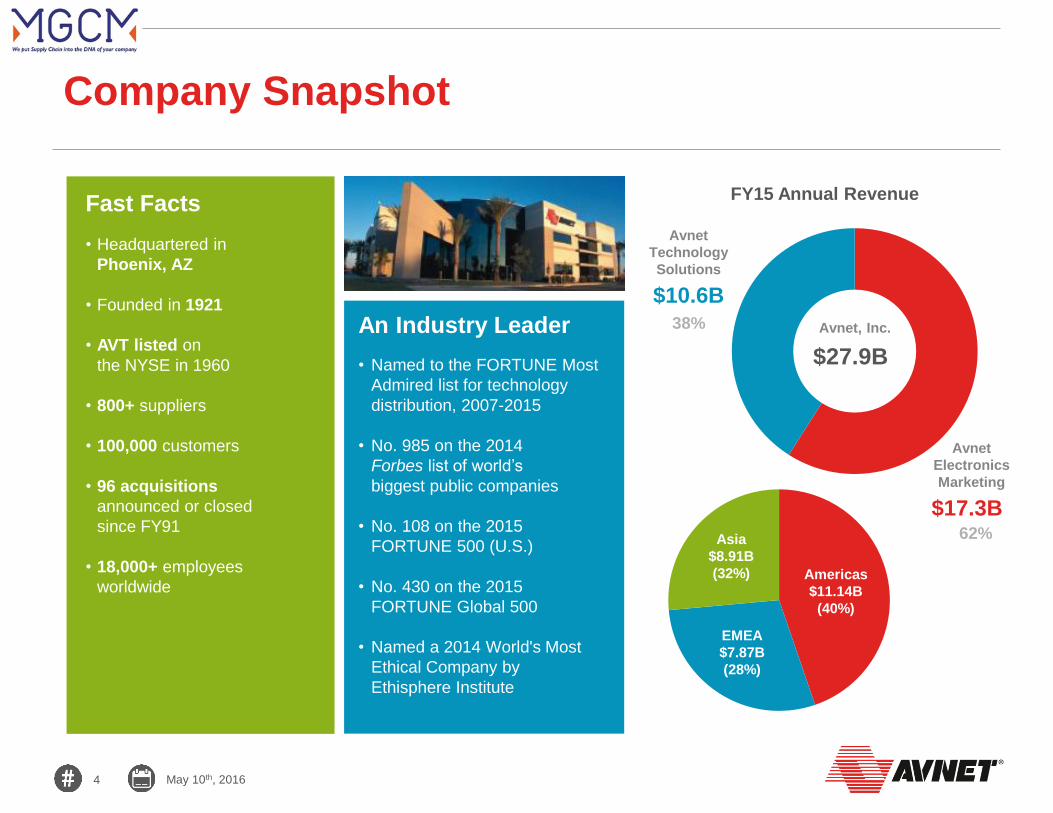
Company Snapshot
Americas
$11.14B
(40%)
Asia
$8.91B
(32%)
EMEA
$7.87B
(28%)
• Named to the FORTUNE Most
Admired list for technology
distribution, 2007-2015
• No. 985 on the 2014
Forbes list of world’s
biggest public companies
• No. 108 on the 2015
FORTUNE 500 (U.S.)
• No. 430 on the 2015
FORTUNE Global 500
• Named a 2014 World's Most
Ethical Company by
Ethisphere Institute
An Industry Leader
FY15 Annual Revenue
$27.9B
Avnet, Inc.
$10.6B
Avnet
Technology
Solutions
$17.3B
Avnet
Electronics
Marketing
• Headquartered in
Phoenix, AZ
• Founded in 1921
• AVT listed on
the NYSE in 1960
• 800+ suppliers
• 100,000 customers
• 96 acquisitions
announced or closed
since FY91
• 18,000+ employees
worldwide
Fast Facts
38%
62%
5 May 10th, 2016
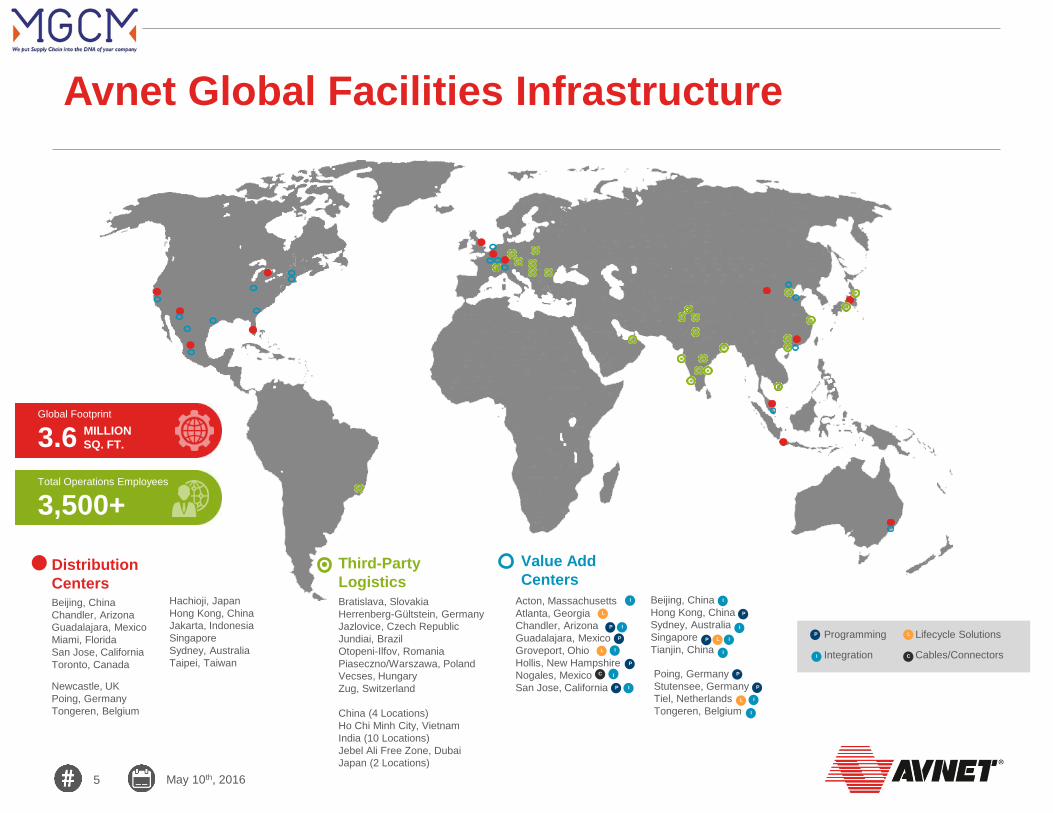
Poing, Germany
Stutensee, Germany
Tiel, Netherlands
Tongeren, Belgium
Avnet Global Facilities Infrastructure
Global Footprint
3.6 MILLION
SQ. FT.
Total Operations Employees
3,500+
Distribution
CentersBeijing, China
Chandler, Arizona
Guadalajara, Mexico
Miami, Florida
San Jose, California
Toronto, Canada
Newcastle, UK
Poing, Germany
Tongeren, Belgium
Value Add
Centers
Acton, Massachusetts
Atlanta, Georgia
Chandler, Arizona
Guadalajara, Mexico
Groveport, Ohio
Hollis, New Hampshire
Nogales, Mexico
San Jose, California
Third-Party
LogisticsBratislava, Slovakia
Herrenberg-Gültstein, Germany
Jazlovice, Czech Republic
Jundiai, Brazil
Otopeni-Ilfov, Romania
Piaseczno/Warszawa, Poland
Vecses, Hungary
Zug, Switzerland
China (4 Locations)
Ho Chi Minh City, Vietnam
India (10 Locations)
Jebel Ali Free Zone, Dubai
Japan (2 Locations)
I
L
P
I
L
I
P
P I
P
IC
P
I
L
I
P
P
I
I
L
I
I
Programming
Integration
Lifecycle Solutions
Cables/ConnectorsP
Beijing, China
Hong Kong, China
Sydney, Australia
Singapore
Tianjin, China
P
I
L
C
Hachioji, Japan
Hong Kong, China
Jakarta, Indonesia
Singapore
Sydney, Australia
Taipei, Taiwan
6 May 10th, 2016
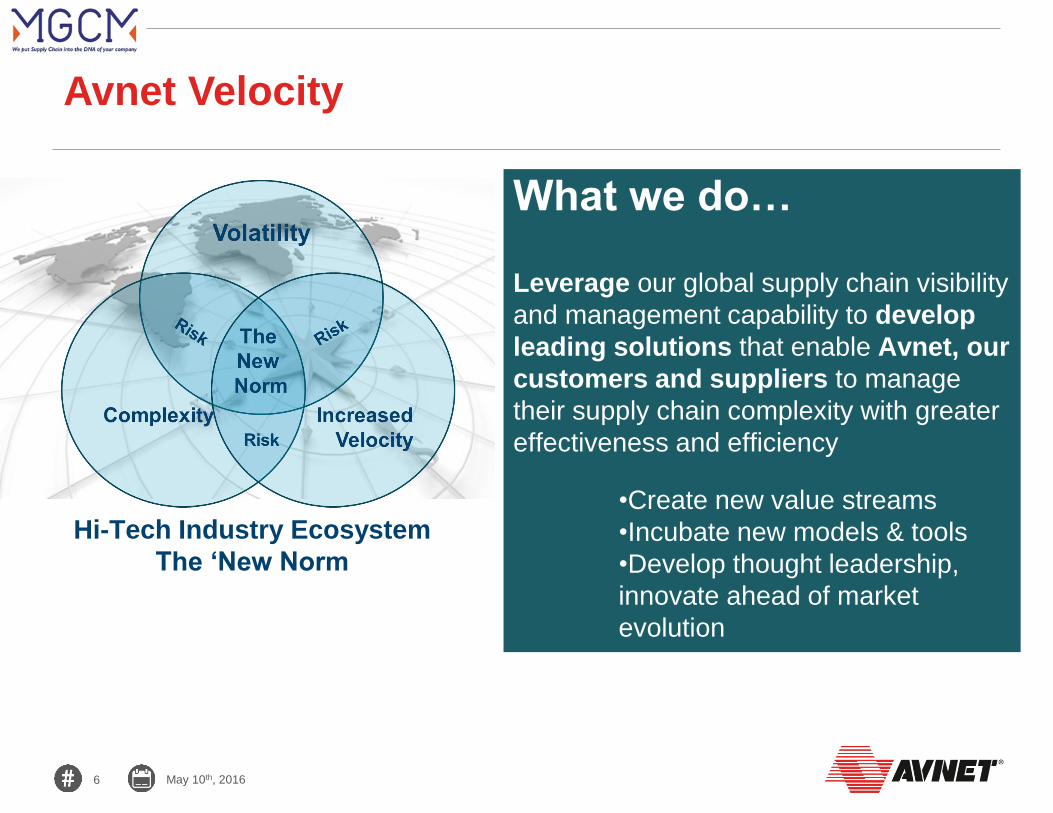
What we do…
Leverage our global supply chain visibility
and management capability to develop
leading solutions that enable Avnet, our
customers and suppliers to manage
their supply chain complexity with greater
effectiveness and efficiency
•Create new value streams
•Incubate new models & tools
•Develop thought leadership,
innovate ahead of market
evolution
Hi-Tech Industry Ecosystem
The ‘New Norm
Avnet Velocity

7 May 10th, 2016
Where we play….
Logistics
Planning
Access to Products
and Technology
Process design
Geographical
reach
Financial
efficiency
Visibility &
Control

8 May 10th, 2016
The Hi-Tech industry Supply Chain

9 May 10th, 2016
Contract Manufacturers
OEM Sub
Assembly
Distributors / retailers
Control. Visibility. Cost. Risk.
The ‘New Norm’
Ecosystem
complexityFrom Components
to OEM products…

10 May 10th, 2016
Electronic Industry Supply Chain Summary
Telecom Infrastructure, Networking
IP in Western Europe, North America… and Asia
Manufacturing in B(R)ICs for volume and Regional Markets
Re localizing lower volumes and final integration
Automotive
Revolution is progress ! Electronic is the highest material spend
Transportation cost, proximity to end customer and Quality constraints keeps PCB assembly close to car makers and end customers
Industrial, Medical, Energy
Low to high volume remains in indigenous region
High volume low mix goes to Asia on occasion
Transportation, Avionic, Defense
Remains in Europe for European market
IP and Quality key factors
Governmental influence
Toy industry, consumer goods, mobile phones, personal computers….
All moved to BRIC’s
Cost is predominant
And IOT !!
11 May 10th, 2016
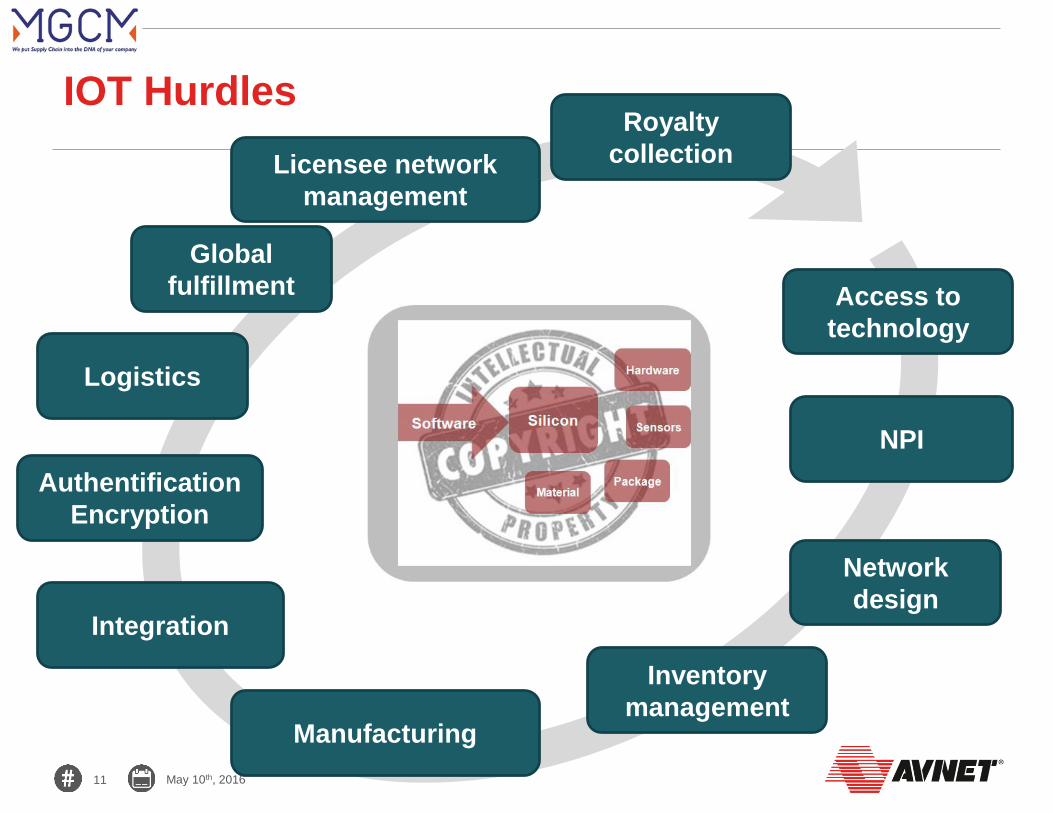
IOT Hurdles
Authentification
Encryption
Licensee network
management
Access to
technology
NPI
Royalty
collection
Global
fulfillment
Inventory
management
Network
design
Logistics
Manufacturing
Integration

12 May 10th, 2016
Hi-Tech Industry Ecosystem
The ‘New Norm’
Volatility
Complexity Increased
VelocityRisk
The
New
Norm
13 May 10th, 2016
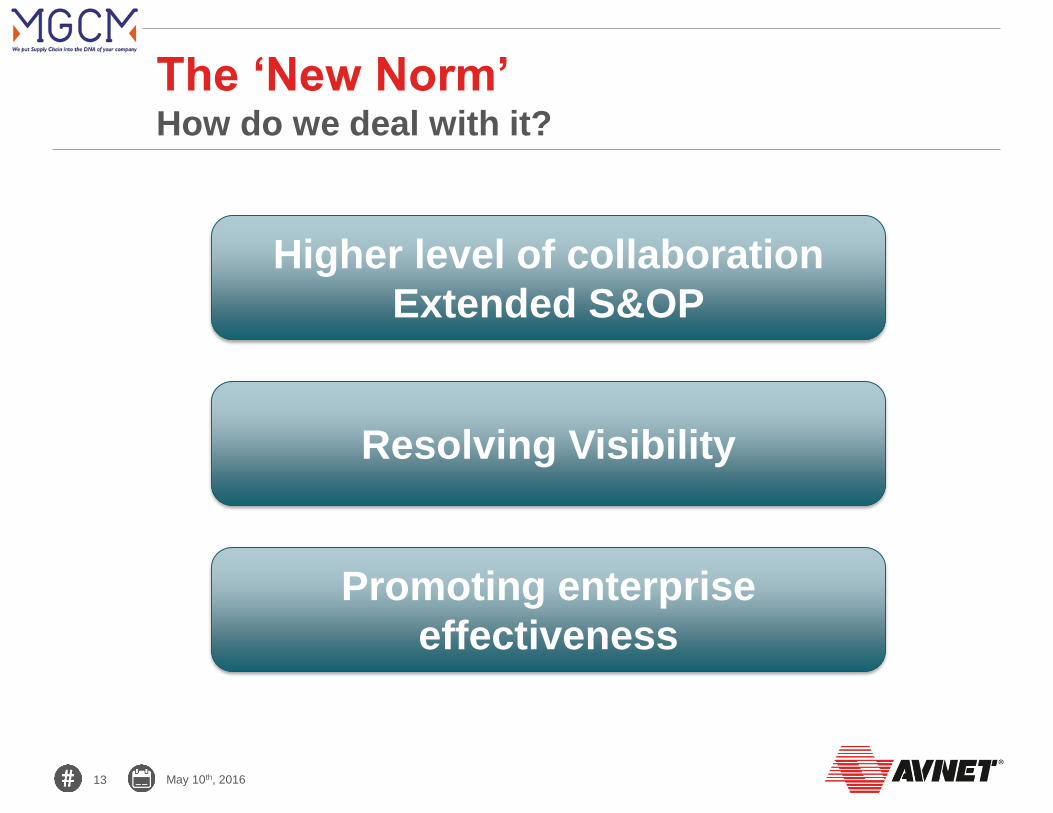
Higher level of collaboration
Extended S&OP
Resolving Visibility
Promoting enterprise
effectiveness
The ‘New Norm’How do we deal with it?

14 May 10th, 2016
Higher level of collaboration
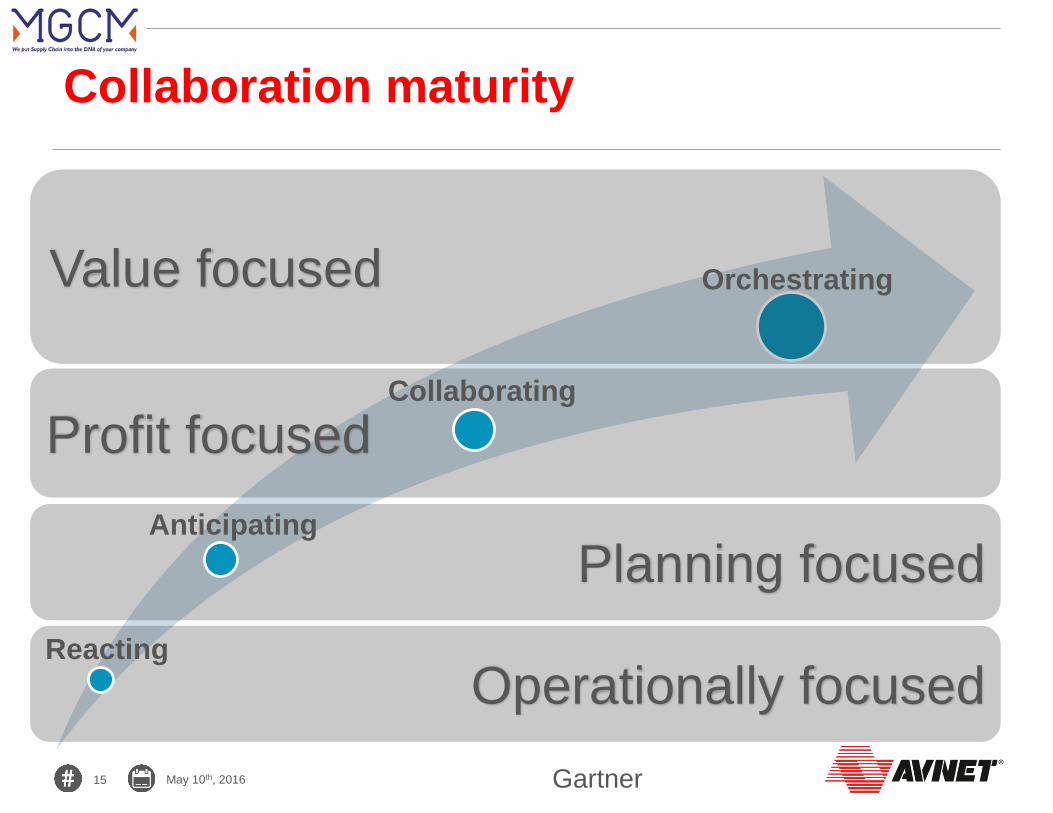
15 May 10th, 2016
Operationally focused
Planning focused
Profit focused
Value focused
Collaboration maturity
Orchestrating
Anticipating
Reacting
Collaborating
Gartner
16 May 10th, 2016
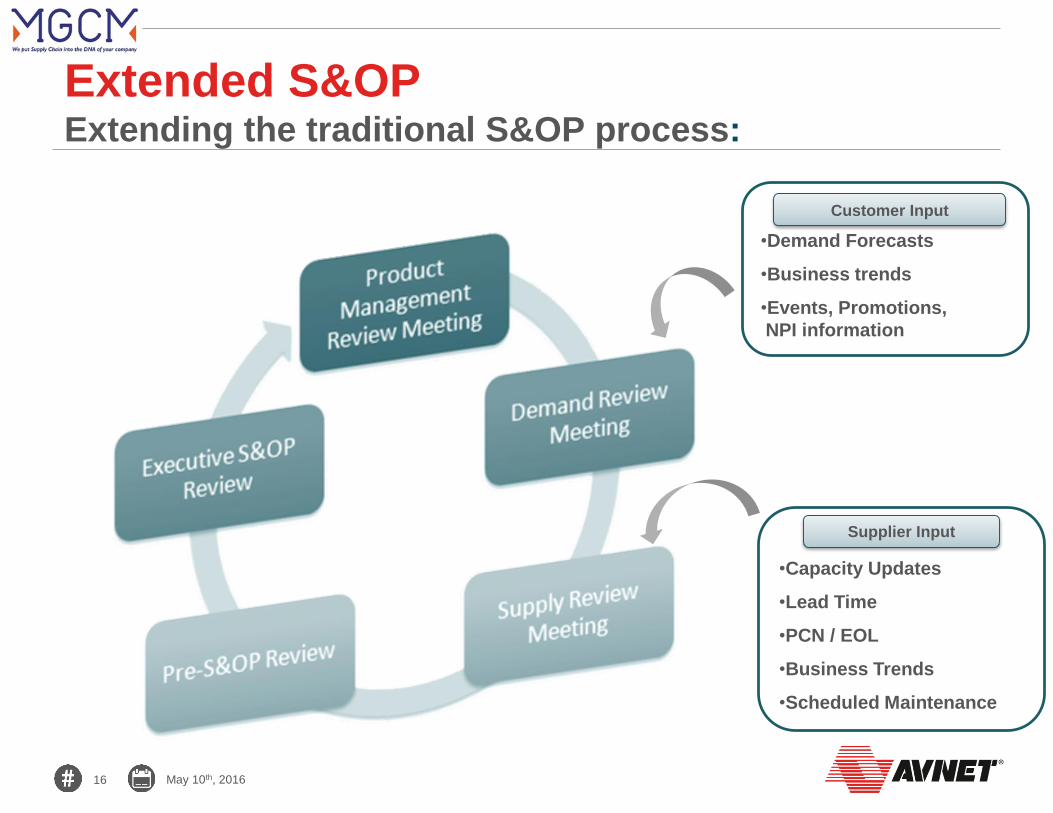
Extended S&OPExtending the traditional S&OP process:
•Demand Forecasts
•Business trends
•Events, Promotions,
NPI information
Customer Input
•Capacity Updates
•Lead Time
•PCN / EOL
•Business Trends
•Scheduled Maintenance
Supplier Input

17 May 10th, 2016
Collaborate and Compromise
Flexibility vs Inventory
Security vs Liability
Cost vs Lead Time
Lead Time vs Demand
Proximity vs Critical Mass
MTS vs MTO
Labor Cost vs Transportation Time
Margin vs Cash flow
18 May 10th, 2016
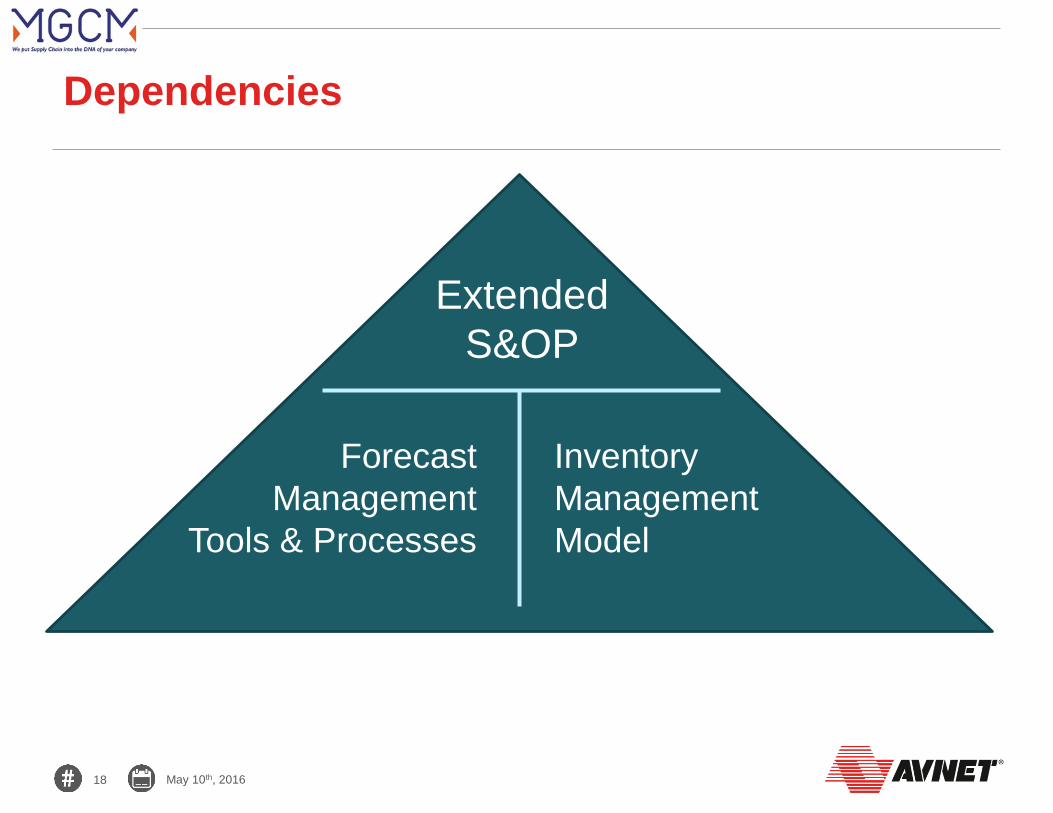
Dependencies
Inventory
Management
Model
Extended
S&OP
Forecast
Management
Tools & Processes

19 May 10th, 2016
Visibility

20 May 10th, 2016
Visibility is critical
In a virtual enterprise
environment, information
management makes the
difference
Visibility
Risk Mitigation
Inventory Optimization
Business Opportunities
Customer Service
21 May 10th, 2016
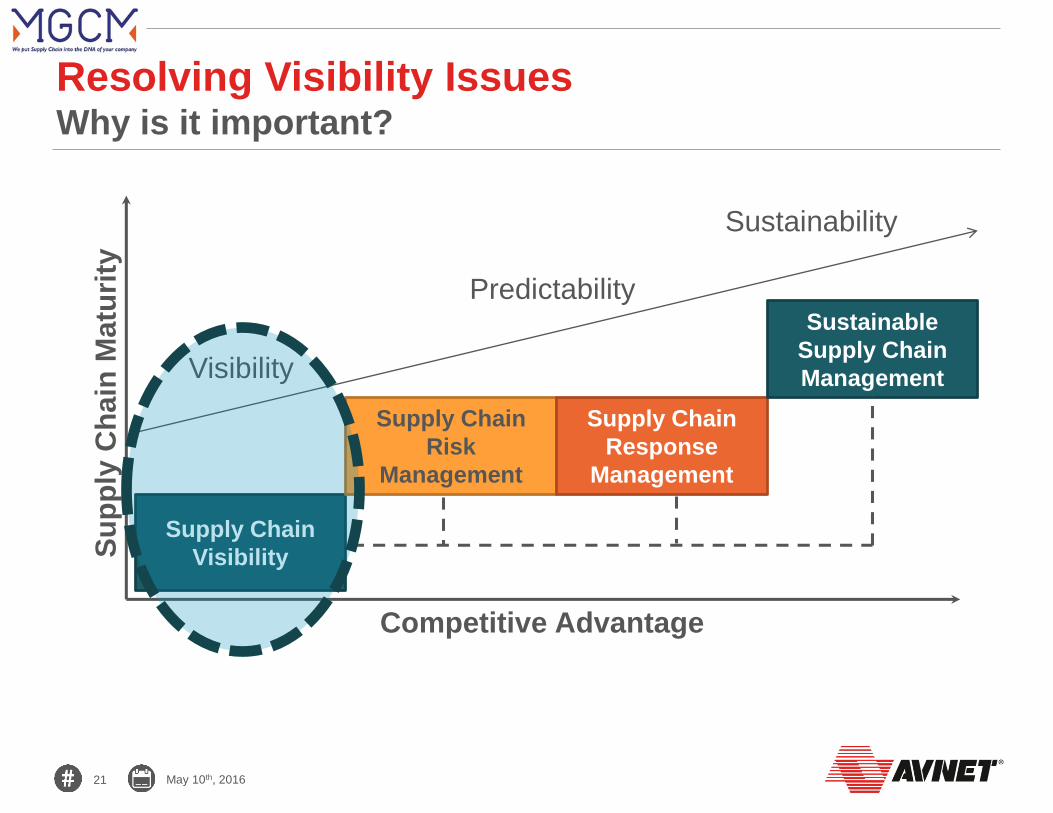
Resolving Visibility IssuesWhy is it important?
Supply Chain
Visibility
Supply Chain
Risk
Management
Supply Chain
Response
Management
Competitive Advantage
Su
pp
ly C
hain
Matu
rity
Sustainable
Supply Chain
ManagementVisibility
Sustainability
Predictability

22 May 10th, 2016
Resolving Visibility IssuesUsing a Supply Chain Control Tower
Original Equipment Manufacturer (OEM)
Collaborative Execution Management
Enterprise Collaboration Hub
Business Process Rules Enforcement
Global End-to-End Data Collection
Manage Inter and Intra-Company Processes by Exception
Supply: EMS, ODM, Component & Raw Material Suppliers
Demand: Channel/Retailer
OEM Data (examples)
Demand Forecast
S&OP Plan
Sales Orders
SKU Level Sell-Out
Inventory info/ On-hand
Channel Inventory
Purchase Orders
Goods Receipt
Supply Side Data (examples)
Forecast
Purchase Orders
Confirmations
Shipping Data
FG Inventory,
WIP Inventory
VMIVMI Hubs
Tier 2 Suppliers
Tier 1 Suppliers
EMS
ODM
Regional Merge Centers
Tier 1 Suppliers
3PL
Tier 2 Suppliers
Regional Merge Centers
3PL
EMS
FG Inventory
Optimization
Channel Inv
Visibility
Collaborative
Demand
Demand Side Multi-Echelon
Ecosystem
Channel
Retailer
Consumer
Supply Side Multi-
EchelonEcosystem
Inventory
Visibility
Shortage
Elimination
Supply
Assurance
Suppllier
VMI
Logistics
Visibility
Collaborative
Supply
23 May 10th, 2016
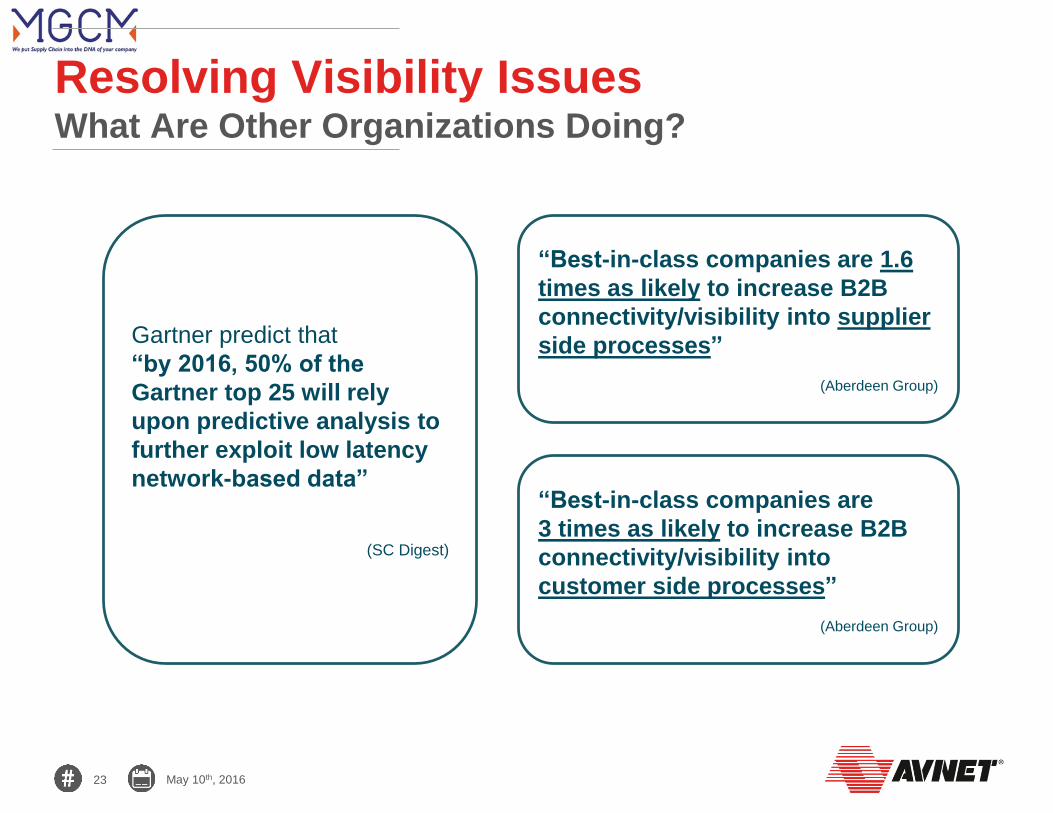
Resolving Visibility Issues What Are Other Organizations Doing?
“Best-in-class companies are
3 times as likely to increase B2B
connectivity/visibility into
customer side processes”
(Aberdeen Group)
Gartner predict that
“by 2016, 50% of the
Gartner top 25 will rely
upon predictive analysis to
further exploit low latency
network-based data”
(SC Digest)
“Best-in-class companies are 1.6
times as likely to increase B2B
connectivity/visibility into supplier
side processes”
(Aberdeen Group)
24 May 10th, 2016
Enterprise effectiveness
25 May 10th, 2016
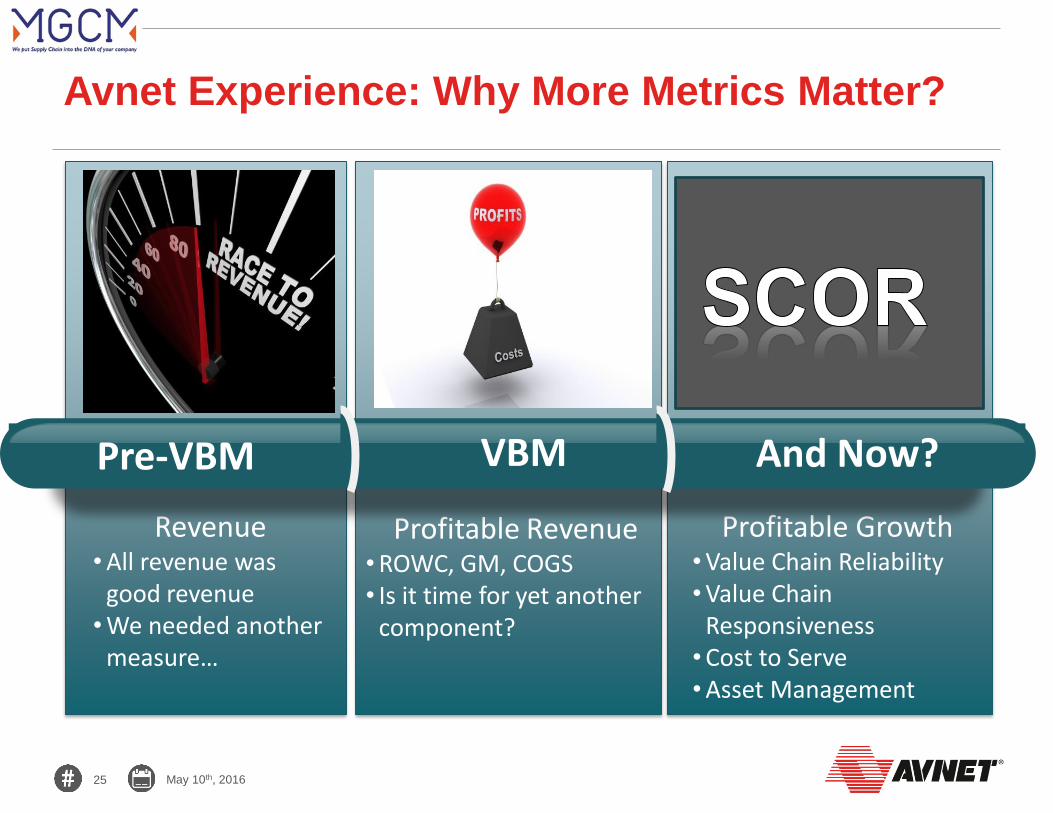
Avnet Experience: Why More Metrics Matter?
Revenue• All revenue was
good revenue• We needed another measure…
Profitable Revenue• ROWC, GM, COGS• Is it time for yet another
component?
Profitable Growth• Value Chain Reliability• Value Chain
Responsiveness• Cost to Serve• Asset Management
Pre-VBM VBM And Now?
26 May 10th, 2016
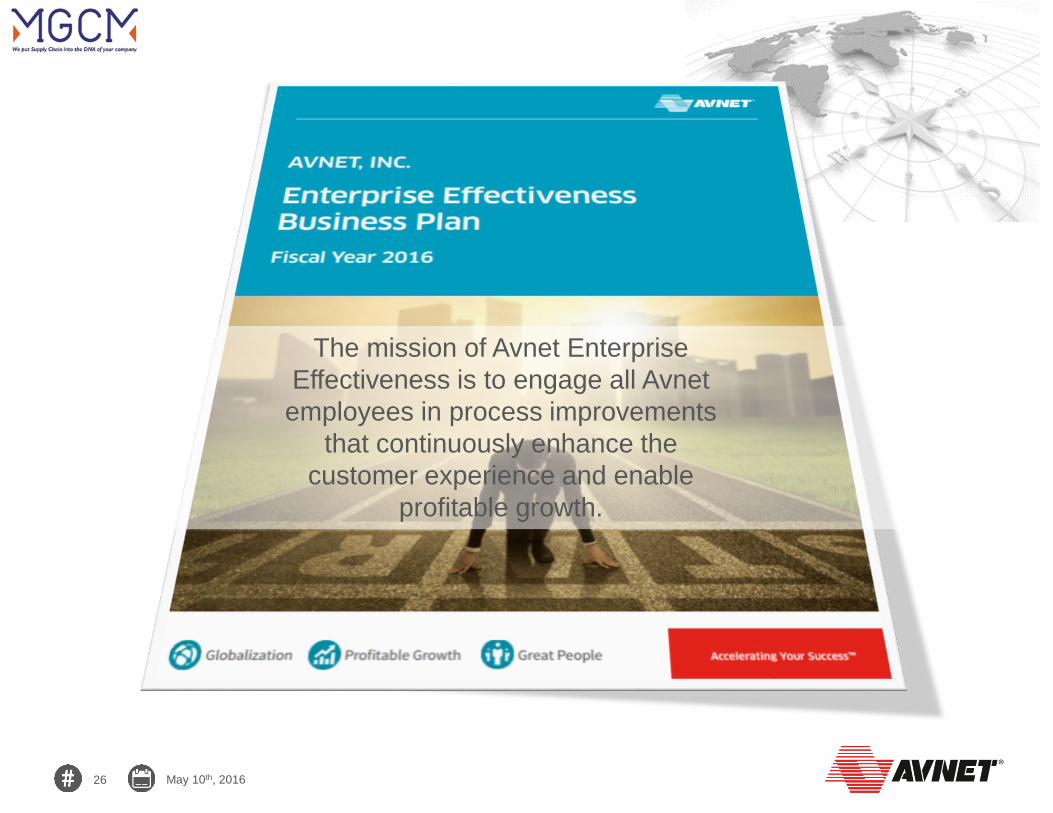
The mission of Avnet Enterprise
Effectiveness is to engage all Avnet
employees in process improvements
that continuously enhance the
customer experience and enable
profitable growth.
27 May 10th, 2016
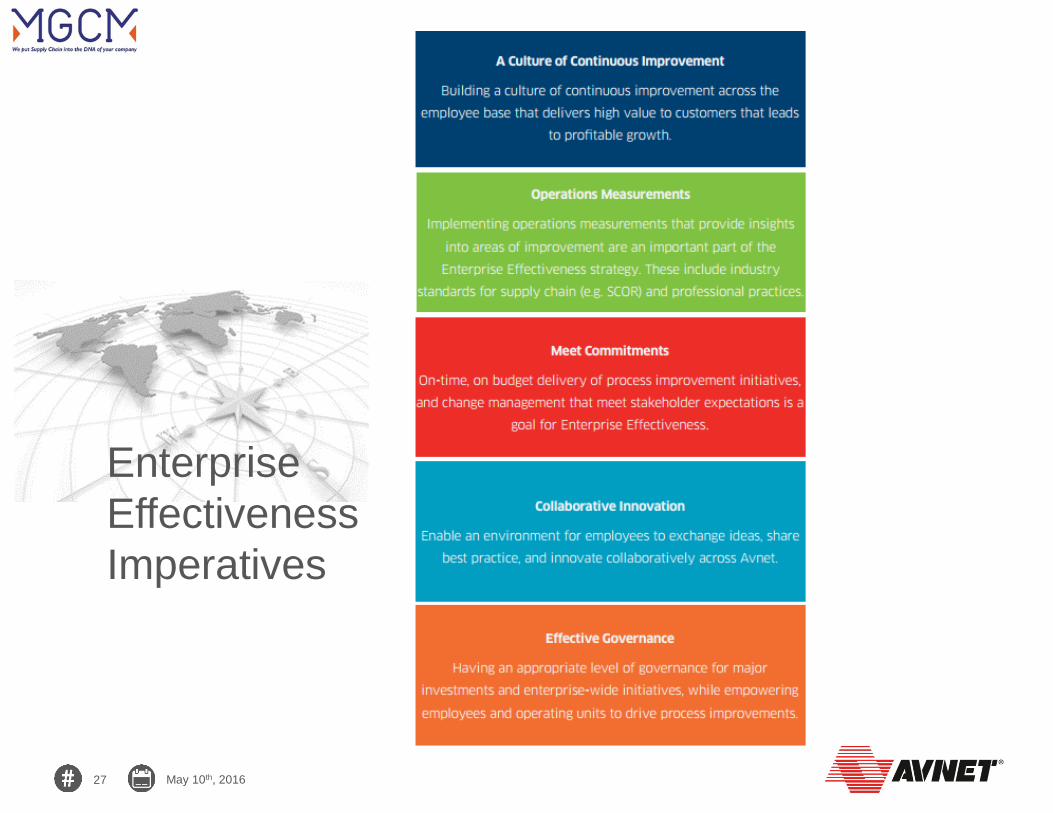
Enterprise
Effectiveness
Imperatives
28 May 10th, 2016
Perfect Order Fulfillment (POF) - Reliability
• Perfect Order Fulfillment (POF) is a customer
facing performance metric for organization's
supply chain reliability
• POF measures how well we are meeting
commitments to customers in four areas:
• Delivery item and quantity accuracy
• Delivery performance according to customer commit
date (OTD)
• Accurate, complete and on-time documentation
• Perfect condition

29 May 10th, 2016
Guiding Principles for Metrics Interpretation
• Customer facing metrics should be measured as close to the
customer experience as possible
• The moment of order submission instead of order entry
• Delivered performance instead of shipping performance
• Received quality instead of produced or shipped quality
• Measure what makes sense
• Don’t have data? Make a reasonable assumption of the
missing component until you will be able to obtain the data
• Trend data is more important then a single measurement
• It is not about how you think it should be measured, ask your
customer what is important to him/her

30 May 10th, 2016
Our Scope for Perfect Order Fulfillment
Perfect Order Fulfillment
1.1
Orders Delivered in Full
2.1
Delivery Item Accuracy
2.1 A
Delivery Quantity Accuracy
2.1 B
Orders Delivered on Time
2.2
Delivery Date Accuracy
2.2 A
Delivery Location Accuracy
2.2 B
Documentation Accuracy
2.3
Shipping Document Accuracy
2.3 B
Payment Document Accuracy
2.3 A
Compliance Document Accuracy
2.3 C
Other Document Accuracy
2.3 D
Orders Delivered in Perfect Condition
2.4
Orders Delivered Damage Free
2.4 A
Orders Delivered with Warranty and
Returns
2.4 C
Orders Delivered Defect Free
2.4 B
Orders Delivered Faultless Installation
2.4 D
Level 1Strategic Metric
SCOR Attribute
Level 2Process Metric
Level 3Diagnostic
Metric
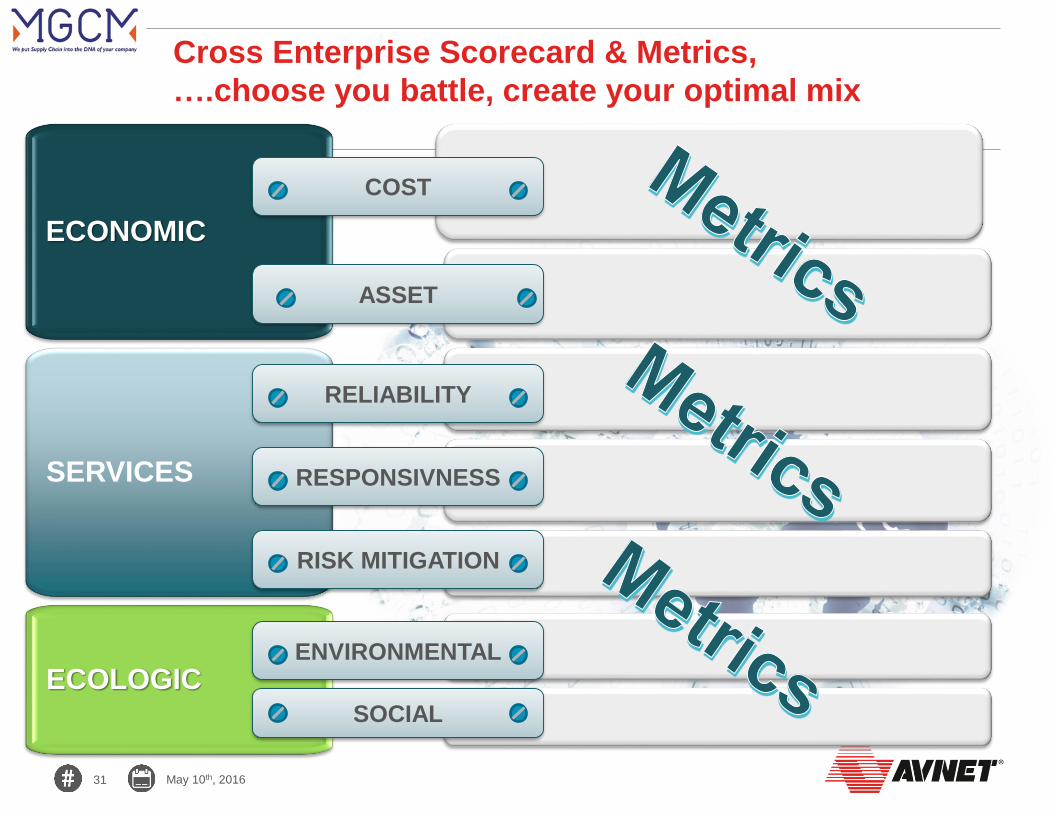
31 May 10th, 2016
Cross Enterprise Scorecard & Metrics,
….choose you battle, create your optimal mix
ECONOMIC
SERVICES
ECOLOGIC
COST
ASSET
RELIABILITY
RESPONSIVNESS
RISK MITIGATION
ENVIRONMENTAL
SOCIAL

32 May 10th, 2016
3 Key Factors will drive success:1. Higher level of collaboration– across the enterprise and beyond
2. Resolve Visibility Issues – enabling your supply chain to sense and
respond to demand and supply issues
3. Plan for Enterprise effectiveness. Create a culture, adopt a reference model,
Measure, Stimulate Innovation, implement effective governance
Key Takeaways
The ‘New Norm’ for the HiTech Industry
• Increased complexity, volatility, underlined by increased risk
management, increasing supply chain management costs, and
increased pressure on supply chain velocity.

34 May 10th, 2016
Digital Publication
150,000 customers,
suppliers, industry experts
http://scnavigator.avnet.com/