Aviva Capital Markets Day - Aviva plc - Group website - Aviva plc · 4 . Context . Fundamentals are...
99
Aviva Capital Markets Day 6 July 2016
Transcript of Aviva Capital Markets Day - Aviva plc - Group website - Aviva plc · 4 . Context . Fundamentals are...

Aviva Capital Markets Day 6 July 2016

2
Cautionary statements: This should be read in conjunction with the documents filed by Aviva plc (the “Company” or “Aviva”) with the United States Securities and Exchange Commission (“SEC”). This presentation contains, and we may make other verbal or written “forward-looking statements” with respect to certain of Aviva’s plans and current goals and expectations relating to future financial condition, performance, results, strategic initiatives and objectives. Statements containing the words “believes”, “intends”, “expects”, “projects”, “plans”, “will,” “seeks”, “aims”, “may”, “could”, “outlook”, “likely”, “target”, “goal”, “guidance”, “trends”, “future”, “estimates”, “potential” and “anticipates”, and words of similar meaning, are forward-looking. By their nature, all forward-looking statements involve risk and uncertainty. Accordingly, there are or will be important factors that could cause actual results to differ materially from those indicated in these statements. Aviva believes factors that could cause actual results to differ materially from those indicated in forward-looking statements in the presentation include, but are not limited to: the impact of ongoing difficult conditions in the global financial markets and the economy generally; the impact of simplifying our operating structure and activities; the impact of various local political, regulatory and economic conditions; market developments and government actions regarding the referendum on UK membership of the European Union; the effect of credit spread volatility on the net unrealised value of the investment portfolio; the effect of losses due to defaults by counterparties, including potential sovereign debt defaults or restructurings, on the value of our investments; changes in interest rates that may cause policyholders to surrender their contracts, reduce the value of our portfolio and impact our asset and liability matching; the impact of changes in short or long term inflation; the impact of changes in equity or property prices on our investment portfolio; fluctuations in currency exchange rates; the effect of market fluctuations on the value of options and guarantees embedded in some of our life insurance products and the value of the assets backing their reserves; the amount of allowances and impairments taken on our investments; the effect of adverse capital and credit market conditions on our ability to meet liquidity needs and our access to capital; changes in, or restrictions on, our ability to initiate capital management initiatives; changes in or inaccuracy of assumptions in pricing and reserving for insurance business (particularly with regard to mortality and morbidity trends, lapse rates and policy renewal rates), longevity and endowments; a cyclical downturn of the insurance industry; the impact of natural and man-made catastrophic events on our business activities and results of operations; our reliance on information and technology and third-party service providers for our operations and systems; the inability of reinsurers to meet obligations or unavailability of reinsurance coverage; increased competition in the UK and in other countries where we have significant operations; regulatory approval of extension of use of the Group’s internal model for calculation of regulatory capital under the European Union’s Solvency II rules; the impact of actual experience differing from estimates used in valuing and amortising deferred acquisition costs (“DAC”) and acquired value of in-force business (“AVIF”); the impact of recognising an impairment of our goodwill or intangibles with indefinite lives; changes in valuation methodologies, estimates and assumptions used in the valuation of investment securities; the effect of legal proceedings and regulatory investigations; the impact of operational risks, including inadequate or failed internal and external processes, systems and human error or from external events (including cyber attack); risks associated with arrangements with third parties, including joint ventures; our reliance on third-party distribution channels to deliver our products; funding risks associated with our participation in defined benefit staff pension schemes; the failure to attract or retain the necessary key personnel; the effect of systems errors or regulatory changes on the calculation of unit prices or deduction of charges for our unit-linked products that may require retrospective compensation to our customers; the effect of fluctuations in share price as a result of general market conditions or otherwise; the effect of simplifying our operating structure and activities; the effect of a decline in any of our ratings by rating agencies on our standing among customers, broker-dealers, agents, wholesalers and other distributors of our products and services; changes to our brand and reputation; changes in government regulations or tax laws in jurisdictions where we conduct business, including decreased demand for annuities in the UK due to proposed changes in UK law; the inability to protect our intellectual property; the effect of undisclosed liabilities, integration issues and other risks associated with our acquisitions; and the timing/regulatory approval impact, integration risk, and other uncertainties, such as non-realisation of expected benefits or diversion of management attention and other resources, relating to announced acquisitions and pending disposals and relating to future acquisitions, combinations or disposals within relevant industries; the policies, decisions and actions of government or regulatory authorities in the UK, the EU, the US or elsewhere, including the implementation of key legislation and regulation. For a more detailed description of these risks, uncertainties and other factors, please see Item 3d, “Risk Factors”, and Item 5, “Operating and Financial Review and Prospects” in Aviva’s most recent Annual Report on Form 20-F as filed with the SEC on 16 March 2015 and also the risk factors contained in the Euro Note Programme prospectus published on 1 May 2015. Aviva undertakes no obligation to update the forward looking statements in this presentation or any other forward-looking statements we may make. Forward-looking statements in this presentation are current only as of the date on which such statements are made.
Disclaimer

Aviva Capital Markets Day 6 July 2016
Mark Wilson Group Chief Executive Officer

4
Context
Fundamentals are sound… Yet…
Fixed balance sheet No longer capital constrained Results are consistent Strong brand and franchises
Brexit uncertainty Questions on growth Still too complex

5
What we are here to answer
How will you grow earnings?
What is the trajectory of the dividend?
How strong and resilient is the balance sheet?
What is the outlook for capital generation?
What are capital management priorities?
What is the quality of your franchises?
What is the potential of TCC digital?
What is the impact of Brexit?

6
Insurance is about diversity. And for Aviva,
diversity is about multi-line,
multi-country in a focused
disciplined way.

7
True Customer Composite
Not Everywhere Digital First
Cash flow plus growth
Strategic anchor

8
Quality core franchises
Strong balance sheet
Sustainable growing dividend
Surplus capital provides options
British champion,
focused composite
Oaks, acorns and apple trees
Strategic identity

9
Operating profit Cash Dividend
Our expectations
50% pay-out ratio 2017
£7bn cash remittances 2016 -2018
Mid-single digit growth in medium term

10
No significant operational issues Locally incorporated and regulated
Structure
Capital
Earnings
Politics
Proven resilience Low interest rate sensitivity
Positive: FX, diversity Negative: Asset values, economic growth
Economic uncertainty
3%
14%
7% 4% 5%
Spain Asia Other
44%
12%
AI
UK GI
UK Life
Poland Canada
France
Italy
1% 7% 3%
FY15 Market OPBT
Diversified earnings
Brexit considerations

• Dividend is paramount • Organic growth
• Bolt on M&A
• Capital return
• Debt restructuring
Capital allocation
11
Options
To maximise return for
shareholders
Philosophy

12
Oaks, acorns and apple trees
Apple trees Acorns
Future, fast growth
Simplify, restructure, focus, improve
Solid growth, sustainable cash
Oaks
13
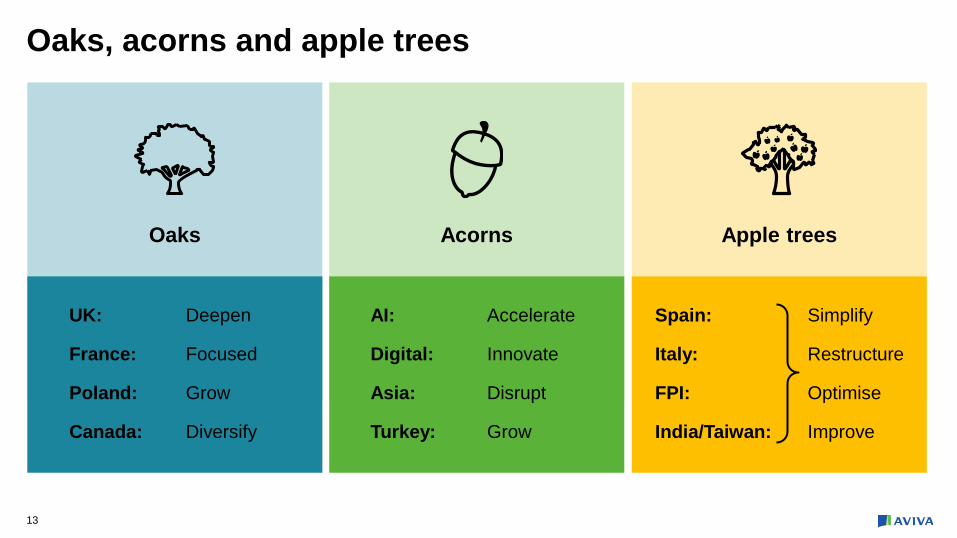
Oaks, acorns and apple trees
Oaks Acorns Apple trees
UK: Deepen
France: Focused
Poland: Grow
Canada: Diversify
AI: Accelerate
Digital: Innovate
Asia: Disrupt
Turkey: Grow
Spain: Simplify
Italy: Restructure
FPI: Optimise
India/Taiwan: Improve

Leading indicators Margin implications
1.8m
2.8m
Jan 15 May 16 30% lower
total cost1
Registrations
Average policy holding
Size of the prize
£150m
£300m
2016 2018
UK digital budget operating profit
14
Digital first
1. 30% relates to total cost for new GI home cross sales to our existing retirement customers compared to new intermediated home customers.
1.5 1.8 2.5
UK Direct MyAviva
15
Our brand is a key source of
competitive advantage

16
Clear link between brand and cross-sell
The UK market is not known as a composite one and
preferences for consolidation are quite low. However, Aviva
does compare well highlighting the opportunity if it can make a
success of its strategy
~UBS
Pre
ferre
d br
and
for c
onso
lidat
ion
Brand awareness 40% 50% 60% 70% 80% 90% 100%
12%
10%
8%
6%
4%
2%
0%
Prudential
RAC
AA Legal & General
Privilege Swiftcover
Esure Allianz
Hastings
Saga
SunLife Shelia’s Wheels
Green Flag
More Than
Zurich
Admiral
AXA
Churchill
Direct Line
Aviva
Source: UBS Evidence Lab: What Consumers Want
” “

Why the UK?
3rd largest insurance market
Large, ageing and affluent population
Structural savings growth
Attractive product set
Disintermediation
Digital opportunity
Stable regulation
Consolidated and commercial
17
@

Aviva Capital Markets Day 6 July 2016
Tom Stoddard CFO

19
What we are here to answer
How stable is the balance sheet?
What is our exposure to interest rates?
What is our exposure to credit?
What is the outlook for operating EPS?
When will we reach our dividend pay-out target?
What funds the dividend?
How will Aviva’s business mix result in growth?

20
How stable is the balance sheet?
Capital Liquidity
2015
180%
2014
178%
2013
182%
2012
172%
2011
130%
EC S2
Capital position resilient to wide range of market stresses
Feb-16
£1.3bn
Feb-15
£1.1bn
S&P Leverage Ratio
Ratings
2015
27%
2014
28%
2013
31%
Debt leverage
A+ (Stable) A1 (Stable) A (Stable) AA- (Stable)
1
1. Pro-forma basis

21
How stable is the balance sheet? Well capitalised and resilient to stress
Minimum Capital requirement (“MCR”)
Not to scale
FY15: 180% coverage ratio
100% Solvency Capital Requirement (“SCR”)
Working range
Risk reduction
Capital redeployment
Group SII ratio Equities movement
(decrease)
180% 177% 176% 177% 178% 172%
169%
141%
-25%
Interest rates¹
Corporate bond spreads
GI shock² Longevity shock3
2011 financial crisis4
2008 financial crisis4
-10% -25bps +100bps
• Our investment portfolio is prudently positioned
• No reliance on UFR
• Aviva has limited sensitivity to interest rates and spreads
1 For interest rate stresses, the transitional is assumed to be reset 2 5% increase in gross loss ratio 3 5% decrease in mortality rates for annuity business 4 The financial impacts are estimates based on observed market movements during these crises and are intended to provide a high level indication of the Group’s Solvency position in these scenarios

22
What is our exposure to interest rates?
Balance sheet Profit & loss
Resolute matching strategy Resilience improved during H116 UK risk margin – transitional reset Low guarantees in European savings
Business mix Av. yield significantly above guarantees Av. yield in GI 2.7%. New money c.1.8% Annuity volumes?

Shareholder assets (FY 2015)
Debt securities
£ million £ million % of portfolio
AAA 6,770 14.1%
AA 16,271 34.0%
A 13,145 27.4%
BBB 8,347 17.4%
Less than BBB 691 1.4%
Non rated 2,712 5.7%
Total 47,936 100%
• Conservative portfolio - minimal defaults
• 93% of non rated assets rated as investment grade internally
• Bank debt securities both senior and sub debt - £5.9bn
• Commercial mortgage portfolio o LTV 61% FY 2015
What is your exposure to credit?
23

24
IFRS Operating EPS
2016 – 2018 based on current consensus
2018 2017 2016 2015
49.2p
2014
48.3p
2013
44.2p
• Longer term earnings growth: mid single digit increase
• Growth in 2016 / 2017 may be challenged by uncertainty
• 2016 impacted by increased share count. Weighted average share-count increased by 8% on 2015
• Intention to pay progressive dividend throughout, even through uncertainty
• EPS driven by quality core franchises and not predicated on large scale M&A
1. Restated to exclude amortisation and impairment of acquired value of in-force business, which is now shown as a non-operating item. This is consistent with the calculation of 2014 and 2015 operating EPS
1
What is the outlook for operating EPS?

25
Dividends
• We aim to reach a 50% pay-out ratio in 2017
– Allows for balance between cash flow and growth
– 50% pay-out ratio not a ceiling on capital return
• From FY18 onwards: DPS in-line with operating EPS
Pay-out ratio
2015 2014 2013
50%
34% 37%
42%
2017 & beyond
1. Restated to exclude amortisation and impairment of acquired value of in-force business, which is now shown as a non-operating item. This is consistent with the calculation of 2014 and 2015
1
When will we reach our dividend pay-out target?

26
FY15
Dividends
BU generation
Centre costs & debt
2018
180%
Cumulative 2016 – 2018 position
Not to scale
What funds the dividend?
Business unit generation • FY 16–18 capital generation
covers dividend
• Ongoing c.20pts of generation
Remittance expectation 80% - 100% of capital generation

27
What is our approach to capital management?
Investment Capital return
• Organic growth – to fuel additional dividends or capital return in future over and above guidance
• Bolt on M&A to strengthen positions
(e.g. RBCI in Canada)
• Share repurchase considered in the medium term if market conditions and financial position allow
• Repayment of expensive debt or other forms of liability management
• Complete upward rebasing of the dividend to 50% operating EPS pay-out ratio cover by 2017 • Sustainable long term dividend growth from 2018 onwards
Balanced approach to excess capital – with investment and return both on the agenda

28
How will Aviva’s business mix result in growth? (UK)
Aviva Investors
General Insurance
Life
2016 – 2018 ambition Opportunities Challenges
• DC & platform flows • Annuity & protection new business • Expenses
Low to mid single digit CAGR • Heritage run-off • Fee margin compression • Brexit
• HomeServe + TSB • Expenses • A&H • CSR
Mid single digit CAGR • Low yields – investment income
Double digit CAGR • Expenses – investment for growth • AIMS • Rate card • FL – integration • UK Life – increased asset capture

29
50% pay-out ratio 2017
£7bn cash remittances 2016 -2018
Operating profit Cash Dividend
Our expectations
Mid-single digit growth in medium term

UK Life 6 July 2016
Andy Briggs
2015 UK Life results including 12 months of Friends Life, excluding PMI & Ireland. Results below UK Life level are an internal view and are unaudited.

31
What we are here to answer
What is the size and growth potential of the UK Life market?
What is the quality of Aviva’s UK Life franchise?
How will we win in this market?
How does UK Life support the ‘True Customer Composite’?
How do we make money in UK Life?
How fast can we grow?
What cash will we deliver to Group?

32
Aviva’s market leading position and competitive advantage will drive cash flow plus growth
Leading position in
growing markets
Competitive advantage from multi-line model
Low to mid single digit earnings growth
£3.5 – 4.0bn
cash remittances (2016 – 18)

33
We expect UK Life Market assets to double over the next 10 years1
1 Excluding DB 2 Long term savings includes workplace, platform and individual pensions; legacy includes with profits (excluding PruFund) bonds and savings Sources: Aviva analysis based on ABI and Purple Book
Asset flows
Decumulation
Customer Assets
Accumulation
Legacy c.£275bn assets c.-10% CAGR
Protection £1.0bn p.a. premium 1-3% CAGR
Private DB pensions £1.3tn assets c.0% CAGR
Annuities & equity release £350bn assets; 1-3% CAGR
£25bn p.a. flows; 2-6% CAGR Long term savings2
£1.0tn assets 6-11% CAGR

34
£83bn assets c.20% UK Life profits
£1.7bn in-force premiums
£230m new premiums
£52bn assets
£3.8bn premiums
Workplace £51bn assets
Platform £3.2bn net flows
Aviva has strong, scale market positions
Long term savings Annuities & Equity Release
Protection Legacy
2nd
1st 1st
1st
1st
5th

35
Sustainable competitive advantage from our multi-line model
Cost Economies of scale
Capital Significant diversification
Customer Strong brand
49%
37% 32%
2015 Peer Group Aviva 2015 Expected withFull Synergy
34% cost advantage
19
10
Undiversified UKL Diversified Group Diversified
UKL cost:income ratio, % Customer spontaneous awareness, %
47% benefit
8.4
15% benefit
SCR diversification, £bn
Source: Aviva / ICM brand tracker survey 2015
Pension Protection Savings
Aviva
Peer Avg.

36
Our market leading position and competitive advantage drives low to mid single digit growth in IFRS earnings…
… and £3.5 - 4.0bn cash remittances to Group (2016-18) supported by capital generation
£130m
£520m
£180m
£350m
£260m £1,450m
Long TermSavings
Annuities &Equity Release
Protection Legacy ManagementActions
2015 IFRSOperating Profit
Low-mid
single digit
CAGR

37
Long term savings: Aviva leading in workplace
• c.80% of new premiums from existing schemes
• Engaging directly with businesses and employees
• Award winning platform
• Co-developing new solutions with Aviva Investors
Source: Aviva analysis Source: 2015 Company reports Note: Aegon includes Blackrock
300
600
950
2015 2025
51 39
30
Aviva Standard Life Aegon
7-12% CAGR
Bundled Workplace AUA, £bn Market AUA, £bn
Strong market growth … generating value Aviva in #1 position…

38
Aviva a challenger… Strong market growth
Long term savings: Aviva challenging in Adviser and Consumer platform
• Broad distribution reach
• In-house advice
• Migration to single platform
• New business flows to Aviva Investors1:
• 32% adviser
• 60% consumer
…with key advantages
Source: 2015 Company reports 1 Excluding cash investments
435
1,000
1,600
2015 2025
9-14% CAGR
6.6
4.4 3.7 3.5 3.2
HargreavesLansdown
StandardLife
Aegon Cofunds(L&G)
Aviva
Market AUA, £bn Platform net flows, £bn
Source: Aviva analysis

39
Long term savings: Expecting significant growth in assets and profits
Growing assets…
Note: Long term savings includes Workplace, Platform and Individual Pensions
…with stable margin
£2.8bn
£1.2bn
£83.6bn
£87.6bn
Opening Assets
Net Fund Flows
Market Movements
Closing Assets
£228m
£130m
£(98)m
EB
NB
Total OP
Margin 27bps
NB cost £98m
Stable margin 25-30bps
Stable NB cost c.£90-100m
2015 2015 2016-20

40
Annuities & Equity Release: Strong market position
Moderate market growth
• Increased appetite for bulks • Maintain leadership in equity release and individual annuities
Aviva in #1 position
Source: Aviva analysis 1 NB premiums are from company reports and are the total of bulk annuities, longevity insurance, individual annuities and equity release on a PVNBP basis
350 375
475
2015 2025
25 30
45
2015 2025
1-3% CAGR
Market AUA, £bn NB Premiums, £bn 2015 NB Premiums1, £bn
2-6% CAGR
3.8 3.5 3.1 2.9
3.8
Aviva PIC RothesayLife
Scot.Widows
L&G

41
Annuities & Equity Release: Strong capability in asset origination and longevity
• New business appetite for 80% illiquids • Additional illiquids for back book
Diverse range of illiquid assets
• Enhancing underwriting with customer data • Selective reinsurance to manage longevity risk
Longevity expertise
Assets backing annuities, 2015
1 Excluding Friends Life
1
27%
11%
5% 21%
36%
CommercialMortgagesEquity Release
Infrastructure
Gilts & Cash
Corporate Bonds
£50bn liabilities c1.3m lives
200+ years experience
10m life years exposure
100% underwritten • 30% medical / lifestyle • 70% age & postcode
42
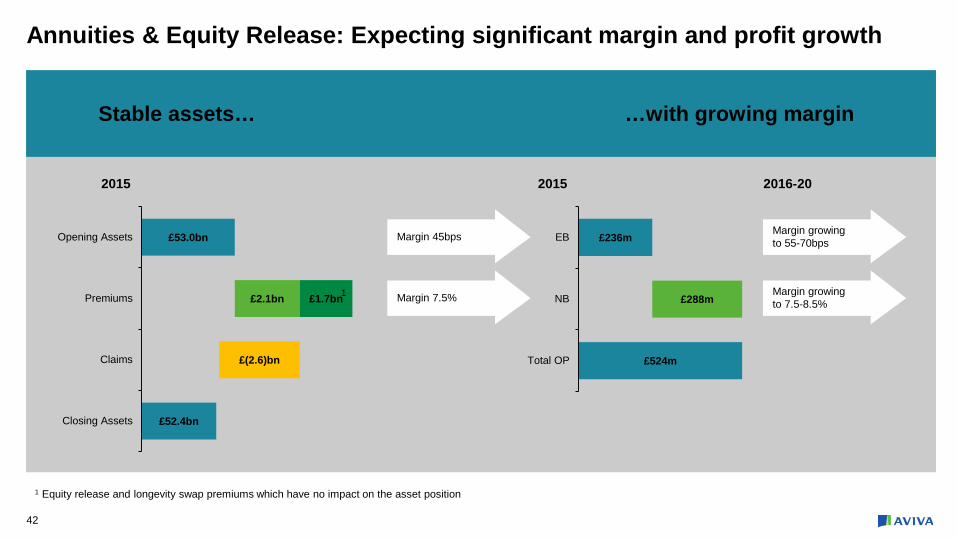
Annuities & Equity Release: Expecting significant margin and profit growth
Stable assets… …with growing margin
1 Equity release and longevity swap premiums which have no impact on the asset position
£53.0bn
£52.4bn
£2.1bn £1.7bn
£(2.6)bn
Opening Assets
Premiums
Claims
Closing Assets
£236m
£524m
£288m
EB
NB
Total OP
Margin 45bps Margin growing to 55-70bps
Margin 7.5% Margin growing to 7.5-8.5%
2015 2015 2016-20
1

43
Protection: Attractive financials for scale players
• c.60% of individual sales from
long-term partnerships e.g.:
• Platform investment, delivering c.75% straight through
• Digital and TCC opportunities
Stable market Aviva a market leader… …with real advantages
Source: 2015 company reports & PRA returns
1.0 1.1
1.4
2015 2025
1-3% CAGR
231 230
115 75
56
L&G Aviva Zurich Unum RoyalLondon
Market AUA, £bn NB Premiums, £m APE
Source: Aviva analysis

44
Stable premiums… …with growing margin
Protection: Expecting significant margin and profit growth
£1.7bn
£1.7bn
£0.2bn
£(0.2)bn
Opening Premiums
New Premiums
Run Off
Closing Premiums
£116m
£182m
£66m
EB
NB
Total OP
Margin 7%
Margin 28%
Margin growing to 7.5-8.5%
Margin growing to 40-50%
2015 2015 2016-20

45
Legacy: Driving deeper customer relationships to create long term value
• Legacy run off c.10% p.a.
• Focus on cost and capital
• Engaging customers digitally
Legacy run off… …with stable margin
£83.2bn
£91.2bn
£(0.2)bn
£(7.8)bn
Closing Assets
Market Movements
Net Fund Flows
Opening AssetsLegacy delivers c.20% of UK Life profits
Total OP £350m Margin 38bps Margin 35-40bps
2015 2015 2016-20

46
Deeper relationships with customers, businesses and intermediaries
Focus on mass market / mass affluent Customers
Digital First
Channels
TCC Opportunities
Long term savings
Annuities & Equity Release Protection Legacy
MyAviva
Products
Corporate wrap Aviva for Advisers Consumer platform
Workplace Intermediated Digital direct
Aviva Investors GI Health

UK Life Financials 6 July 2016
Jason Windsor
2015 UK Life results including 12 months of Friends Life, excluding PMI & Ireland. Results below UK Life level are an internal view and are unaudited.

48
Aviva’s market leading position and competitive advantage will drive cash flow plus growth
Exis
ting
busi
ness
N
ew b
usin
ess
2015 OP £m
2015 opening assets / premium £bn
Market growth
2016-20 margin, = 2015 margin
Long term savings
Annuities & ER
Protection
Legacy
Long term savings
Annuities & ER
Protection
Management actions
228
236
116
350
(98)
288
66
83.6
53.0
1.7
91.2
3.8
0.2
Total £1.45bn1
6-11%
1-3%
Stable
c.-10%
6-11%
2-6%
1-3%
£150 – 200m
£(90) – (100)m NB costs
0bps 80bps
0bps 80bps
0bps 80bps
5% 10%
5% 10%
0% 80%
25 30
55 70
7.5 8.5
40 35
8.5 7.5
40 50
259 Low to mid single digit growth
2015 margin
27bps
45bps
7%
38bps
7.5%
28%
1 2015 UK Life results including 12 months of Friends Life (with c.£60m from Q1 2015), excluding PMI & Ireland

49
Reducing cost profile: strong track record of cost efficiency
• UK Life integration delivered £113m run-rate savings; £73m realised in 2015 • Cost:income ratio expected to reduce to c.32% over the next three years (2015: 37%)
£612m
£442m
£967m £865m
£525m
£73m £29m
2012- Aviva
2014- Aviva
2014- Friends
2014 - Total
IntegrationSavings
OtherSavings
2015- Total
Operating Expenses

• Cash remittances supported by capital generation • Minimal new business strain – as cost and capital efficiency delivered
50 1 UK & Ireland and includes debt interest Phasing of dividends to Group may vary
£3.5 – 4.0bn of planned cash remittance over next 3 years
£2.5bn to £3.0bn
Cash Remittance1
£3.5bn to £4.0bn
Post tax£1.16bn
Tax£0.29bn
£1.45bn
2015 OP
Low to mid single digit CAGR
Low to mid single digit
CAGR
£0.8bn
£1.0bn
2015 2016 2017 2018 Special Dividends
51
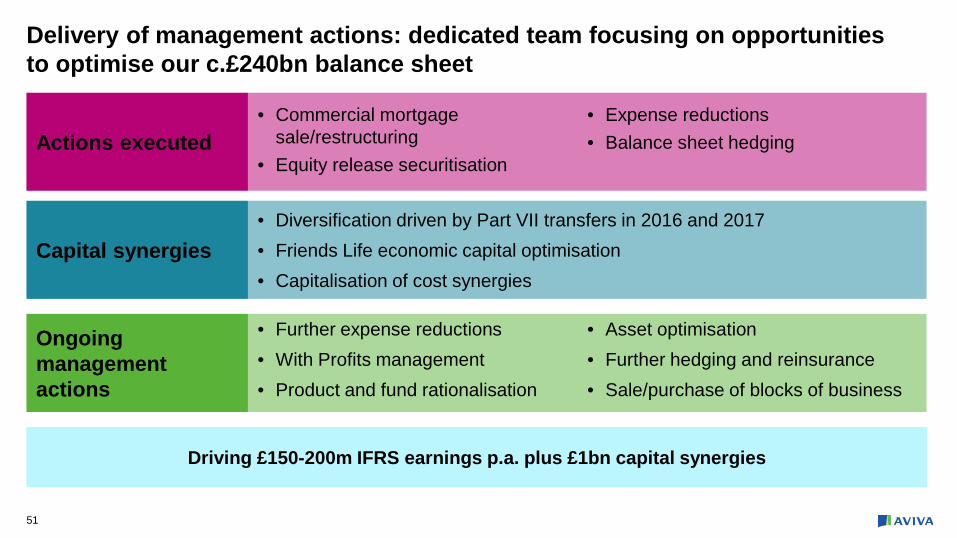
Delivery of management actions: dedicated team focusing on opportunities to optimise our c.£240bn balance sheet
• Commercial mortgage sale/restructuring
• Equity release securitisation
• Expense reductions • Balance sheet hedging Actions executed
Capital synergies
Ongoing management actions
• Diversification driven by Part VII transfers in 2016 and 2017 • Friends Life economic capital optimisation • Capitalisation of cost synergies
• Further expense reductions • With Profits management • Product and fund rationalisation
• Asset optimisation • Further hedging and reinsurance • Sale/purchase of blocks of business
Driving £150-200m IFRS earnings p.a. plus £1bn capital synergies

52
Balance sheet: Strong capital position and low market sensitivity
UK Life Solvency II ratio
Risk reduction
Excess capital
Minimum Capital requirement (“MCR”)
FY15: 156% coverage ratio
100% Solvency Capital Requirement (“SCR”)
Not to scale
Equities movement (decrease)
-10% -25%
Interest rates -25bps
Corporate bond spreads
+100bps
Longevity shock
155% 153% 155% 154% 147%
Working range

53
Aviva’s market leading position and competitive advantage will drive cash flow plus growth
Leading position in
growing markets
Competitive advantage from multi-line model
Low to mid single digit earnings growth
£3.5 – 4.0bn
cash remittances (2016 – 18)

Aviva Investors Accelerating Profit Growth 6 July 2016
Euan Munro Chief Executive Officer, Aviva Investors

Where is Aviva Investors today?
How will we win?
What does success look like?
55
What we are here to answer

56
AI – Low cost, scale manufacturer; 3% Group profits
AIMS TR AIMS Income + Incubators
2015 £105m 33% increase on 2014
84% vs BM
£300bn AUM Multi location
Multiple asset classes
Scale New Solutions Investment Performance
Profit Recovery

57
AI – Transforming to strong profit contributor
Share price
growth Transformation
journey Demand for
outcome orientated solutions
Winning faster with Aviva
Half way
5 year turnaround Strong indicators
Product co-creation Digital
Illiquid origination
Low interest, high volatility world
Ageing population
Double digit profit CAGR
Higher earnings multiple
58
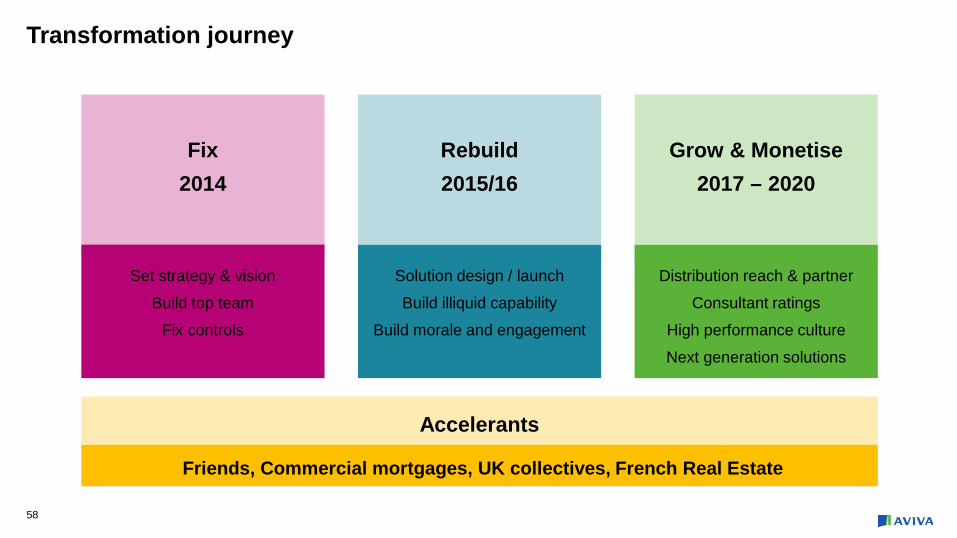
Transformation journey
Set strategy & vision
Build top team
Fix controls
Fix 2014
Solution design / launch
Build illiquid capability
Build morale and engagement
Rebuild 2015/16
Distribution reach & partner
Consultant ratings
High performance culture
Next generation solutions
Grow & Monetise 2017 – 2020
Friends, Commercial mortgages, UK collectives, French Real Estate
Accelerants
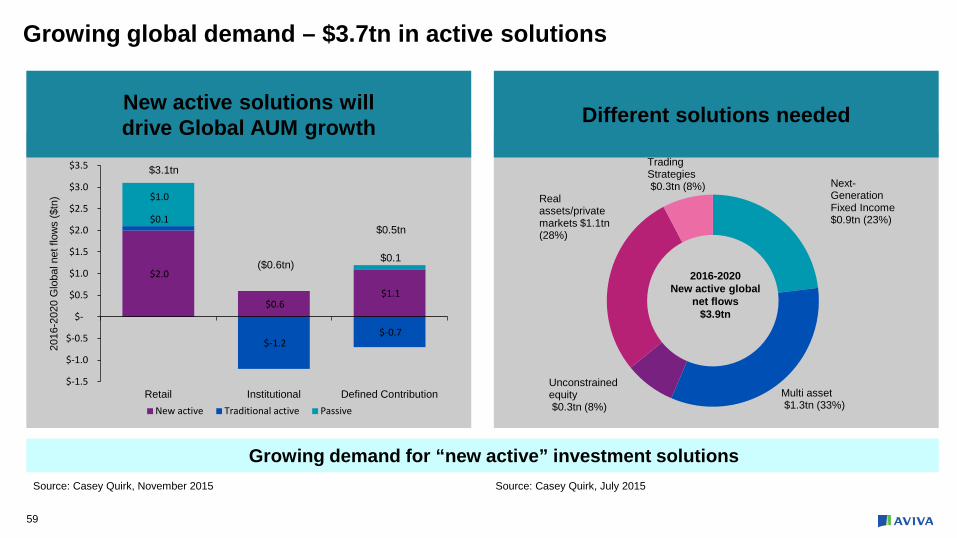
New active solutions will drive Global AUM growth Different solutions needed
59
Source: Casey Quirk, November 2015
Growing global demand – $3.7tn in active solutions
Growing demand for “new active” investment solutions
$2.0
$0.6 $1.1
$0.1
$-1.2 $-0.7
$1.0
$0.1
$-1.5
$-1.0
$-0.5
$-
$0.5
$1.0
$1.5
$2.0
$2.5
$3.0
$3.5
Retail Institutional Defined Contribution
2016
-202
0 G
loba
l net
flow
s ($
tn)
New active Traditional active Passive
$3.1tn
($0.6tn)
$0.5tn
Source: Casey Quirk, July 2015
Next-Generation Fixed Income $0.9tn (23%)
Multi asset $1.3tn (33%)
Unconstrained equity $0.3tn (8%)
Real assets/private markets $1.1tn (28%)
Trading Strategies $0.3tn (8%)
2016-2020 New active global
net flows $3.9tn

60
Early Consultant & Distribution platform adoption
• 6 confirmed “Buy” ratings
• 5 on Positive Watch
• Growing platform adoption - Barclays, HSBC, UBS, BNP
0.4
1.2 1.2 1.3
1.7
00.20.40.60.8
11.21.41.61.8
2
H2 2014 H1 2015 H2 2015 Q1 2016 Q2 2016
Net
Flo
ws
£bn
Key
AIMS target return AIMS target income
0.3
2.4 3.4
4.5
0.1
0.6
0.9
1.5
0.2 0.4
3.0
4.3
6.0
0.0
1.0
2.0
3.0
4.0
5.0
6.0
7.0
AUM
£bn
Good early proof points … Assets building strongly AIMS - Quarterly Net Flows AIMS - Closing AUM
AIMS approvals

61
(4,500)
(3,000)
(1,500)
0
1,500
3,000
Aviva Investors Henderson Standard Life Legal & General Aberdeen AssetManagement
Schroders M&G
Property
Miscellaneous
Fixed Income
Equity
Convertibles
Commodities
Alternative
Allocation
Strong Q1 wholesale net flows growth has placed Aviva Investors above major competitors despite industry’s ‘worst Q1 in over 20 years’ Q1 2016 Morningstar Retail and Institutional global net flows by asset class (£m, excl seg, MM and ETF)
Good early proof points… Market leading flows
Performance vs Peers

Winning faster with Aviva
Leverage / replicate across Aviva Markets
Co-creation of innovative products DB/DC
Adviser and consumer platforms
Higher share of Aviva platform
business
Annuity and Equity Release
Illiquid origination solutions
Multi Channel
Digital
Workplace savings
62

What success might look like
Sound bite
Comment
How would you describe where we have got to on our journey?
2016 2017 2018 2019 2020
Status
Revenue % external
Profitability
How would competitors describe us?
What % revenue from external clients?
What’s our operating profit margin %?
Transformation
One to watch
30%
25%
Delivering growth
Winning mandates
33%
27%
Diversified excellence
Credible competition
37%
30%
Significant contribution to Group profits
Leading in UK solutions
43%
35%
Global leader in Solutions provider
of choice
Serious global competitor
50%
40%
63

1 Right solutions for today's environment
2 Flows now positive; expect to accelerate with Aviva distribution
3 We are already on a growth track
64
Growing from a position of strength UK General Insurance 6 July 2016
Maurice Tulloch Chairman, Global GI

UKGI is uniquely well-positioned in the market
Multi-channel, multi-product
Scale and core capabilities provide
competitive advantage
Sustainable earnings and dividends
Number one Diversified business
Proven track record – resilient
performance
Why we win
Leading UK General Insurer
66

What we are here to answer
How do we exploit our market scale advantages?
How do we maintain and strengthen our diversification?
What are our sustainable sources of competitive advantage?
How we will win and grow our business
67

Recognition
Strong brand, quality customer franchise
General Insurer of the Year 2014 & 2015
Performance 2014 & 2015 COR 95%
£100m cost reduction in last 2 years
68
Scale £4bn GWP & 11%
market share
Advantages in procurement, data and service
Number 1 UK General Insurer

Products
Well-diversified, customer-focused portfolio
Diversified business
Personal Motor, 27%
Home, 17%
Personal Specialty,13%
Commercial Motor, 14%
[CATEGORY NAME], [VALUE]
Commercial Specialty, 12% Digital Direct,
35%
Retail Partners, 13%
Banking Partners, 25%
Brokers, 27%
Aviva UKGI FY15 GWP, % Aviva Personal Lines FY15 GWP, %
Channels
69

Dec Floods
Operating Profit
• £1.1bn cash paid to Group since 2012 • 2016-2018 forecast range £0.9 - 1.2bn
Strong track record – resilient performance
Resilient earnings and dividends across the insurance cycle
Net Cash Remittance
Reported COR
UK GI Market FY15 COR %
£368m
£249m
£214m £212m
£154m £37m
LTIR
Underwriting
Mid single digit CAGR
FY15 FY12 FY18
*FY12 LTIR adjusted to reflect FY15 AGH Loan value
95.1%
+0.6pp
December Floods
98.3%
94-96% Target
94.8%
FY15 FY12 FY18 FY14
81.0% 94.0% 95.1% 96.1% 97.1% 97.8%
99.5% 102.0% 102.6%
109.5%
Admiral DLG Aviva LV AXA eSure RSA Ageas Allianz Zurich
70

Pers
onal
Lin
es
Com
mer
cial
Lin
es
Market growth and COR
2016-20 growth ambition
Personal Motor
Homeowner
Personal Speciality
Commercial Motor
Property/ Liability
1-2%
2-4%
6-10%
Mid single digit
Market outlook and UKGI ambition
Level 98-102%
Level 92-97%
3-5% 94-96%
0-1% 98-102%
0-4% 92-97%
Level
3-6%
Total
98 87
91 86
94 28
99 45
94 123
GWP £bn
1.1
0.7
0.5
0.6
1.2
95 368 4.0
2015 COR
% Op profit
£m
71

Excellence in
Pricing & Underwriting Powered by Analytics
Innovative Indemnity
Management & Fighting Fraud
Leading Digital Capability Growing Direct Business
Strong Results across our Products
Routes to Growth
Why we will win
72

Personal Motor
Exploiting our scale and growing digital
Personal Motor GWP by channel Personal Motor COR Why we will win:
• Growing the Digital business – Low cost manufacturer
• Further sophisticated underwriting techniques
• Continued investment in automation and analytics
2013 2014 2015
51% 55% 58%
46% 43% 40%
£1,065m £997m
£1,073m
Partners
Digital
Brokers
80.0% 81.0% 84.7%
8.5% 8.0%
7.8%
7.7% 8.4% 5.4%
2013 2014 2015
96.2% 97.4% 97.8%
Claims
Commission
Expenses
73

Commercial Lines
#1 in the Commercial Market
Commercial GWP by channel Commercial COR Why we will win:
• #1 SME largest distribution footprint
• Targeted and controlled expansion
• Market leading policy management – Guidewire and Automation
• Exploiting commercial composite advantage – TCC
2013 2014 2015
63% 62% 61%
37% 38% 39%
£1,717m £1,694m £1,719m
Large Corporate
SME 68.0% 59.9% 63.6%
21.5% 20.5% 20.2%
13.2%
12.5% 12.0%
2013 2014 2015
Claims
Commission
Expenses
102.7%
92.9% COR
95.8%
74

Home
Broadening product and distribution
Home GWP by channel Home COR Why we will win:
• Growing digital – Revitalising the home proposition
• Partner of choice for most banks – New TSB deal
• Analytic sophistication – Flood mapping
• Service excellence leads to higher retention – Flood TNPS +60% 2013 2014 2015
58% 58% 58%
26% 25%
23%
£814m £769m
£677m
Partners
Digital
Brokers
16% 17% 19%
44.9% 48.7% 50.2%
32.9% 34.8% 29.9%
9.5% 9.6% 10.5%
2013 2014 2015
87.3% 93.1%
90.6%
Claims
Commission
Expenses
75

c
76
Excellence in Pricing and Underwriting

77
Innovative Indemnity Management
c

78
Total Customer Composite
Distribution Management
Market
Expanded & New Lines
Hardening market conditions
Deeper relationships leveraging our core competencies, and unparalleled brand reach
Exploiting the power of the focussed composite
Expanding our products and propositions – Home, Corporate business, Speciality propositions, Prevention Services, Cyber
Routes to growth

79
UKGI is uniquely well-positioned in the market
Multi-channel, multi-product
Scale and core capabilities provide
competitive advantage
Sustainable earnings and dividends
Number one Diversified business
Proven track record – resilient
performance
Why we win
Leading UK General Insurer

Digital first 6 July 2016
Andrew Brem Chief Digital Officer

81
What we are here to answer
What is our digital strategy?
Do we have the capabilities to deliver it?
Are customers responding to it?
How does it deliver to the bottom line?

82
Clear digital strategy and vision
Three strategies to compete
1. Digital direct
2. Multi-access Max
3. Digital ecosystems ‘Affinity 2.0’
Digital unlocks TCC
Deliver an outstanding customer experience
Build more and deeper customer
relationships
Create leading composite propositions
Culture, Capabilities, Execution

For customers
Ultimate tailoring One-Click convenience Customer-level pricing
For Aviva
True customer composite Average product holding
Lifetime value
83

84
Public websites
The Aviva Customer Experience Toolkit
MyAviva portal Customer tools Agent tools Apps
Customer facing digital ecosystem

85
Digital engineering
World-class digital capabilities from two Garages
Digital marketing Customer analytics
Digital business units in markets
London Singapore
UK Digital France Asia Poland Canada
Digital product and design

UK Digital
86
Our journey to connect with our 16m UK personal customers

Digital first 6 July 2016
Blair Turnbull MD, UK Digital

UK market remains attractive and presents growth opportunities
60
70
80
90
100
UK USA CAN AUS SGP EU
%
91% internet usage 30% of retail & travel via mobile/tablets – forecast to rise to 45% by 20201
40% prefer to manage financial products online2
70% view bank statements online3
88
World Bank / International Telecoms Union 2014 1. Forrester/PayPal, 2016 2. Aviva Consumer Attitudes Survey, ICM March 2016 3. Aviva Consumer Attitudes survey, ICM 2013

89
Customers need more from insurers
Confusing
Today…
31% of UK consumers prefer one insurance and savings provider1
1. Aviva Consumer Attitudes Survey, ICM March 2016 2. Aviva / GFK June 2016
Low trust Poor engagement
Don’t reward loyalty
51% of MyAviva users prefer one insurance & savings provider2
Preference for one provider

90
Travel, Home, Health - pre-calculated quotes
Customer loyalty - 20% customer discount
Change of personal details - once for all products
MyAviva

91
Leading indicators positively supporting UKD business model
Customer registrations
Loyalty & longevity
Transactions
Engage & repeat
Visits
Customer experience
Policies available on
MyAviva Single
database
Single customer database
1.8m
2.8m
Jan 15 Apr 16
Registrations
51k 70k
Direct sales per month
9
32
Other MyAviva
Jan 15 Apr 16
8.6m
Jan 15 Apr 16 Dec 16
16m
4.5m
Jan 15 Apr 16
4.3 average logins p.a 5.2
700k
350k
MyAviva logins per month
Net Promoter Score, Jan 161
1. Aviva / GFK Analysis, 2016

92
Positive composite and retention lead indicators
Customer registrations
Loyalty & longevity
Transactions
Engage & repeat
Visits
Customer experience
78% Customers with multiple products reaching 5+ years
New business customers register for MyAviva 70%
MyAviva annual visits by retirement customers 12x 1.5 1.8 2.5
UK Direct MyAviva
2.5
Propensity pensions customers to buy travel insurance 10x +32
MyAviva Net Promoter Score customers 1
Average policy holding
As at April 2016
1. Aviva / GFK Analysis, 2016

93
0
100
2010 2015
GI u
nit c
ost*
(in
dexe
d)
-40%
Claims 730,000 p.a.
Telephone calls 13m p.a.
Letters 30m p.a.
Significant opportunity for digitising operational processes
40% unit cost efficiencies delivered through GI digitisation since 2010 Similar opportunities in Life and pan UK,
with pilot activity in progress
* Motor operating expenses per policy in force

94
Scenario: New customer purchasing a home policy, modelled over 5 years
30% lower total
costs
Shared with
customers
For illustration purposes only. Projected 5 year financial profile for new customers purchasing Home insurance. Bars represent each component as a proportion of total projected net premium over 5 year period. Customer discount incorporated for illustration. Includes single product income stream only. All cash flows non-discounted. Intermediated Personal Lines Software House business (excludes High Net Worth and Schemes business). Based on Feb 2016 data.
Unique benefits from digital and existing customers, especially retirement
Intermediatednew customer
UKD retirementcross-sale
Customer discount
Contribution
Acquisition
Operating costs
Claims cost

95
Plan to double earnings by 2018
Lead indicators
2016 2018
£300m
£150m
Digital direct operating profit
Current position Key:
Single customer database
Registrations
0
24 6
8
10Millions
Average product holdings
0
12 3
4
5Number of products
0
812
16Millions
4

96
Why we will win
16m customers
Composite
Single customer view
Analytics and pricing
Brand strength

97
What we have answered today
Balance sheet Strong and proven resilience
UK franchises Scale, strength, consistency, growth, composite
Profit Mid-single digit growth in medium term
Dividend 50% pay-out ratio in 2017
Cash flow £7bn remittance (2016-2018)
Capital management priorities Progressive dividend paramount Surplus: invest and return
Digital and TCC Unique competitive advantages in the UK

98
1 Resilient balance sheet
2 Growing core franchises
3 Sustainable dividend growth

Aviva Capital Markets Day 6 July 2016