Aviation Strategy intensive and the product itself has a very short shelf life. ... new airline...
24
T he airline industry is in recovery from the worst recession in its history. It must be so. The data from individual airlines and from the industry associations shows very strong improvements in traffic and yields (see last month's Aviation Strategy). Global traffic levels have returned to the peak levels seen in 2008. Premium cabins – the bedrock of long-haul profitability – have, according to IATA, seen year-on-year percentage growth in pas- senger numbers (at least on long-haul services) sufficient to sug- gest that the demand is really recovering from the halt in the world economy that appeared after the collapse of Lehman Bros at the tail end of 2008. In 2009 the global industry saw passenger yields slump by an unprecedented 13% - so it should hardly be surprising that individual airlines are reporting substantial improvements in traffic yields and total revenues as we go through the rebound. IATA keeps on upgrading its forecasts for the global industry profitability. We are definitely on an uptrend and the consensus seems to suggest a recovery leading to a peak of the current cycle by 2013/14 at least. Have the financial markets taken this totally on board? Airlines are not a “must-have” sector for most investors. Accounting for less than 2% of global market equity capitalisation (albeit account- ing for a far higher overall proportion of global GDP), one can per- haps understand that any airline investment may be treated as a marginal choice by most professional investors. The airline indus- CONTENTS Analysis Airline share performance 1-3 Ryanair’s zero-growth strategy 3-4 Briefing Monarch Airlines: Last of the large independents 5-7 Southwest acquires AirTran and access to Atlanta 8-14 Management Operational management: The quest for “unremarkable service” 15-19 Databases 20-23 European, US and Asian airline traffic and financials Regional trends Orders October 2010 Issue No: 156 Aviation Strategy What the stockmarkets are saying PUBLISHER Aviation Economics James House, 1st Floor 22/24, Corsham Street London N1 6DR Tel: +44 (0)20 7490 5215 Fax: +44 (0)20 7490 5218 email: [email protected] www.aviationeconomics.com 1Q ‘09 2Q ‘09 3Q ‘09 4Q ‘09 1Q ‘10 2Q ‘10 3Q ‘10 300 250 200 150 100 50 650 700 Ryanair United (rt. hand scale) Lufthansa Cathay SELECTED AIRLINE SHARE PRICE RECOVERY (INDEXED TO THE TROUGH IN MARCH 2009) 200 250 300 350 400 450 500 550 600 100 150 50 350
Transcript of Aviation Strategy intensive and the product itself has a very short shelf life. ... new airline...

The airline industry is in recovery from the worst recession in itshistory. It must be so. The data from individual airlines and
from the industry associations shows very strong improvementsin traffic and yields (see last month's Aviation Strategy). Globaltraffic levels have returned to the peak levels seen in 2008.Premium cabins – the bedrock of long-haul profitability – have,according to IATA, seen year-on-year percentage growth in pas-senger numbers (at least on long-haul services) sufficient to sug-gest that the demand is really recovering from the halt in theworld economy that appeared after the collapse of Lehman Brosat the tail end of 2008. In 2009 the global industry saw passengeryields slump by an unprecedented 13% - so it should hardly besurprising that individual airlines are reporting substantialimprovements in traffic yields and total revenues as we gothrough the rebound. IATA keeps on upgrading its forecasts forthe global industry profitability. We are definitely on an uptrendand the consensus seems to suggest a recovery leading to a peakof the current cycle by 2013/14 at least.
Have the financial markets taken this totally on board? Airlinesare not a “must-have” sector for most investors. Accounting forless than 2% of global market equity capitalisation (albeit account-ing for a far higher overall proportion of global GDP), one can per-haps understand that any airline investment may be treated as amarginal choice by most professional investors. The airline indus-
CONTENTS
Analysis
Airline share performance 1-3
Ryanair’s zero-growth strategy 3-4
Briefing
Monarch Airlines:Last of the large independents 5-7
Southwest acquires AirTran and access to Atlanta 8-14
Management
Operational management: The questfor “unremarkable service” 15-19
Databases 20-23
European, US and Asian airline traffic and financials
Regional trends
Orders
October 2010Issue No: 156
Aviation Strategy
What the stockmarkets are saying
PUBLISHER
Aviation Economics
James House, 1st Floor22/24, Corsham Street
London N1 6DR
Tel: +44 (0)20 7490 5215Fax: +44 (0)20 7490 5218
email: [email protected]
www.aviationeconomics.com
1Q ‘09 2Q ‘09 3Q ‘09 4Q ‘09 1Q ‘10 2Q ‘10 3Q ‘10
300
250
200
150
100
50
650
700
Ryanair
United
(rt. hand scale)
LufthansaCathay
SELECTED AIRLINE SHARE PRICE RECOVERY(INDEXED TO THE TROUGH IN MARCH 2009)
200
250
300
350
400
450
500
550
600
100
150
50
350

try encompasses two basic seemingly incom-patible economic fundamentals – it is highlycapital intensive and the product itself has avery short shelf life. Revenue is a function ofdemand and price; in the upturn demand issufficient to absorb almost any priceincrease; in the downturn the price is neversufficient to catch the falling demand. Giventhis operational gearing it may hardly be sur-prising to see that the airline share priceshave high betas and display significantvolatility in comparison with the underlyingstock markets.
The operational peak of the last industrycycle appears to have occurred in the firsthalf of 2008. Stock markets, with their usualprescience, provided peak share prices dur-ing the first half of 2007 (and not just for air-lines). The old rule of thumb had been thatin the downturn of the airline industry shareprices would halve (only to double again inthe upturn): but in this financial crisis andglobal recession, stock markets also halvedin value and the airlines were hit even hard-er (almost as hard as the banks themselves).In the sample of carriers shown in the tableon page 3 these declines averaged 75% frompeak - although the share prices of thosesuch as American, United and GOL fell bymore than 90%; BA, Air France and Delta bymore than 80%; and even easyJet, Ryanairand Southwest, let alone Lufthansa andIberia, by around 70%.
The markets touched their nadir in March2009 at the depths of the level of economicconfidence and have at least bounced backreasonably strongly. The London market as awhole – beset even by the woes in the UKeconomy and despite the weakness in ster-ling – has recovered (albeit as if on a roller-coaster through the summer) to a pointwhere the FTSE 100 index stands a mere16% below the peak of 2007. This sample ofairlines have seen their shares recoverstrongly – on averaging trebling from thetrough. Some of those that were particularlybadly hit in the downturn have recoveredfaster as one might expect – with United'sshare price in particular increasing eightfold(alright – it did do the long awaited deal withContinental) and that of GOL by six-fold.
Some of the recovery euphoria did not
quite last the full year 2009 results seasonand the likes of American, Delta, Air Berlinand Vueling have seen their share prices fallby around 35% from peaks achieved inspring of this year. Most of the others arenow only a few points below the early yearpeaks – while four notable exceptions(Cathay, United, Lufthansa and Ryanair, seegraph on page 1) are at their highs of thisrecovery period. Most are still at half thevalue they achieved in the peak of the lastcycle; the two major exceptions beingCathay and Air Asia - respectively 2% and 3%above the highs achieved in 2007.
Those two may be the anomalies; butreflect the current euphoric trading condi-tions in China and the Far East in comparisonwith the continuing slow and halteringdevelopments in economies in Europe andthe US – pointing if anything to the two-tonenature of the economic recovery with thedeveloping nations leading the way -(although interestingly SIA is still 20% belowthe 2007 peak). In addition there are stilldoubts of the shape of this recovery in thedeveloped economies; and with the need ofmany governments to unwind their fiscaldeficits there are fears that too rapid areduction in government spending will stiflethe potential growth and bring on a double-dip recession in 2011.
The table opposite attempts to tabulatethis and shows the share price performanceof a select group of quoted airlines (all datain local currency units). The first columnpicks up the high value achieved in the lastcycle – the timing for which varies for eachindividual carrier but generally took placeduring 2007. The second column shows thelow point achieved (mostly in March 2009)at the bottom of the market dive; the thirdshows the percentage change from the highin 2007 to the low in 2009 (P-T). The fourthand subsequent columns pertain to datasince that low point; the recent peak refersto highest share price level achieved sincethe low in 2009 and the fifth column is theabsolute percentage increase from the lowpoint (T-P). The sixth column reflects theclosing share price on Oct 8 and the seventh(P-C) shows the percentage fall from thatrecent peak. A value of zero in that column
Aviation Strategy
Analysis
2
Aviation Strategyis published 10 times a year by
Aviation Economics
Publisher:
Keith McMullan
Contributing Editor:
Nick Moreno
Contributing Editor:
Heini Nuutinen
Production Editor:
Julian Longin
Subscriptions:
Tel: +44 (0)20 7490 5215
Copyright:
Aviation Economics
All rights reserved
Aviation Economics
Registered No: 2967706
(England)
Registered Office:
James House, 1st Floor
22/24 Corsham St
London N1 6DR
VAT No: 701780947
ISSN 2041-4021 (Online)
The opinions expressed in this publication do
not necessarily reflect the opinions of the edi-
tors, publisher or contributors. Every effort is
made to ensure that the information con-
tained in this publication is accurate, but no
legal reponsibility is accepted for any errors
or omissions.
The contents of this publication, either in
whole or in part, may not be copied, stored
or reproduced in any format, printed or elec-
tronic, without the written consent of the
publisher.
September 2010

Ryanair, after a decade of phenomenalexpansion, will officially go ex-growth
from 2013. Passenger growth for FY2010(to March31st) was 14%, this year it will be11%, 9% in FY2012, 6% in FY 2013, thentwo years of zero growth maybe resumingat around 4% thereafter. As CEO MichaelO’Leary puts it, the “land grab” is over.
While the fundamental adherence tostrict cost disciple will remain, the revenuefocus will be on pushing up yields. Ryanair’syield performance, usually declining inrecent years, is largely the result of its rapid
growth: it has to generate the traffic to fillits additional capacity, at least in the earlystages of new route development.
This year yield growth will be in theorder of 5-7% and the aim by 2013 is topush the average fare (excluding ancillaries)up from €35 to €45. This should be emi-nently doable: apart from cutting out ultra-low incentive fares on new routes Ryanairwill be focusing on higher yielding markets.Its recent move into primary airports,notably Barcelona El Prat, is according tothe airline not the result of any change in
Aviation Strategy
Analysis
October 20103
means that the current share price is at thehigh. The final column shows how far below(or, rarely, above) the peak share price inthe last cycle shown in column 2. For marketcomparison we include the same data forthe FTSE, Hang Seng and S&P 500 indices inthe last three rows.
There has been strong airline share priceperformance since the depths of the reces-sion (some brave investors could have madea small fortune) and there may appear to befurther good upside as we move through thisnew airline cycle; but, as it says on the pack-et, shares can go down as well as up.
Peak
(2007)
Trough(late’08/
early ‘09) P-T
Recent
Peak T-P
Current
(8/10/10) P-C
Current/Last Cycle
Peak
Air Berlin 20.42 2.63 -87% 4.49 71% 3.1 -31% -85%
Air France/KLM 38.3 6.36 -83% 12.88 103% 11.84 -8% -69%
AirAsia 2.11 0.79 -63% 2.25 185% 2.17 -4% 3%
American 40.66 2.54 -94% 10.16 300% 6.35 -38% -84%
British Airways 577.5 109.9 -81% 266.1 142% 264.2 -1% -54%
Cathay 21.73 6.82 -69% 22.1 224% 22.1 0% 2%
Delta 22.79 3.93 -83% 14.93 280% 11.4 -24% -50%
easyJet 732 220.25 -70% 496.5 125% 451.6 -9% -38%
GOL 38.3 2.79 -93% 17.23 518% 17.23 0% -55%
Iberia 4.11 1.25 -70% 3.06 145% 3.04 -1% -26%
Lufthansa 22.62 7.3 -68% 14.33 96% 14.33 0% -37%
Qantas 6.05 1.42 -77% 3.02 113% 2.9 -4% -52%
Ryanair 6.33 1.97 -69% 4.11 109% 4.11 0% -35%
SIA 20.1 9.38 -53% 16.5 76% 16.18 -2% -20%
Southwest 18.15 4.99 -73% 13.95 180% 13.04 -7% -28%
United 51.49 3.13 -94% 26.44 745% 26.44 0% -49%
Vueling 46.7 3.08 -93% 14 355% 9.32 -33% -80%
FTSE 6732.4 3512.1 -48% 5825 66% 5661.6 -3% -16%
Hang Seng 31638.22 11015.84 -65% 23207.31 111% 23121.7 0% -27%
S&P 500 1565.15 676.53 -57% 1217.28 80% 1169.77 -4% -25%
LAST CYCLE RECOVERY - CURRENT CYCLE
SELECTED AIRLINE SHARE PRICE PERFORMANCE (LCU)
Ryanair in zero-growth mode

its own strategy but a change in the strate-gy of some primary airports which are des-perate to re-establish growth. Unlikely asit sounds, Ryanair will start promoting thequality of its service - it does have a case inthat it is Europe’s top performer in terms ofpunctuality, despatch reliability and mis-laid baggage.
The issue for Ryanair then becomes:how to stop its costs rising in a zero-growthworld?
Airports represent the key variable inRyanair’s cost structure. Ryanair hadachieved amazingly low (or even negative)airport charges in the early part of thisdecade as the result of signing long termcontracts guaranteeing traffic volumes atunderutilised airports. Now it has switchedto short term contracts and the strategybecomes focused on airport churn. Forexample, by 2013 the Ryanair network willhave reached around 50 airport bases;thereafter no net additions are planned.
Ryanair will switch capacity from its poorerperforming bases to its higher yieldingbases unless it is compensated by a reduc-tion in charges (and/or an increase in subsi-dies from, say, the local tourism authority).No one doubts Ryanair’s determination toact swiftly and brutally when it is baulked atan airport – the recent closure of theMarseilles base, for instance. But for thisstrategy to work consistently, airportshave to be genuinely starved of alternativegrowth opportunities; Ryanair is convincedthat it is the only airline that can guaranteetraffic volumes, others are not so sure –Flybe quickly moved into Belfast City whenRyanair exited because plans for a runwayextension stalled.
Ryanair will still need to place a sub-stantial new aircraft order just for replace-ment. Ryanair’s current fleet age is aroundthree years but in order to minimise main-tenance costs it adheres to a maximumaircraft age of seven years. Without agrowth story, will it be able to achieve thetype of bulk discounts that it locked intoduring the early 2000s, placing mega-orders at a time when the manufacturerswere desperate? Ryanair points out thatthe reason for the termination lastDecember of its 737NG negotiations withBoeing was not about price but about war-ranties. It also makes clear that the re-engined A320 is a genuine alternative.
On personnel costs Ryanair contendsthat cost pressure will be contained by itspay structure which provides very strongincentives for productivity. Its remunera-tion package is designed to be competitive,and its effectiveness is measured by crewturn-over and absence days – whichRyanair claims are very low.
However, Ryanair does at least have amajor diplomacy challenge. In October itwill pay a one-off dividend of €500m toshareholders, and such is its cash generativepower, especially with no new capex, anoth-er such dividend becomes likely around2013. Ryanair staff have minimal stock own-ership in the airline so they will required toexercise pay restraint at the same time ashuge sums are being returned to sharehold-ers, which they will not appreciate.
Aviation Strategy
Analysis
October 20104
2006 2007 2008 2009 2010 2011 2012 2013 2014 2015 2016
30
90
80
70
60
50
20
40
100
34
48
46
44
42
40
38
36
50
Pax
Fare
Pax (m)Averagefare (€)
RYANAIR: VOLUME AND YIELD PROJECTION
Note: Financial year to March 31st
Financial Year
(to March 31) Fleet
Passengers
(m)
2010 232 66.5
2011 272 73.5
2012 294 80.0
2013 299 85.0
RYANAIR’S SHORT TERM PLANS

Monarch Airlines: Last of the large independents
Aviation Strategy
Briefing
October 20105
Outside of the TUI Travel and ThomasCook Group airlines, the largest of the
remaining independent charter airlines isthe UK’s Monarch Airlines - but afterreporting its worst-ever set of financialresults (which has prompted a major re-organisation across the group), the ques-tion has to be asked - is the future ofMonarch as an independent companyassured?
Based at Luton airport, Monarch datesback to the 1960s and in 2009 its 30-strongfleet carried 6.3 million passengers to morethan 100 destinations across Europe, theUS, Caribbean, Africa and India at a loadfactor of 84.2%.
Monarch is a private company ownedby the Globus Travel Group, which in turnis controlled by the billionaire Swiss-basedMantegazza family. Until recently the lastfiled accounts for Monarch Holdings(which owns the airline and related busi-nesses such as the Cosmos tour operatorand Avro seat-only operation), were for theyear ending October 31st 2008. However,figures filed this summer at CompaniesHouse in the UK for the 12-month periodending October 2009, show revenue atMonarch Holdings fell to £790.8m com-pared with £813.3m in the 2007/08 finan-cial year, while the group made a heftyoperating loss of £24.2m, compared with a£8.5m operating profit in 2007/08. At thenet level, Monarch Holdings made a loss of£26.8m in the 12 months ending October31st 2009, compared with a £5m net profitin the previous year.
This is the group’s first loss in its historyand more worrying was the revelation thatas at the end of October last year, cash andcash equivalents had fallen to £11.8m com-pared with £26.1m as of 12 months earlier,despite a shareholder loan of £15m in theyear. Of most concern was that net assets(i.e. all assets minus all liabilities) excludingpension liabilities totalled £58.4m at
October 2010, compared with a net assetvalue of £94.1m a year previously – butwhen a huge pension liability of £98.1m istaken into account, net assets were nega-tive to the sum of £39.7m.
The impact of airline pension deficits inthe UK has been highlighted by the BA situ-ation, but a couple of points should beborne in mind. Pension accounting rules arevery conservative – a relatively minorchange to the modest rate of returnassumption and or the inflation index usedin the calculation can turn a deficit into asurplus. Perhaps more importantly, a pen-sion deficit normally will not affect thecompany’s cash flow – UK corporate lawonly allows company pension contributionsto be made out of retained profits, so if thecompany is unprofitable no payments canbe made to the fund.
Revenue at “airline operations” (whichinclude both the charter and scheduledbusinesses) fell 6.1% year-on-year to
300
600
500
400
£m
03/04 04/05 05/06 06/07 07/08 08/09
MONARCH'S AIRLINE OPERATIONS REVENUE
03/04 04/05 05/06 06/07 07/08 08/09
Note: FY is Nov 1st-Oct 31st. Result is for Monarch Holdings' "Airline Operations"
AIRLINE OPERATIONS’ PROFITABILITY£m
-20
20
10
0
-10
£517.7m in the last financial year, and a£3.3m profit before tax in 2007/08 turnedinto a £19.1m pre-tax loss in 2008/09.
As can be seen in the table (above), the“airline operations” provided the majorityof group revenue (65%) in the 12 months toOctober 31st 2009 but contributed a £19mpre-tax loss to the group result. In contrast,the engineering business unit had revenueof just £22m in 2008/09 but reported a£2.5m pre-tax profit, representing a pre-taxmargin of 11.5%.
In its brief report filed with the UK’sCompanies House, Monarch Holdings saysthat it encountered “exceptionally challeng-ing market conditions” during the year, dri-ven “primarily by a combination of high fuelcosts and the inability to pass on thesecosts to passengers due to a suppressedmarketplace”. However, the report addsthat after the financial year-end the group“drew down on a further shareholder facili-ty of £25m” from an entity calledTranscontinental Aviation, controlled bythe Mantegazza family, as well as revising
the terms of a previous loan of £15m fromTranscontinental so that it did not becomedue in the 2009/10 financial year, as waspreviously the case.
While it’s undoubtedly true that theMantegazza family can well afford to keepfunding Monarch Holdings in troubledtimes, they will not want that burden indef-initely, particularly as there have beenrumours swirling around the City thatMonarch had been set for a sale or float.Whatever the long-term plans of theMantegazza family for Monarch, the com-pany has undergone a period of instabilitythrough 2010.
In February it was unexpectedlyannounced that Peter Brown, the chiefexecutive of Monarch Airlines, was leavingthe company with immediate effect aftereight years in the position. More signifi-cantly, over the summer the group beganextensive restructuring, aimed at bringingall its activities into six divisions – thescheduled airline, charter airline, “airlineoperations”, tour operations, engineeringand retail. This is designed to allow thegroup to more easily manage products andservices across these divisions - which isan implicit acknowledgement that the var-ious parts of Monarch have operated insilos until now – or what Jeans calls “fairlyseparate lives”. Of course whether cus-tomers ever realised – or cared – thatMonarch Airlines, Cosmos and Avro arepart of the same group is open to doubt,but the reorganisation should mean betteroperational control and alignmentbetween the divisions.
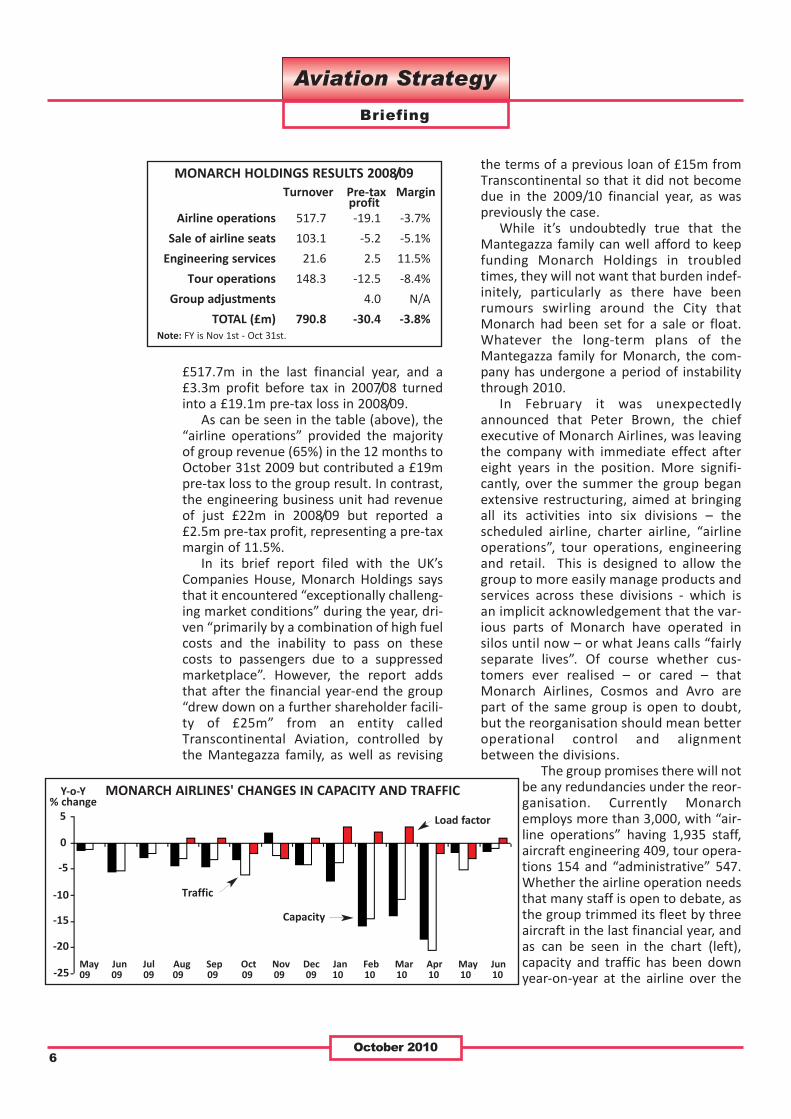
The group promises there will notbe any redundancies under the reor-ganisation. Currently Monarchemploys more than 3,000, with “air-line operations” having 1,935 staff,aircraft engineering 409, tour opera-tions 154 and “administrative” 547.Whether the airline operation needsthat many staff is open to debate, asthe group trimmed its fleet by threeaircraft in the last financial year, andas can be seen in the chart (left),capacity and traffic has been downyear-on-year at the airline over the
Aviation Strategy
Briefing
October 20106
Airline operations 517.7 -19.1 -3.7%
Sale of airline seats 103.1 -5.2 -5.1%
Engineering services 21.6 2.5 11.5%
Tour operations 148.3 -12.5 -8.4%
Group adjustments 4.0 N/A
TOTAL (£m) 790.8 -30.4 -3.8%
Turnover Pre-tax Marginprofit
MONARCH HOLDINGS RESULTS 2008/09
Note: FY is Nov 1st - Oct 31st.
May Jun Jul Aug Sep Oct Nov Dec Jan Feb Mar Apr May Jun09 09 09 09 09 09 09 09 10 10 10 10 10 10
5
-25
-20
-15
-10
-5
0
Y-o-Y% change
MONARCH AIRLINES' CHANGES IN CAPACITY AND TRAFFIC
Load factor
Traffic
Capacity

last 12 months, with very large reductionsto capacity through February, March andApril this year.
Monarch has a multitude of types for afleet that is just 30-strong, with A300s,A320s, A321s, A330s and 757s. They havean average age of 12.9 years, which meansthat a renewal programme has to be carriedout pretty soon. Currently there are six787s on order, and options for four moreaircraft, but delivery has been pushed backfrom this year to 2013 at the very earliest.When they eventually arrive the 787s willreplace the four ageing A300s (with anaverage age of more than 20 years) and beused for long-haul charters and potentiallytransatlantic scheduled services.
Within the overall Monarch fleet is alow cost, low fare scheduled businesscalled Monarch Scheduled that dates backto 1986. This operates out of Luton,Gatwick, Manchester (where is it the lead-ing international scheduled airline) andBirmingham to approximately 20 airportsin Spain, Gibraltar, Portugal, Cyprus andTurkey, all of which are primarily leisuredestinations. It launched eight scheduledroutes last year and this May added newscheduled routes to three Turkish destina-tions. The scheduled service includes a FFPcalled the Vantage Club as well as optionalpaid-for frills such as meals, pre-bookedseat and extra legroom.
The scheduled business is coming underincreasing pressure from the LCCs; forexample Ryanair’s scouring of Europe forroutes to base its aircraft in the last fewyears has led it to the traditional holidaydestinations (such as Malaga and Palma)that used to be the fiefdom of the charteroperators - and that is forcing Monarch tolook at ancillary revenue as average farescome down.
However, the majority of Monarch’sairline business remains in the charter seg-ment, and it’s this that is suffering most atthe moment. How Monarch will be affect-ed by the decision of the Big Two touroperators (TUI Travel and the ThomasCook Group) and their associated airlinesto cut late summer holiday prices in aneffort to shift spare capacity has yet to be
seen, but that move may contradict thehope of Tim Jeans back in April when hesaid that “the race to the bottom has runits course because customers eventuallyrecognise that there are differences inproviders … they recognise there is a dif-ference between a Monarch flight and aRyanair flight, between a Goldtrail flightand a Kuoni flight - and that has a value”.That’s a long-held wish in the seat-onlymarket, but history has always proved thatthe lure of the lowest fare always trumpsany other factor, and the decision of theBig Two to cut prices will make that ambi-tion even harder.
The future?
“Further optimisation” of the Monarchgroup is promised, but quite what is left toreorganise is not clear at this moment. Themanaging directors of each of the new divi-sions will report into a “group executivecommittee” headed by a new post of groupchief operating officer, who is RichardMintern, also the managing director of theengineering business. Over the summerthere were further reshuffles of manage-ment, including the appointment of SimonTucker as group finance director, KevinGeorge as the managing director of the“airline operations” division, with Tim Jeansalso put in charge of internal marketing (inaddition to his day job, which is runningMonarch Airlines). And in late SeptemberMonarch announced that Conrad Clifford –previously vice president for the UK andIreland at Emirates and a former CEO ofVirgin Nigeria – would become group CEOfrom December 1st.
Despite this new structure and manage-ment the group has declined to forecast itwill return to profit this financial year, andall Rawlinson has said is that the group isseeking “steady improvement in financialperformance over the next two to threeyears”. Whether that will be sufficient forthe Mantegazza family remains to be seen.Combining the last six financial yearstogether, Monarch’s airlines have made just£13m of pre-tax profit on £2.7bn ofturnover, at a margin of less than 0.5%.
Aviation Strategy
Briefing
October 20107
By Nick Moreno

Southwest’s planned acquisition ofAirTran seems like a smart strategic move
for both carriers. But can the world’s leadingLCC really generate the famous “Southwesteffect” at Atlanta, where AirTran has alreadygiven Delta a run for its money? Will thetake-over enable Southwest to resumeorganic growth?
Southwest, the fourth largest US carrierin terms of system RPMs, announced onSeptember 27 that it had entered into adefinitive agreement to acquire AirTranHoldings, the parent company of AirTranAirways, in a $1.4bn cash and stock deal (or$3.4bn including AirTran’s net debt and cap-italised aircraft leases). AirTran is the eighthlargest US carrier, about a quarter ofSouthwest’s size; it began life as ValuJet in1993 and in the past decade has positioneditself as a high-quality LCC with the lowestunit costs in the industry.
The deal has been unanimously approvedby the boards of both companies. It isexpected to close in the first half of 2011,subject to the approval of AirTran sharehold-ers and regulatory clearances. The deal is notcontingent on any union approval.
Under the terms of the agreement,AirTran shareholders will receive a combina-tion of Southwest stock and cash valuedbetween $7.25 and $7.75 per share,depending on the average trading price ofSouthwest stock in a 20-day period endingthree days prior to the closing of the deal. Atleast $3.75 of it will be in cash. Based onshare prices on September 24, the transac-tion values AirTran’s stock at $7.69 (or$1.4bn in the aggregate), representing apremium of 69%. AirTran shareholderswould receive around 57m Southwest com-mon shares, or 7% of its total on a pro-forma basis, as well as $670m in cash.
Law firms scrutinising the transaction onbehalf of AirTran shareholders have sug-gested that the offer may undervalue thecompany, noting that at least one analyst
had a price target for AirTran as high as $11per share. However, analysts consider alter-native bids unlikely. There are normal provi-sions to deal with superior proposals,including a timeframe for Southwest torespond and a break-up fee of $39m.
This would be a straight acquisition,anticipating the full commercial and operat-ing integration of AirTran into Southwestover a two-year period. AirTran will lose itsbrand and identity, and its fleet will be tran-sitioned to Southwest logo, colours and con-figuration. Corporate functions will be con-solidated into Southwest’s Dallas headquar-ters. The plan is to eventually operate undera single operating certificate.
The deal is significant in that it would bethe first combination between major USLCCs, bringing together airlines that gener-ated $11.2bn and $2.5bn revenues in the 12months ended June 30. It is also a rare moveSouthwest, which likes to grow organically –only its second large acquisition (followingMorris Air in 1993).
The acquisition would reinforceSouthwest’s position as the largest US carri-er in terms of domestic passengers and itssolid “number four” ranking in terms of sys-tem RPMs. With the closing of the UAL-Continental merger in the same week as theSouthwest-AirTran deal was announced, it isamazing to think that US airline industryconsolidation has got to the point wherethere are just four clear leaders: the “bigthree” legacies and Southwest.
AirTran will give Southwest some excit-ing new opportunities in eastern US, espe-cially access to Atlanta - the world’s busiestairport where it has hitherto not been ableto establish even a foothold – and a modestnear-international network. But thoseopportunities also pose unique challengesfor a carrier whose hallmark is simplicity.How will Southwest handle the Atlanta mar-ket? When integration is completed, howmuch will its business model have changed?
Aviation Strategy
Briefing
October 2010
Southwest’s acquisition of AirTran:What will really happen at Atlanta?
8

Southwest can certainly afford the AirTranacquisition. It plans to fund the $670m cashpayment out of cash reserves. As of lateSeptember, Southwest had $3.3bn of cash, afully available $600m unsecured credit lineand over $7bn in unencumbered assets (pri-marily owned 737s). After the AirTran acqui-sition liquidity would remain very strong,with unrestricted cash exceeding $3bn or20% of combined 2010 revenues.
Furthermore, there may not be any neg-ative impact on Southwest’s industry-lead-ing credit profile. While assuming about$983m of balance sheet debt and $1.7bn ofcapitalised aircraft leases from AirTran,Southwest is sticking to its plans to paydown debt in 2011 and 2012. Fitch has actu-ally affirmed Southwest’s “BBB” ratings and“stable” outlook, though S&P placed the rat-ings on “creditwatch negative”.
The deal seems to be universally liked byanalysts, because it will enable Southwestto resume growth without acquiring aircraftin the near-term. Many in the financial com-munity feel that risk is minimised by acquir-ing another successful LCC with similar val-ues and strategies. JP Morgan analysts pon-dered in a late-September research notethat “integration challenges” were prefer-able to “more capital-intensive outcomes(new planes and organic growth)”. The ver-dict of BofA Merrill Lynch analysts was veryclear from the heading of their researchnote: “Right price, right time, right target”.
Why now?
The curious thing about the Southwest-AirTran combination is that it has been onthe cards for a long time, but the two par-ties never got together to talk about it untilrecently. Many analysts have suggested itover the years. AirTran’s leadership has fre-quently gone on record saying that theywere open to being acquired. AndSouthwest’s CEO Gary Kelly conceded in theinvestor call on September 27 that “it hasbeen a good idea for a long time”. Then whydid it take so long? Why now?
The first thing to note is that Southwest’smove has nothing to do with the acceleration
of the legacy-airline consolidation process. Itis in no way a response to Delta-Northwest,United-Continental or any of the smaller-car-rier mergers or international deals.
The short explanation for the delay givenby Kelly: “We weren’t ready. It wasn’t theright time for us.”
Southwest is fiscally an extremelyresponsible company. Even though it hasearned profits for 37 consecutive years,2008 and 2009 turned out to be financiallyrather challenging, in the first place becauseof the waning of the airline’s advantageousfuel hedges and subsequently the recession.As a result, Southwest has had a fewextremely busy years trying to find solu-tions. The numerous projects tackled by theairline have been discussed at depth inAviation Strategy briefings (seeJanuary/February 2008 and April 2009issues); here is a quick summary.
First, to compensate for the substantialhike in costs after losing the fuel hedgeadvantage, in mid-2007 Southwestembarked on an all-consuming drive toboost revenues by $2bn-plus annually. Itwas a major challenge for an airline that hadhitherto focused mainly on keeping costslow. The effort has been highly successful,leading to lucrative new ancillary revenuestreams, refinements to the business modeland new products aimed at attracting morebusiness traffic.
Second, there has been a major drive to
Aviation Strategy
Briefing
October 20109
Number of passengers (2009) 101.3m 24m
Nonstop routes (current) 461 177
Cities served (current) 69 69
Active fleet (as of Sept 27) 547 138
FTE employees (as of June 30) 34,636 8,083
12 months ended June 30, 2010:
Total operating revenues $11.2bn $2.5bn
Operating income $843m $128m
ASMs 96.4bn 23.9bn
RPMs 75.2bn 19.3bn
Passenger load factor 78.0% 80.8%
Cash & short-term investments $3.1bn $445m
Cash as % of LTM revenues 27.7% 17.8%
Cash flow from operations $1.5bn $163m
Capital spending $611m $89mSource: Company reports
LUV AAISOUTHWEST AND AIRTRAN AT A GLANCE

get the technology and systems in place tosupport the new revenue activities –another formidable challenge becauseSouthwest was built on simplicity and hadsome serious “catching up” to do on thetechnological front.
Third, after reporting its first quarterlynet losses in memory in late 2008,Southwest suspended ASM growth andbegan to defer aircraft deliveries – anotherfirst for the carrier. Contrary to large LCCs inother world regions, which continued grow-ing through the recession, Southwest’s totalcapacity fell by 5.1% in 2009 and by another3.3% in first-half 2010.
Fourth, to enhance the profitability of itsnetwork and maintain staff morale,Southwest embarked on a “network optimi-sation” drive. This meant eliminating flightsin less profitable markets, while venturinginto high-profile new cities, includingMinneapolis, New York LaGuardia andBoston Logan in 2009.
With all of that to manage, and givenSouthwest’s conservative nature, it washardly surprising that the airline did notwant to take on a major merger or acquisi-tion. That said, in the summer of 2009Southwest did seek to buy another LCC,Frontier, through the Denver-based carrier’sbankruptcy auction process. The deal mademuch sense but was scuppered bySouthwest pilots’ refusal to endorse it.
But the environment is now very differ-ent. In the past 12 months or so, Southwesthas led the industry in demand, yield andprofit margin recovery. In this year’s Junequarter its operating margin was an excellent13%. With continued extremely modest cap-ital spending, Southwest should continue togrow its cash flow and reduce debt in 2011.CFO Laura Wright noted: “This puts us in anexcellent position to structure a transactionin a manner that preserves our strong bal-ance sheet but which also allows an opportu-nity to provide superior returns on the invest-ment to our shareholders”.
Kelly noted that since Southwest is cur-rently not growing its route system organical-ly, now is an opportune time to manage amajor acquisition. Furthermore, Southwest isnow more confident in its capabilities on the
revenue side. Since the merger may not pro-duce any net cost savings, “it all hinges onwhether we can make the networks work”.
What AirTran offers
Southwest wants AirTran for the prof-itable growth opportunity that it offers.Southwest’s growth opportunities havediminished as its network has grown nation-wide. It has also been unable to access somemajor markets or build up frequencies due tounavailability of slots. It is indicative thatSouthwest is now seriously considering con-verting some of its 737-700 orders to thelarger 737-800 (an option that it has alwayshad) to help it grow at slot-restricted airports.
The growth opportunity through AirTranarises because the networks are comple-mentary. AirTran would give Southwest 30new destinations. Although the two overlapon 20 nonstop routes, which is more thanUnited-Continental’s 14 and Delta-Northwest’s 12 (JP Morgan figures), there issignificant overlap at only two airports:Baltimore/Washington and, to a lesserextent, Orlando. The consensus among ana-lysts and industry observers is that, giventhe lack of competitive constraints at thosetwo airports and Southwest’s pro-consumerreputation, there are not likely to be anyDoJ-mandated divestitures.
But the most important reasonSouthwest is acquiring AirTran is that itoffers access to Atlanta, the largest US citySouthwest does not serve. AirTran is thesecond largest carrier at Atlanta, with a 22%market share (compared to Delta’s 62%)and a sizable hub operation covering 57cities. CEO Kelly likens Atlanta to the “bigpools of growth opportunities” thatSouthwest had in the 1990s (particularlyCalifornia), as well as the Chicago andDenver opportunities in the last decade. “Interms of us filling our network gap, themajor market that we don’t touch domesti-cally that our business customers particu-larly want is Atlanta. So this is clearly astrategic move for us to fill that gap.”
Southwest will also gain improvedaccess to the three most important
Aviation Strategy
Briefing
October 201010

Northeast business markets: New York,Boston and Washington. It will gain moreslots at LaGuardia and Boston Logan and,for the first time, be able to operate toWashington Reagan.
Southwest will also gain access to manysmaller domestic cities that it does notserve today (because it is primarily a point-to-point carrier). Southwest executives com-mented: “That will also fit in very well withour desire to continue growing our routemap domestically”.
And, significantly, Southwest will gainaccess to key near-international leisure mar-kets in the Caribbean and Mexico, accelerat-ing its own plans to go international. AirTranoperates at least weekly, and in some casesdaily, scheduled flights from Atlanta, Orlandoand Baltimore/Washington to Aruba,Cancun, Montego Bay, San Juan, Nassau and(from February 2011) Punta Cana.
Southwest has long contemplated near-international service. Codesharing onWestJet flights to Canada and on Volarisflights to Mexico was supposed to be thefirst step in the process, with own-accountinternational operations following after afew years. But the WestJet deal fell throughlast year (after the Canadian carrier forged asimilar relationship with Delta), and theVolaris deal has been delayed bySouthwest’s struggles to upgrade its reser-vations technology to handle internationalcodeshares (now expected to be imple-mented in 2011).
Kelly confirmed in the late-Septemberinvestor call that Southwest has taken thedecision to replace its reservations technol-ogy and has narrowed the search down totwo systems. That will bring the necessarycapability, at least on the commercial side,to offer international service. In the mean-time, Southwest would keep AirTran’s inter-national service and learn from it, beforeeventually moving those operations underits own roof when it has the capability.While additional international expansion isprobably several years away, one thing isclear: long-haul expansion to Europe is noton the cards; the furthest place thatSouthwest is likely to go is South America.
The AirTran acquisition would contribute
to the gradual “eastward march” thatSouthwest began more than a decade ago,after its 1990s growth spurt in California. Itwould result in an approximate eight per-centage-point decline in the West’s share ofseats offered and a corresponding increasein the East’s share of seats. Specifically, theWest coast and Southwest regions wouldaccount for about half of the combination’stotal seats (51.4%, compared to 59.7% pre-viously), while the Eastern half of the coun-try would account for about a third of theseats (32.7%, up from 25.1%). Midwest’sshare would remain roughly unchanged at15-16%. International and Puerto Ricowould account for 0.2% of the seats.
The two airlines’ fleets are compatible inthat they include only Boeing aircraft andlarge numbers of 737-700s. However,AirTran does bring in a different fleet type,
Aviation Strategy
Briefing
October 201011
West 39.0% 33.4%
Southwest 17.2% 15.0%
Northwest 3.5% 3.0%
Total West 59.7% 51.4%
Midwest 15.2% 15.6%
Southeast 11.9% 17.9%
East 13.2% 14.8%
Total East 25.1% 32.7%
Int’l /Puerto Rico
0% 0.2%
Southwestcurrently
After AirTranacquisition
THE WEST-TO-EAST SHIFT:Seat distribution by region
Las Vegas 230
Chicago Midway 228
Baltimore / Washington 222
Atlanta 202
Phoenix 180
Denver 148
Houston Hobby 135
Orlando 132
Dallas Love Field 128
Los Angeles 121
SOUTHWEST / AIRTRAN’S TOPTEN CITIES BY DAILY DEPARTURE

the 717-200, and in significant numbers too(86). Although Gary Kelly sportily describedthe 717 as “very cost-effective” and “an air-plane that we think we can manage well”, itwill be interesting to see if Southwest couldactually get rid of the type, and if not, howit would operate the 717 and what theimpact on costs would be.
Importantly, like Southwest, AirTran is ahigh-quality, low-cost operation with a verysolid low-fare brand. Both have employee-centric cultures and dedicated workers with“kindred warrior spirits who care about serv-ing customers”. AirTran is a profitable opera-tion, though its margins have been lowerand much more variable than Southwest’s.
But there are some differences. AirTranuses a hybrid hub-and-spoke network,whereas Southwest is point-to-point.AirTran is actually much more upmarket: itoffers two classes and advance seat selec-tion, contrasting with Southwest’s verybasic approach (even after the past twoyears’ new product offerings). AirTran sellsthrough GDSs, Southwest does not.
Synergies and dis-synergies
Southwest expects the AirTran acquisi-tion to produce “at least $400m” of netannual synergies by 2013. This would beabout 3% of the $13.7bn combined annualrevenues in the 12 months to June 30 – inline with other recent airline combinations.One-time costs related to the acquisitionand integration, to be incurred from close to2013, are projected to be $300-500m.
The synergies will be driven mainly by theexpanded and diversified network. Thestronger joint network will facilitate hun-dreds of new itineraries to the combination’s100m-plus existing customers. There wouldbe incremental revenue from new Atlantamarkets. The increased customer basewould support the addition of brand newdestinations. The combined company wouldhave a more powerful FFP, providing a signif-icant revenue opportunity (strengtheningthe new FFP that Southwest is scheduled tolaunch next year). And Southwest believesthat, as the networks are combined, it will be
able to capitalise on joint marketing, itsschedule optimisation and revenue manage-ment capabilities, its “BusinessSelect” and“EarlyBird” products and, of course, its pop-ular “Bags Fly Free” programme.
Interestingly, Southwest is counting onproducing the famous “Southwest effect” atAtlanta, even though it is replacing an exist-ing low-fare carrier there. A study byCampbell-Hill Aviation Group, which wasretained by Southwest to evaluate the con-sumer benefits of the transaction, foundthat more expansive low-fare service atAtlanta alone has the potential to stimulateover two million new passengers and$200m-plus in consumer savings annually.
On the cost side, there are potential sav-ings in advertising and distribution, facili-ties, corporate overheads, duplicative infor-mation technology, scale efficiencies andreduced financing rates thanks to the largerscale. The cost synergies are expected to“substantially offset” the dis-synergies ofthe deal, principally higher labour costs.
S&P noted in a late-September commu-niqué that Southwest’s labour costs areamong the highest in the industry for the737s it flies, while AirTran’s are among thelowest. “When two merging airlines havedifferent levels of compensation, the pat-tern has been for the lower-paid employees’compensation to rise to match that of theairline with higher pay.” The rating agencyconsidered the labour dis-synergies to be“the greatest risk in this merger”.
BofA Merrill Lynch estimated thatAirTran’s wage rates are 30% belowSouthwest’s, which would imply more than$150m of labour dis-synergies. Southwesthas not released its own estimate, though itis apparently included in the $400m net syn-ergy figure. In other words, the anticipatedrevenue synergies dwarf the cost issues.
CFO Laura Wright stated that theAirTran transaction should allowSouthwest to meet its overall ROI and prof-itability targets sooner. The value createdfor shareholders fully supports the signifi-cant premium to be paid to AirTran share-holders. When the $400m net synergiesare fully realised, Southwest expects toexceed its 15% pretax return on invested
Aviation Strategy
Briefing
October 201012

capital target and produce a healthy returnon equity of over 20%. Including the netsynergies but excluding one-time costs, thedeal is expected to be accretive toSouthwest’s pro-forma EPS in year one and“strongly accretive” in subsequent years.
Integration risks
Southwest is embarking on a challengingundertaking, but it is not new to mergersand its recent track record of moving veryslowly and methodically with difficult pro-jects to ensure a successful outcome givesmuch cause for optimism. With the AirTrandeal, there are integration risks essentiallyin two areas.
First, technology integration, which hascaused problems in many airline mergers, isa particular concern given Southwest’s diffi-culties in that area in recent years andbecause Southwest plans to move to anentirely new reservations platform in themiddle of the AirTran integration.
Second, as Fitch put it, labour force inte-gration is always a wild card in airline com-binations. While the AirTran deal is not con-tingent on any union approval, successfulintegration will not be possible if labourdoes not cooperate or if there are seriousdisputes. Integration of pilot seniority lists,which affects future pay, promotions andflying assignments and has to be deter-mined by the two pilot groups, is typicallythe toughest issue - it has still not beenachieved at US Airways following its 2005merger with AWA.
In this deal one potential problem is thatSouthwest’s pilots are more senior thanAirTran’s, because Southwest has a longeroperating history. If the unions merge thelists on the strict order of seniority, AirTran’spilots would find themselves at the bottomof the list, which would probably cause a lotof friction. Southwest’s management hopesthat the pilots will find a “fair and equi-table” way of merging their seniority lists.
Southwest’s pilots have adopted veryhard line positions in the past. Their insis-tence of putting Frontier pilots at the bot-tom of the list helped scuttle that deal last
year. In their initial statement on the AirTranacquisition, the pilots said that “no stonewill be left unturned to protect SWAPApilots’ interests”.
On the positive side, the potential growthopportunity associated with this deal mayreduce the stakes of seniority integration.AirTran’s pilots can also look forward tomuch higher pay, greater job security and abetter relationship with their management.
Fleet considerations
Even though Southwest will be happy tocontinue operating the 717-200s, which arewell suited to AirTran’s smaller markets, itreally does not need another aircraft type.All but six of the 86 717s are leased, whichmakes it harder to manage changes to thefleet. But Southwest is likely to have alreadyapproached Boeing Capital about potentialsolutions such as early termination of leases.
If Southwest has to continue operatingthe 717s, it has already said that it wouldnot want to cross-train crews and havethem switching back and forth between the717s and 737s. The 717s would probably befenced off within the network until the leas-es expire or agreement is reached withBoeing on their transition. Southwest mayalso seek lease rate reductions, given itsstronger balance sheet and credit profile.
Some analysts have suggested thatSouthwest might delay any plans to switchto the larger 189-seat 737-800s, given theadded complexity of the 717s. But Kellyrefuted such ideas, saying that the twotypes are not mutually exclusive but com-plementary and that the 737-800 might fitin well in Southwest’s broader strategy for
Aviation Strategy
Briefing
October 201013
737-300 173 0 173
737-500 25 0 25
737-700 349 52 401
717-200 0 86 86
Active Fleet 547 138 685
Average age (June 30) 10.9 years 6.5 years 10.2 yearsFirm orders (LOI/options)
737-700 107 (98/37) 51 (0)
LUV AAI Combined
Note: Fleets as at September 27, 2010
SOUTHWEST'S AND AIRTRAN'S FLEETS

the next decade. Kelly stated: “In my opin-ion, we have a better fleet plan going for-ward contemplating the 737-800 as a com-ponent. It can be more cost-effective on cur-rent routes. Clearly we’ll have more growthopportunities if we can bring the -800 to theproperty. There are just some routes thatwe won’t fly if we don’t have the -800.”Southwest was previously expected todecide on the 737-800 by year-end. Itrecently won approval from its flight atten-dants to add the type, though it is still dis-cussing the plans with its pilots.
What will happen at Atlanta?
Southwest has made it very clear thatAtlanta is where the big numbers are. Kellystated: “It is about bringing more competi-tion, bringing more low fares. We see anumber of city-pair opportunities to go inwith lower fares and stimulate traffic in clas-sic Southwest fashion.” Kelly also remindedthat Southwest likes “markets that are over-priced, and the icing on the cake is if theyare also underserved”. It would be a reversalof the retrenchment that AirTran has beenon in the last few years at Atlanta.
But some industry observers have ques-tioned if Southwest can really stimulate traf-fic at a hub that has already been a battle-ground between a legacy and an LCC formore than a decade.
A study released on October 4 by BoydGroup International suggested thatSouthwest is likely to have a materialeffect in only two of the top 25 O&DAtlanta markets: Salt Lake City andNewark. Southwest is replacing an existinglow-fare airline, not introducing low faresto Atlanta. The report called “ridiculous”projections of hundreds more flights perweek or hundreds of millions in fare sav-ings, pointing out that “the major demandmarkets at Atlanta are already stimulated”and that “every local O&D market atAtlanta is wildly overserved”.
The Boyd report made the point thatAirTran’s Atlanta flights depend on flow traf-fic for around two thirds of the passengers.Southwest too depends on flow traffic at
many locations these days; at ChicagoMidway, 43% of its passengers are not localO&D. Nevertheless, the report argued,more reliance on “banking” schedules willbe critical at Atlanta. “The extent to whichSouthwest will need to stimulate Atlanta asa hub goes far beyond anything it has donein this regard before.”
It is not at all clear what the impact onDelta might be. Some analysts have down-graded Delta merely on the basis that it willface a tougher LCC competitor at its mainhub, but others believe that Delta is notuniquely threatened. JP Morgan analystsare in the latter camp, noting thatSouthwest is probably a more rational com-petitor than AirTran (because it has highercosts and is more profit-oriented) and thatthe 37 cities unique to Southwest (which itcould link to Atlanta) represent less than 1%of Delta’s system revenue.
The Boyd report noted that Delta hassucceeded in Atlanta in all three counts thatmatter: carrying more flow traffic thanAirTran, maintaining a strong yield premi-um, and maintaining high load factors.“There are no indications that this situationwill change when Southwest’s Red BelliedWarriors pull up to the gate.”
But Atlanta may one day make an inter-esting case study of airline brand loyalty. Onthe one hand, Delta may gain business traf-fic if AirTran’s passengers do not likeSouthwest’s open-seating policy and morebasic product. On the other hand,Southwest’s “Bags Fly Free” policy mayprove so popular that Delta will have toreverse its strategy for competitive reasonsand lose a major revenue stream. With suchconsiderations in mind, Southwest’s execu-tives have stressed that they want to use theintegration as an opportunity to learn fromAirTran and are not ruling out futurechanges to the brand.
The transaction is widely regarded as anear-term positive for the US airline indus-try. By eliminating the lowest-cost, lowest-yield producer, it is likely to enhance capac-ity and pricing discipline. Of course, thelonger-term implications are less favourablesince the acquisition is likely to encourageSouthwest to start growing its fleet again.
Aviation Strategy
Briefing
October 201014
By Heini Nuutinen

Operational management:the aim is “unremarkable service”
When a flight is on time, with OK cabinservice, and your luggage arrives
when you do, most passengers do notnotice. This is how it is supposed to be. If,however, the flight is delayed, especially ifthis starts to be a pattern with an airline,then this is not OK.
As has been extensively researchedsince the 1980s one delayed or otherwisedissatisfied passenger tells at least nineother people – a passenger whose flightwas reasonably on time and with adequateservice will probably just answer a directquestion with “yes, it was OK”. For mostairline passengers unremarkable service isas good as it gets.
Unremarkable service, however, is theproduct of skilled operational managerswho constantly integrate and adapt theoutcomes of many different functions fromwithin and outside an airline. They in turnare often regarded as unremarkable interms of the role they perform and theirvisibility compared to the powerhousefunctions of corporate strategy, interna-tional relations, finance, marketing and sys-tems development. They usually only cometo notice when the operation suffers seri-ous disruption or when further cost savingsneed to be made, since they often controllarge numbers of direct or contracted staffsusceptible to culling when additional sav-ings are looked for.
Now, however, airlines are looking with arenewed focus on operational performanceas a competitive differentiator. Not leastbecause the web-enabled world creates fastand uncontrollable customer feedback, andis seen to be increasingly influencing buyingbehaviour. Also as global recession easesEuropean airspace is also likely to be increas-ingly constrained by minimal new airportexpansion and a delayed Single Sky air trafficmanagement system while at the same timepan-European train operations are likely tobecome faster and more reliable.
So unremarkable service may have to geta whole lot better if it is to stay unremark-able and the talent management required tosustain competent multi-skilled operationalmanagers may also need to be reviewed.
Unremarkable service requires the com-bination of many elements: serviceable air-craft, fueled, cleaned, loaded and catered;briefed crew with logged flight plans; anavailable airport gate, ground transport,appropriate terminal facilities; processedjoining and transit passengers, all readywithin slot departure time and not just oncebut repeated many times during a day. Thisdemands a careful allocation of resourcesbetween competing demands, involves deal-ing with variations and the unexpected, butit rarely involves facing totally new or previ-ously unknown situations. So the manageri-al task may be stressful, with peaks andtroughs, but for people who have worked inairlines it does not require remarkable skills,but competence and judgement.
Judgement within boundaries
Another complication faced by man-agers is that many ground operations func-tions are now outsourced. In larger airportsthe airline manager may well have to tradeupon maintaining a good relationship sothat additional staff or equipment is provid-ed without recourse to the small print of acontract and also manage the internal hier-archy so that action to enable servicerecovery is not then criticised for coming inover budget or not following the rules.Ryanair has simplified this, no customersreceive any extra service and if they doeveryone gets the same. For other airlinesdistinctions between fare types, complicat-ed by loyalty schemes, do not always leadto easy conversations at the customer ser-vice desk if one person is told they mayreceive more than another within earshot.
Does judgement matter or should the
Aviation Strategy
Management
October 201015

rule book not always be the arbiter? Manyairport staff will remark that when dealingwith passengers who are disabled,bereaved, frequent flyers, or who may haveexpectations generated by partner airlines,travel agents or corporate accounts, therule book does not always fit, especially ifthe espoused mission and values are abouttreating customers with respect and sellingthe next ticket.
Setting targets within the integratedworld of operations is fraught with dangeras meeting one may well disadvantage thesystem. A major airline had to shampoo itscarpets most weeks because purchasing hadsaved money by buying thinner waste bagswhich frequently split. Cabin crew constant-ly struggle to reseat families on boardingwhen the terminal staff have assured thepassengers this can be done – thus meetingcheck-in targets and dumping the problemon someone else. So an operations manag-er has to know the details of the workrequired, ensure compliance, especially ofsafety even if punctuality is threatened,andthen have the energy to fight for resources,especially those that are required on occa-sion rather than all the time.
Is operationsmanagement important?
Is the management of airline operationsof great significance in an economic cli-mate where the financial survival of manyairlines, issues of fleet selection, leasing,fuel cost, market access, yield manage-ment, product differentiation and the cre-ation of viable alliances currently occupymost executive attention?
The answer is probably ‘yes’. It is notmore important but to many airlines it is asimportant. Although the issues of managinga regular, reliable and punctual perfor-mance have not changed much since theadvent of the big jets some fifty years agoand indeed have to an extent become muchsimpler because of automated and integrat-ed systems, four largely external factorsnow have a growing significance.
These four factors are: the impact of a
sustained period of cost—cutting, thegrowth of ancillary revenues, the impor-tance of global networks, and the sociallynetworked markets in which airlines com-pete for customers. The first may ease aswith economic recovery but it may leave alonger term legacy that constrains the abil-ity of airlines to remount more ambitiousschedules. The latter two may well becomevery significant in increasingly competitivemarkets. Whatever the interaction, all fourfactors are combining to render today’s air-lines more vulnerable to perceived pooroperational performance than before (inturn impacting marketing propositions andthe bottom line).
Relentless cost-cutting One result of theseemingly endless cost cutting of the lastthree years has been a reduction in opera-tional management and staff. As a result, ina crisis there is no additional availableresource to commit – this has been ruthless-ly pruned. There are fewer people and oftendistorted age and length of service demo-graphics. If training has also been reducedthen the front-line competence may be thin,and with no reserves in terms of bodies orskill. At the same time a loss of collectiveexperience as job levels are removed andexperienced – and more costly staff out-placed - may result in a greater dependenceupon the operating manual when the exer-cise of judgement and empathy with passen-gers may be more important.
Increase in ancillary revenues The pur-suit of ancillary revenues is also starting toimpact upon airline passengers and theirperception of what is good operational per-formance. The days of acceptance of longdelays at airports when an ‘all-inclusive’price for a holiday had been paid, or whena company was funding business travel arefast disappearing. If passengers pay morefor the carriage of their bag it had betterarrive and quickly; if they pay more for apre-ordered meal or on-board snack it hadbetter be available and edible; if they paymore for preferential boarding and seatallocation it had better take place and pro-duce a preferred seat etc.
The customer at the check-in desk orkiosk is very aware of how much they have
Aviation Strategy
Management
October 201016

paid for a service. Unbundling provides rev-enue streams but also exposes front-linestaff to transactional expectations thatwere previously opaque. Corporate trav-ellers also have a heightened awareness ofthe components that make up the value ofthe service they expect and may have tojustify to their own bosses.
The importance of global networksOne attraction of offering global networksis the connections they offer through sin-gle or multiple hubs, with seamless serviceand compatible products. These expecta-tions at airport level provide multiple chal-lenges: from privileged lounge access,baggage allowances, carry-on baggagesize, upgrading policies through to lan-guage skills and an ability to meet growingrequests to respect diversity. As thesophistication of the alliance marketingincreases so will the complexity of deliver-ing the promise in physically congestedand time-constrained facilities.
It is also likely that operations control ofnetworks will be influenced by the yieldprofiles on loads on inbound aircraft with aconsequent pressure to hold some depart-ing connections – yet maintain operationalintegrity across the terminal.
This is not new. Major European airlineshave protected certain high profile com-mercial connections for years. What is newis the multiplicity of partners and increasingknowledge of corporate customers. Thescale and the visibility of the demands arelikely to increase and quite often juniorstaff are on the front-line.
Significance of social networking Thechaotic world of social networking contin-ues to develop in unexpected ways. Thinkof the numbers that football stars, filmstars and other celebrities have “following”them virtually and then think of themstarting to twitter while delayed at air-ports; at airports waiting for their bags andhoping they will come and after flightsdescribing their experience. Possibly, theywill also soon be twittering on flights. IfStephen Fry can twitter in a slow lift, or atrade union official during negotiationsthen airline passengers, especially if aggra-vated, will certainly find the time. The only
slightly slower world (before the advent ofthe iPad and iPhone) of PC- based chatrooms and blogs has long been a source ofinformed feedback on flights. A trollthrough recent comments on the largerEuropean LCC sites is very informative as towhat matters to some paying customers.More interestingly, what matters seems toalign with the comments made by othercustomers on blogs about the major net-work airlines, i.e. arriving on time withone’s baggage and not being ‘ripped off’on price – whether as booked, or throughancillary revenues - matters.
Recent research shows that in this net-worked world it is another online personwho is believed rather than an airline or anofficial statement. Social networks areprobably not a passing phase and the viewsexpressed on Facebook about current air-line operations do not always make forpleasant reading.
Demanding leadership
Historically, operational managementhas not been held in the highest esteem inairlines. Elements of it being regarded as abit technical, and sometimes physicallydirty still remain. A key determinant of reli-able, regular and punctual services is themanagement of the operation. But opera-tional management, if one discounts pilotmanagement, has rarely been prized eitherin terms of relative salary or as a route tothe executive suite. In today’s environmentthe professional skills of piloting, engineer-ing, finance or the law, or wider commer-cial experience and skills in marketing or ITtend to be favoured more.
Operational managers tend to love theirwork, however, and their career choice.Most quote the satisfaction that comesfrom delivering a high quality product andon occasion rescuing the operation fromthe problems that extreme weather, tech-nical, infrastructure failure and majorgeopolitical issues are always liable tocause. They also tend to enjoy leading peo-ple, as individuals and as organised inunions. These problems go with the terri-tory and it is often what distinguishes the
Aviation Strategy
Management
October 201017

managers as people who regularly reflect onprevious experience and adapt accordingly.
A role, not a profession
Crucially, operational managers need tobe generalists. As Professor Richard Barkerof Cambridge University’s Judge BusinessSchool argues in a recent Harvard Business
Review article, management is not a pro-fession pursued like accountancy, the lawor medicine, piloting or engineering in theairline world. His argument is that much ofour business education no longer equipsmanagers for critical roles. An MBA is auseful qualification but it does not neces-sarily equip managers for a world in whichpeer relationships, team working,thoughtfulness, and flexible and adaptiveattributes are more important than techni-cal knowledge. This list of competence isfrom research compiled as to what organi-sations prize, not what business schoolsthink they should deliver.
Back in the world of airline operationsone characteristic of a manager stands out.The manager is responsible for bringingtogether many inputs and exercising judge-ment to affect the outcomes. At an opera-tional level the manager, for some briefmoments, is responsible for the combinedvalue generated by all the inputs to thecompany. On her watch the value generat-ed by marketing initiatives and brands arecombined with the technical expertisefrom engineers, pilots, operations control,ground handling, passenger services,catering come together - or not. On herwatch the value generated by the inputsfrom the company are enabled by thevalue of the inputs from alliance partnerairlines, code-sharing partners, servicepartners, hotels, and transport servicescome together – or not. On her watch thevalue generated by the inputs from thecompany are enabled by the value of theinputs from parallel agencies responsiblefor airport infrastructure, terminal facili-ties, security, immigration, and air trafficcontrol are enabled – or not.
The very definition of an operationalmanager is that she works across functions,
influencing and adapting the outputs andapproaches of numerous silos to a commonpurpose: delivering to each and every pas-senger an operation that is timely, reliable,and to the expected standard. From thesetrade-offs and recognition of the bestcourse to steer through conflictingdemands comes added value on the day,and longer term added value - if the learn-ing from the inevitable problems is translat-ed back into future decisions.
Learning, not blaming
At most airlines the blame allocationmeetings about why a flight departure waslate are a thing of the past. Trying to pin theblame on whether the aircraft was late outof the hangar, denied a gate when required,or was awaiting crew or cargo, which inturn impacted on whether cleaning, loadingand dispatch could take place in time isprobably one of the most fruitless pastimesinvented by airline managers. Add to thislocal context concerning access to de-icingwhen required, stand allocation, securityprocedures, concourse congestion, or wait-ing on valuable transfer passengers and thecomplexities of the blame game are clear.
As Gordon Bethune mused when turn-ing around Continental Airlines; “There area lot of parallels between what we're doingand an expensive watch. It's very complex,has a lot of parts and it only has value whenit's predictable and reliable.” A watchmakerexercises judgment to make the entire sys-tem balanced and reliable, and is not justassembler of parts.
So in today’s environment, discussionson patterns and wave theories tend to yieldmore value than looking at targets andblame. Only recently has analysis of trafficcongestion, especially on major motorwaysidentified the phenomena of waves of buildup and congestion. There comes a point atwhich the system becomes overloaded andresolution comes from de-stressing the sys-tem by enhancing small additional capabili-ties throughout the system, rather than atthe point of impact. In airline operationsthe same skill is deployed in a myriad oftasks throughout a shift to de-stress the
Aviation Strategy
Management
October 201018

system. In the control centre through mak-ing minimal changes and accepting an occa-sional bad delay rather than ending up withtoo many crew and aircraft in the wrongplaces, and through careful stewardship ofreserves of people and capacity rather thanreacting in the moment.
Despite is name and 24 hour role this isnot a theatre for histrionics. Both in thecontrol centre and at airports many issuesare resolved by listening to the staff at thesharp end and thinking system rather thanactivity. At airport level there are count-less options to stop a wobbling systembefore it falls over: opening an extracheck-in desk, deploying a dispatcherearly, sending a loading team to a remotegate in advance of final allocation,requesting additional catering on standby,deploying additional hi-loaders, alertingimmigration and security to potentialadditional peak throughput etc.
The key to good management in botharenas is that the important decisions aretaken in advance and in the light of emerg-ing and ambiguous patterns – hence experi-ence and accessing the experience of spe-cialist colleagues is important. This is sec-ond nature to the operational manager, it iswhat makes the job worthwhile, providedthey understand the bigger system.
It is possible, however, that one productof the constant cost cutting of the last threeyears is now impacting upon the capabilityof airlines to manage the disparate functionknown as ‘operations’. There are fewermanagers, and fewer staff, and amongstthese there may be a reduced collectiveexperience of how to avoid disruption,anticipate passenger reactions, and recoverairline operations with a minimum of fuss,all in the quickest possible time.
Outside world judges
Brand values are built on emotion andas more people speak of their disappoint-ment instantly and uncontrollably throughsocial networks then the level of emotion-al reaction intensifies. But the challenge isnot unique to LCCs. Maintaining premiumpricing demands maintaining premium
service, including punctuality. Recently the bar has been raised on air-
line punctuality and reliability. Some peo-ple, especially travel agents looking aftercorporate accounts, do look at the govern-ment published punctuality reports. Eversince Bob Crandall effectively declared waron Frank Lorenzo’s Continental Airlines bylobbying the US Department of Transportto publish data, punctuality has been amarket force.
Ryanair has consistently surprised otherEuropean airlines by beating them on regu-larity, reliability and punctuality and cus-tomers are aware of this. There may beother reasons why Ryanair is not an auto-matic first choice for many customers butpunctuality is not usually one of them.
Underneath the hype that surrounds theContinental Airlines turnaround of the1990s (which was not “new” - it built uponexperiences from British Airways in the1980s, Lufthansa in the early 1990s, andSouthwest Airlines amongst others) threemessages from that turnaround team totheir managerial colleagues stand out.
First, what most people expect from anairline is getting them where they want togo, on time, safely and with their baggage.Second, the only way to deliver such a ser-vice is by ensuring all the staff want to pro-vide it. Third, delivering good operationsdemands recognition of it as an interactivesystem, not a sum of the parts: exportingthe problem down the line to someoneelse is not acceptable.
The role of the operations manager is tomaintain these perspectives and to workcontinuously on both the inside world ofthe airline that delivers the outputsrequired and the outside world of passen-gers and customers. As UK high streetbanks have started to put executives backinto branches to experience the whole sys-tem at point of impact; as supermarketsand retailers insist that executives manageoutlets as a necessary experience; perhapssome airlines might benefit in a return tothe wisdom of a few years back and ensurethat some in the executive suite and thoseon the way there know what the term‘operations’ actually entails.
Aviation Strategy
Management
October 201019
By Roger Niven

Aviation Strategy
Databases
September 201020
Group Group Group Group Operating Net Total Total Load Total Group
revenue costs op. profit net profit margin margin ASK RPK factor pax. emp.
US$m US$m US$m US$m m m 000s
Air France/ Jul-Sep 08 10,071 9,462 609 44 6.0% 0.4% 69,930 58,041 83.0% 20,439 107,364
KLM Group Oct-Dec 08 7,880 8,136 -256 -666 -3.2% -8.5% 64,457 51,255 79.5% 17,934 106,773
YE 31/03 Jan-Mar 09 6,560 7,310 -751 -661 -11.4% -10.1% 61,235 46,214 75.5% 15,727 106,895
Year 2008/09 34,152 34,335 -184 -1,160 -0.5% -3.4% 262,359 209,060 79.7% 73,844 106,933
Apr-Jun 09 7,042 7,717 -676 -580 -9.6% -8.2% 63,578 50,467 79.4% 18,703 106,800
Jul-Sep 09 8,015 8,082 -67 -210 -0.8% -2.6% 66,862 56,141 84.0% 19,668 105,444
Oct-Dec 09 7,679 8,041 -362 -436 -4.7% -5.7% 61,407 49,220 80.2% 17,264 105,925
Year 2009/10 29,096 31,357 -2,261 -2,162 -7.8% -7.4% 251,012 202,453 80.7% 71,394 104,721
Apr-Jun 10 7,301 7,469 -168 939 -2.3% 12.9% 60,345 49,283 81.7% 17,623 102,918
British Airways Apr-Jun 08 4,455 4,386 69 53 1.5% 1.2% 37,815 27,757 73.4% 8,327
YE 31/03 Jul-Sep 08 4,725 4,524 201 -134 4.3% -2.8% 38,911 29,480 75.8% 8,831 42,330
Oct-Dec 08 3,612 3,692 -80 -134 -2.2% -3.7% 36,300 31,335 86.3% 8,835
Jan-Mar 09 2,689 3,257 -568 -402 -21.1% -14.9% 35,478 25,774 72.6% 7,124
Year 2008/09 15,481 15,860 -379 -616 -2.4% -4.0% 148,504 114,346 77.0% 33,117 41,473
Apr-Jun 09 3,070 3,216 -146 -164 -4.7% -5.3% 36,645 28,446 77.6% 8,446
Jul-Sep 09 3,479 3,507 -28 -167 -0.8% -4.8% 37,767 31,552 83.5% 9,297 38,704
Oct-Dec 09 3,328 3,287 41 -60 1.2% -1.8% 34,248 26,667 77.9% 7,502
Year 2009/10 12,761 13,130 -369 -678 -2.9% -5.3% 141,178 110,851 78.5% 31,825 37,595
Apr-Jun 10 3,092 3,207 -115 -195 -3.7% -6.3% 32,496 24,192 74.4% 7,013
Iberia Oct-Dec 08 1,753 1,836 -83 -25 -4.7% -1.4% 15,875 12,302 77.5% 20,956
YE 31/12 Year 2008 8,019 8,135 -116 47 -1.4% 0.6% 66,098 52,885 80.0% 21,578
Jan-Mar 09 1,436 1,629 -193 -121 -13.4% -8.4% 15,369 11,752 76.5% 20,715
Apr-Jun 09 1,455 1,632 -177 -99 -12.1% -6.8% 15,668 12,733 81.3% 20,760
Jul-Sep 09 1,667 1,744 -77 -23 -4.6% -1.4% 16,275 13,369 82.1% 21,113
Oct-Dec 09 1,589 1,784 -195 -134 -12.3% -8.5% 14,846 11,759 79.2% 20,096
Year 2009 6,149 6,796 -647 -381 -10.5% -6.2% 62,158 49,612 79.8% 20,671
Jan-Mar 10 1,453 1,552 -98 -72 -6.8% -5.0% 14,360 11,605 80.8% 19,643
Apr-Jun 10 1,502 1,498 27 40 1.8% 2.6% 15,324 12,648 82.5% 20,045
Lufthansa Jul-Sep 08 9,835 9,542 293 230 3.0% 2.3% 52,487 42,437 80.9% 18,913 109,401
YE 31/12 Oct-Dec 08 8,237 7,715 522 -5 6.3% -0.1% 47,075 36,632 77.8% 17,150 108,711
Year 2008 36,551 34,625 1,926 812 5.3% 2.2% 195,431 154,155 78.9% 70,543 108,123
Jan-Mar 09 6,560 6,617 -58 -335 -0.9% -5.1% 44,179 32,681 74.0% 15,033 106,840
Apr-Jun 09 7,098 7,027 71 54 1.0% 0.8% 49,939 38,076 76.2% 18,142 105,499
Jul-Sep 09 8,484 8,061 423 272 5.0% 3.2% 56,756 46,780 82.4% 22,164 118,945
Oct-Dec 09 9,041 9,090 -49 -109 -0.5% -1.2% 55,395 43,110 77.8% 21,204 117,521
Year 2009 31,077 30,699 378 -139 1.2% -0.4% 206,269 160,647 77.9% 76,543 112,320
Jan-Mar 10 7,978 8,435 -457 -413 -5.7% -5.2% 52,292 39,181 74.9% 19,031 117,732
Apr-Jun 10 8,763 8,560 203 248 2.3% 2.8% 57,565 45,788 79.5% 22,713 116,844
SAS Jul-Sep 08 2,114 2,085 30 -316 1.4% -14.9% 10,984 8,180 74.5% 7,325 24,298
YE 31/12 Oct-Dec 08 1,652 1,689 -36 -359 -2.2% -21.7% 9,750 6,559 67.3% 6,612 23,082
Year 2008 8,120 8,277 -107 -977 -1.3% -12.0% 41,993 29,916 71.2% 29,000 24,635
Jan-Mar 09 1,352 1,469 -118 -90 -8.7% -6.6% 8,870 5,541 62.5% 5,748 22,133
Apr-Jun 09 1,546 1,665 -119 -132 -7.7% -8.6% 9,584 7,055 73.6% 6,850 18,676
Jul-Sep 09 1,522 1,486 36 21 2.3% 1.4% 8,958 6,868 76.7% 6,245 17,825
Oct-Dec 09 1,474 1,676 -202 -186 -13.7% -12.6% 8,160 5,764 70.6% 6,055 16,510
Year 2009 5,914 6,320 -406 -388 -6.9% -6.6% 35,571 25,228 70.9% 24,898 18,786
Jan-Mar 10 1,322 1,428 -106 -99 -8.0% -7.5% 7,951 5,471 68.8% 5,735 15,835
Apr-Jun 10 1,321 1,367 -46 -66 -3.5% -5.0% 8,769 6,612 75.4% 6,282 15,709
Ryanair Apr-Jun 08 1,215 1,202 13 -141 1.0% -11.6% 81.0% 14,953
YE 31/03 Jul-Sep 08 1,555 1,250 305 280 19.6% 18.0% 88.0% 16,675
Oct-Dec 08 798 942 -144 -157 -18.0% -19.7% 71.3% 14,029 6,298
Jan-Mar 09 623 592 31 -223 5.0% -35.8% 74.6% 12,902
Year 2008/09 4,191 3,986 205 -241 4.9% -5.7% 81.0% 58,559
Apr-Jun 09 1,055 844 211 168 20.0% 15.9% 83.0% 16,600
Jul-Sep 09 1,418 992 426 358 30.0% 25.2% 88.0% 19,800
Oct-Dec 09 904 902 2 -16 0.2% -1.8% 82.0% 16,021
Year 2009/10 4,244 3,656 568 431 13.5% 10.2% 82.0% 66,500
Apr-Jun 10 1,145 992 152 120 13.3% 10.5% 83.0% 18,000 7,828
easyJet Year 2006/07 3,679 3,069 610 311 16.6% 8.5% 43,501 36,976 83.7% 37,200 5,674
YE 30/09 Oct 07-Mar 08 1,795 1,772 22 -87 1.2% -4.8% 23,442 19,300 82.3% 18,900
Apr-Sep 08 2,867 2,710 157 251 5.5% 8.7% 32,245 28,390 88.0% 24,800
Year 2007/08 4,662 4,483 180 164 3.9% 3.5% 55,687 47,690 85.6% 43,700 6,107
Oct 08-Mar 09 1,557 1,731 -174 -130 -11.2% -8.3% 24,754 21,017 84.9% 19,400
Apr-Sep 09 2,607 2,063 280 251 10.7% 9.6% 33,411 29,549 88.4% 25,800
Year 2008/09 4,138 3,789 93 110 2.3% 2.7% 58,165 50,566 86.9% 45,200
Oct 09-Mar10 1,871 1,995 -106 -94 -5.6% -5.0 27,077 23,633 87.3% 21,500
Note: Annual figures may not add up to sum of interim results due to adjustments and consolidation.

Aviation Strategy
Databases
September 201021
Group Group Group Group Operating Net Total Total Load Total Group
revenue costs op. profit net profit margin margin ASK RPK factor pax. emp.
US$m US$m US$m US$m m m 000s
Alaska Year 2008 3,663 3,835 -172 -136 -4.7% -3.7% 38,974 30,113 77.3% 16,809 9,628
Jan-Mar 09 742 754 -12 -19 -1.6% -2.6% 8,883 6,725 75.7% 3,573 9,021
Apr-Jun 09 844 777 67 29 7.9% 3.4% 9,418 7,428 78.9% 3,983 8,937
Jul-Sep 09 967 807 160 88 16.5% 9.1% 9,812 8,079 82.3% 4,240 9,002
Oct-Dec 09 846 793 53 24 6.3% 2.8% 9,133 7,322 80.2% 3,765 8,701
Year 2009 3,399 3,132 267 122 7.9% 3.6% 37,246 29,550 79.3% 15,561 8,915
Jan-Mar 10 830 804 26 5 3.1% 0.6% 8,917 7,197 80.7% 3,641 8,537
Apr-Jun 10 976 866 110 59 11.3% 6.0% 9,836 8,162 83.0% 4,170 8,621
American Year 2008 23,766 25,655 -1,889 -2,118 -7.9% -8.9% 263,106 211,993 80.6% 92,772 84,100
Jan-Mar 09 4,839 5,033 -194 -375 -4.0% -7.7% 60,804 46,015 75.7% 20,331 79,500
Apr-Jun 09 4,889 5,115 -226 -390 -4.6% -8.0% 62,064 50,796 81.8% 22,092 79,200
Jul-Sep 09 5,126 5,320 -194 -359 -3.8% -7.0% 62,026 52,064 83.9% 22,403 78,700
Oct-Dec 09 5,063 5,453 -390 -344 -7.7% -6.8% 59,356 48,131 81.1% 20,893 78,000
Year 2009 19,917 20,921 -1,004 -1,468 -5.0% -7.4% 244,250 197,007 80.7% 85,719 78,900
Jan-Mar 10 5,068 5,366 -298 -505 -5.9% -10.0% 59,296 46,187 77.9% 20,168 77,800
Apr-Jun 10 5,674 5478 196 -11 3.5% -0.2% 61,788 51,821 83.9% 22,166 78,300
Continental Year 2008 15,241 15,555 -314 -586 -2.1% -3.8% 185,892 149,160 80.2% 66,692 42,000
Jan-Mar 09 2,962 3,017 -55 -136 -1.9% -4.6% 42,362 31,848 75.2% 14,408 43,000
Apr-Jun 09 3,126 3,280 -154 -213 -4.9% -6.8% 45,072 37,281 82.7% 16,348 43,000
Jul-Sep 09 3,317 3,256 61 -18 1.8% -0.5% 46,562 39,616 85.1% 16,795 41,000
Oct-Dec 09 3,182 3,181 1 85 0.0% 2.7% 42,308 34,700 82.0% 15,258 41,000
Year 2009 12,586 12,732 -146 -282 -1.2% -2.2% 176,305 143,447 81.4% 62,809 41,000
Jan-Mar 10 3,169 3,220 -51 -146 -1.6% -4.6% 42,350 33,665 79.5% 14,535 39,365
Apr-Jun 10 3,708 3,380 328 233 8.8% 6.3% 39,893 33,910 85.0% 16,300 38,800
Delta Year 2008 22,697 31,011 -8,314 -8,922 -36.6% -39.3% 396,152 326,247 82.4% 171,572 75,000
Jan-Mar 09 6,684 7,167 -483 -794 -7.2% -11.9% 89,702 69,136 77.1% 37,310 83,822
Apr-Jun 09 7,000 6,999 1 -257 0.0% -3.7% 94,995 78,941 83.1% 42,050 82,968
Jul-Sep 09 7,574 7,370 204 -161 2.7% -2.1% 100,115 85,904 85.8% 43,742 81,740
Oct-Dec 09 6,805 6,851 -46 -25 -0.7% -0.4% 85,814 70,099 81.7% 37,947 81,106
Year 2009 28,063 28,387 -324 -1,237 -1.2% -4.4% 370,672 304,066 82.0% 161,049 81,106
Jan-Mar 10 6,848 6,780 68 -256 1.0% -3.7% 85,777 68,181 79.5% 36,553 81,096
Apr-Jun 10 8,168 7,316 852 467 10.4% 5.7% 94,463 80,294 85.0% 42,207 81,916
Southwest Year 2008 11,023 10,574 449 178 4.1% 1.6% 166,194 118,271 71.2% 101,921 35,506
Jan-Mar 09 2,357 2,407 -50 -91 -2.1% -3.9% 38,899 27,184 69.9% 23,050 35,512
Apr-Jun 09 2,616 2,493 123 54 4.7% 2.1% 41,122 31,676 77.0% 26,505 35,296
Jul-Sep 09 2,666 2,644 22 -16 0.8% -0.6% 39,864 31,714 79.6% 26,396 34,806
Oct-Dec 09 2,712 2,545 167 116 6.2% 4.3% 37,828 29,249 77.3% 25,386 34,726
Year 2009 10,350 10,088 262 99 2.5% 1.0% 157,714 119,823 76.0% 101,338 34,726
Jan-Mar 10 2,630 2,576 54 11 2.1% 0.4% 36,401 27,618 75.9% 23,694 34,637
Apr-Jun 10 3,168 2,805 363 112 11.5% 3.5% 40,992 32,517 79.3% 22,883 34,636
United Year 2008 20,194 24,632 -4,438 -5,396 -22.0% -26.7% 244,654 196,682 80.4% 86,427 49,600
Jan-Mar 09 3,691 3,973 -282 -382 -7.6% -10.3% 54,834 41,533 75.7% 18,668 44,800
Apr-Jun 09 4,018 3,911 107 28 2.7% 0.7% 57,901 47,476 82.0% 21,064 43,800
Jul-Sep 09 4,433 4,345 88 -57 2.0% -1.3% 59,599 50,572 84.9% 22,076 43,600
Oct-Dec 09 4,193 4,267 -74 -240 -1.8% -5.7% 54,121 44,273 81.8% 19,618 42,700
Year 2009 16,335 16,496 -161 -651 -1.0% -4.0% 226,454 183,854 81.2% 81,246 43,600
Jan-Mar 10 4,241 4,172 69 -82 1.6% -1.9% 53,023 42,614 80.4% 18,818 42,800
Apr-Jun 10 5,161 4,727 434 273 8.4% 5.3% 58,522 49,319 84.3% 21,234 42,600
US Airways Group Year 2008 12,118 13,918 -1,800 -2,215 -14.9% -18.3% 143,395 114,944 80.2% 81,552 32,671
Jan-Mar 09 2,455 2,480 -25 -103 -1.0% -4.2% 32,884 25,239 76.7% 18,387 32,245
Apr-Jun 09 2,658 2,536 122 58 4.6% 2.2% 35,382 29,507 83.4% 20,491 32,393
Jul-Sep 09 2,719 2,713 6 -80 0.2% -2.9% 36,214 29,920 82.6% 20,284 31,592
Oct-Dec 09 2,626 2,612 14 -79 0.5% -3.0% 32,456 25,509 78.6% 18,801 31,333
Year 2009 10,458 10.340 118 -205 1.1% -2.0% 136,939 110,171 80.5% 77,965 31,333
Jan-Mar 10 2,651 2,661 -10 -45 -0.4% -1.7% 31,957 24,659 77.2% 17,931 30,439
Apr-Jun 10 3,171 2,800 371 279 11.7% 8.7% 35,517 29,461 82.9% 20,642 30,860
JetBlue Year 2008 3,388 3,279 109 -85 3.2% -2.5% 52,209 41,956 80.4% 21,920 9,895
Jan-Mar 09 793 720 73 12 9.2% 1.5% 12,781 9,720 76.0% 5,291 10,047
Apr-Jun 09 807 731 76 20 9.4% 2.5% 13,256 10,533 79.5% 5,691 10,235
Jul-Sep 09 854 788 66 15 7.7% 1.8% 13,504 11,309 83.7% 6,011 10,246
Oct-Dec 09 832 768 64 11 7.7% 1.3% 12,855 10,208 79.4% 5,457 10,704
Year 2009 3,286 3,007 279 58 8.5% 1.8% 52,396 41,769 79.7% 22,450 10,704
Jan-Mar 10 870 828 42 -1 4.8% -0.1% 13,557 10,412 76.8% 5,528 11,084
Apr-Jun 10 939 845 94 30 10.0% 3.2% 13,981 11,468 82.0% 6,114 10,906
Note: Annual figures may not add up to sum of interim results due to adjustments and consolidation. 1 ASM = 1.6093 ASK. All US airline financial year ends are December 31st.

Group Group Group Group Operating Net Total Total Load Total Group
revenue costs op. profit net profit margin margin ASK RPK factor pax. emp.
US$m US$m US$m US$m m m 000s
ANA Year 2005/06 12,040 11,259 781 235 6.5% 2.0% 86,933 58,949 67.8% 49,920 30,322
YE 31/03 Year 2006/07 12,763 11,973 790 280 6.2% 2.2% 85,728 58,456 68.2% 49,500 32,460
Year 2007/08 13,063 12,322 740 563 5.7% 4.3% 90,936 61,219 67.3% 50,384
Year 2008/09 13,925 13,849 75 -42 0.5% -0.3% 87,127 56,957 65.4% 47,185
Year 2009/10 13,238 13,831 -582 -614 -4.4% -4.6% 83,827 55,617 66.3% 44,560
Cathay Pacific Jan-Jun 07 4,440 4,031 409 341 9.2% 7.7% 49,836 38,938 79.6% 8,474 19,207
YE 31/12 Year 2007 9,661 8,670 991 900 10.3% 9.3% 102,462 81,101 79.8% 23,250 19,840
Jan-Jun 08 5,443 5,461 -18 -71 -0.3% -1.3% 56,949 45,559 80.0% 12,463
Year 2008 11,119 12,138 -1,018 -1,070 -9.2% -9.6% 115,478 90,975 78.8% 24,959 18,718
Jan-Jun 09 3,988 3,725 263 119 6.6% 3.0% 55,750 43,758 78.5% 11,938 18,800
Year 2009 8,640 7,901 740 627 8.6% 7.3% 111,167 96,382 86.7% 24,558 18,511
Jan-Jun 10 5,320 4,681 917 892 17.2% 16.8% 55,681 46,784 84.0% 12,954
JAL Year 2004/05 19,905 19,381 524 281 2.6% 1.4% 151,902 102,354 67.4% 59,448 53,962
YE 31/03 Year 2005/06 19,346 19,582 -236 -416 -1.2% -2.2% 148,591 100,345 67.5% 58,040 53,010
Year 2006/07 19,723 19,527 196 -139 1.0% -0.7% 139,851 95,786 68.5% 57,510
Year 2007/08 19,583 18,793 790 148 4.0% 0.8% 134,214 92,173 68.7% 55,273
Year 2008/09 19,512 20,020 -508 -632 -2.6% -3.2% 128,744 83,487 64.8% 52,858
Korean Air Year 2005 7,439 7,016 423 198 5.7% 2.7% 66,658 49,046 73.6% 21,710 17,573
YE 31/12 Year 2006 8,498 7,975 523 363 6.2% 4.3% 71,895 52,178 72.6% 22,140 16,623
Year 2007 9,496 8,809 687 12 7.2% 0.1% 76,181 55,354 72.7% 22,830 16,825
Year 2008 9,498 9,590 -92 -1,806 -1.0% -19.0% 77,139 55,054 71.4% 21,960 18,600
Year 2009 7,421 7,316 105 -49 1.4% -0.7% 80,139 55,138 68.8% 20,750
Malaysian Year 2004/05 3,141 3,555 -414 -421 -13.2% -13.4% 64,115 44,226 69.0% 22,513
YE 31/03 Apr-Dec 05 2,428 2,760 -332 -331 -13.7% -13.6% 49,786 35,597 71.5% 22,835
YE 31/12 Year2006 3,696 3,751 -55 -37 -1.5% -1.0% 58,924 41,129 69.8% 15,466 19,596
Year 2007 4,464 4,208 256 248 5.7% 5.6% 56,104 40,096 71.5% 13,962 19,423
Year2008 4,671 4,579 92 74 2.0% 1.6% 52,868 35,868 67.8% 12,630 19,094
Year 2009 3,296 3,475 -179 140 -5.4% 4.3% 12,000
Qantas Year 2006/07 11,975 11,106 869 568 7.3% 4.7% 122,119 97,622 79.9% 36,450 34,267
YE 30/6 Jul-Dec 07 7,061 6,323 738 537 10.5% 7.6% 63,627 52,261 82.1% 19,783 33,342
Year 2007/08 14,515 13,283 1,232 869 8.5% 6.0% 127,019 102,466 80.7% 38,621 33,670
Jul-Dec 08 6,755 6,521 234 184 3.5% 2.7% 63,853 50,889 79.7% 19,639 34,110
Year 2008/09 10,855 10,733 152 92 1.4% 0.8% 124,595 99,176 79.6% 38,348 33,966
Jul-Dec 09 6,014 5,889 124 52 2.1% 0.9% 62,476 51,494 82.4% 21,038 32,386
Year 2009/10 12,150 11,926 223 102 1.8% 0.8% 124,717 100,727 80.8% 41,428 32,490
Singapore Year 2005/06 6,201 5,809 392 449 6.3% 7.2% 109,484 82,742 75.6% 17,000 13,729
YE 31/03 Year 2006/07 9,555 8,688 866 1,403 9.1% 14.7% 112,544 89,149 79.2% 18,346 13,847
Year 2007/08 10,831 9,390 1,441 1,449 13.3% 13.4% 113,919 91,485 80.3% 19,120 14,071
Year 2008/09 11,135 10,506 629 798 5.6% 7.2% 117,789 90,128 76.5% 18,293 14,343
Year 2009/10 8,908 8,864 44 196 0.5% 2.2% 105,674 82,882 78.4% 16,480
Air China Year 2005 4,681 4,232 449 294 9.6% 6.3% 70,670 52,453 74.2% 27,690 18,447
YE 31/12 Year 2006 5,647 5,331 316 338 5.6% 6.0% 79,383 60,276 75.9% 31,490 18,872
Year 2007 6,770 6,264 506 558 7.5% 8.2% 85,257 66,986 78.6% 34,830 19,334
Year 2008 7,627 7,902 -275 -1,350 -3.6% -17.7% 88,078 66,013 74.9% 34,250 19,972
Year 2009 7,523 6,718 805 710 10.7% 9.4% 95,489 73,374 76.8% 39,840
China Southern Year 2005 4,682 4,842 -160 -226 -3.4% -4.8% 88,361 61,923 70.1% 44,120 34,417
YE 31/12 Year 2006 5,808 5,769 39 26 0.7% 0.4% 97,044 69,575 71.7% 49,200 45,575
Year 2007 7,188 6,974 214 272 3.0% 3.8% 109,733 81,172 74.0% 56,910 45,474
Year 2008 7,970 8,912 -942 -690 -11.8% -8.7% 112,767 83,184 73.8% 58,240 46,209
Year 2009 8,022 7,811 211 48 2.6% 0.6% 123,440 93,000 75.3% 66,280
China Eastern Year 2005 3,356 3,372 -16 -57 -0.5% -1.7% 52,428 36,381 69.4% 24,290 29,301
YE 31/12 Year 2006 3,825 4,201 -376 -416 -9.8% -10.9% 70,428 50,243 71.3% 35,020 38,392
Year 2007 5,608 5,603 5 32 0.1% 0.6% 77,713 57,180 73.6% 39,160 40,477
Year 2008 6,018 8,192 -2,174 -2,201 -36.1% -36.6% 75,919 53,754 70.8% 37,220 44,153
Year 2009 5,896 5,629 267 25 4.5% 0.4% 84,422 60,918 72.2% 44,030
Air Asia Jan-Mar 09 198 84 114 56 57.6% 28.4% 5,207 3,487 67.0% 3,147
YE 31/12 Apr-Jun 09 186 94 91 39 49.1% 21.1% 5,520 4,056 73.5% 3,519
Jul-Sep 09 211 145 66 37 31.1% 17.6% 5,449 3,769 69.2% 3,591
Oct-Dec 09 263 169 95 23 35.9% 8.6% 5,863 4,410 75.2% 3,995
Year 2009 905 539 366 156 40.4% 17.3% 21,977 15,432 70.2% 14,253
Jan-Mar 10 260 159 89 66 34.2% 25.4% 5,929 4,090 68.9% 3,700 7,500
October 201022
Aviation Strategy
Databases
Note: Annual figures may not add up to sum of interim results due to adjustments and consolidation..

Date Buyer Order Delivery/other information
Boeing 01 Oct Luxair 1 x 737-80022 Sep Cathay Pacific 6 x 777-300ER exercised purchase rights
Airbus 20 Sep Malaysia Airlines 2 x A330-200F PW400016 Sep Cathay Pacific 30 x A350 XWB
October 201023
Aviation Strategy
Databases
JET ORDERS
Note: Only firm orders from identifiable airlines/lessors are included. Source: Manufacturers.
Intra-Europe North Atlantic Europe-Far East Total long-haul Total International
ASK RPK LF ASK RPK LF ASK RPK LF ASK RPK LF ASK RPK LF
bn bn % bn bn % bn bn % bn bn % bn bn %
1991 114.8 65.2 56.8 120.9 84.3 69.7 80.0 53.1 66.4 267.6 182.0 68.0 397.8 257.9 64.7
1992 129.6 73.5 56.7 134.5 95.0 70.6 89.4 61.6 68.9 296.8 207.1 69.8 445.8 293.4 65.8
1993 137.8 79.8 57.9 145.1 102.0 70.3 96.3 68.1 70.7 319.1 223.7 70.1 479.7 318.0 66.3
1994 144.7 87.7 60.6 150.3 108.8 72.4 102.8 76.1 74.0 334.0 243.6 72.9 503.7 346.7 68.8
1995 154.8 94.9 61.3 154.1 117.6 76.3 111.1 81.1 73.0 362.6 269.5 74.3 532.8 373.7 70.1
1996 165.1 100.8 61.1 163.9 126.4 77.1 121.1 88.8 73.3 391.9 292.8 74.7 583.5 410.9 70.4
1997 174.8 110.9 63.4 176.5 138.2 78.3 130.4 96.9 74.3 419.0 320.5 76.5 621.9 450.2 72.4
1998 188.3 120.3 63.9 194.2 149.7 77.1 135.4 100.6 74.3 453.6 344.2 75.9 673.2 484.8 72.0
1999 200.0 124.9 62.5 218.9 166.5 76.1 134.5 103.1 76.7 492.3 371.0 75.4 727.2 519.5 71.4
2000 208.2 132.8 63.8 229.9 179.4 78.1 137.8 108.0 78.3 508.9 396.5 77.9 755.0 555.2 73.5
2001 212.9 133.4 62.7 217.6 161.3 74.1 131.7 100.9 76.6 492.2 372.6 75.7 743.3 530.5 71.4
2002 197.2 129.3 65.6 181.0 144.4 79.8 129.1 104.4 80.9 447.8 355.1 79.3 679.2 507.7 74.7
2003 210.7 136.7 64.9 215.0 171.3 79.7 131.7 101.2 76.8 497.2 390.8 78.6 742.6 551.3 74.2
2004 220.6 144.2 65.4 224.0 182.9 81.6 153.6 119.9 78.0 535.2 428.7 80.1 795.7 600.7 75.5
2005 309.3 207.7 67.2 225.9 186.6 82.6 168.6 134.4 79.7 562.6 456.4 81.1 830.8 639.3 76.9
2006 329.9 226.6 68.7 230.5 188.0 81.5 182.7 147.5 80.7 588.2 478.4 81.3 874.6 677.3 77.4
2007 346.6 239.9 69.2 241.4 196.1 81.2 184.2 152.1 82.6 610.6 500.4 81.9 915.2 713.9 78.0
2008 354.8 241.5 68.1 244.8 199.2 81.4 191.1 153.8 80.5 634.7 512.4 80.7 955.7 735.0 76.9
2009 322.1 219.3 68.1 227.8 187.7 82.4 181.2 145.8 80.5 603.8 488.7 80.9 912.7 701.1 76.8
May 10 29.5 20.9 70.8 20.0 16.9 84.5 15.1 11.8 78.1 50.9 40.9 80.3 79.1 60.7 76.8
Ann. change -0.6% 3.1% 2.5 -2.5% 1.3% 3.2 -0.6% 5.5% 4.5 0.6% 4.9% 3.3 0.3% 4.6% 3.2
Jan-May 10 129.2 84.8 65.6 83.9 67.6 80.6 70.9 57.9 81.7 234.9 189.7 80.8 358.3 271.9 75.9
Ann. change -4.6% -1.7% 1.9 -6.7% -1.8% 4.0 -6.3% -1.0% 4.4 -4.6% -0.1% 3.6 -4.3% -0.2% 3.1
EUROPEAN SCHEDULED TRAFFIC
Source: AEA.

The Principals and Associates of Aviation Economics apply a problem-solving,
creative and pragmatic approach to commercial aviation projects.
Our expertise is in strategic and financial consulting in Europe,
the Americas, Asia, Africa and the Middle East, covering:
• Start-up business plans • Turnaround strategies • State aid applications • Due diligence • Privatisation projects • Asset valuations• Antitrust investigations • Merger/takeover proposals • Competitor analyses • Credit analysis • Corporate strategy reviews • Market analyses• IPO prospectuses • Antitrust investigations • Traffic/revenue forecasts
For further information please contact:
Tim Coombs or Keith McMullan
Aviation Economics
James House, 1st Floor, 22/24 Corsham Street, London N1 6DR
Tel: + 44 (0)20 7490 5215 Fax: +44 (0)20 7490 5218. e-mail: [email protected]
PLEASE RETURN THIS FORM TO:Aviation Economics
James House, 1st Floor
22/24 Corsham Street
London N1 6DR
Fax: +44 (0)20 7490 5218
Delivery address
Name
Position
Company
Address
Country Postcode
Tel Fax
I enclose a Sterling, Euro or US Dollar cheque,
made payable to:
Aviation Economics
Please invoice me
Please charge my AMEX/Mastercard/Visa
credit card the sum of £450
Card number
Name on card Expiry date
I am sending a direct bank transfer of £450 net
of all charges to Aviation Economics’ account:
HSBC Bank, IBAN: GB33MIDL40043791256904
Sort code: 40 04 37 Account no: 91256904
Aviation Economics
Please enter my Aviation Strategy sub-
scription for:
1 year (10 issues - Jan/Feb and Jul/Aug
are combined)
@ £450 / €550 / US$750,
starting with the issue
DATA PROTECTION ACTThe information you provide will be held on our database and may be
used to keep you informed of our products and services or for selected
third party mailings
Invoice address (if different from delivery address)
Name
Position
Company
Address
Country Postcode
SUBSCRIPTION FORM
Subscribers can access Aviation Strategy (including all back issues)through our website: www.aviationeconomics.com
However, you need a personal password - to obtain it please e-mail [email protected]
Aviation Strategy Online
![PERFORMANCE REVIEW - ir.airasia.com · 1 AirAsia Berhad refers to AirAsia Malaysia, AirAsia Indonesia and AirAsia Philippines [ ]74 AirAsia Group Berhad PERFORMANCE REVIEW PERFORMANCE](https://static.fdocuments.in/doc/165x107/5e70c7c4c269c907066397d4/performance-review-ir-1-airasia-berhad-refers-to-airasia-malaysia-airasia-indonesia.jpg)