AviATion AnD AiRpoRT GRounD ACCEssrtpscs.scag.ca.gov/Documents/2012/draft/SR/2012dRTP...AviATion AnD...
170
DRAFT DECEMBER 2011 Southern California Association of Governments AVIATION AND AIRPORT GROUND ACCESS
Transcript of AviATion AnD AiRpoRT GRounD ACCEssrtpscs.scag.ca.gov/Documents/2012/draft/SR/2012dRTP...AviATion AnD...

DRAFT DECEMBER 2011Southern California Association of Governments
AviATion AnD AiRpoRTGRounD ACCEss
AviATion AnD AiRpoRT GRounD ACCEss
Regional Air Passenger Demand Forecast Scenarios for 2012–2035 Regional Transportation Plan 1
Background 1
Regional Air Cargo Demand Forecast Scenarios for 2012–2035 RTP 5
Background 5
Regional General Aviation Forecast 9
Phase 1 Technical Report 9
Forecast Methodology 15
Literature Review on Forecasting General Aviation Activity 15
Federal Aviation Forecasts of General Aviation Activity 33
FAA National Aerospace Forecast 33
FAA Terminal Area Forecast 35
Forecasts of Based Aircraft and Associated Aircraft Operations 73
Summary and Conclusions 89
References 94
Regional Aviation Policies and Action Steps 97
Background 97
Airport Ground Access Report 100
Objective of the Study 100
APPENDIX I: Airport and Agency Contacts 144
APPENDIX II: High Occupancy Public Transportation and High Speed Rail 146
References 163
APPENDIX III: Characteristics of a Successful Airport Express Bus 164
Aviation and Airport Group Access 1
Regional Air passenger Demand Forecast scenarios for 2012–2035 Regional Transportation plan
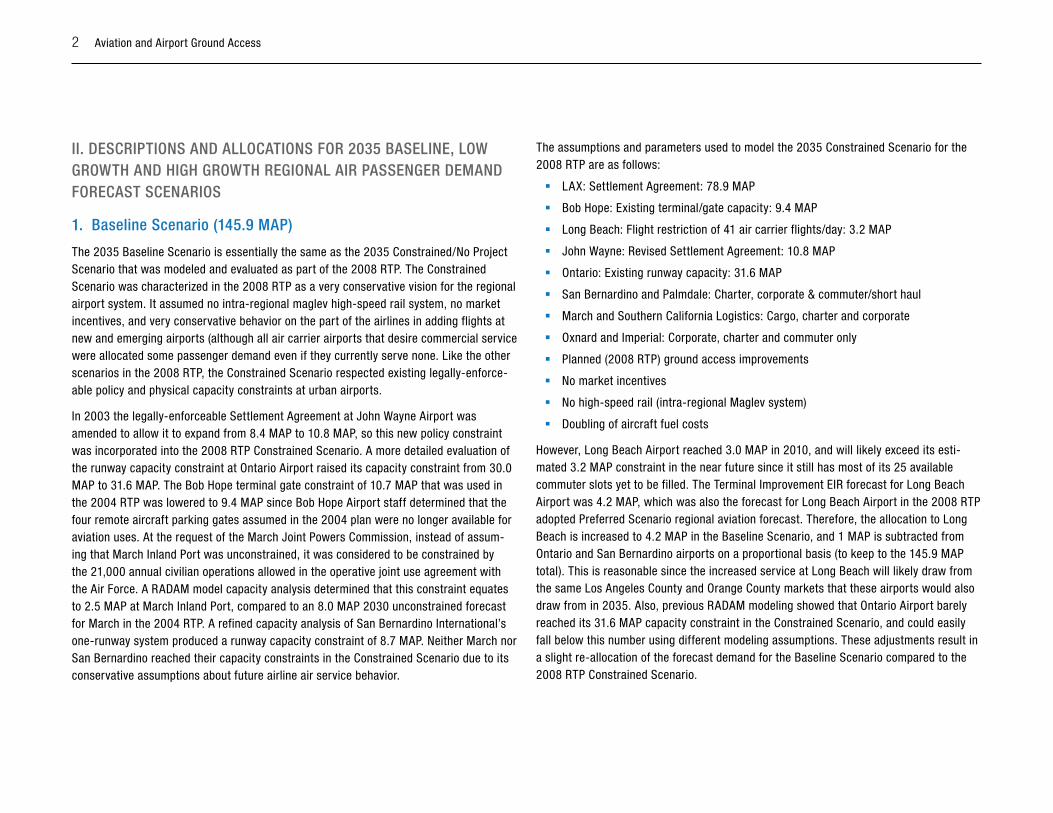
BackgroundThe SCAG Aviation Technical Advisory Committee (ATAC) approved three alternative 2035 regional air passenger demand forecast scenarios for commercial airports, to be con-sidered for potential inclusion in SCAG’s 2012-2035 Regional Transportation Plan (RTP). These include baseline/medium growth, low growth, and high growth scenarios. ATAC members agreed that the scenarios present a reasonable range of possible growth rates for commercial aviation in the region over the next 25 years. This report describes these forecast scenarios, including an allocation of 2035 passenger demand to individual com-mercial airports for each scenario. It also presents a recommendation that ATAC made at its September 22, 2011 meeting for the Baseline Scenario to serve as the Preferred Regional Air Passenger Demand Forecast for the 2012-2035 RTP, with several caveats.
i. CoMpARison oF REGionAl AiR pAssEnGER DEMAnD FoRECAsTs wiTh oThER RECEnT FoRECAsTs
Recent aviation industry air passenger demand forecasts have been reviewed for consistency with the 2035 baseline, the high and low growth regional air passenger demand forecast scenarios, all of which were approved by the ATAC for inclusion in the 2012-2035 RTP. Those recent forecasts include ones completed by the Federal Aviation Administration (FAA), Boeing, Airbus, the San Francisco Bay Area (Regional Airport System Plan Analysis) and San Diego County (Regional Aviation Strategic Plan). A com-parison of the yearly (per annum) growth rates between these forecasts can be seen below. The combined commercial activity level served by the six air carrier airports in the region in 2010 was 81.48 million annual air passengers (MAP). This is up from the 79.08 MAP they served in 2009, but it is still significantly lower than the 90.06 MAP they served in 2007.
Average Annual Growth Rates of Alternative passenger Forecast scenarios
1. Baseline Scenario (145.9 MAP) 2.5% p.a.
2. Low Growth Scenario (130.0 MAP) 2.1% p.a.
3. High Growth Scenario (164.0 MAP) 3.0% p.a.
Average Annual Growth Rates of Recent Industry and Regional Passenger Forecasts
1. FAA Aerospace Forecast 3.2% p.a.
2. Boeing 3.2% p.a.
3. Airbus 2.7% p.a.
4. California regional studies 1.4% to 2.8% p.a.
In general, the annual growth rates of these air passenger forecast scenarios for the SCAG region (baseline/medium growth, high growth and low growth) are somewhat lower than growth rates in forecasts developed by the FAA, Boeing and Airbus, and are generally consistent with growth rates in forecasts developed by the other two regions in California. However, the Low Growth Scenario growth rate is not as low as the lowest growth rates recently considered by the other California regions. Strategically, the upper forecast in the High Growth Scenario is more important than the lower forecast, since the upper forecast determines whether or not the region may run out of airport capacity ear-lier than was anticipated if it is too low. If it is too high, the forecast can just be pushed farther out into the future when it is updated by the next RTP cycle.
At several ATAC meetings, members debated the reasonableness of the growth rates in the Baseline, High Growth and Low Growth scenarios. In general, the members thought they bracketed a reasonable a reasonable range of possible growth rates for commercial aviation in the region over the next 25 years, which is consistent with other recent fore-casts (although the San Francisco Bay Area and San Diego have considered even lower yearly growth rates than what is reflected in the Low Growth Scenario).
2 Aviation and Airport Ground Access
ii. DEsCRipTions AnD AlloCATions FoR 2035 BAsElinE, low GRowTh AnD hiGh GRowTh REGionAl AiR pAssEnGER DEMAnD FoRECAsT sCEnARios
1. Baseline scenario (145.9 MAp)
The 2035 Baseline Scenario is essentially the same as the 2035 Constrained/No Project Scenario that was modeled and evaluated as part of the 2008 RTP. The Constrained Scenario was characterized in the 2008 RTP as a very conservative vision for the regional airport system. It assumed no intra-regional maglev high-speed rail system, no market incentives, and very conservative behavior on the part of the airlines in adding flights at new and emerging airports (although all air carrier airports that desire commercial service were allocated some passenger demand even if they currently serve none. Like the other scenarios in the 2008 RTP, the Constrained Scenario respected existing legally-enforce-able policy and physical capacity constraints at urban airports.
In 2003 the legally-enforceable Settlement Agreement at John Wayne Airport was amended to allow it to expand from 8.4 MAP to 10.8 MAP, so this new policy constraint was incorporated into the 2008 RTP Constrained Scenario. A more detailed evaluation of the runway capacity constraint at Ontario Airport raised its capacity constraint from 30.0 MAP to 31.6 MAP. The Bob Hope terminal gate constraint of 10.7 MAP that was used in the 2004 RTP was lowered to 9.4 MAP since Bob Hope Airport staff determined that the four remote aircraft parking gates assumed in the 2004 plan were no longer available for aviation uses. At the request of the March Joint Powers Commission, instead of assum-ing that March Inland Port was unconstrained, it was considered to be constrained by the 21,000 annual civilian operations allowed in the operative joint use agreement with the Air Force. A RADAM model capacity analysis determined that this constraint equates to 2.5 MAP at March Inland Port, compared to an 8.0 MAP 2030 unconstrained forecast for March in the 2004 RTP. A refined capacity analysis of San Bernardino International’s one-runway system produced a runway capacity constraint of 8.7 MAP. Neither March nor San Bernardino reached their capacity constraints in the Constrained Scenario due to its conservative assumptions about future airline air service behavior.
The assumptions and parameters used to model the 2035 Constrained Scenario for the 2008 RTP are as follows:
� LAX: Settlement Agreement: 78.9 MAP
� Bob Hope: Existing terminal/gate capacity: 9.4 MAP
� Long Beach: Flight restriction of 41 air carrier flights/day: 3.2 MAP
� John Wayne: Revised Settlement Agreement: 10.8 MAP
� Ontario: Existing runway capacity: 31.6 MAP
� San Bernardino and Palmdale: Charter, corporate & commuter/short haul
� March and Southern California Logistics: Cargo, charter and corporate
� Oxnard and Imperial: Corporate, charter and commuter only
� Planned (2008 RTP) ground access improvements
� No market incentives
� No high-speed rail (intra-regional Maglev system)
� Doubling of aircraft fuel costs
However, Long Beach Airport reached 3.0 MAP in 2010, and will likely exceed its esti-mated 3.2 MAP constraint in the near future since it still has most of its 25 available commuter slots yet to be filled. The Terminal Improvement EIR forecast for Long Beach Airport was 4.2 MAP, which was also the forecast for Long Beach Airport in the 2008 RTP adopted Preferred Scenario regional aviation forecast. Therefore, the allocation to Long Beach is increased to 4.2 MAP in the Baseline Scenario, and 1 MAP is subtracted from Ontario and San Bernardino airports on a proportional basis (to keep to the 145.9 MAP total). This is reasonable since the increased service at Long Beach will likely draw from the same Los Angeles County and Orange County markets that these airports would also draw from in 2035. Also, previous RADAM modeling showed that Ontario Airport barely reached its 31.6 MAP capacity constraint in the Constrained Scenario, and could easily fall below this number using different modeling assumptions. These adjustments result in a slight re-allocation of the forecast demand for the Baseline Scenario compared to the 2008 RTP Constrained Scenario.
Aviation and Airport Group Access 3
2. low Growth scenario (130 MAp)
The 130 MAP total assumed for the 2035 Low Growth scenario is not based on any past modeling, and is lower than any regional aviation scenario modeled for previous RTPs, including 2020 forecasts for the 1998 RTP. It was viewed by the ATAC to represent a rea-sonable low end of the range of possible regional aviation demand futures. The demand allocation for this scenario assumes that the constrained urban airports (LAX, Bob Hope, Long Beach and John Wayne) would still reach their capacity constraints, and allocation of the remaining passenger demand (26.7 MAP) to the other airports would be based on their proportional shares in the Baseline Scenario.
3. high Growth scenario (164 MAp)
The 2035 High Growth Scenario represents an extrapolation of the 2030 FAA Terminal Area Forecast (TAF) for air carrier airports in the region (3.0 percent growth rate per annum). The TAF is an unconstrained econometric forecast for established air carrier airports, based on historical trends as reported by the airports themselves. The 2030 TAF for LAX, Long Beach, Burbank and John Wayne airports exceeds their legally-enforceable or physical capacity constraints by significant margins. At 164 MAP, the High Growth Scenario is slightly below the 165.3 MAP forecast of the 2035 Preferred Scenario adopted for the 2008 RTP. Like all the other regional aviation demand scenarios modeled for the 2008 RTP, the Preferred Scenario respected legally-enforceable policy constraints and physical capacity constraints at the urban air carrier airports, as well as estimated capacity constraints at Ontario Airport (runway capacity) and March Inland Port (civil-ian operations allowed by the joint use agreement with the Air Force). It assumed much more willingness on the part of the airlines to invest in new flights at new and emerg-ing airports than in the Constrained Scenario, and a package of market and ground access incentives. It also assumed an abbreviated version of a proposed intra-regional high-speed rail (maglev) system, running from West Los Angeles to Ontario Airport, and extending west to LAX and east to San Bernardino International. The airport demand allocations for the High Growth Scenario are not based on any modeling that incorporated these assumptions, but are based on an assumption that LAX, Bob Hope, Long Beach, John Wayne, Ontario and March will all reach their capacity constraints by 2035. The residual demand of the 164 MAP forecast (26.6 MAP) was allocated to the remaining airports based on their proportional shares in the Baseline Scenario.
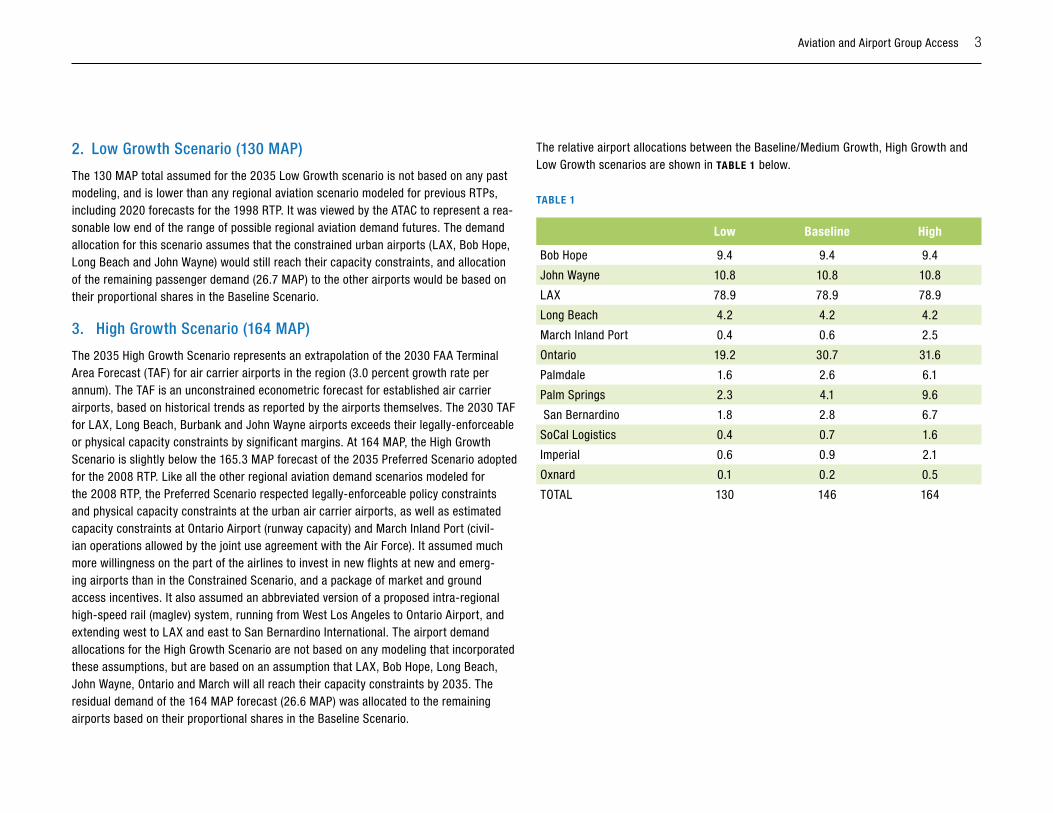
The relative airport allocations between the Baseline/Medium Growth, High Growth and Low Growth scenarios are shown in TABlE 1 below.
TABlE 1
low Baseline High
Bob Hope 9.4 9.4 9.4
John Wayne 10.8 10.8 10.8
LAX 78.9 78.9 78.9
Long Beach 4.2 4.2 4.2
March Inland Port 0.4 0.6 2.5
Ontario 19.2 30.7 31.6
Palmdale 1.6 2.6 6.1
Palm Springs 2.3 4.1 9.6
San Bernardino 1.8 2.8 6.7
SoCal Logistics 0.4 0.7 1.6
Imperial 0.6 0.9 2.1
Oxnard 0.1 0.2 0.5
TOTAL 130 146 164
4 Aviation and Airport Ground Access
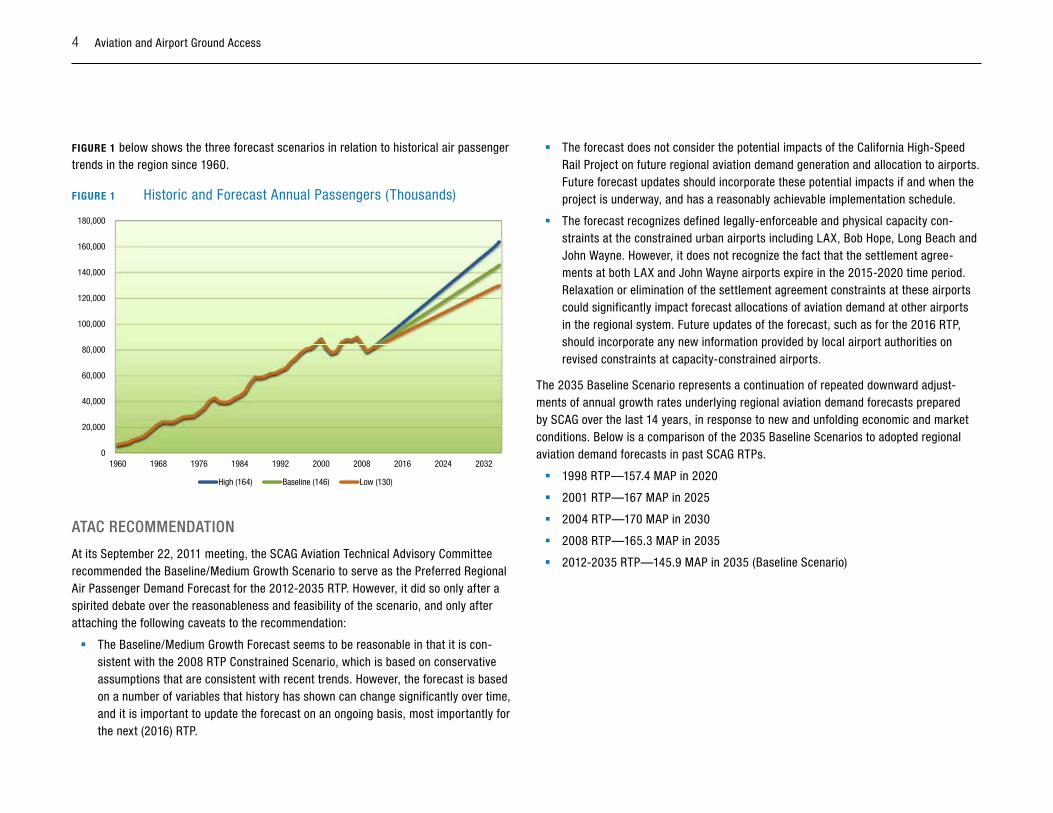
FIGuRE 1 below shows the three forecast scenarios in relation to historical air passenger trends in the region since 1960.
FIGuRE 1 Historic and Forecast Annual Passengers (Thousands)
0
20,000
40,000
60,000
80,000
100,000
120,000
140,000
160,000
180,000
1960 1968 1976 1984 1992 2000 2008 2016 2024 2032
High (164) Baseline (146) Low (130)
ATAC RECoMMEnDATion
At its September 22, 2011 meeting, the SCAG Aviation Technical Advisory Committee recommended the Baseline/Medium Growth Scenario to serve as the Preferred Regional Air Passenger Demand Forecast for the 2012-2035 RTP. However, it did so only after a spirited debate over the reasonableness and feasibility of the scenario, and only after attaching the following caveats to the recommendation:
� The Baseline/Medium Growth Forecast seems to be reasonable in that it is con-sistent with the 2008 RTP Constrained Scenario, which is based on conservative assumptions that are consistent with recent trends. However, the forecast is based on a number of variables that history has shown can change significantly over time, and it is important to update the forecast on an ongoing basis, most importantly for the next (2016) RTP.
� The forecast does not consider the potential impacts of the California High-Speed Rail Project on future regional aviation demand generation and allocation to airports. Future forecast updates should incorporate these potential impacts if and when the project is underway, and has a reasonably achievable implementation schedule.
� The forecast recognizes defined legally-enforceable and physical capacity con-straints at the constrained urban airports including LAX, Bob Hope, Long Beach and John Wayne. However, it does not recognize the fact that the settlement agree-ments at both LAX and John Wayne airports expire in the 2015-2020 time period. Relaxation or elimination of the settlement agreement constraints at these airports could significantly impact forecast allocations of aviation demand at other airports in the regional system. Future updates of the forecast, such as for the 2016 RTP, should incorporate any new information provided by local airport authorities on revised constraints at capacity-constrained airports.
The 2035 Baseline Scenario represents a continuation of repeated downward adjust-ments of annual growth rates underlying regional aviation demand forecasts prepared by SCAG over the last 14 years, in response to new and unfolding economic and market conditions. Below is a comparison of the 2035 Baseline Scenarios to adopted regional aviation demand forecasts in past SCAG RTPs.
� 1998 RTP—157.4 MAP in 2020
� 2001 RTP—167 MAP in 2025
� 2004 RTP—170 MAP in 2030
� 2008 RTP—165.3 MAP in 2035
� 2012-2035 RTP—145.9 MAP in 2035 (Baseline Scenario)
Aviation and Airport Group Access 5
Regional Air Cargo Demand Forecast scenarios for 2012–2035 RTp
BackgroundFor every regional transportation plan since the 2001 RTP, SCAG has forecast regional air cargo demand in addition to regional air passenger demand. Similar to the process used to forecast air passenger demand, three alternative 2035 forecast scenarios for air cargo were considered by the SCAG Aviation Technical Advisory Committee (ATAC) for inclusion in the 2012-2035 RTP: baseline/ medium growth, low growth and high growth scenarios. This report describes these forecast scenarios, including an allocation of 2035 passenger demand to individual commercial airports for each scenario. The information presented below is taken from a report prepared for SCAG by Aviation System Consulting, which developed a regional air cargo forecast methodology and allocation based on analytical work performed for SCAG by TranSystems. At its September 22, 2011 meeting, ATAC rec-ommended that the Baseline Scenario serve as the Preferred Regional Air Cargo Demand Forecast for the 2012-2035 RTP. At 5.605 million tons in 2035, the new 2035 regional air cargo forecast is substantially lower than the adopted 2008 RTP forecast of 8.28 million tons in 2035, mainly because of a substantial downturn of regional air cargo demand over the last decade.
i. REGionAl AiR CARGo ACTiviTy TREnDs
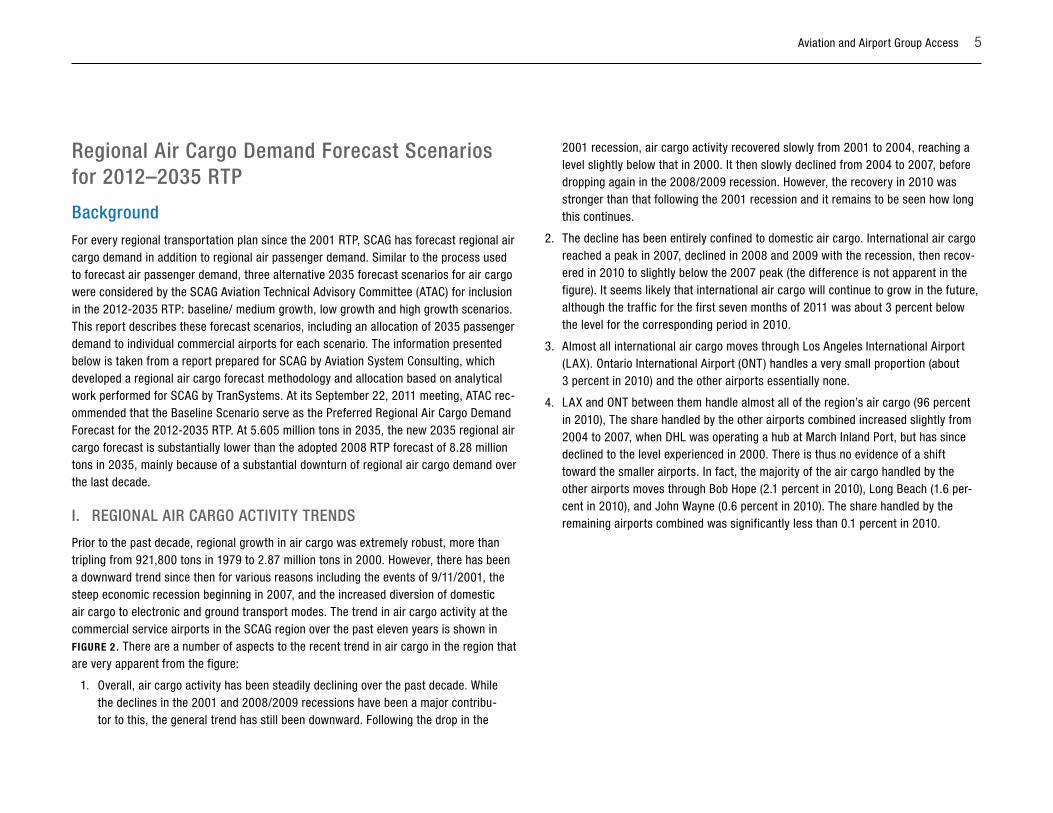
Prior to the past decade, regional growth in air cargo was extremely robust, more than tripling from 921,800 tons in 1979 to 2.87 million tons in 2000. However, there has been a downward trend since then for various reasons including the events of 9/11/2001, the steep economic recession beginning in 2007, and the increased diversion of domestic air cargo to electronic and ground transport modes. The trend in air cargo activity at the commercial service airports in the SCAG region over the past eleven years is shown in FIGuRE 2 . There are a number of aspects to the recent trend in air cargo in the region that are very apparent from the figure:
1. Overall, air cargo activity has been steadily declining over the past decade. While the declines in the 2001 and 2008/2009 recessions have been a major contribu-tor to this, the general trend has still been downward. Following the drop in the
2001 recession, air cargo activity recovered slowly from 2001 to 2004, reaching a level slightly below that in 2000. It then slowly declined from 2004 to 2007, before dropping again in the 2008/2009 recession. However, the recovery in 2010 was stronger than that following the 2001 recession and it remains to be seen how long this continues.
2. The decline has been entirely confined to domestic air cargo. International air cargo reached a peak in 2007, declined in 2008 and 2009 with the recession, then recov-ered in 2010 to slightly below the 2007 peak (the difference is not apparent in the figure). It seems likely that international air cargo will continue to grow in the future, although the traffic for the first seven months of 2011 was about 3 percent below the level for the corresponding period in 2010.
3. Almost all international air cargo moves through Los Angeles International Airport (LAX). Ontario International Airport (ONT) handles a very small proportion (about 3 percent in 2010) and the other airports essentially none.
4. LAX and ONT between them handle almost all of the region’s air cargo (96 percent in 2010), The share handled by the other airports combined increased slightly from 2004 to 2007, when DHL was operating a hub at March Inland Port, but has since declined to the level experienced in 2000. There is thus no evidence of a shift toward the smaller airports. In fact, the majority of the air cargo handled by the other airports moves through Bob Hope (2.1 percent in 2010), Long Beach (1.6 per-cent in 2010), and John Wayne (0.6 percent in 2010). The share handled by the remaining airports combined was significantly less than 0.1 percent in 2010.
6 Aviation and Airport Ground Access
FIGuRE 2 Historical Air Cargo 20002010
2000 2001 2002 2003 2004 2005 2006 2007 2008 2009 2010
500
0
1,000
1,500
2,000
2,500
3,000
3,500
Air
Car
go (0
00 t
ons)
All Other AirportsONT Domestic
ONT InternationalLAX Domestic
LAX International
TREnD in AiR CARGo ACTiviTy AT sCAG REGion AiRpoRTs
The air cargo figures for the smaller secondary airports included in the top band in FIGuRE 1 is likely missing a very small amount of international cargo due to the source of the data used for those airports.
Not shown in the above figure is the extent to which the domestic air cargo at LAX and ONT is handled by the integrated carriers. At LAX, FedEx handled 46 percent of the domestic air cargo in 2010, ABX Air (which provides air service for DHL) handled 7 percent, and UPS handled 4 percent, for a 57 percent market share of the integrated carriers. At ONT, UPS handled 60 percent of the domestic air cargo in 2010 (market share data is only for January through October) and FedEx handled 32 percent, for a 92 percent market share by the integrated carriers.
Of the domestic air cargo at LAX not handled by the integrated carriers, the majority (27 percent of all domestic air cargo in 2010) was handled by five scheduled airlines: American, Continental, Delta, United and US Airways. A relatively small amount of the remainder was handled by other scheduled airlines (Alaska, Southwest, etc.).
FedEx and UPS handled a trivial share of the international air cargo at LAX in 2010 (a few tons), but UPS handled all the international air cargo at ONT, although this was fairly small as shown in FIGuRE 1. It should be noted that the distinction between domestic and international cargo relates to the destination of the flight carrying that cargo, not the final destination of the shipment. For example, if FedEx put an international shipment on a flight from LAX to its hub at Oakland International Airport (say), where it was put on an international flight, that shipment would be counted as domestic cargo at LAX.
Over 82 percent of the international air cargo at LAX is handled by scheduled passenger airlines or their cargo divisions that operate freighter aircraft. Obviously, the cargo carried in the belly of passenger flights is not likely to be diverted to other airports, except to the extent that those airports attract additional international service. As a practical matter, the only airport where this is likely to occur to a significant extent is ONT. The other air-ports may be able to attract some limited international service, particularly to Mexico or Canada, but these flights are unlikely to attract much air cargo. Similarly, the cargo divi-sions of passenger airlines will want to serve the same airport as the passenger flights, since they share the same ground handling facilities.
Based on the air cargo activity over the past decade, the airport allocations of air cargo shown in the Preliminary 2012-2035 RTP forecasts prepared earlier in 2011 would appear to require a highly unlikely change from the current distribution pattern. There might be a small shift of international air cargo to ONT if the growth in passenger traffic there results in the addition of some long-haul international flights or if UPS expands its international service out of its ONT hub.
The bottom line is that unless FedEx or UPS decides to relocate one of their hubs, which appears quite unlikely, the only potential air cargo traffic that might be attracted to the smaller airports is that handled by the all-cargo and charter airlines. This was less than 18 percent of the international air cargo and less than 14 percent of the domestic air cargo at LAX in 2010. Obviously, not all of this is likely to be diverted to other airports.
Aviation and Airport Group Access 7
This indicated a need to prepare revised airport allocation assumptions for the 2035 air cargo forecasts that would provide more plausible levels of air cargo activity at all the smaller commercial service airports in the region.
ii. TRAnsysTEMs 2035 FoRECAsT oF ToTAl REGionAl AiR CARGo
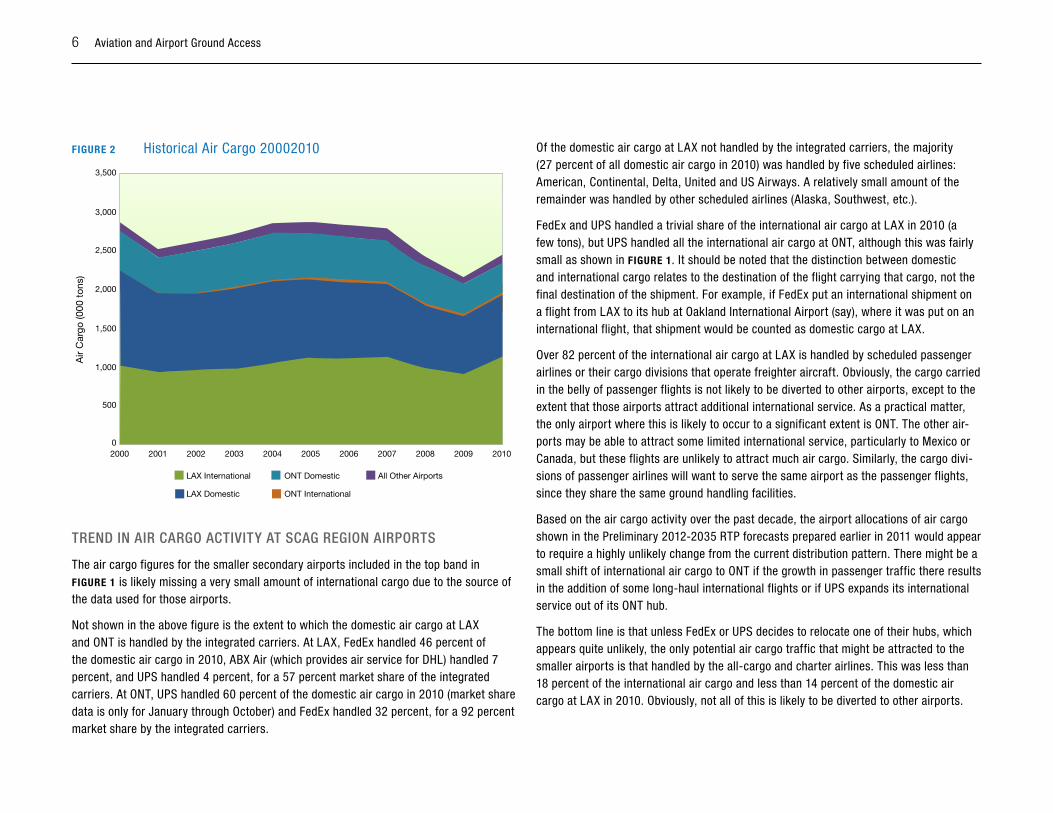
Analysis of the air cargo forecasts performed by TranSystems for the 2012–2035 RTP update suggests that the growth rates implied by the regional air cargo forecasts in the 2008 RTP (which formed the basis of the Preliminary 2012–2035 RTP regional air cargo forecast) are too high in light of recent trends in the industry. The 2035 forecast of regional totals for international and domestic air cargo recommended by TranSystems are shown in TABlE 1.
TABlE 1 Forecast Total Regional Air Cargo – 2035
Forecast Scenario
Low Baseline High
International (000 metric tons) 1,695.40 2,302.90 2,751.20
Domestic (000 metric tons) 2,047.60 2,781.40 3,322.80
3,743.00 5,084.30 6,074.00
International (000 tons) 1,869.10 2,538.90 3,033.20
Domestic (000 tons) 2,257.50 3,066.50 3,663.40
4,126.60 5,605.40 6,696.60
iii. AlloCATion oF REGionAl AiR CARGo To AiRpoRTs
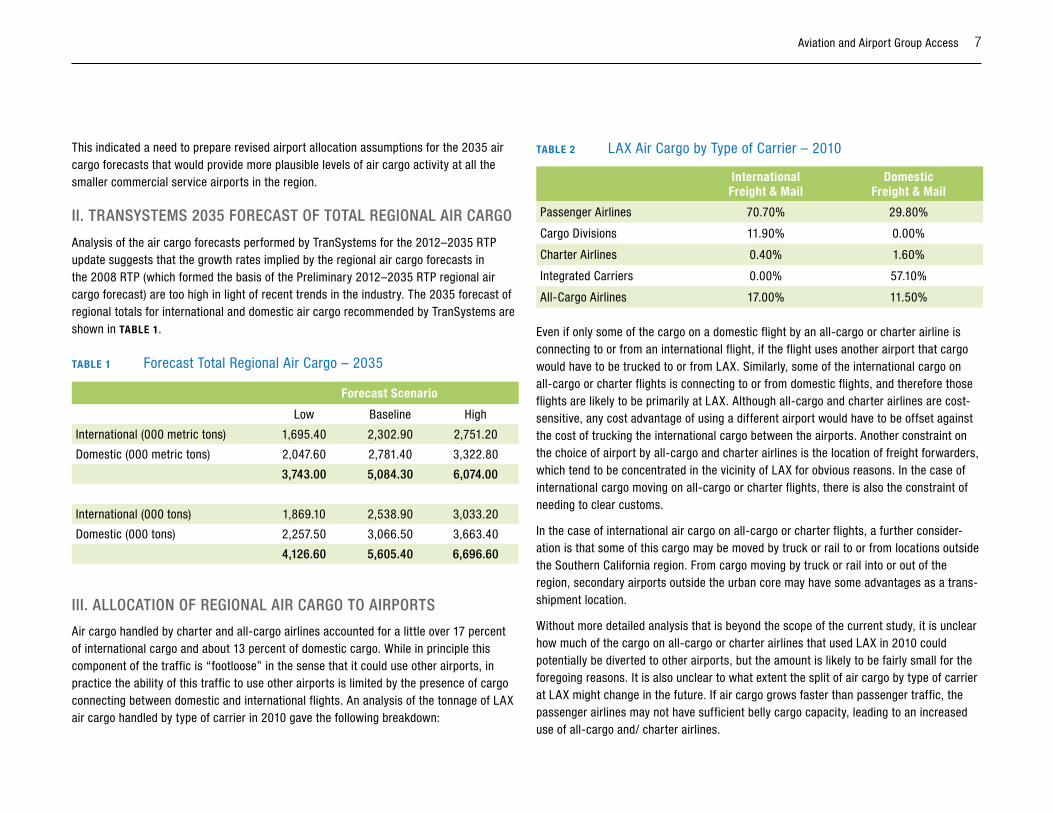
Air cargo handled by charter and all-cargo airlines accounted for a little over 17 percent of international cargo and about 13 percent of domestic cargo. While in principle this component of the traffic is “footloose” in the sense that it could use other airports, in practice the ability of this traffic to use other airports is limited by the presence of cargo connecting between domestic and international flights. An analysis of the tonnage of LAX air cargo handled by type of carrier in 2010 gave the following breakdown:
TABlE 2 LAX Air Cargo by Type of Carrier – 2010
InternationalFreight & Mail
DomesticFreight & Mail
Passenger Airlines 70.70% 29.80%
Cargo Divisions 11.90% 0.00%
Charter Airlines 0.40% 1.60%
Integrated Carriers 0.00% 57.10%
All-Cargo Airlines 17.00% 11.50%
Even if only some of the cargo on a domestic flight by an all-cargo or charter airline is connecting to or from an international flight, if the flight uses another airport that cargo would have to be trucked to or from LAX. Similarly, some of the international cargo on all-cargo or charter flights is connecting to or from domestic flights, and therefore those flights are likely to be primarily at LAX. Although all-cargo and charter airlines are cost-sensitive, any cost advantage of using a different airport would have to be offset against the cost of trucking the international cargo between the airports. Another constraint on the choice of airport by all-cargo and charter airlines is the location of freight forwarders, which tend to be concentrated in the vicinity of LAX for obvious reasons. In the case of international cargo moving on all-cargo or charter flights, there is also the constraint of needing to clear customs.
In the case of international air cargo on all-cargo or charter flights, a further consider-ation is that some of this cargo may be moved by truck or rail to or from locations outside the Southern California region. From cargo moving by truck or rail into or out of the region, secondary airports outside the urban core may have some advantages as a trans-shipment location.
Without more detailed analysis that is beyond the scope of the current study, it is unclear how much of the cargo on all-cargo or charter airlines that used LAX in 2010 could potentially be diverted to other airports, but the amount is likely to be fairly small for the foregoing reasons. It is also unclear to what extent the split of air cargo by type of carrier at LAX might change in the future. If air cargo grows faster than passenger traffic, the passenger airlines may not have sufficient belly cargo capacity, leading to an increased use of all-cargo and/ charter airlines.
8 Aviation and Airport Ground Access
On the other hand, the introduction of larger wide-body aircraft, such as the Airbus A-380, will increase the belly cargo capacity of passenger flights. It is also possible that the integrated carriers will expand their market share of international freight.
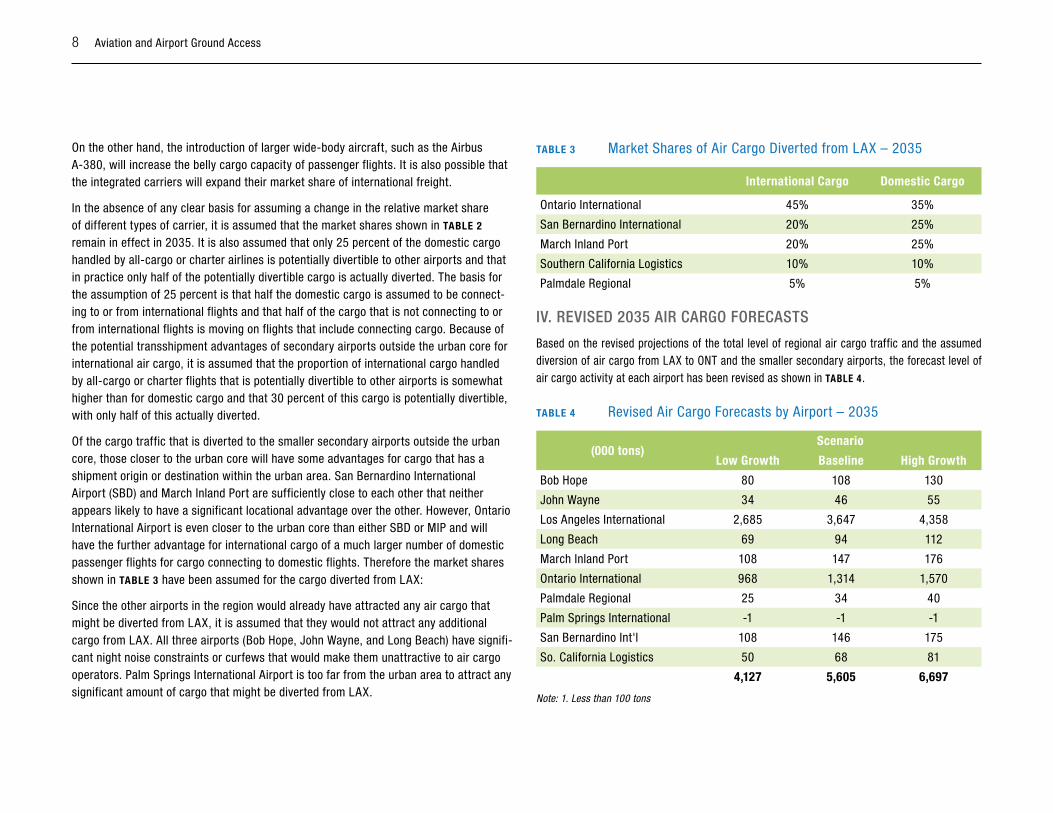
In the absence of any clear basis for assuming a change in the relative market share of different types of carrier, it is assumed that the market shares shown in TABlE 2 remain in effect in 2035. It is also assumed that only 25 percent of the domestic cargo handled by all-cargo or charter airlines is potentially divertible to other airports and that in practice only half of the potentially divertible cargo is actually diverted. The basis for the assumption of 25 percent is that half the domestic cargo is assumed to be connect-ing to or from international flights and that half of the cargo that is not connecting to or from international flights is moving on flights that include connecting cargo. Because of the potential transshipment advantages of secondary airports outside the urban core for international air cargo, it is assumed that the proportion of international cargo handled by all-cargo or charter flights that is potentially divertible to other airports is somewhat higher than for domestic cargo and that 30 percent of this cargo is potentially divertible, with only half of this actually diverted.
Of the cargo traffic that is diverted to the smaller secondary airports outside the urban core, those closer to the urban core will have some advantages for cargo that has a shipment origin or destination within the urban area. San Bernardino International Airport (SBD) and March Inland Port are sufficiently close to each other that neither appears likely to have a significant locational advantage over the other. However, Ontario International Airport is even closer to the urban core than either SBD or MIP and will have the further advantage for international cargo of a much larger number of domestic passenger flights for cargo connecting to domestic flights. Therefore the market shares shown in TABlE 3 have been assumed for the cargo diverted from LAX:
Since the other airports in the region would already have attracted any air cargo that might be diverted from LAX, it is assumed that they would not attract any additional cargo from LAX. All three airports (Bob Hope, John Wayne, and Long Beach) have signifi-cant night noise constraints or curfews that would make them unattractive to air cargo operators. Palm Springs International Airport is too far from the urban area to attract any significant amount of cargo that might be diverted from LAX.
TABlE 3 Market Shares of Air Cargo Diverted from LAX – 2035
International Cargo Domestic Cargo
Ontario International 45% 35%
San Bernardino International 20% 25%
March Inland Port 20% 25%
Southern California Logistics 10% 10%
Palmdale Regional 5% 5%
iv. REvisED 2035 AiR CARGo FoRECAsTs
Based on the revised projections of the total level of regional air cargo traffic and the assumed diversion of air cargo from LAX to ONT and the smaller secondary airports, the forecast level of air cargo activity at each airport has been revised as shown in TABlE 4.
TABlE 4 Revised Air Cargo Forecasts by Airport – 2035
(000 tons)Scenario
low Growth Baseline High Growth
Bob Hope 80 108 130
John Wayne 34 46 55
Los Angeles International 2,685 3,647 4,358
Long Beach 69 94 112
March Inland Port 108 147 176
Ontario International 968 1,314 1,570
Palmdale Regional 25 34 40
Palm Springs International -1 -1 -1
San Bernardino Int'l 108 146 175
So. California Logistics 50 68 81
4,127 5,605 6,697
Note: 1. Less than 100 tons
Aviation and Airport Group Access 9
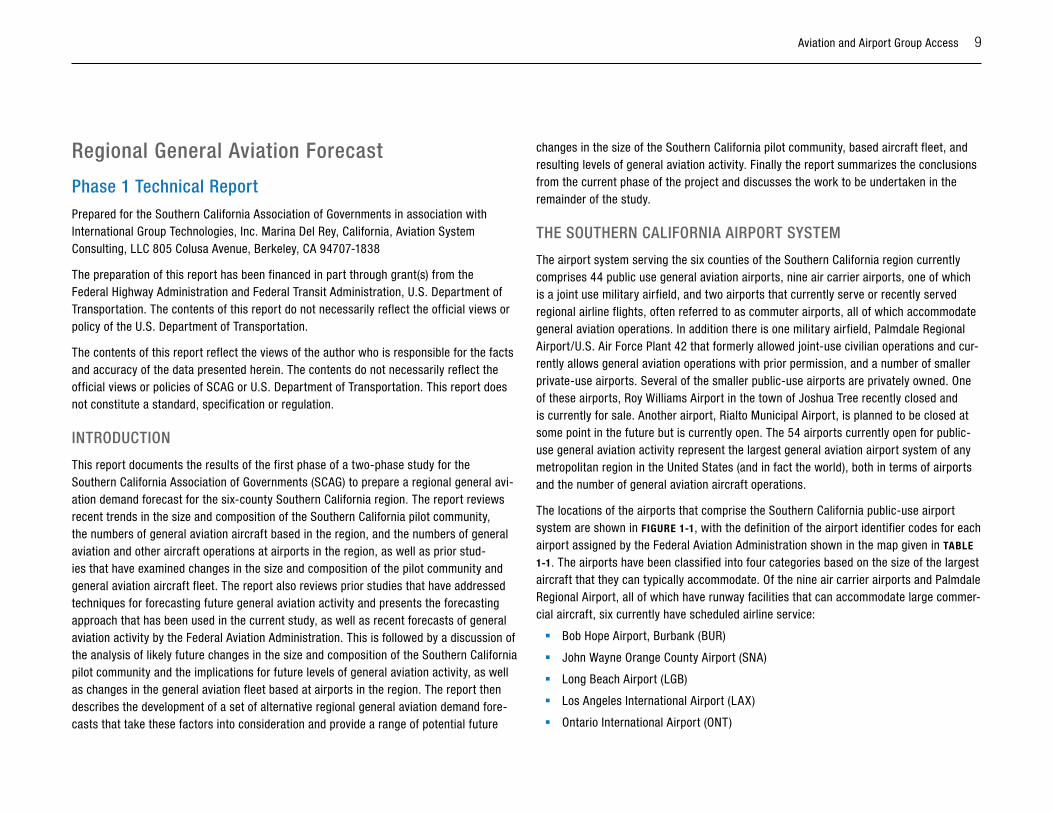
Regional General Aviation Forecast
phase 1 Technical ReportPrepared for the Southern California Association of Governments in association with International Group Technologies, Inc. Marina Del Rey, California, Aviation System Consulting, LLC 805 Colusa Avenue, Berkeley, CA 94707-1838
The preparation of this report has been financed in part through grant(s) from the Federal Highway Administration and Federal Transit Administration, U.S. Department of Transportation. The contents of this report do not necessarily reflect the official views or policy of the U.S. Department of Transportation.
The contents of this report reflect the views of the author who is responsible for the facts and accuracy of the data presented herein. The contents do not necessarily reflect the official views or policies of SCAG or U.S. Department of Transportation. This report does not constitute a standard, specification or regulation.
inTRoDuCTion
This report documents the results of the first phase of a two-phase study for the Southern California Association of Governments (SCAG) to prepare a regional general avi-ation demand forecast for the six-county Southern California region. The report reviews recent trends in the size and composition of the Southern California pilot community, the numbers of general aviation aircraft based in the region, and the numbers of general aviation and other aircraft operations at airports in the region, as well as prior stud-ies that have examined changes in the size and composition of the pilot community and general aviation aircraft fleet. The report also reviews prior studies that have addressed techniques for forecasting future general aviation activity and presents the forecasting approach that has been used in the current study, as well as recent forecasts of general aviation activity by the Federal Aviation Administration. This is followed by a discussion of the analysis of likely future changes in the size and composition of the Southern California pilot community and the implications for future levels of general aviation activity, as well as changes in the general aviation fleet based at airports in the region. The report then describes the development of a set of alternative regional general aviation demand fore-casts that take these factors into consideration and provide a range of potential future
changes in the size of the Southern California pilot community, based aircraft fleet, and resulting levels of general aviation activity. Finally the report summarizes the conclusions from the current phase of the project and discusses the work to be undertaken in the remainder of the study.
ThE souThERn CAliFoRniA AiRpoRT sysTEM
The airport system serving the six counties of the Southern California region currently comprises 44 public use general aviation airports, nine air carrier airports, one of which is a joint use military airfield, and two airports that currently serve or recently served regional airline flights, often referred to as commuter airports, all of which accommodate general aviation operations. In addition there is one military airfield, Palmdale Regional Airport/U.S. Air Force Plant 42 that formerly allowed joint-use civilian operations and cur-rently allows general aviation operations with prior permission, and a number of smaller private-use airports. Several of the smaller public-use airports are privately owned. One of these airports, Roy Williams Airport in the town of Joshua Tree recently closed and is currently for sale. Another airport, Rialto Municipal Airport, is planned to be closed at some point in the future but is currently open. The 54 airports currently open for public-use general aviation activity represent the largest general aviation airport system of any metropolitan region in the United States (and in fact the world), both in terms of airports and the number of general aviation aircraft operations.
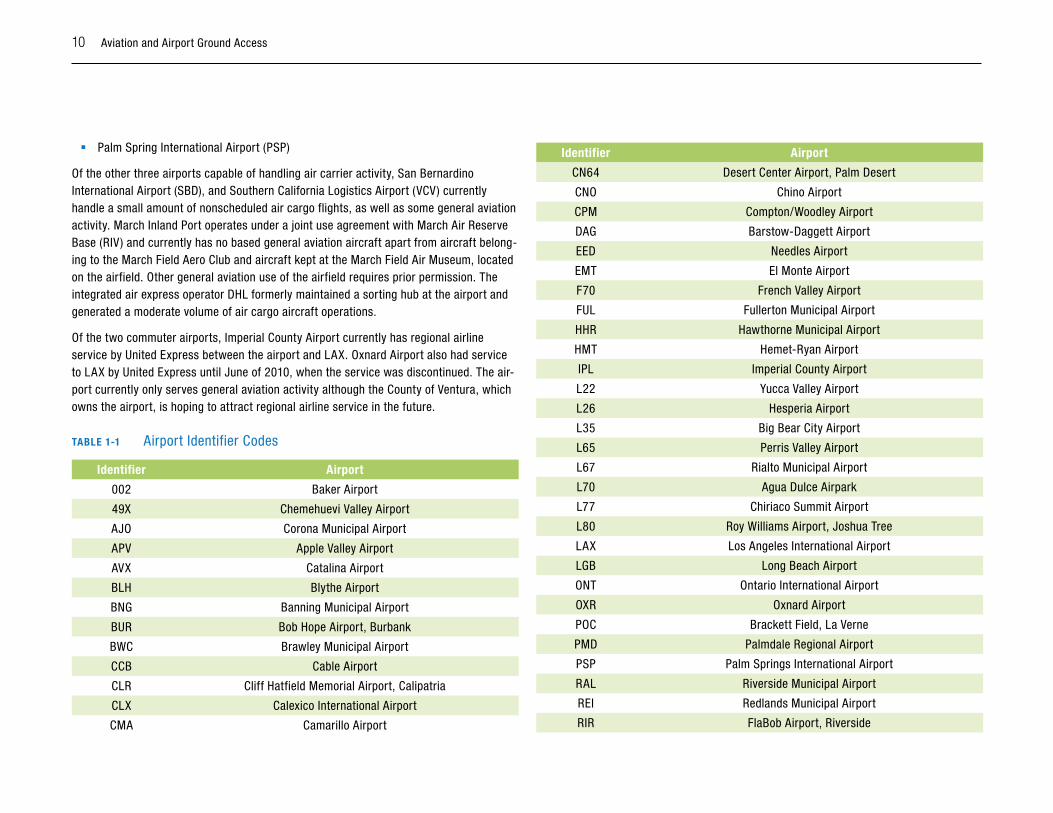
The locations of the airports that comprise the Southern California public-use airport system are shown in FIGuRE 1-1, with the definition of the airport identifier codes for each airport assigned by the Federal Aviation Administration shown in the map given in TABlE
1-1. The airports have been classified into four categories based on the size of the largest aircraft that they can typically accommodate. Of the nine air carrier airports and Palmdale Regional Airport, all of which have runway facilities that can accommodate large commer-cial aircraft, six currently have scheduled airline service:
� Bob Hope Airport, Burbank (BUR)
� John Wayne Orange County Airport (SNA)
� Long Beach Airport (LGB)
� Los Angeles International Airport (LAX)
� Ontario International Airport (ONT)
10 Aviation and Airport Ground Access
� Palm Spring International Airport (PSP)
Of the other three airports capable of handling air carrier activity, San Bernardino International Airport (SBD), and Southern California Logistics Airport (VCV) currently handle a small amount of nonscheduled air cargo flights, as well as some general aviation activity. March Inland Port operates under a joint use agreement with March Air Reserve Base (RIV) and currently has no based general aviation aircraft apart from aircraft belong-ing to the March Field Aero Club and aircraft kept at the March Field Air Museum, located on the airfield. Other general aviation use of the airfield requires prior permission. The integrated air express operator DHL formerly maintained a sorting hub at the airport and generated a moderate volume of air cargo aircraft operations.
Of the two commuter airports, Imperial County Airport currently has regional airline service by United Express between the airport and LAX. Oxnard Airport also had service to LAX by United Express until June of 2010, when the service was discontinued. The air-port currently only serves general aviation activity although the County of Ventura, which owns the airport, is hoping to attract regional airline service in the future.
TABlE 1-1 Airport Identifier Codes
Identifier Airport
002 Baker Airport
49X Chemehuevi Valley Airport
AJO Corona Municipal Airport
APV Apple Valley Airport
AVX Catalina Airport
BLH Blythe Airport
BNG Banning Municipal Airport
BUR Bob Hope Airport, Burbank
BWC Brawley Municipal Airport
CCB Cable Airport
CLR Cliff Hatfield Memorial Airport, Calipatria
CLX Calexico International Airport
CMA Camarillo Airport
Identifier Airport
CN64 Desert Center Airport, Palm Desert
CNO Chino Airport
CPM Compton/Woodley Airport
DAG Barstow-Daggett Airport
EED Needles Airport
EMT El Monte Airport
F70 French Valley Airport
FUL Fullerton Municipal Airport
HHR Hawthorne Municipal Airport
HMT Hemet-Ryan Airport
IPL Imperial County Airport
L22 Yucca Valley Airport
L26 Hesperia Airport
L35 Big Bear City Airport
L65 Perris Valley Airport
L67 Rialto Municipal Airport
L70 Agua Dulce Airpark
L77 Chiriaco Summit Airport
L80 Roy Williams Airport, Joshua Tree
LAX Los Angeles International Airport
LGB Long Beach Airport
ONT Ontario International Airport
OXR Oxnard Airport
POC Brackett Field, La Verne
PMD Palmdale Regional Airport
PSP Palm Springs International Airport
RAL Riverside Municipal Airport
REI Redlands Municipal Airport
RIR FlaBob Airport, Riverside
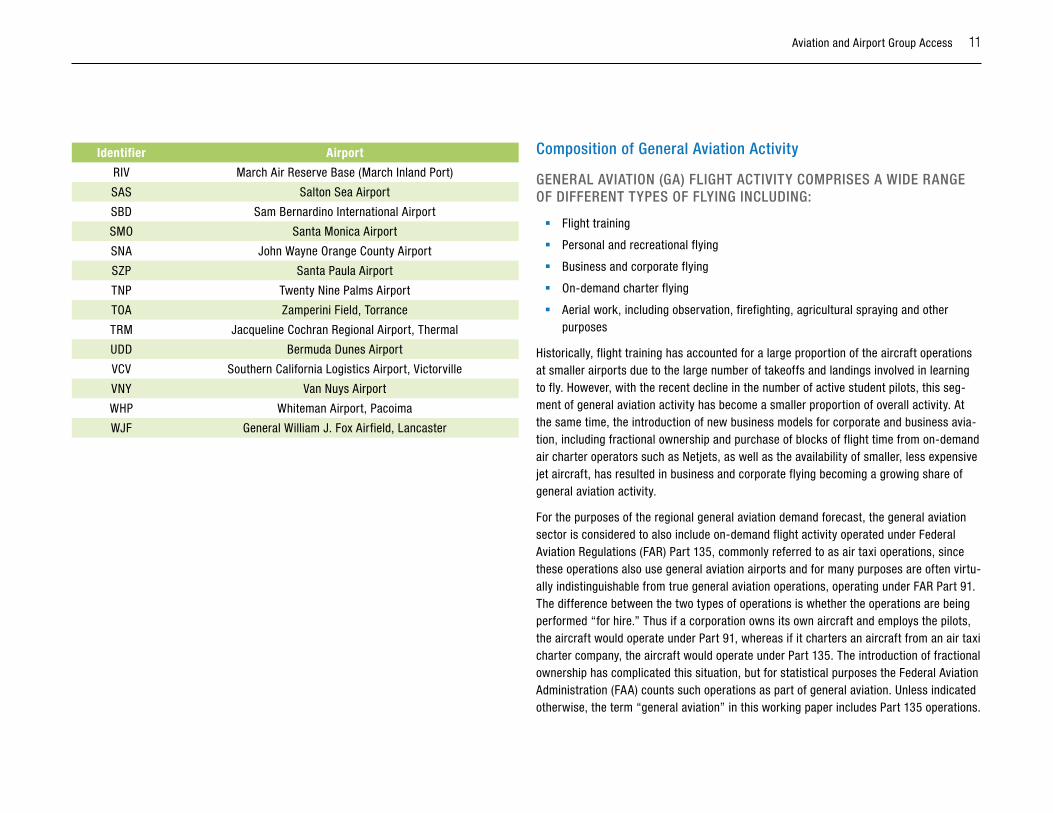
Aviation and Airport Group Access 11
Identifier Airport
RIV March Air Reserve Base (March Inland Port)
SAS Salton Sea Airport
SBD Sam Bernardino International Airport
SMO Santa Monica Airport
SNA John Wayne Orange County Airport
SZP Santa Paula Airport
TNP Twenty Nine Palms Airport
TOA Zamperini Field, Torrance
TRM Jacqueline Cochran Regional Airport, Thermal
UDD Bermuda Dunes Airport
VCV Southern California Logistics Airport, Victorville
VNY Van Nuys Airport
WHP Whiteman Airport, Pacoima
WJF General William J. Fox Airfield, Lancaster
Composition of General Aviation Activity
GEnERAl AviATion (GA) FliGhT ACTiviTy CoMpRisEs A wiDE RAnGE oF DiFFEREnT TypEs oF FlyinG inCluDinG:
� Flight training
� Personal and recreational flying
� Business and corporate flying
� On-demand charter flying
� Aerial work, including observation, firefighting, agricultural spraying and other purposes
Historically, flight training has accounted for a large proportion of the aircraft operations at smaller airports due to the large number of takeoffs and landings involved in learning to fly. However, with the recent decline in the number of active student pilots, this seg-ment of general aviation activity has become a smaller proportion of overall activity. At the same time, the introduction of new business models for corporate and business avia-tion, including fractional ownership and purchase of blocks of flight time from on-demand air charter operators such as Netjets, as well as the availability of smaller, less expensive jet aircraft, has resulted in business and corporate flying becoming a growing share of general aviation activity.
For the purposes of the regional general aviation demand forecast, the general aviation sector is considered to also include on-demand flight activity operated under Federal Aviation Regulations (FAR) Part 135, commonly referred to as air taxi operations, since these operations also use general aviation airports and for many purposes are often virtu-ally indistinguishable from true general aviation operations, operating under FAR Part 91. The difference between the two types of operations is whether the operations are being performed “for hire.” Thus if a corporation owns its own aircraft and employs the pilots, the aircraft would operate under Part 91, whereas if it charters an aircraft from an air taxi charter company, the aircraft would operate under Part 135. The introduction of fractional ownership has complicated this situation, but for statistical purposes the Federal Aviation Administration (FAA) counts such operations as part of general aviation. Unless indicated otherwise, the term “general aviation” in this working paper includes Part 135 operations.
12 Aviation and Airport Ground Access
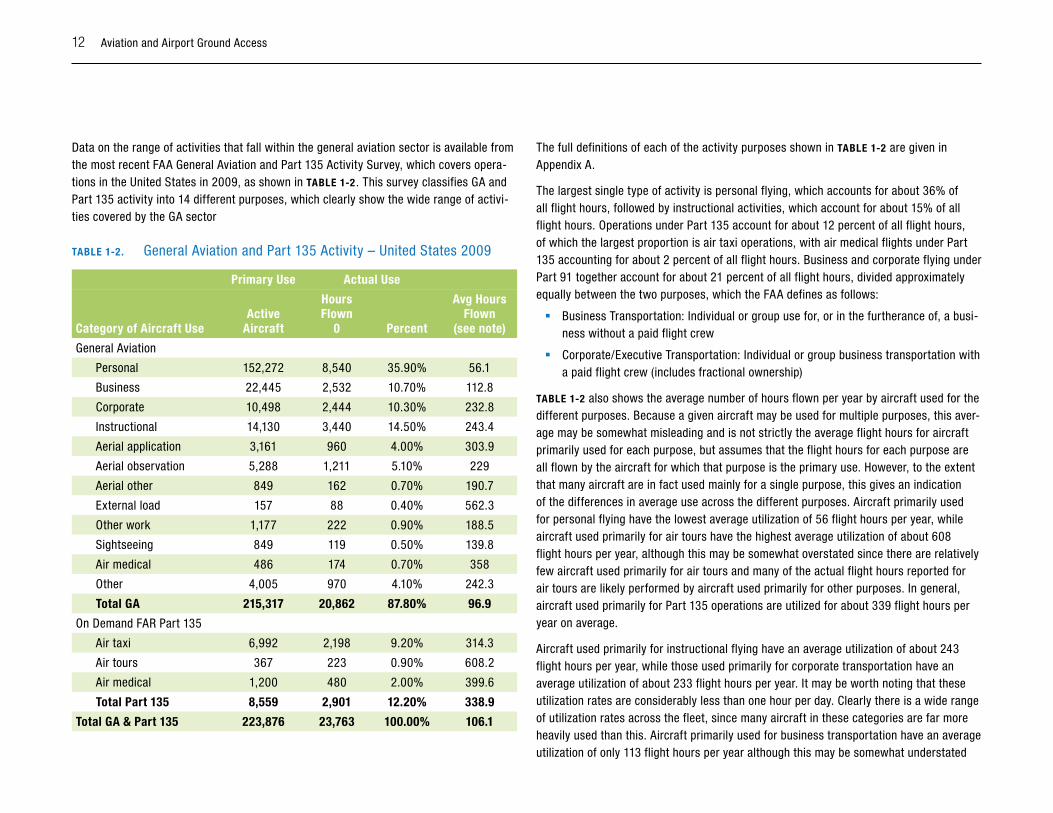
Data on the range of activities that fall within the general aviation sector is available from the most recent FAA General Aviation and Part 135 Activity Survey, which covers opera-tions in the United States in 2009, as shown in TABlE 1-2 . This survey classifies GA and Part 135 activity into 14 different purposes, which clearly show the wide range of activi-ties covered by the GA sector
TABlE 1-2. General Aviation and Part 135 Activity – United States 2009
Primary use Actual use
Category of Aircraft useActive
Aircraft
Hours Flown
0 Percent
Avg Hours Flown
(see note)
General Aviation
Personal 152,272 8,540 35.90% 56.1
Business 22,445 2,532 10.70% 112.8
Corporate 10,498 2,444 10.30% 232.8
Instructional 14,130 3,440 14.50% 243.4
Aerial application 3,161 960 4.00% 303.9
Aerial observation 5,288 1,211 5.10% 229
Aerial other 849 162 0.70% 190.7
External load 157 88 0.40% 562.3
Other work 1,177 222 0.90% 188.5
Sightseeing 849 119 0.50% 139.8
Air medical 486 174 0.70% 358
Other 4,005 970 4.10% 242.3
Total GA 215,317 20,862 87.80% 96.9
On Demand FAR Part 135
Air taxi 6,992 2,198 9.20% 314.3
Air tours 367 223 0.90% 608.2
Air medical 1,200 480 2.00% 399.6
Total Part 135 8,559 2,901 12.20% 338.9
Total GA & Part 135 223,876 23,763 100.00% 106.1
The full definitions of each of the activity purposes shown in TABlE 1-2 are given in Appendix A.
The largest single type of activity is personal flying, which accounts for about 36% of all flight hours, followed by instructional activities, which account for about 15% of all flight hours. Operations under Part 135 account for about 12 percent of all flight hours, of which the largest proportion is air taxi operations, with air medical flights under Part 135 accounting for about 2 percent of all flight hours. Business and corporate flying under Part 91 together account for about 21 percent of all flight hours, divided approximately equally between the two purposes, which the FAA defines as follows:
� Business Transportation: Individual or group use for, or in the furtherance of, a busi-ness without a paid flight crew
� Corporate/Executive Transportation: Individual or group business transportation with a paid flight crew (includes fractional ownership)
TABlE 1-2 also shows the average number of hours flown per year by aircraft used for the different purposes. Because a given aircraft may be used for multiple purposes, this aver-age may be somewhat misleading and is not strictly the average flight hours for aircraft primarily used for each purpose, but assumes that the flight hours for each purpose are all flown by the aircraft for which that purpose is the primary use. However, to the extent that many aircraft are in fact used mainly for a single purpose, this gives an indication of the differences in average use across the different purposes. Aircraft primarily used for personal flying have the lowest average utilization of 56 flight hours per year, while aircraft used primarily for air tours have the highest average utilization of about 608 flight hours per year, although this may be somewhat overstated since there are relatively few aircraft used primarily for air tours and many of the actual flight hours reported for air tours are likely performed by aircraft used primarily for other purposes. In general, aircraft used primarily for Part 135 operations are utilized for about 339 flight hours per year on average.
Aircraft used primarily for instructional flying have an average utilization of about 243 flight hours per year, while those used primarily for corporate transportation have an average utilization of about 233 flight hours per year. It may be worth noting that these utilization rates are considerably less than one hour per day. Clearly there is a wide range of utilization rates across the fleet, since many aircraft in these categories are far more heavily used than this. Aircraft primarily used for business transportation have an average utilization of only 113 flight hours per year although this may be somewhat understated
Aviation and Airport Group Access 13
since this category involves flying without a paid crew. In most cases this means flight operations by the owner of the aircraft, who most likely also uses the aircraft for personal flying. Thus the average utilization of aircraft used primarily for personal flying is probably overstated, since some of the actual flight hours for personal flying are performed in aircraft used primarily for business flying. Of course, the reverse is also true, with some business flying being performed in aircraft used primarily for personal flying. Whether these effects cancel each other out is unclear.
In any case, an average utilization of only 56 flight hours per year represents about one flight hour per week. As with business flying, there is clearly a wide range of utilization rates across the fleet, with some aircraft being used very infrequently.
While these are national average utilization rates, it is likely that the pattern of aircraft utilization in the Southern California region is not significantly different. As part of the current study an effort will be undertaken to obtain more specific data from the FAA cov-ering aircraft in the Southern California region to see how their utilization may differ from that for the United States in total.
RECEnT TREnDs in ThE souThERn CAliFoRniA piloT CoMMuniTy
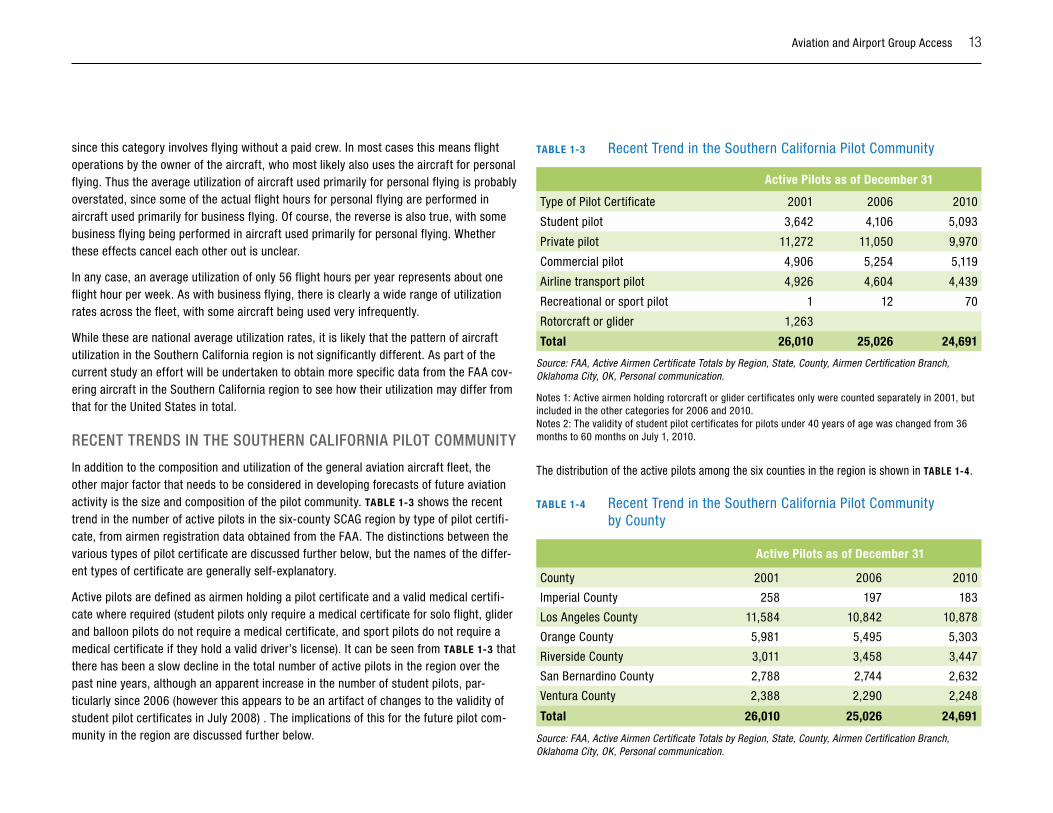
In addition to the composition and utilization of the general aviation aircraft fleet, the other major factor that needs to be considered in developing forecasts of future aviation activity is the size and composition of the pilot community. TABlE 1-3 shows the recent trend in the number of active pilots in the six-county SCAG region by type of pilot certifi-cate, from airmen registration data obtained from the FAA. The distinctions between the various types of pilot certificate are discussed further below, but the names of the differ-ent types of certificate are generally self-explanatory.
Active pilots are defined as airmen holding a pilot certificate and a valid medical certifi-cate where required (student pilots only require a medical certificate for solo flight, glider and balloon pilots do not require a medical certificate, and sport pilots do not require a medical certificate if they hold a valid driver’s license). It can be seen from TABlE 1-3 that there has been a slow decline in the total number of active pilots in the region over the past nine years, although an apparent increase in the number of student pilots, par-ticularly since 2006 (however this appears to be an artifact of changes to the validity of student pilot certificates in July 2008) . The implications of this for the future pilot com-munity in the region are discussed further below.
TABlE 1-3 Recent Trend in the Southern California Pilot Community
Active Pilots as of December 31
Type of Pilot Certificate 2001 2006 2010
Student pilot 3,642 4,106 5,093
Private pilot 11,272 11,050 9,970
Commercial pilot 4,906 5,254 5,119
Airline transport pilot 4,926 4,604 4,439
Recreational or sport pilot 1 12 70
Rotorcraft or glider 1,263
Total 26,010 25,026 24,691
Source: FAA, Active Airmen Certificate Totals by Region, State, County, Airmen Certification Branch, Oklahoma City, OK, Personal communication.
Notes 1: Active airmen holding rotorcraft or glider certificates only were counted separately in 2001, but included in the other categories for 2006 and 2010. Notes 2: The validity of student pilot certificates for pilots under 40 years of age was changed from 36 months to 60 months on July 1, 2010.
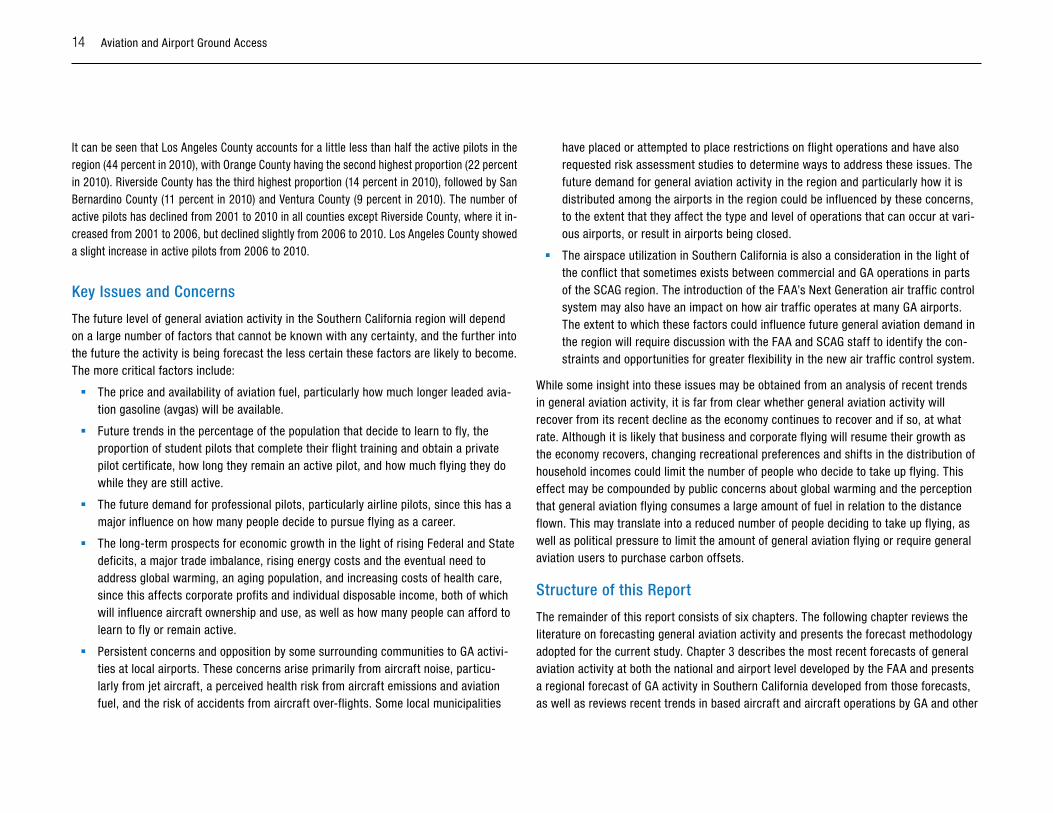
The distribution of the active pilots among the six counties in the region is shown in TABlE 1-4.
TABlE 1-4 Recent Trend in the Southern California Pilot Community by County
Active Pilots as of December 31
County 2001 2006 2010
Imperial County 258 197 183
Los Angeles County 11,584 10,842 10,878
Orange County 5,981 5,495 5,303
Riverside County 3,011 3,458 3,447
San Bernardino County 2,788 2,744 2,632
Ventura County 2,388 2,290 2,248
Total 26,010 25,026 24,691
Source: FAA, Active Airmen Certificate Totals by Region, State, County, Airmen Certification Branch, Oklahoma City, OK, Personal communication.
14 Aviation and Airport Ground Access
It can be seen that Los Angeles County accounts for a little less than half the active pilots in the region (44 percent in 2010), with Orange County having the second highest proportion (22 percent in 2010). Riverside County has the third highest proportion (14 percent in 2010), followed by San Bernardino County (11 percent in 2010) and Ventura County (9 percent in 2010). The number of active pilots has declined from 2001 to 2010 in all counties except Riverside County, where it in-creased from 2001 to 2006, but declined slightly from 2006 to 2010. Los Angeles County showed a slight increase in active pilots from 2006 to 2010.
Key issues and Concerns
The future level of general aviation activity in the Southern California region will depend on a large number of factors that cannot be known with any certainty, and the further into the future the activity is being forecast the less certain these factors are likely to become. The more critical factors include:
� The price and availability of aviation fuel, particularly how much longer leaded avia-tion gasoline (avgas) will be available.
� Future trends in the percentage of the population that decide to learn to fly, the proportion of student pilots that complete their flight training and obtain a private pilot certificate, how long they remain an active pilot, and how much flying they do while they are still active.
� The future demand for professional pilots, particularly airline pilots, since this has a major influence on how many people decide to pursue flying as a career.
� The long-term prospects for economic growth in the light of rising Federal and State deficits, a major trade imbalance, rising energy costs and the eventual need to address global warming, an aging population, and increasing costs of health care, since this affects corporate profits and individual disposable income, both of which will influence aircraft ownership and use, as well as how many people can afford to learn to fly or remain active.
� Persistent concerns and opposition by some surrounding communities to GA activi-ties at local airports. These concerns arise primarily from aircraft noise, particu-larly from jet aircraft, a perceived health risk from aircraft emissions and aviation fuel, and the risk of accidents from aircraft over-flights. Some local municipalities
have placed or attempted to place restrictions on flight operations and have also requested risk assessment studies to determine ways to address these issues. The future demand for general aviation activity in the region and particularly how it is distributed among the airports in the region could be influenced by these concerns, to the extent that they affect the type and level of operations that can occur at vari-ous airports, or result in airports being closed.
� The airspace utilization in Southern California is also a consideration in the light of the conflict that sometimes exists between commercial and GA operations in parts of the SCAG region. The introduction of the FAA’s Next Generation air traffic control system may also have an impact on how air traffic operates at many GA airports. The extent to which these factors could influence future general aviation demand in the region will require discussion with the FAA and SCAG staff to identify the con-straints and opportunities for greater flexibility in the new air traffic control system.
While some insight into these issues may be obtained from an analysis of recent trends in general aviation activity, it is far from clear whether general aviation activity will recover from its recent decline as the economy continues to recover and if so, at what rate. Although it is likely that business and corporate flying will resume their growth as the economy recovers, changing recreational preferences and shifts in the distribution of household incomes could limit the number of people who decide to take up flying. This effect may be compounded by public concerns about global warming and the perception that general aviation flying consumes a large amount of fuel in relation to the distance flown. This may translate into a reduced number of people deciding to take up flying, as well as political pressure to limit the amount of general aviation flying or require general aviation users to purchase carbon offsets.
structure of this Report
The remainder of this report consists of six chapters. The following chapter reviews the literature on forecasting general aviation activity and presents the forecast methodology adopted for the current study. Chapter 3 describes the most recent forecasts of general aviation activity at both the national and airport level developed by the FAA and presents a regional forecast of GA activity in Southern California developed from those forecasts, as well as reviews recent trends in based aircraft and aircraft operations by GA and other
Aviation and Airport Group Access 15
components of flight activity in the Southern California region. The following chapter reviews previous studies of the composition of the U.S. pilot community, presents findings from a survey of California pilots and aircraft owners that was conducted as part of the current study, and describes the pilot cohort analysis that forms the core of the planned forecast approach. Chapter 5 then discusses the development of the alternative forecasts of active pilots for the Southern California region using the planned approach and associ-ated levels of general aviation activity. The following chapter describes the corresponding forecasts of based aircraft developed in this phase of the study and resulting implications for future levels of aircraft operations. Finally, Chapter 7 presents the conclusions from the findings of current phase of the project and discusses the work to be undertaken in the remainder of the study.
Forecast MethodologyThis planned forecast methodology to be used in preparing the Regional General Aviation Demand Forecast for the Southern California region is based on the recognition that the general aviation sector comprises a range of different activities that are each influenced by different factors. Therefore, the development of the forecasts will be based on a detailed understanding and analysis of the way in which these factors determine the growth (or decline) of each type of activity, as well as the interrelationships between them.
literature Review on Forecasting General Aviation ActivityIn spite of the large number of general aviation airports in the United States and the recurring need to prepare forecasts of future general aviation activity as part of studies to update airport master plans, prepare statewide and regional airport system plans, and for other purposes, development of improved techniques for forecasting general aviation activity have received surprisingly little attention in the airport planning literature. None the less, a review of relevant recent literature was undertaken to identify prior studies addressing changes in the composition and activity levels of the pilot community and dynamics of the general aviation fleet, as well as forecasting approaches for general avia-tion activity more generally.
One of the earliest reviews of forecasting methodology for general aviation was under-taken by Gosling & Cao (1994) as part of a larger study of aviation forecasting techniques
performed for the California Department of Transportation. A more recent report prepared for the FAA Office of Aviation Policy and Plans (GRA, 2001a) presented a summary of different methods for forecasting aviation activity by airport, including general aviation activity. However, the descriptions of the techniques are very general and some of the techniques are fairly simplistic (although widely used). The report mentions cohort analy-sis, although the term is used in a different sense from that used in the planned forecast approach described in this working paper, and a better term would have been market segmentation analysis. The following year a Transportation Research E-Circular (TRB, 2002) presented a survey of aviation demand forecasting methodologies, including those for general aviation. This included a description of a model for estimating general aviation operations at non-towered airports, discussed further below, and forecasting techniques for business jet and rotorcraft deliveries and fleet size. Although these techniques involve assessments of the demand for business jet or rotorcraft flying, the approaches to these assessments are only described in very broad terms due to the proprietary nature of the analysis. The description of one approach mentioned that a given year’s production of business jets is generally fully retired from the aircraft fleet in about 40 years, with about 50 percent of the year’s production retired from the fleet in about 33 years.
A subsequent synthesis report prepared for the Airport Cooperative Research Program (Spitz & Golaszewski, 2007) updated the information in the earlier report for the FAA Office of Aviation Policy and Plans, although the description of airport activity forecast-ing methods is no more detailed and does not explicitly address general aviation activity apart from a reference to the earlier study that developed a model for estimating general aviation operations at non-towered airports.
General industry Trends
The FAA and various industry organizations supporting general aviation produce annual statistical reports that examine changes in the general aviation sector over time. The FAA produces an annual summary of U.S. civil airmen statistics and an annual activity survey of general aviation and Part 135 (on-demand commercial operations) aircraft, as well as forecasts of future levels of pilot population and general aviation activity, which include time series data for past years. These FAA data are discussed in more detail in the sec-tion on Data Requirements and Sources below.
16 Aviation and Airport Ground Access
Summaries of industry trends are published by the Aircraft Owners and Pilots Association (AOPA, 2011), the General Aviation Manufacturers Association (GAMA, 2011), and the National Business Aviation Association (NBAA, 2011). While much of the data presented in these statistical reports is derived from FAA sources, it is typically presented in a more user-friendly format and combines the information from multiple sources into a single document. The GAMA General Aviation Statistical Databook & Industry Outlook provides data on general aviation shipments that is not available from other sources, while the NBAA Business Aviation Fact Book presents information on uses of business aircraft that is derived from surveys performed by the NBAA.
pilot population and Aircraft Fleet Composition
A number of studies have examined changes in the characteristics of the pilot population over time, although these have most commonly addressed the influence of pilot charac-teristics on accident risk (e.g. Li, Baker, et al., 2003; Rebok, Qiang, et al., 2009). A study in the early 1970s (Booze, 1972) examined pilot attrition by age and a more recent study (Rogers, Véronneau, et al., 2009) examined changes in the pilot population over time from 1983 to 2005 in order to examine the effect of changes in the regulations that raised the age limit for pilots to perform the duties of pilot or co-pilot of a commercial passenger or cargo aircraft with ten or more passenger seats or 7,500 payload-pounds of cargo capac-ity from age 60 to 65. The latter study showed that the average age of pilots has been steadily increasing, and with it the average number of flight hours experience.
A study in the mid-1970s (Rocks, 1976) examined the pattern of attrition of the general aviation aircraft fleet, but this issue does not appear to have been subject to more recent study, apart from analysis undertaken for the 1994 San Francisco Bay Area Regional Airport System Plan (MTC, 1994), discussed further below.
General Aviation Forecasting studies
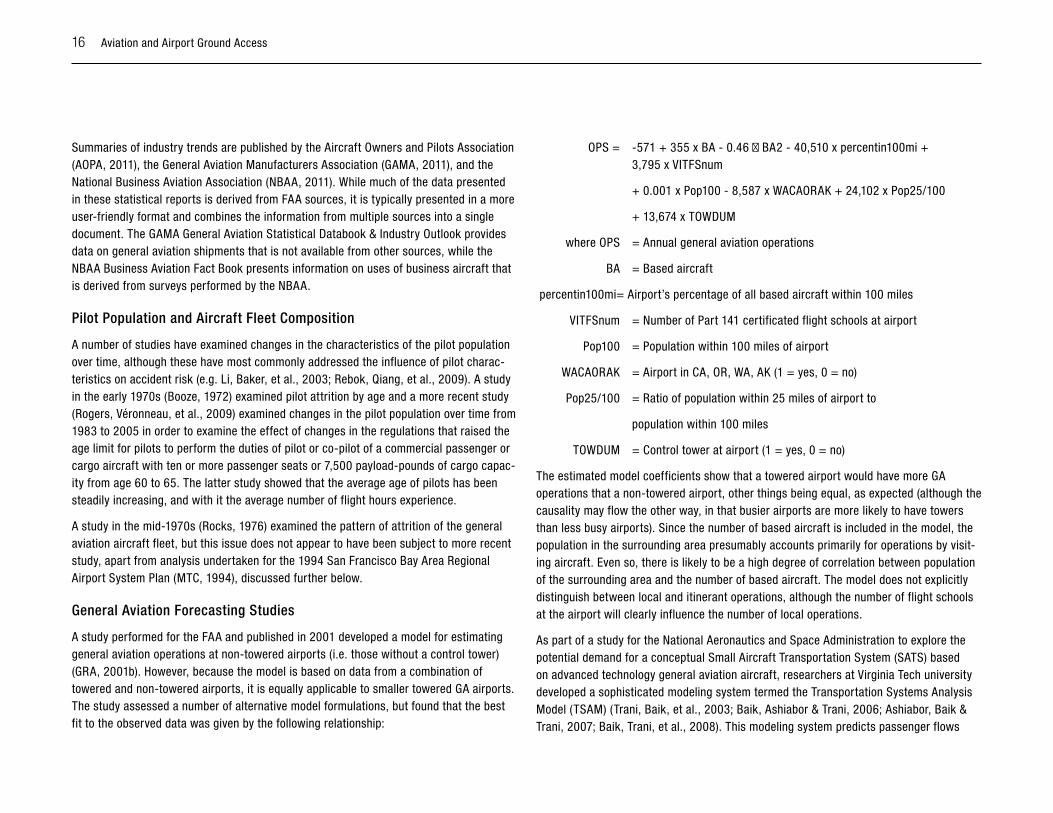
A study performed for the FAA and published in 2001 developed a model for estimating general aviation operations at non-towered airports (i.e. those without a control tower) (GRA, 2001b). However, because the model is based on data from a combination of towered and non-towered airports, it is equally applicable to smaller towered GA airports. The study assessed a number of alternative model formulations, but found that the best fit to the observed data was given by the following relationship:
OPS = -571 + 355 x BA - 0.46 BA2 - 40,510 x percentin100mi + 3,795 x VITFSnum
+ 0.001 x Pop100 - 8,587 x WACAORAK + 24,102 x Pop25/100
+ 13,674 x TOWDUM
where OPS = Annual general aviation operations
BA = Based aircraft
percentin100mi = Airport’s percentage of all based aircraft within 100 miles
VITFSnum = Number of Part 141 certificated flight schools at airport
Pop100 = Population within 100 miles of airport
WACAORAK = Airport in CA, OR, WA, AK (1 = yes, 0 = no)
Pop25/100 = Ratio of population within 25 miles of airport to
population within 100 miles
TOWDUM = Control tower at airport (1 = yes, 0 = no)
The estimated model coefficients show that a towered airport would have more GA operations that a non-towered airport, other things being equal, as expected (although the causality may flow the other way, in that busier airports are more likely to have towers than less busy airports). Since the number of based aircraft is included in the model, the population in the surrounding area presumably accounts primarily for operations by visit-ing aircraft. Even so, there is likely to be a high degree of correlation between population of the surrounding area and the number of based aircraft. The model does not explicitly distinguish between local and itinerant operations, although the number of flight schools at the airport will clearly influence the number of local operations.
As part of a study for the National Aeronautics and Space Administration to explore the potential demand for a conceptual Small Aircraft Transportation System (SATS) based on advanced technology general aviation aircraft, researchers at Virginia Tech university developed a sophisticated modeling system termed the Transportation Systems Analysis Model (TSAM) (Trani, Baik, et al., 2003; Baik, Ashiabor & Trani, 2006; Ashiabor, Baik & Trani, 2007; Baik, Trani, et al., 2008). This modeling system predicts passenger flows
Aviation and Airport Group Access 17
between counties in the U.S. and then performs a mode choice analysis that assigns the passenger flows to commercial airlines, air taxi, or automobile travel. Because the model-ing system does not distinguish between true air taxi and general aviation more broadly, the model can be considered as predicting passenger flows by general aviation. Indeed the authors refer to this mode as general aviation in some of their papers. The modeling system includes an airport choice model that assigns the GA passenger trips to airports and estimates the resulting number of aircraft operations, divided into single-engine propeller, multi-engine propeller and turbojet aircraft.
About the same time, Rohacs (2006) was formulating a modeling framework to analyze the potential for advanced small aircraft flights in Europe. However, the model appears designed to predict system level values, rather than airport- or region-specific activity, and details of the implementation of the model are rather vague.
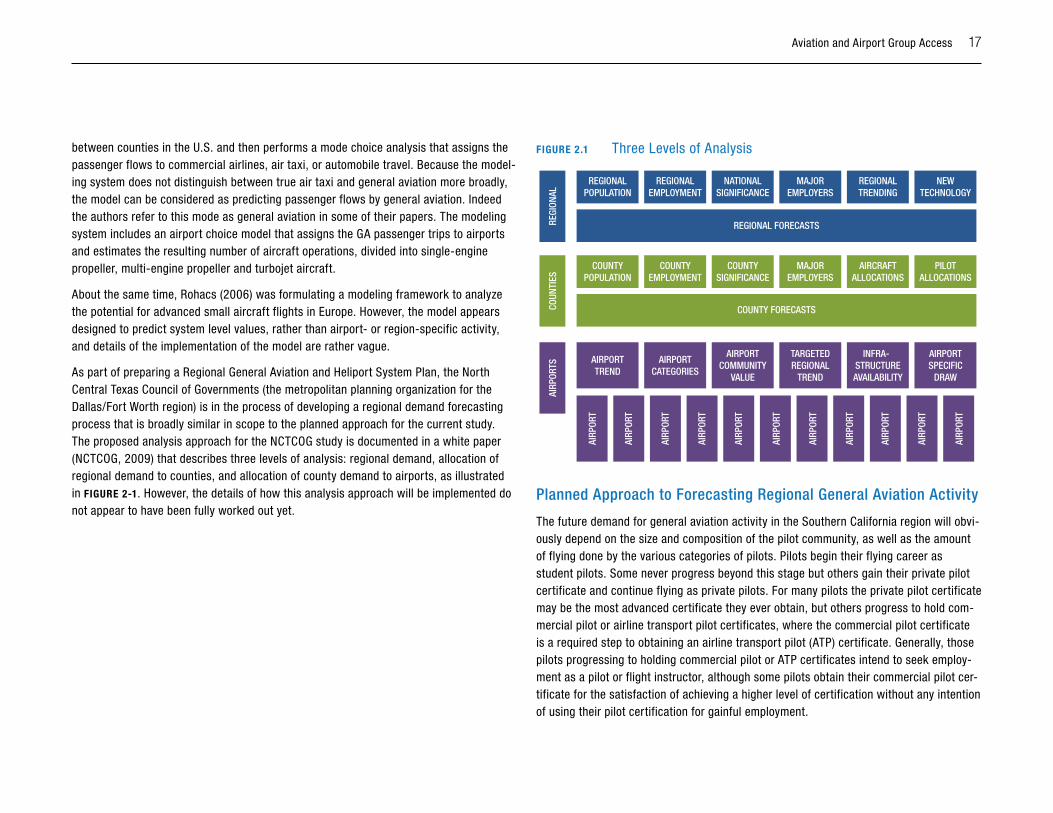
As part of preparing a Regional General Aviation and Heliport System Plan, the North Central Texas Council of Governments (the metropolitan planning organization for the Dallas/Fort Worth region) is in the process of developing a regional demand forecasting process that is broadly similar in scope to the planned approach for the current study. The proposed analysis approach for the NCTCOG study is documented in a white paper (NCTCOG, 2009) that describes three levels of analysis: regional demand, allocation of regional demand to counties, and allocation of county demand to airports, as illustrated in FIGuRE 2-1. However, the details of how this analysis approach will be implemented do not appear to have been fully worked out yet.
FIGuRE 2.1 Three Levels of Analysis
REGI
ONAL
REGIONAL FORECASTS
REGIONAL POPULATION
REGIONAL EMPLOYMENT
NATIONAL SIGNIFICANCE
MAJOR EMPLOYERS
REGIONAL TRENDING
NEW TECHNOLOGY
COUNTY POPULATION
COUNTYEMPLOYMENT
COUNTY SIGNIFICANCE
MAJOR EMPLOYERS
AIRCRAFT ALLOCATIONS
PILOTALLOCATIONS
AIRPORTTREND
AIRPORT CATEGORIES
AIRPORT COMMUNITY
VALUE
TARGETED REGIONAL
TREND
INFRA-STRUCTUREAVAILABILITY
AIRPORT SPECIFIC
DRAW
COUNTY FORECASTSCOUN
TIES
AIRP
ORTS
AIRP
ORT
AIRP
ORT
AIRP
ORT
AIRP
ORT
AIRP
ORT
AIRP
ORT
AIRP
ORT
AIRP
ORT
AIRP
ORT
AIRP
ORT
AIRP
ORT
planned Approach to Forecasting Regional General Aviation Activity
The future demand for general aviation activity in the Southern California region will obvi-ously depend on the size and composition of the pilot community, as well as the amount of flying done by the various categories of pilots. Pilots begin their flying career as student pilots. Some never progress beyond this stage but others gain their private pilot certificate and continue flying as private pilots. For many pilots the private pilot certificate may be the most advanced certificate they ever obtain, but others progress to hold com-mercial pilot or airline transport pilot certificates, where the commercial pilot certificate is a required step to obtaining an airline transport pilot (ATP) certificate. Generally, those pilots progressing to holding commercial pilot or ATP certificates intend to seek employ-ment as a pilot or flight instructor, although some pilots obtain their commercial pilot cer-tificate for the satisfaction of achieving a higher level of certification without any intention of using their pilot certification for gainful employment.
18 Aviation and Airport Ground Access
FuTuRE CoMposiTion oF ThE piloT CoMMuniTy AnD lEvEl oF FlyinG ACTiviTy
Of course, as pilots gain flying experience and progress through the various levels of certification, they are also getting older. Therefore one can study the composition of the pilot community using techniques from demographic cohort analysis. Pilots take up flying at some point in their lives, progress through various certificates, and eventually cease flying. From data on the distribution of the age of pilots when they first take up flying and the time it takes them to reach the highest level of certification they achieve, projections of the future composition of the pilot community can be made based on assumptions about future levels of new pilot starts as a percentage of the population in the relevant age ranges.
Future levels of general aviation activity will depend not only on the number of pilots with each type of certificate but the amount of flying that these pilots do. This varies by the type of certificate held and the age of the pilot. It is also likely that the average number of hours flown per year by pilots with a given type of certificate and a given age will also change over time in response to general economic factors and the cost of flying, as well as such factors as restrictions on the use of airspace or changes in pilot certification requirements. In the case of business aviation and corporate flying, as distinct from flight training and personal flying, the level of flight activity is less a function of the number of pilots than the demand for this type of flying, which is largely determined by the state of the economy and the cost of owning and operating aircraft, which in turn is affected by such factors as the cost of aviation fuel, interest rates, and corporate tax rules. Indeed, the demand for professional pilots, and hence the amount of flying by those pilots, is determined by the level of business and corporate flying, rather than the other way round.
It should be clear from this discussion that the future size of the pilot community in the Southern California region and the amount of flying done by those pilots depends on many factors that cannot be known with any certainty. Developing a general aviation demand forecast based on a single set of highly conjectural assumptions is of limited value for aviation planning purposes and is almost certain to be wrong. What is much more useful is an assessment of the range within which future values of general aviation activity might lie and the likelihood that the values might exceed various levels. In short, rather than a single point forecast, what is needed is an assessment of the projected probability distribution of the forecast values. The development of such probability distributions is
commonly referred to as risk analysis, and commercial computer simulation software exists to perform the necessary calculations to estimate the probability distributions (strictly these are likelihood distributions rather than probability distributions, but the distinction is not important for this study and therefore the more commonly understood term will be used). Although initially the regional general aviation demand forecast for 2035 will be developed using a simpler approach based on defining a range of input assumptions reflecting low, baseline and high demand growth assumptions, the analysis approach will be designed so that future work could extend this to the use of a more formal risk analysis approach.
FuTuRE BAsED AiRCRAFT FlEET
The second major consideration in developing a regional general aviation demand fore-cast is projecting the future number of aircraft based at airports in the region. While the number of aircraft is obviously influenced by the level of flying activity, this is not a simple relationship. Aircraft do not disappear when the level of flying reduces nor do new aircraft suddenly appear when the level of flying increases. Rather, the aircraft fleet evolves in an analogous way to the pilot community. New aircraft are purchased or imported into the region, while other aircraft are exported from the region or older aircraft are scrapped. The level of utilization of a given aircraft also changes as the aircraft gets older, since this is generally associated with higher maintenance costs and poorer fuel efficiency. When the level of flying increases, it can be expected that new aircraft purchases and imported aircraft will tend to exceed the number of aircraft exported or scrapped and the total fleet will grow. Conversely, if the level of flying decreases, under utilized or unused aircraft will be retired from the fleet at a higher rate than new aircraft will be added and the total fleet will decline. However, the average levels of aircraft utilization will also change with changing levels of flying activity, and so the changes in the aircraft fleet will tend to lag behind the changes in flight activity. Furthermore these changes will not be uniform across the fleet, but will vary with the age and type of the aircraft.
Cohort analysis can also be applied to projecting changes in the aircraft fleet in a similar way to the analysis of the pilot community discussed above. As aircraft get older, their average level of utilization declines and they become more likely to be retired from the fleet by being exported or scrapped, unless they become so old that they become of historic interest or attractive to collectors and get restored to flying condition. However, this is a special case that typically only affects a few aircraft. It should also be noted that

Aviation and Airport Group Access 19
some aircraft are lost each year to flying accidents, although the improvement in general aviation safety has reduced this effect in recent years.
pRojECTinG FuTuRE lEvEls oF AiRpoRT ACTiviTy
Once the size and composition of the future aircraft fleet based in the region has been forecast, it is necessary to project the allocation of this fleet to airports in order to forecast the number of based aircraft and associated activity levels at each airport in the region. The decision by an aircraft owner of where to base the aircraft depends on a num-ber of factors, including the proximity of alternative airports to the owner’s residence or place of business, the facilities and services available at each airport, including whether the runway is long enough to accommodate the aircraft, and the availability and cost of hangar or tie-down space. Apart from the proximity of alternative airports, the other factors can change in the future, and indeed a major objective of the aviation system planning process is to determine future needs for such changes. Therefore the aircraft allocation process should be based on a formal model of the airport choice process by aircraft owners, referred to in the remainder of this working paper as the based-aircraft choice model.
Such a model can be estimated from existing data on the location of aircraft owners in the region and the airport where they base their aircraft and would be structured as a standard disaggregate behavioral choice model, analogous to a travel mode choice model in surface transportation planning. A common form for such a model is the multinomial logit model, which can incorporate utility functions for each airport that include variables describing the facilities and services available at each airport. This allows the based air-craft allocation process to be responsive to potential changes at each airport, as well as changes in the distribution of aircraft owners throughout the region due to changes in the regional distribution of the population and the locations of users of business or corporate aviation, as well as changes in the composition of the pilot community and the use of business or corporate aviation.
This use of a formal model to establish a logical and consistent basis for allocating the projected future regional based aircraft fleet to airports is necessary for several reasons. Perhaps the most important is to provide a means to study the effect of changing facilities and services at regional airports on the distribution of based aircraft. The second is that a large proportion of the aircraft fleet in 2035 (25 years hence) will be owned by different
people from the current fleet and the locational distribution of those people is likely to be different from the current distribution of aircraft owners. Thirdly, to the extent that the demand for hangar or tie-down space at certain airports may exceed the available facili-ties, it can be expected that hangar space or tie-down rental rates will rise to balance demand with capacity and this will also affect the allocation. Finally, the allocation of regional based aircraft demand to airports is likely to be politically sensitive, particularly if some airports are forecast to experience increased numbers of based aircraft and levels of activity while others are forecast to experience a reduction in based aircraft and activ-ity. It is therefore important that the allocation process is transparent and can be justified on the basis of empirical experience and agreed assumptions.
It should be recognized that just as forecasts of future levels of regional activity are sub-ject to a wide range of uncertainties, so any process to allocate that activity to specific airports is also subject to similar, or even greater, uncertainties. There is no crystal ball that can predict what will happen at a given airport. Rather, the purpose of developing demand allocation models is to suggest what might happen under various assumptions and provide a tool to explore how changing those assumptions could change the resulting forecast activity levels at different airports.
Analysis Framework
The analysis approach to be used in developing the regional general aviation demand forecasts comprises a number of separate but interrelated components shown in FIGuRE
2-2 . These components distinguish between personal flight activity by individual pilots and owners of personal aircraft on the one hand and flight activity by corporately owned aircraft on the other, where the corporate aircraft fleet includes aircraft owned by govern-ment agencies, educational institutions, nonprofit organizations, and similar organizations that typically employ professional pilots to operate the aircraft.
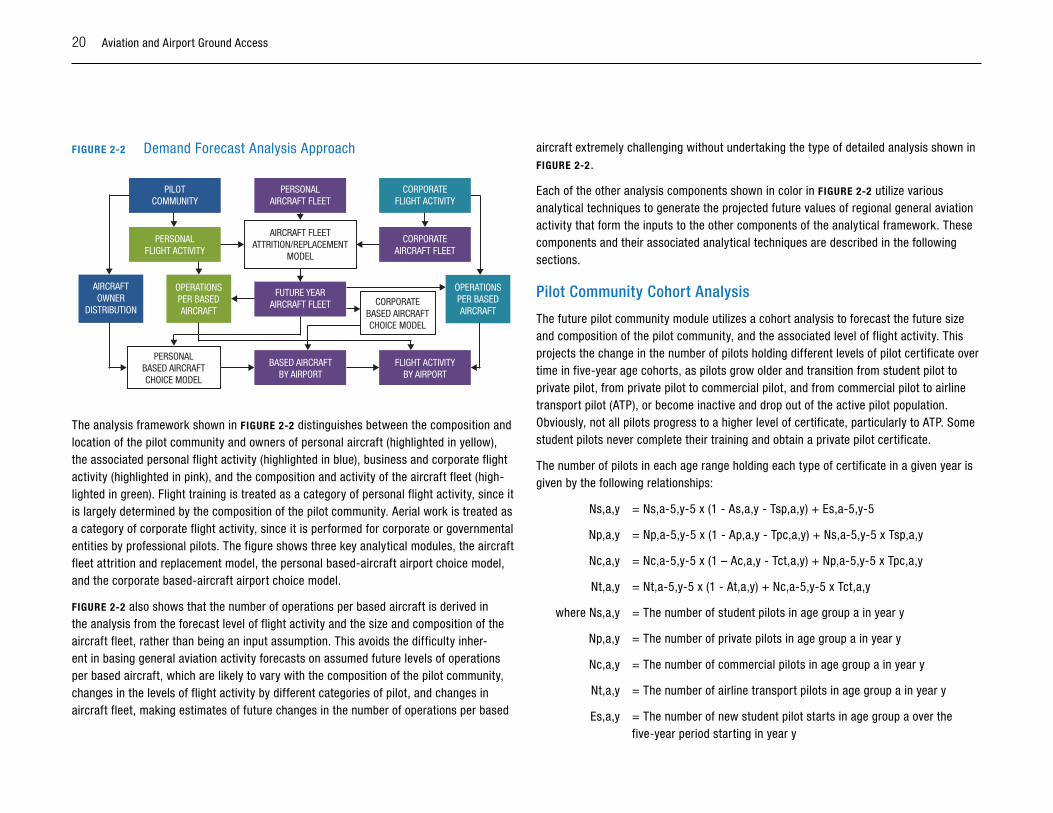
20 Aviation and Airport Ground Access
FIGuRE 2-2 Demand Forecast Analysis Approach
PILOTCOMMUNITY
PERSONALAIRCRAFT FLEET
CORPORATEFLIGHT ACTIVITY
CORPORATEAIRCRAFT FLEET
PERSONALFLIGHT ACTIVITY
FUTURE YEARAIRCRAFT FLEET
OPERATIONSPER BASED AIRCRAFT
OPERATIONSPER BASED AIRCRAFT
AIRCRAFTOWNER
DISTRIBUTION
PERSONALBASED AIRCRAFTCHOICE MODEL
CORPORATEBASED AIRCRAFTCHOICE MODEL
AIRCRAFT FLEETATTRITION/REPLACEMENT
MODEL
BASED AIRCRAFTBY AIRPORT
FLIGHT ACTIVITYBY AIRPORT
The analysis framework shown in FIGuRE 2-2 distinguishes between the composition and location of the pilot community and owners of personal aircraft (highlighted in yellow), the associated personal flight activity (highlighted in blue), business and corporate flight activity (highlighted in pink), and the composition and activity of the aircraft fleet (high-lighted in green). Flight training is treated as a category of personal flight activity, since it is largely determined by the composition of the pilot community. Aerial work is treated as a category of corporate flight activity, since it is performed for corporate or governmental entities by professional pilots. The figure shows three key analytical modules, the aircraft fleet attrition and replacement model, the personal based-aircraft airport choice model, and the corporate based-aircraft airport choice model.
FIGuRE 2-2 also shows that the number of operations per based aircraft is derived in the analysis from the forecast level of flight activity and the size and composition of the aircraft fleet, rather than being an input assumption. This avoids the difficulty inher-ent in basing general aviation activity forecasts on assumed future levels of operations per based aircraft, which are likely to vary with the composition of the pilot community, changes in the levels of flight activity by different categories of pilot, and changes in aircraft fleet, making estimates of future changes in the number of operations per based
aircraft extremely challenging without undertaking the type of detailed analysis shown in FIGuRE 2-2 .
Each of the other analysis components shown in color in FIGuRE 2-2 utilize various analytical techniques to generate the projected future values of regional general aviation activity that form the inputs to the other components of the analytical framework. These components and their associated analytical techniques are described in the following sections.
pilot Community Cohort Analysis
The future pilot community module utilizes a cohort analysis to forecast the future size and composition of the pilot community, and the associated level of flight activity. This projects the change in the number of pilots holding different levels of pilot certificate over time in five-year age cohorts, as pilots grow older and transition from student pilot to private pilot, from private pilot to commercial pilot, and from commercial pilot to airline transport pilot (ATP), or become inactive and drop out of the active pilot population. Obviously, not all pilots progress to a higher level of certificate, particularly to ATP. Some student pilots never complete their training and obtain a private pilot certificate.
The number of pilots in each age range holding each type of certificate in a given year is given by the following relationships:
Ns,a,y = Ns,a-5,y-5 x (1 - As,a,y - Tsp,a,y) + Es,a-5,y-5
Np,a,y = Np,a-5,y-5 x (1 - Ap,a,y - Tpc,a,y) + Ns,a-5,y-5 x Tsp,a,y
Nc,a,y = Nc,a-5,y-5 x (1 – Ac,a,y - Tct,a,y) + Np,a-5,y-5 x Tpc,a,y
Nt,a,y = Nt,a-5,y-5 x (1 - At,a,y) + Nc,a-5,y-5 x Tct,a,y
where Ns,a,y = The number of student pilots in age group a in year y
Np,a,y = The number of private pilots in age group a in year y
Nc,a,y = The number of commercial pilots in age group a in year y
Nt,a,y = The number of airline transport pilots in age group a in year y
Es,a,y = The number of new student pilot starts in age group a over the five-year period starting in year y

Aviation and Airport Group Access 21
As,a,y = The net attrition rate of student pilots in age group a in the five-year period ending in year y
Ap,a,y = The net attrition rate of private pilots in age group a in the five-year period ending in year y
Ac,a,y = The net attrition rate of commercial pilots in age group a in the five-year period ending in year y
At,a,y = The net attrition rate of airline transport pilots in age group a in the five-year period ending in year y
Tsp,a,y = The transition rate of student pilots in age group a to private pilots in the five-year period ending in year y
Tpc,a,y = The transition rate of private pilots in age group a to commercial pilots in the five-year period ending in year y
Tct,a,y = The transition rate of commercial pilots in age group a to airline transport pilots in the five-year period ending in year y
The net attrition rates for a given age group include those pilots moving out of the region (positive) and into the region (negative), as well as those pilots who become inactive. The definition of an inactive pilot requires some care, because pilots do not report their actual flying in a given year, only when they apply for a new medical certificate. In the case of private pilots under age 40, a medical certificate is valid for five years. A pilot holding a valid medical certificate is considered to be active, even if in fact that pilot has done no flying for several years. While the medical certificates for commercial and airline trans-port pilots have shorter validity periods, pilots can exercise the privileges of a lower class of medical certificate for the period that class of medical certificate would have been valid. Thus an airline transport pilot with an expired first-class medical certificate (which is valid for 6 months for pilots age 40 and over) can continue to fly as a private pilot for the period that a third-class medical certificate would have been valid.
It is of course quite likely that some pilots make the transition through more than one cer-tificate level in a five-year period. For example, a student pilot may gain both the private pilot certificate and commercial pilot certificate within five years. This is covered by the combination of the attrition rate and transition rate. Such a pilot would be included in the transition rate from student to private pilot and the transition rate from private pilot to
commercial pilot, but also in the attrition rate for private pilots, in order to ensure the cor-rect number of private pilots at the end of the five-year period. It would also be possible to account for multiple transitions in a five-year period in the above formulae, but given the limitations of the data and the granularity of the analysis (five-year increments), such a refinement does not appear to be worth making.
The foregoing analysis does not consider pilots holding recreational and sport pilot certificates. Given the relatively small number of pilots in these categories, the type of cohort analysis discussed above would not be supported by the data, nor would it make much difference to the resulting estimate of the size of the pilot population. Instead, these pilot categories can be included by a separate analysis based on the current trend in the number of such pilot certificates issued.
The above equations allow for pilot attrition and transition rates to vary over time. While the available data on the composition of the pilot community may not allow a detailed analysis of how these rates have varied in the past, allowing these rates to vary in the cohort analysis provides a way to reflect projected changes from current rates in the future, as discussed below in the section on Key Assumptions.
Once the number of pilots in each age group with a given level of pilot certificate has been calculated, the total number of flight hours per year performed by those pilots can be calculated from the average number of flight hours per pilot for a pilot in that age and certificate category. Estimates of the average number of flight hours per year for pilots in a given age group and certificate category can be derived from the number of flight hours reported by pilots when they renew their medical certificates or from pilot surveys, as discussed further below in the section on Data Requirements and Sources.
In the case of airline transport pilots, their reported flight hours include all types of flying, the majority of which is likely to be airline flying. Indeed many airline pilots may not do any GA flying at all. Since they do not report flight hours for GA flying separately, it will be necessary to estimate the proportion of their flight hours spent in GA flying from pilot survey data or other sources.
The net attrition rates for a given age group include those pilots moving out of the region (positive) and into the region (negative), as well as those pilots who become inactive. The definition of an inactive pilot requires some care, because pilots do not report their actual flying in a given year, only when they apply for a new medical certificate. In the case of
22 Aviation and Airport Ground Access
private pilots under age 40, a medical certificate is valid for five years. A pilot holding a valid medical certificate is considered to be active, even if in fact that pilot has done no flying for several years. While the medical certificates for commercial and airline trans-port pilots have shorter validity periods, pilots can exercise the privileges of a lower class of medical certificate for the period that class of medical certificate would have been valid. Thus an airline transport pilot with an expired first-class medical certificate (which is valid for 6 months for pilots age 40 and over) can continue to fly as a private pilot for the period that a third-class medical certificate would have been valid.
It is of course quite likely that some pilots make the transition through more than one cer-tificate level in a five-year period. For example, a student pilot may gain both the private pilot certificate and commercial pilot certificate within five years. This is covered by the combination of the attrition rate and transition rate. Such a pilot would be included in the transition rate from student to private pilot and the transition rate from private pilot to commercial pilot, but also in the attrition rate for private pilots, in order to ensure the cor-rect number of private pilots at the end of the five-year period. It would also be possible to account for multiple transitions in a five-year period in the above formulae, but given the limitations of the data and the granularity of the analysis (five-year increments), such a refinement does not appear to be worth making.
The foregoing analysis does not consider pilots holding recreational and sport pilot certificates. Given the relatively small number of pilots in these categories, the type of cohort analysis discussed above would not be supported by the data, nor would it make much difference to the resulting estimate of the size of the pilot population. Instead, these pilot categories can be included by a separate analysis based on the current trend in the number of such pilot certificates issued.
The above equations allow for pilot attrition and transition rates to vary over time. While the available data on the composition of the pilot community may not allow a detailed analysis of how these rates have varied in the past, allowing these rates to vary in the cohort analysis provides a way to reflect projected changes from current rates in the future, as discussed below in the section on Key Assumptions.
Once the number of pilots in each age group with a given level of pilot certificate has been calculated, the total number of flight hours per year performed by those pilots can be calculated from the average number of flight hours per pilot for a pilot in that age and certificate category. Estimates of the average number of flight hours per year for pilots in
a given age group and certificate category can be derived from the number of flight hours reported by pilots when they renew their medical certificates or from pilot surveys, as discussed further below in the section on Data Requirements and Sources.
In the case of airline transport pilots, their reported flight hours include all types of flying, the majority of which is likely to be airline flying. Indeed many airline pilots may not do any GA flying at all. Since they do not report flight hours for GA flying separately, it will be necessary to estimate the proportion of their flight hours spent in GA flying from pilot survey data or other sources.
Aircraft owner Distribution
The current geographic distribution of aircraft owners in the region can be determined from the aircraft ownership data maintained by the County Assessors. These data provide the registered address of the aircraft owner, allowing the distribution of aircraft owners by zip code to be determined. In the case of some corporately owned aircraft, the regis-tered address may be outside the region, such as a corporate head office. In these cases, it will be necessary to determine the location of the local office of the aircraft owner, which in some cases may be the airport where the aircraft is based.
As the composition of the aircraft fleet ownership changes over time, the distribution of the aircraft owners may change, reflecting the geographic locations of new owners and relocation of existing owners. An ownership distribution model will be developed from the current ownership pattern that predicts the proportion of the regional aircraft owners located in each zip code area. Separate models will need to be developed for personally owned aircraft and corporately owned aircraft. In the case of personally-owned aircraft, the distribution of owner locations is likely to be most influenced by the number of high-income households in a zip code area, but the influence of other variables will be explored as part of the model estimation.
The geographic distribution of owners of corporately-owned aircraft is likely to reflect the distribution of the types of businesses owning aircraft. As a general rule larger firms are more likely to own aircraft, so employment by different industry sectors may be the most appropriate explanatory variables. Exploratory analysis will be performed to identify those sectors that account for the greatest proportion of aircraft ownership and to select the most appropriate explanatory variables to predict the distribution of aircraft owners. This may require some compromise between the extent to which a given variable accounts for
Aviation and Airport Group Access 23
the current distribution of aircraft owners and the availability of forecasts of that variable for future years.
personal Flight Activity
The number of flight hours by different categories of pilot certificate has been discussed above. In order to translate these estimates into forecasts of personal flight activity, it is necessary to determine the proportion of flight hours devoted to personal flight activity (personal and recreational flying, flight training, and business flying by individual aircraft owners). This can be done based on an analysis of FAA survey data of annual general aviation flight hours by aircraft type (FAA, 2011c). Since there is generally only one pilot in an aircraft being used for most personal flying, there is a one-to-one correspondence between pilot hours and aircraft hours. The one exception to this is dual flight instruction, in which both the student pilot and the flight instructor will be counting the flight time. It will therefore be necessary to estimate the proportion of instructional flight time that is spent in dual instruction and the proportion where the student pilot is solo. In general, for most student pilots this is approximately equal over the course of their flight training.
The data on aircraft flight hours by purpose does not of course indicate the type of cer-tificate held by the pilot, and while student and private pilots are precluded from serving as pilots for corporate flying and other flight activity where the flight crew is paid, pilots holding commercial and airline transport certificates can and do engage in personal flying. It will therefore be necessary to estimate the amount of compensated flying from the aircraft survey data for different use categories, and hence estimate the propor-tion of flight time by commercial and airline transport pilots that is spent in personal flight activity.
Corporate Flight Activity
In contrast to personal flight activity, the level of corporate flight activity is not deter-mined by the size and composition of the regional pilot community but by the need for transportation or other aviation activity by the organizations generating the corporate flight activity, whether through the use of their own aircraft or by chartering aircraft operated by others. As shown by the various categories of aircraft use shown in TABlE
1-2 above and the descriptions of the different categories in Appendix A, corporate flight activity encompasses a wide range of flight purposes, including:
� Corporate/executive transportation
� Aerial application or observation
� Other aerial work and external load activity
� Sight-seeing under FAR Part 91
� Air medical services (under both FAR Part 91 and Part 135)
� Air taxi services
� Air tours.
Some activities under Other Work Use or Other use (e.g. aerial advertising, positioning flights, and proficiency flights) could also be most appropriately considered part of corpo-rate flight activity. In the Southern California region, some categories of aircraft use, such as aerial application, external load, sightseeing and air tours, are likely to occur extremely infrequently relative to other categories and can be combined into a single category of Other use.
Since the aircraft involved in corporate flight activity are generally quite different from those used for personal flying, the estimates of flight hours for these purposes by dif-ferent types of aircraft can be applied to the data on the composition of the Southern California based aircraft fleet to estimate the amount of corporate flying by that fleet.
ACCounTinG FoR FRACTionAl ownERship
The recent growth in fractional ownership plans requires an adjustment to the analysis approach. From an operational standpoint, fractional ownership is no different from an air taxi charter. It is only the way that the service is paid for that differs. However, because the user has purchased a share of the ownership of the aircraft rather than chartering the aircraft for a specific flight, this activity is counted as part of general aviation corporate flight activity rather than as a Part 135 air taxi flight. Because aircraft used in fractional ownership plans are likely to achieve higher utilization that those operated exclusively by the aircraft owner, adjustments to the average number of flight hours per aircraft are likely to be required, for both aircraft used in fractional ownership plans and those oper-ated exclusively by the aircraft owners.
The FAA survey data of annual general aviation flight hours by aircraft type (FAA, 2011c) includes estimates of the annual hours flown in fractional ownership by aircraft type.
24 Aviation and Airport Ground Access
These data can be used to estimate the proportion of corporate GA flying that should be classified as fractional ownership activity and used to adjust the average flight hours per aircraft assumed for aircraft used in fractional ownership. Unfortunately the published results of the FAA survey do not include an estimate of the number of aircraft involved in fractional ownership plans. Therefore this number will need to be estimated from other sources (e.g. J.P. Morgan’s Business Jet Monthly newsletter (J.P. Morgan, 2011)).
operations per Based Aircraft
The number of operations per based aircraft is a metric that is commonly used in fore-casting general aviation activity at airports, primarily because it is easily calculated from aircraft operations counts and based aircraft counts, both of which are routinely collected or estimated at all airports. However, in the aggregate this measure fails to capture the effects of the widely different level of utilization of different types of aircraft used for different purposes. It also assumes that the ratio of operations by visiting aircraft to those by based aircraft remains constant. If the composition of the aircraft fleet at a given airport or the level of activity by visiting aircraft relative to that of based aircraft changes over time, it can be expected that the number of operations per based aircraft will also change.
Therefore what is needed instead is a way to determine the number of operations by based aircraft as a function of the level of flight activity by the owners of those aircraft, which can then be combined with an estimate of the number of operations by visiting aircraft determined in a separate step. Given the number of flight hours for personal and corporate flight activity as discussed in the previous sections, these can be translated into aircraft operations based on estimates of the number of landings per flight hour and the proportion of those landings that occur at the airport where the aircraft is based. The average number of landings per flight hour for different aircraft types is available from FAA survey data of annual general aviation flight activity by aircraft type (FAA, 2011c). The average for each aircraft type covers all purposes for which that aircraft type is used, so some adjustments will be required to reflect the different uses of each type of aircraft. For example, flight training will generate far more landings per flight hour than recre-ational flying, although both flight purposes may use similar aircraft types.
These adjustments can be made on the basis of data for aircraft types that are typically not used extensively for flight training, although an attempt will be made to obtain more
detailed data from the FAA general aviation activity survey to perform a more explicit analysis of these differences.
Estimates of the proportion of landings that are performed at the airport where the air-craft is based requires assumptions about the proportion of flight hours involved in local operations (those where the aircraft remains in the traffic pattern or returns to the airport without landing elsewhere), the average number of landings per flight hour for local operations compared to itinerant operations, and the average number of flight segments for an itinerant trip. This information can be obtained for a representative set of flights from surveys of airport users, such as the 1990 FAA General Aviation Pilot and Aircraft Activity Survey (Executive Resource Associates, 1991). Although this survey is now over 20 years old, the underlying patterns of general aviation activity are not anticipated to have changed all that much, although of course the total level of activity has.
Aircraft Fleet Attrition/Replacement Model
This model component is designed to predict the changes in the general aviation aircraft fleet based in the region over time in order to generate a projected future year (2035) aircraft fleet. The model considers the attrition of the current aircraft fleet as aircraft age and become uneconomical to maintain in airworthy condition or are lost due to accidents, together with replacement due to new aircraft purchases and net imports of aircraft to the region less exports of aircraft from the region. From the perspective of the regional based aircraft fleet, the only difference between new aircraft purchases and imports is the age of the new aircraft being added to the regional based aircraft fleet.
The model is based on a Markov process, in which the probability of an aircraft of type i and age a in the regional fleet in year t being lost to the fleet (whether through attrition or export) in year t+1 is given by Pi(a). As a practical matter, aircraft are grouped into a limited number of similar types (e.g. single-engine piston, multi-engine piston, etc.) in order to calculate the probabilities Pi(a) from national aircraft fleet data. The total number of registered aircraft of a given type and age at the national level over time provides the probability of attrition, while the corresponding number of registered aircraft of a given type and age in the region, after adjusting for attrition, provides the probability of net export (exports less imports).
Since the analysis is only attempting to predict the size of the fleet by aircraft type, and not track individual aircraft, only net exports (or net imports) matter. There is a national

Aviation and Airport Group Access 25
market for used aircraft (indeed even an international market), so if a specific aircraft based in the Southern California region is sold to a purchaser outside the region but another aircraft of the same type that is based outside the region is purchased by a buyer in Southern California and moved to the region, there is no net change in the regional based aircraft fleet (although of course the location of the owners within the region has most likely changed).
Accounting for new aircraft purchases is complicated since the decision to purchase a new aircraft depends not only on the available fleet of used aircraft, but the overall demand for aircraft. Therefore, a separate sub-model will be developed based on recent trends in national data for new aircraft sales by type. Since someone choosing between purchasing a new aircraft and a used aircraft is only likely to consider relatively new used aircraft, the number of new aircraft added to the Southern California aircraft fleet in a given year will depend on the overall level of general aviation activity in the region and the size of the existing aircraft fleet that is relatively new (perhaps up to five years old). The exact age criterion is probably not all that important, although of course the relationship between the number of new aircraft purchased in a given year and the size of the existing fleet that is considered relatively new will vary with the age criterion used. An analysis of the age profile of aircraft in Southern California over recent years will be undertaken to identify the most suitable criterion.
Although the approach is based on an analysis of the composition of the registered aircraft fleet over time, there is no guarantee that the historical rates of attrition and new aircraft acquisition will persist in the future, particularly over a period as long as 25-years. Therefore the resulting attrition and acquisition rates will be reviewed with the Aviation Technical Advisory Committee and adjusted as necessary to reflect Committee input on factors that appear likely to modify those rates in the future.
AiRCRAFT DATA ConsiDERATions
An analysis of aircraft attrition and new aircraft acquisition rates could be based on the national data on the registered aircraft fleet maintained by the Federal Aviation Administration, although potential difficulties could arise from inaccuracies in the regis-tered aircraft data. Because aircraft registrations do not currently need to be renewed on an annual basis (in the way that automobile registrations do), there is a concern that the current registered aircraft database includes a large number of aircraft that are no longer
active or whose owners may have moved, although efforts are currently underway within the FAA to improve the accuracy of the aircraft registration database. However, California County Assessors also maintain databases of aircraft based within the county for tax purposes. These data are likely to be reasonably accurate because aircraft owners will notify the County Assessor if their aircraft have been disposed of. By basing the attrition analysis on the County Assessor data, it should be possible to obtain a reasonably accu-rate picture of the evolution of the aircraft fleet in the Southern California region.
AiRCRAFT FlEET ATTRiTion MoDEls
An early model of attrition in the general aviation fleet was developed by Rocks (1976). Although the data on which this study is based is now quite dated, the underlying rela-tionship between the age of an aircraft and the likelihood that it will cease to be used or scrapped that is described by the model may not have changed all that much over the past three and a half decades. Aircraft have very long lives if properly maintained and much of the existing general aviation aircraft fleet is not significantly different from the fleet studied by Rocks. Indeed, many of the aircraft in the current fleet were already in the fleet that was studied by Rocks.
A representative aircraft fleet attrition model was developed for the 1994 update of the San Francisco Bay Area Regional Airport System Plan (MTC, 1994). Using data for the Cessna 150/152 series aircraft, it was found that the annual fleet attrition rate declined from about 2.5 percent per year for relatively new aircraft to around zero for aircraft 25 years old or older, as shown in FIGuRE 2-3. Negative attrition rates beyond 20 years observed in the data could be due to data errors or inactive aircraft being returned to operation.
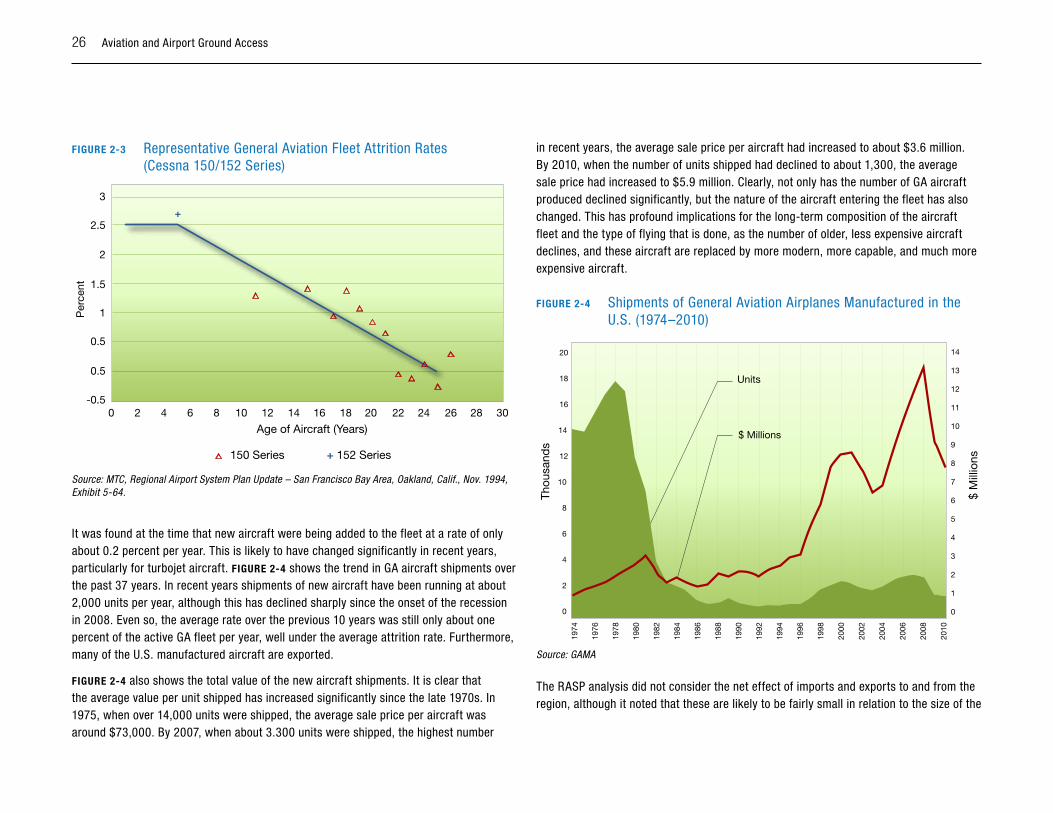
26 Aviation and Airport Ground Access
FIGuRE 2-3 Representative General Aviation Fleet Attrition Rates (Cessna 150/152 Series)
0 2 4 6 8 10
+
12 14 16
Age of Aircraft (Years)
150 Series + 152 Series
18 20 22 24 26 28 30-0.5
0.5
0.5
1
1.5
2
2.5
3
Per
cent
Source: MTC, Regional Airport System Plan Update – San Francisco Bay Area, Oakland, Calif., Nov. 1994, Exhibit 5-64.
It was found at the time that new aircraft were being added to the fleet at a rate of only about 0.2 percent per year. This is likely to have changed significantly in recent years, particularly for turbojet aircraft. FIGuRE 2-4 shows the trend in GA aircraft shipments over the past 37 years. In recent years shipments of new aircraft have been running at about 2,000 units per year, although this has declined sharply since the onset of the recession in 2008. Even so, the average rate over the previous 10 years was still only about one percent of the active GA fleet per year, well under the average attrition rate. Furthermore, many of the U.S. manufactured aircraft are exported.
FIGuRE 2-4 also shows the total value of the new aircraft shipments. It is clear that the average value per unit shipped has increased significantly since the late 1970s. In 1975, when over 14,000 units were shipped, the average sale price per aircraft was around $73,000. By 2007, when about 3.300 units were shipped, the highest number
in recent years, the average sale price per aircraft had increased to about $3.6 million. By 2010, when the number of units shipped had declined to about 1,300, the average sale price had increased to $5.9 million. Clearly, not only has the number of GA aircraft produced declined significantly, but the nature of the aircraft entering the fleet has also changed. This has profound implications for the long-term composition of the aircraft fleet and the type of flying that is done, as the number of older, less expensive aircraft declines, and these aircraft are replaced by more modern, more capable, and much more expensive aircraft.
FIGuRE 2-4 Shipments of General Aviation Airplanes Manufactured in the U.S. (1974–2010)
18
20
16
12
14
10
6
4
2
8
0
14
13
11
12
10
6
4
2
3
5
7
9
1
8
0
1996
1998
1974
1976
1978
1980
1982
1984
1986
1988
1990
1992
1994
2000
2002
2008
2004
2006
2010
Thou
sand
s
$ M
illio
ns
Units
$ Millions
Source: GAMA
The RASP analysis did not consider the net effect of imports and exports to and from the region, although it noted that these are likely to be fairly small in relation to the size of the
Aviation and Airport Group Access 27
total fleet and will tend to offset each other. A more explicit accounting of net exports will be undertaken as part of the project, as discussed above.
The attrition pattern developed for the Bay Area RASP is now over 15 years old, and will need to be updated and expanded for the current study. The literature review has not identified any more recent application of a formal general aviation fleet attrition model, although the FAA includes assumptions about GA fleet attrition in its annual forecasts of the future GA fleet.
AiRCRAFT ownER DisTRiBuTion
In addition to the size of the future regional based aircraft fleet, it is also necessary to consider whether the geographic distribution of aircraft owners will change in the future. Although this is not part of the Aircraft Fleet Attrition/Replacement Model, it is a neces-sary step before allocating the projected future aircraft fleet to airports within the region. Data on the current distribution of aircraft owners by zip code can be obtained from the registered address of the aircraft owner and aggregated to suitable sub-regional analysis zones that are selected to contain a similar number of current aircraft owners.
In the case of corporately owned aircraft, it may be necessary to make adjustments to the registered location, since the aircraft registration may use the address of a corporate office that bears little relationship to the operating units using the aircraft, and may even be outside the region. For example, an aircraft may be registered using the address of a corporate flight department that is located at the airport where the aircraft is based, although the choice of airport at which to locate the flight department was influenced by the location of the principal corporate offices in the region.
Rather than simply assume that the geographic distribution of aircraft owners will remain unchanged, an aircraft owner distribution model will be developed using linear regression. In the case of personally owned aircraft, the independent variables that are most likely to provide a reasonable fit to the data are population and average household income, although other socioeconomic factors will also be explored. Identifying suitable indepen-dent variables in the case of corporately owned aircraft is likely to be more difficult and will require some exploratory analysis. The challenge is not so much identifying measures of business activity that are correlated with aircraft ownership but selecting measures for which long-term forecasts are available at a sub-regional level. It may therefore be necessary to use a more general measure of business activity, such as employment, for
which forecasts are available but is not particularly well correlated with aircraft owner-ship and then apply sub-regional adjustment factors that reflect the current distribution of aircraft owners. This will at least ensure that projected future regional changes in the distribution of employment will be reflected in the forecast distribution of aircraft owners.
Although the resulting regression models will not necessarily produce the correct number of aircraft owners for a future year based on the projected size of the aircraft fleet, since aircraft ownership levels may change over time due to factors other than changes in household income or business activity, this is not a concern since all that is needed is the geographic distribution of those owners, so the model projections can be factored to give the correct totals.
The other major advantage of developing aircraft owner distribution models of this type is that they provide a means to allocate the forecast number of aircraft owners to smaller geographic zones (such as regional travel analysis zones), in a consistent way. This becomes important in applying the based airport choice models, since the relative proximity to alternative airports is a major consideration in the choice of airport and the analysis zones for this need to be relatively small in order to properly account for differ-ences in airport proximity.
personally owned Aircraft Based Airport Choice Model
This model (referred to in Figure 2-1 as the Personal Based Aircraft Choice Model for brevity) predicts the choice of airport at which to base a personally owned aircraft, considering the geographic distribution of aircraft owners and the facilities and ser-vices available at the different airports in the region. The general form of the model is a multinominal logit discrete choice model that predicts the probability of a given aircraft owner k choosing airport j as a function of the proximity of each of the set of N alternative airports and the facilities and services at those airports. The number of based aircraft at each airport, as well as the geographic distribution of their owners, is them obtained by summing up the probabilities for each aircraft in the regional fleet.
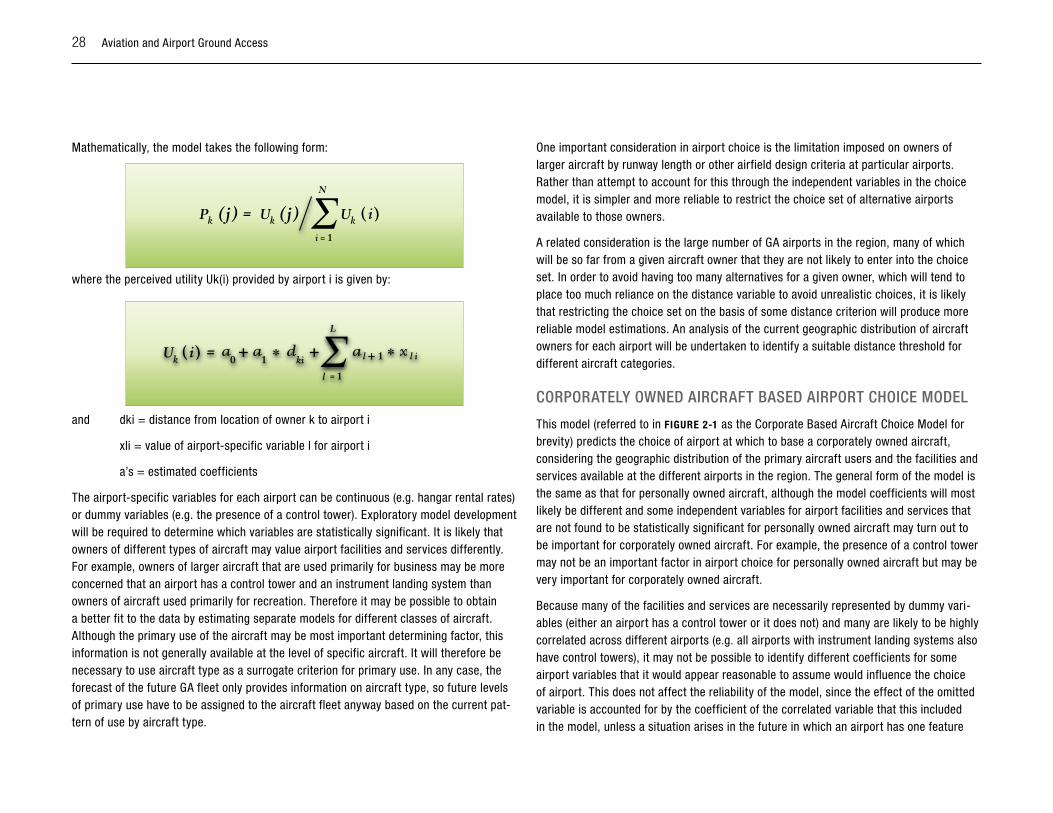
28 Aviation and Airport Ground Access
Mathematically, the model takes the following form:
where the perceived utility Uk(i) provided by airport i is given by:
and dki = distance from location of owner k to airport i
xli = value of airport-specific variable l for airport i
a’s = estimated coefficients
The airport-specific variables for each airport can be continuous (e.g. hangar rental rates) or dummy variables (e.g. the presence of a control tower). Exploratory model development will be required to determine which variables are statistically significant. It is likely that owners of different types of aircraft may value airport facilities and services differently. For example, owners of larger aircraft that are used primarily for business may be more concerned that an airport has a control tower and an instrument landing system than owners of aircraft used primarily for recreation. Therefore it may be possible to obtain a better fit to the data by estimating separate models for different classes of aircraft. Although the primary use of the aircraft may be most important determining factor, this information is not generally available at the level of specific aircraft. It will therefore be necessary to use aircraft type as a surrogate criterion for primary use. In any case, the forecast of the future GA fleet only provides information on aircraft type, so future levels of primary use have to be assigned to the aircraft fleet anyway based on the current pat-tern of use by aircraft type.
One important consideration in airport choice is the limitation imposed on owners of larger aircraft by runway length or other airfield design criteria at particular airports. Rather than attempt to account for this through the independent variables in the choice model, it is simpler and more reliable to restrict the choice set of alternative airports available to those owners.
A related consideration is the large number of GA airports in the region, many of which will be so far from a given aircraft owner that they are not likely to enter into the choice set. In order to avoid having too many alternatives for a given owner, which will tend to place too much reliance on the distance variable to avoid unrealistic choices, it is likely that restricting the choice set on the basis of some distance criterion will produce more reliable model estimations. An analysis of the current geographic distribution of aircraft owners for each airport will be undertaken to identify a suitable distance threshold for different aircraft categories.
CoRpoRATEly ownED AiRCRAFT BAsED AiRpoRT ChoiCE MoDEl
This model (referred to in FIGuRE 2-1 as the Corporate Based Aircraft Choice Model for brevity) predicts the choice of airport at which to base a corporately owned aircraft, considering the geographic distribution of the primary aircraft users and the facilities and services available at the different airports in the region. The general form of the model is the same as that for personally owned aircraft, although the model coefficients will most likely be different and some independent variables for airport facilities and services that are not found to be statistically significant for personally owned aircraft may turn out to be important for corporately owned aircraft. For example, the presence of a control tower may not be an important factor in airport choice for personally owned aircraft but may be very important for corporately owned aircraft.
Because many of the facilities and services are necessarily represented by dummy vari-ables (either an airport has a control tower or it does not) and many are likely to be highly correlated across different airports (e.g. all airports with instrument landing systems also have control towers), it may not be possible to identify different coefficients for some airport variables that it would appear reasonable to assume would influence the choice of airport. This does not affect the reliability of the model, since the effect of the omitted variable is accounted for by the coefficient of the correlated variable that this included in the model, unless a situation arises in the future in which an airport has one feature
Aviation and Airport Group Access 29
but not the other (e.g. an instrument landing system is installed at an airport without a control tower). This situation can be handled through the inclusion of an additional vari-able, with the coefficient value of the correlated variable included in the estimated model split between the two variables on the basis of judgment or separate analysis (e.g. past surveys of aircraft owners on the relative importance of different factors in their choice of airport).
FliGhT ACTiviTy By AiRpoRT
The number of aircraft operations at a given airport result from activity by based aircraft and itinerant operations by transient (or visiting) aircraft that are based elsewhere. The aircraft operations by based aircraft can be estimated from the forecast number of flight hours and the number of operations per flight hour. These parameters are likely to vary considerably by aircraft type and can be estimated from survey data on aircraft activity levels.
Local operations largely result from flight training activities and some proficiency flights, as well as aerial activity and observation. There may also be a fairly small number of local operations by visiting aircraft. Thus the number of local and itinerant operations can be projected by estimating a relationship between the tower count data and the opera-tions estimates derived from the flight hour analysis. The coefficients of this relationship perform two functions. First they adjust the number of operations derived from the flight hour analysis to achieve consistency with the tower count data. Second, they account for the varying split between local and itinerant operations by different aircraft uses.
iTinERAnT opERATions By TRAnsiEnT AiRCRAFT
Projecting itinerant operations by transient aircraft needs to utilize a different approach, since the number of such operations is not directly related to the number of based aircraft. Rather these operations can be expected to increase from current levels at each airport in proportion to the growth in the regional total of itinerant operations by based aircraft, reflecting the changes in the underlying factors driving the demand for general aviation activity. This assumes that these factors change elsewhere in the country in the same way that they do in Southern California. Since many of these factors, such as the price of aviation fuel, the general state of the economy, and corporate tax policies, are largely determined at a national level anyway, this does not seem an unreasonable
assumption. Even if the Southern California economy is assumed to grow at a different rate from the national economy, to reflect that difference in the relative growth of itiner-ant operations by based aircraft and visiting aircraft would require a model of the demand for itinerant operations that incorporates separate measures of economic activity at both the origin and destination end of the trip.
The only known example of such a model is the Virginia Tech Transportation Systems Analysis Model. However, this model forecasts total person-trips on a county-to-county basis divided into five household income groups, where the highest income group has a household income greater than $150,000 in 2000 dollars. While different economic growth assumptions in different regions of the country would change the number of households in this income category, this is likely to be a fairly poor measure of the effect on the use of general aviation. In the first place, most users of general aviation for busi-ness or corporate travel are likely to have a household income significantly higher than $150,000, so changes in the number of households in this category do not necessarily reflect changes in the number of trips made by travelers likely to consider using general aviation rather than commercial airlines. Secondly, most such travel decisions to use general aviation are made by businesses or government agencies, rather than individual travelers, and the number of households in the highest income category does not really reflect the considerations that would lead to decisions to use general aviation for specific trips.
Thus while the planned approach ignores the effect of possible factors that could change the ratio of the number of itinerant operations by visiting aircraft to Southern California airports to the number of itinerant operations by based aircraft, a more detailed analysis of the pattern of itinerant GA operations to and from the region is beyond the resources of the current study.
Data Requirements and sources
Implementation of the forecasting approach described in this working paper requires extensive data on:
� Pilot population and flight activity
� Based aircraft and aircraft ownership
� Airport characteristics and fees
30 Aviation and Airport Ground Access
� Airport activity by based and transient aircraft
� Regional socioeconomic data
These data requirements and available data sources are discussed in more detail in the remainder of this section. While much of the required data is available from FAA and other government sources, information on the flight hours of individual pilots is not publicly available (the FAA collects this information when pilots renew their medical certificates, but it is not releasable for privacy reasons). Furthermore, without identifiable data on individual pilots, it is not possible to link the flight activity of the pilot community to the flight activity of the aircraft fleet, obtained from aircraft activity surveys. In order to address this missing link in the data, a survey of AOPA members is being undertaken as part of the current study, as described in more detail below.
piloT populATion AnD ACTiviTy
Statistical data on the U.S. pilot population is available from the annual FAA U.S. Civil Airmen Statistics (FAA, 2011e). Data on individual pilots from the FAA Airmen Registration Database, including their address, pilot certificates, and date of their most recent medi-cal certificate, can be downloaded from the FAA website (FAA, 2011d). However these data do not include the pilot’s age or flight experience and exclude the records of airmen who have requested that their address not be released. Totals of active airmen by county (including those who have requested their address not be released) are also available online (FAA, 2011f). Unfortunately, the FAA updates the downloadable data monthly and does not formally archive these data. Only the most recent version is shown on the FAA website, although prior versions remain on the server for some time and can still be accessed by entering the correct URL for the files. However the data available in this way only goes back about two years. Luckily, an earlier version from October 2004 was found on a web archive (http://www.archive.org). The totals of active airmen by county are presented in a PDF report that is generated by an application program from the under-lying data tables that are updated even more frequently than the downloadable data. Thus these totals can change continuously and there is no way to access the data for a prior date.
However the FAA Airmen Certification Branch maintains internal reports on past totals of active airmen by county, and the relevant pages of these reports for California counties were obtained from the Branch staff for a selection of prior years.
The FAA active airman registry does not contain data on the flight time experience of each airman. However, pilots are required to provide their total flight hours to date and the flight hours in the prior six months on their application form to obtain or renew their medical certificate. The flight experience data is maintained in a separate database by the FAA Civil Aerospace Medical Institute (Peterman, Rogers, et al., 2008) and has been used in a recent study of U.S. pilot characteristics (Rogers, Véronneau, et al., 2009). An attempt will be made to gain access to these data for use in the current study. Failing this, the change in average flight hours for holders of different classes of medical certificate over time is given by Rogers Véronneau, et al. (2009) and these data can be combined with data on the changing age distribution of the pilot population from the U.S. Civil Airmen Statistics to estimate the average annual flight hours for different age groups and class of pilot certificate. In addition, data on pilot flight experience will be obtained from the survey of AOPA members discussed below.
ThE AopA MEMBER suRvEy
With the assistance of the Aircraft Owners and Pilots Association an online survey was performed of the California AOPA membership by SCAG and the California Department of Transportation (Caltrans) Division of Aeronautics. The AOPA has agreed to invite its California members to participate in the survey and provide them with the web address of the survey website where they can complete the survey. Survey respondents were not asked to provide identifying information, but they were asked to provide their zip code of residence and (if they are an aircraft owner) the airport where they base their aircraft. They were also asked to provide the following information:
� Whether they have flown general aviation aircraft in the past six months
� How long ago they last flew as general aviation pilot (if no longer active)
� The highest level of pilot certificate that they currently hold (or have held)
� Their total flight hours in all types of aircraft
� Their flight hours in general aviation aircraft in the past year
� Whether they are a current or former aircraft owner
� The type(s) or aircraft that they own (or owned), if any
� Their age range (in ten year intervals)
Aviation and Airport Group Access 31
In addition, the survey asked a number of questions about services that the respondents have used or would like to see at airports that they use, as well as issues that they believe should be addressed at the airport where they base their aircraft or use most frequently, or that should be considered in developing a general aviation demand forecast.
The findings of the survey thus provide a more detailed profile of the pilot population in the SCAG region than can be obtained from the more aggregate data available from the FAA.
AiRCRAFT ownERship AnD BAsED AiRpoRT
Detailed data on the composition and ownership of the current aircraft fleet is available from the aircraft registration data maintained by the County Assessors. These data pro-vide the registered location of the aircraft owners by zip code, the type and age of each aircraft, and in most cases the airport where the aircraft is based. In general it is possible to determine whether an aircraft is owned by one or more individuals, a business, a government agency, an educational institution, or some other type of organization, such as a nonprofit association, from the name of the registered owner. In the case of aircraft owned by businesses, it is also necessary to classify the business by industry sector for use in developing the aircraft owner distribution models discussed above. In some cases this is obvious from the name of the owner. In other cases, some research will be needed to classify the owner into the appropriate industry sector.
Data on the total number of based aircraft at each airport is available from the FAA Form 5010, available online for each airport on the Caltrans Division of Aeronautics website, as well as other online aviation data sources, such as AirNav.com (http://www.airnav.com). While the FAA Form 5010 data is updated each year and the online sources do not provide historical data, the Caltrans Division of Aeronautics maintains an historical data file of based aircraft counts for every airport in the state.
AiRpoRT ChARACTERisTiCs AnD FEEs
Airport facilities and fees are likely to be factors in the decisions of aircraft owners on where to base their aircraft. Information on airport facilities, such as runway length and the presence of a control tower, is available from the FAA Form 5010. Additional infor-mation on airport businesses, including fuel prices, is available online from AirNav.com.
Hangar and tiedown rental rates are available for some airports on the airport websites. In other cases it may be necessary to survey airport managers to determine current fees.
Airport Activity by Based and Transient Aircraft
Airport operations counts for towered airports are available from the FAA Air Traffic Activity Data System (ATADS) at http://aspm.faa.gov. This provides daily, monthly, and annual traffic counts, distinguishing between air carrier, air taxi, general aviation, and military operations, with separate counts for local and itinerant operations, Estimates of annual operations at non-towered airports are available from the FAA Form 5010 data, separated into air carrier, air taxi, GA local ,GA itinerant, and military operations.
However, these airport activity counts do not distinguish between itinerant operations by based aircraft and transient (visiting) aircraft. In some cases, airport management may be able to provide an indication of the amount of activity by transient aircraft from records such as fuel sales receipts, overnight aircraft parking fees, or airport noise monitoring systems (which can generate reports of airport operations by tail number). As part of the current study, a survey of airport managers has been undertaken to identify the availabil-ity of information on activity by transient aircraft at each airport.
Data on average flight hours for different purposes by different types of aircraft are available from annual FAA General Aviation Activity and Part 135 Activity Surveys (FAA, 2011c). While these are national data, the utilization rates for different aircraft types can be applied to the aircraft fleet in the Southern California region. Some adjustment factors may be necessary to generate a level of activity that is consistent with the airport opera-tions counts after making allowances for operations by visiting aircraft and the number of landings made outside the region by aircraft based at Southern California airports.
REGionAl soCioEConoMiC DATA
SCAG has developed forecasts of households, population and employment at the travel analysis zone (TAZ) level. These forecasts give the number of households in four income ranges (less than $25,000, $25,000 to $49,999, $50,000 to $99,999, and $100,000 and over, in 1999 dollars) and the total population in the zone, as well as the number of households with no children, one child, two children, and three or more children. The employment forecasts give the total employment in the zone in three income ranges (less than $25,000, $25,000 to $49,999, and $50,000 and over, also in 1999 dollars), as well
32 Aviation and Airport Ground Access
as the total employment in 13 industry sectors, based on the two-digit North American Industry Classification System (NAICS) codes.
Although the SCAG data on employment by industry sector does not include information on the number of businesses in a given zone, the current distributions of businesses by industry sector and size are available at the zip code level from the U.S. Census Bureau data on County Business Patterns. These data provide the number of businesses in each zip code by industry sector and size, expressed in terms of number of establishments by employment size ranges, using the NAICS codes.
Key Assumptions
Although the forecasting approach described in this report is based on an analysis of cur-rent trends in the pilot population, the composition and use of the general aviation fleet, and patterns of aircraft ownership, there are a number of key assumptions that will drive the forecasts.
The most significant of these is the future rate at which student pilots take up flying. This has a profound effect on the size of future pilot cohorts. While recent trends in the number of student pilot certificates issued can give an indication of the likely future rate of new pilot starts, these trends have changed over time and will most likely do so again. Thus establishing the assumptions for the future trend in new student pilot certificates issued involves a judgment about how many people will decide to take up flying in the future. This is likely to be influenced in part by the demand for airline and commercial pilots, as well as the general state of the economy and the cost of flying relative to other recreational pursuits or means of transportation.
A second set of key assumptions involves the rates at which pilots transition to higher levels of certificates, or become inactive, as well as the average number of hours that they fly each year at different stages of their life-cycle as a pilot. While data exists on the recent trends in these rates, there is an open question how long these trends will con-tinue or how they will change in the future. Therefore assumptions must be made about how these rates will change over the forecast period.
Because aircraft have quite long operational lives and the average utilization in flight hours per year is quite low for a large part of the fleet, the aircraft fleet can continue to grow for a time, even if the level of flying activity is reducing. However, eventually older
aircraft will be scrapped or sold outside the region and not replaced. Therefore assump-tions are needed on how the current trends in both aircraft attrition and new aircraft acquisition are likely to evolve in the future.
Since the level of activity by corporately-owned aircraft is driven by the transportation or operational needs of the aircraft owners or customers, rather than being determined by the size of the pilot population, assumptions are also needed on how the use of general aviation by businesses may change in the future. The introduction of fractional ownership has made the use of general aviation more affordable to a range of companies, which may eventually decide to acquire their own aircraft. Thus it will also be necessary to make assumptions about future trends in the use of general aviation by different types of businesses in response to changing economic conditions, including those that currently operate aircraft directly or use chartered aircraft as well as those that do not currently make use of general aviation.
These key assumptions will be documented and reviewed with the SCAG Aviation Technical Advisory Committee for suggested changes prior to being used to develop the Regional General Aviation Demand Forecast.
summary and implementation
The forecast approach adopted for this study is based on an analysis of the underlying factors that will influence the future levels of aircraft ownership and general aviation activity, including changes in the composition and activity of the pilot population, attrition of the current aircraft fleet based in the region and addition of new aircraft to the fleet, and the future level of general aviation activity by businesses and other organizations in the region. The planned approach considers the geographical distributions of aircraft owners and the factors that influence where those aircraft owners choose to base their aircraft. The approach is thus sensitive to a range of assumptions about how these fac-tors may change in the future and by varying these assumptions can generate alternative scenarios for the future size and composition of the general aviation fleet and activity in the region, and how that activity is likely to be distributed among the counties and airports in the region.
The analytical framework to support this forecasting approach will be implemented through a series of linked worksheets in a Microsoft Excel workbook. An input and control worksheet will provide a dashboard approach to varying the model assumptions and
Aviation and Airport Group Access 33
displaying a summary of the forecast results for the current scenario. Additional sheets will display more detailed results and provide a “drill-down” capability to examine the changes in forecast activity at a county and airport level. The various analytical mod-ules will be implemented in additional linked worksheets. While it is not anticipated that users will modify the way that the calculations are performed on these sheets, they will provide users with the ability to examine how the analytical modules function and review the intermediate calculations, thus providing a high level of transparency to the forecast process.
Federal Aviation Forecasts of General Aviation ActivityThe Federal Aviation Administration (FAA) prepares two annual forecasts that address future levels of general aviation (GA) activity: the FAA Aerospace Forecast, which provides projections of future GA activity at a national level, and the FAA Terminal Area Forecast, which provides projections of GA activity at the level of individual airports, from which projections of future GA activity in the Southern California region can be derived.
FAA national Aerospace ForecastThe FAA Aerospace Forecast is updated annually and provides projections for a wide range of aviation system metrics at a national level, for both commercial and general aviation. The most recent forecast (FAA, 2011a) provides projections to 2031, using a base year of 2010. The forecast includes the following metrics for the GA system:
� Active GA and air taxi aircraft by category of aircraft
� Active GA and air taxi hours flown by category of aircraft
� Active pilots by type of certificate
� GA aircraft fuel consumption by category of aircraft
� GA aircraft operations at FAA and contract control towers
� GA operations at Terminal Radar Approach Control (TRACON) facilities
� Instrument flight rules (IFR aircraft handles at FAA Air Route Traffic
ConTRol CEnTERs
The forecast report includes a brief discussion of recent trends in the GA sector, with particular reference to the effect of the most recent recession on shipments of new GA aircraft and the decade-long declining trend in GA aircraft operations at FAA and contract control towers. However, it noted that GA activity at TRACONs in fiscal year 2010 declined by less than the decline at the control towers, while GA aircraft handled at en route centers (Air Route Traffic Control Centers) rose by 3.4 percent. This appears to reflect the continuing growth in the number of higher-end GA aircraft (business jet aircraft), which tend to make much greater use of en route and terminal control facilities than smaller GA aircraft. Higher-end GA aircraft typically operate under an FAA flight plan, which requires then to be under the control of TRACONs and en route centers, while much of the smaller GA aircraft activity operates under visual flight rules (VFR), and only uses control tower facilities.
The forecast report mentions that the forecasts of GA activity are primarily based on information from the FAA General Aviation and Part 135 Activity Survey (FAA, 2011c), which has been significantly improved and expanded in recent years. The survey results are used as a baseline to which assumed growth rates are applied. There is no discussion in the report of the source or justification of these assumed growth rates. Although the survey results distinguish between activity by aircraft in GA and air taxi (Federal Aviation Regulations Part 135) operations, the forecast projections combine these categories for both active aircraft and hours flown by category of aircraft.
ouTlooK FoR GEnERAl AviATion ACTiviTy
The FAA projections show the recent decline in the number of active single-engine piston aircraft (the largest category of GA aircraft) continuing until about 2018, with a slow growth thereafter. This category of aircraft experienced an average annual decline of about 0.7 percent from 2000 to 2010. The projections indicate that the number of active aircraft will further decline by about 2 percent from 2010 to 2018 (an average annual rate of about 0.1 percent per year), with an average annual growth rate from 2018 to 2031 of about 0.6 percent per year. The combined effect results in a projected increase in the number of active aircraft in this category of about 6 percent from 2010 to 2031. Given the recent trend in the number of active aircraft in this category, this projection appears rather optimistic. The projection implies a net increase in the active U.S. single-engine
34 Aviation and Airport Ground Access
piston aircraft fleet over the 21-year period between 2010 and 2031 of about 8,000 aircraft. Given the average age of this segment of the U.S. GA aircraft fleet and the likely attrition rates over the next two decades, an increase of this size implies a significant increase in production over current levels. Over the past decade U.S. aircraft manufac-turers have produced about 12,300 single-engine piston aircraft, net of exports. During this period the active single-engine aircraft fleet declined by about 9,400 aircraft, giving an overall attrition (net of imports) of about 21,700 aircraft. Thus an increase of 8,000 aircraft over the next 20 years implies more than a doubling of production compared to the past decade.
The number of multi-engine piston aircraft is projected to continue its recent decline through 2031, as this category of aircraft is becoming superseded by turboprop and turbojet aircraft, with a further decline in active aircraft of about 17 percent from 2010 to 2031.
In contrast, the number of active turboprop and turbojet aircraft has been increas-ing at an average annual growth rate of about 5 percent per year from 2000 to 2010. This growth rate is projected to slow considerably to an average annual rate of about 3 percent per year from 2010 to 2020, increasing slightly thereafter to an average annual rate of 3.1 percent per year from 2020 to 2031. The number of active rotorcraft has also been increasing steadily in recent years, with piston-powered rotorcraft increasing at an average annual rate of 2.9 percent per year from 2000 to 2010 and turbine-powered rotorcraft increasing at a higher average annual rate of 4.0 percent per year over the same period. The growth rate for turbine-powered rotorcraft is projected to slow over the forecast period, to an annual average rate of about 2.4 percent per year, while that for piston-powered rotorcraft is projected to increase slightly over the period 2010 to 2020 and slow thereafter, giving an average annual growth rate from 2010 to 2031 of about the same as the past ten years.
The numbers of both experimental and sport aircraft are projected to continue their recent growth, with the number of active experimental aircraft increasing at an average growth rate of 1.4 percent per year between 2010 and 2031 and the number of active sport aircraft increasing at a higher average annual rate of about 3.3 percent per year.
The number of hours flown by single-engine piston aircraft are projected to decline more rapidly between 2010 and 2018 than the decline in the number active aircraft, at an average annual rate of 0.5 percent per year, and increase thereafter at a higher rate than
the number of active aircraft, at an average annual rate from 2018 to 2031 of 1.8 percent per year. The combined effect is to increase the number of hours flow by this category of aircraft between 2010 and 2031 by about 19 percent. The number of hours flown by tur-bojet aircraft and rotorcraft are projected to increase faster than the projected increase in active aircraft, implying an increase in aircraft utilization. Hours flown by turbojet aircraft are projected to almost triple from 2010 to 2031 (an increase of 195 percent), while hours flown by rotorcraft over the same period are projected to increase by about 85 percent.
The number of active student pilots are projected to decline by about percent from 2010 to 2016 before growing slowly to return to slightly above the 2010 level in 2031. The numbers of active private and commercial pilots are projected to follow a similar trend, with the number of private pilots ending up in 2031 about 6 percent above the 2010 level and the number of commercial pilots increasing by about 10 percent from 2010 to 20131. This of course implies that a higher proportion of student pilot progress to obtain private and commercial pilot certificates. The number of active airline transport pilots is projected to steadily increase from 2010 to 2031, ending up about 15 percent above the 2010 level by 2031. While most flying by airline transport pilots is not general aviation, training the increased numbers of airline pilots does involve general aviation, and of course some airline pilots do engage in general aviation flying as well as airline flying.
Although the number of active student, private, and commercial pilots are projected to decline from 2010 to 2016, this is not reflected in the projected numbers of hours flown by different categories of aircraft or the associated projects of GA aircraft operations handled by FAA and contract control towers, TRACONs, or en route centers, most of which increase steadily from 2010 (or 2011 in the case of the control towers). While the number of hours flown by single-engine piston aircraft is projected to decline by about 6 percent from 2010 to 2017, the number of active student pilots is projected to decline by about 8 percent over the same period, while the number of active private pilots is pro-jected to decline by about 7 percent. While these differences are not large, they imply a small increase in the average number of hours flown per pilot at a time when the number of active pilots is declining.
Aviation and Airport Group Access 35
FAA Terminal Area ForecastThe latest FAA Terminal Area Forecast (FAA, 2011b) provides projections at the airport level for the period from 2010 to 2030 using a base year of 2009 for the following general aviation metrics:
� Itinerant aircraft operations � Air taxi � General aviation � Military
� Local aircraft operations � Civil (general aviation) � Military
� Based aircraft: � Single-engine propeller fixed wing � Multi-engine propeller fixed wing � Jet fixed wing � Helicopters � Other
The category of air taxi operations is ambiguous, because in the case of commercial service airports it includes regional airport (also termed commuter airline) operations, as well as true air taxi (Part 135) operations.
The forecasts cover 42 of the 54 airports in the region that are currently available for public use, as well as Palmdale Regional Airport, which is currently operating as a military airfield and may only be used by civilian flights on a pre-arranged basis. The following airports are not included in the TAF data:
iMpERiAl CounTy
Cliff Hatfield Memorial Airport, Calipatria (CLR)
Holtville Airport (L04) (closed)
Salton Sea Airport, Salton City (SAS)
los AnGElEs CounTy
Agua Dulce Airpark (L70)
Catalina Airport, Avalon (AVX)
RivERsiDE CounTy
Bermuda Dunes Airport (UDD)
Chiriaco Summit Airport (L77)
Desert Center Airport, Palm Desert (CN64)
FlaBob Airport, Riverside (RIR)
Perris Valley Airport, Perris (L65)
sAn BERnARDino CounTy
Baker Airport (0O2)
Hesperia Airport (L26)
Roy Williams Airport, Joshua Tree (L80) (closed)
Yucca Valley Airport (L22)
vEnTuRA CounTy
Santa Paula Airport (SZP)
The forecast general aviation activity for each county and the region as a whole for 2010 and 2030 is shown in TABlE 3-1.
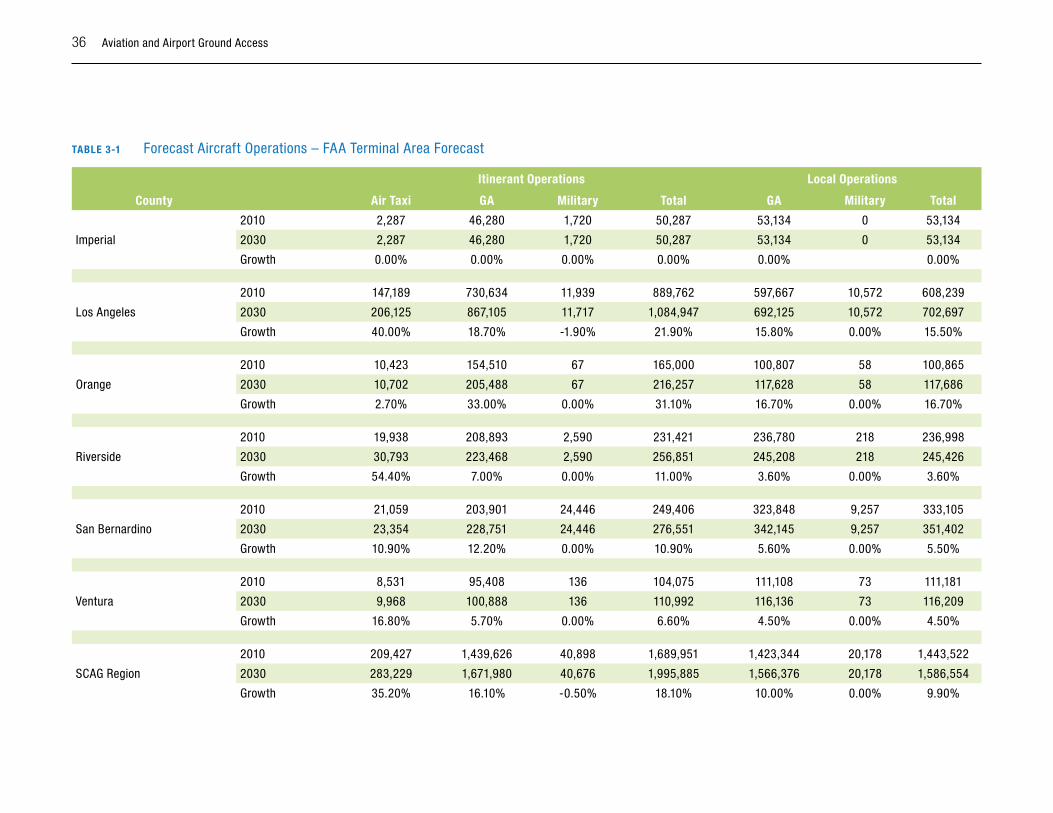
36 Aviation and Airport Ground Access
TABlE 3-1 Forecast Aircraft Operations – FAA Terminal Area Forecast
Itinerant Operations local Operations
County Air Taxi GA Military Total GA Military Total
Imperial
2010 2,287 46,280 1,720 50,287 53,134 0 53,134
2030 2,287 46,280 1,720 50,287 53,134 0 53,134
Growth 0.00% 0.00% 0.00% 0.00% 0.00% 0.00%
Los Angeles
2010 147,189 730,634 11,939 889,762 597,667 10,572 608,239
2030 206,125 867,105 11,717 1,084,947 692,125 10,572 702,697
Growth 40.00% 18.70% -1.90% 21.90% 15.80% 0.00% 15.50%
Orange
2010 10,423 154,510 67 165,000 100,807 58 100,865
2030 10,702 205,488 67 216,257 117,628 58 117,686
Growth 2.70% 33.00% 0.00% 31.10% 16.70% 0.00% 16.70%
Riverside
2010 19,938 208,893 2,590 231,421 236,780 218 236,998
2030 30,793 223,468 2,590 256,851 245,208 218 245,426
Growth 54.40% 7.00% 0.00% 11.00% 3.60% 0.00% 3.60%
San Bernardino
2010 21,059 203,901 24,446 249,406 323,848 9,257 333,105
2030 23,354 228,751 24,446 276,551 342,145 9,257 351,402
Growth 10.90% 12.20% 0.00% 10.90% 5.60% 0.00% 5.50%
Ventura
2010 8,531 95,408 136 104,075 111,108 73 111,181
2030 9,968 100,888 136 110,992 116,136 73 116,209
Growth 16.80% 5.70% 0.00% 6.60% 4.50% 0.00% 4.50%
SCAG Region
2010 209,427 1,439,626 40,898 1,689,951 1,423,344 20,178 1,443,522
2030 283,229 1,671,980 40,676 1,995,885 1,566,376 20,178 1,586,554
Growth 35.20% 16.10% -0.50% 18.10% 10.00% 0.00% 9.90%
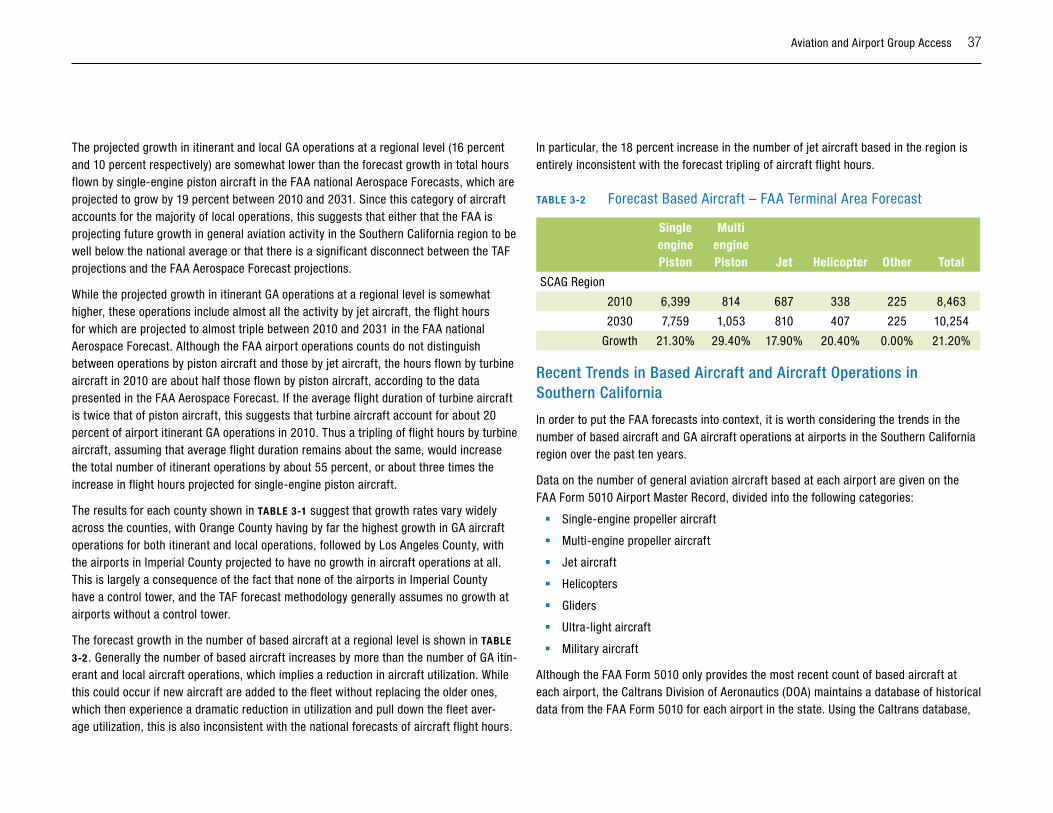
Aviation and Airport Group Access 37
The projected growth in itinerant and local GA operations at a regional level (16 percent and 10 percent respectively) are somewhat lower than the forecast growth in total hours flown by single-engine piston aircraft in the FAA national Aerospace Forecasts, which are projected to grow by 19 percent between 2010 and 2031. Since this category of aircraft accounts for the majority of local operations, this suggests that either that the FAA is projecting future growth in general aviation activity in the Southern California region to be well below the national average or that there is a significant disconnect between the TAF projections and the FAA Aerospace Forecast projections.
While the projected growth in itinerant GA operations at a regional level is somewhat higher, these operations include almost all the activity by jet aircraft, the flight hours for which are projected to almost triple between 2010 and 2031 in the FAA national Aerospace Forecast. Although the FAA airport operations counts do not distinguish between operations by piston aircraft and those by jet aircraft, the hours flown by turbine aircraft in 2010 are about half those flown by piston aircraft, according to the data presented in the FAA Aerospace Forecast. If the average flight duration of turbine aircraft is twice that of piston aircraft, this suggests that turbine aircraft account for about 20 percent of airport itinerant GA operations in 2010. Thus a tripling of flight hours by turbine aircraft, assuming that average flight duration remains about the same, would increase the total number of itinerant operations by about 55 percent, or about three times the increase in flight hours projected for single-engine piston aircraft.
The results for each county shown in TABlE 3-1 suggest that growth rates vary widely across the counties, with Orange County having by far the highest growth in GA aircraft operations for both itinerant and local operations, followed by Los Angeles County, with the airports in Imperial County projected to have no growth in aircraft operations at all. This is largely a consequence of the fact that none of the airports in Imperial County have a control tower, and the TAF forecast methodology generally assumes no growth at airports without a control tower.
The forecast growth in the number of based aircraft at a regional level is shown in TABlE
3-2 . Generally the number of based aircraft increases by more than the number of GA itin-erant and local aircraft operations, which implies a reduction in aircraft utilization. While this could occur if new aircraft are added to the fleet without replacing the older ones, which then experience a dramatic reduction in utilization and pull down the fleet aver-age utilization, this is also inconsistent with the national forecasts of aircraft flight hours.
In particular, the 18 percent increase in the number of jet aircraft based in the region is entirely inconsistent with the forecast tripling of aircraft flight hours.
TABlE 3-2 Forecast Based Aircraft – FAA Terminal Area Forecast
Single engine Piston
Multi engine Piston Jet Helicopter Other Total
SCAG Region
2010 6,399 814 687 338 225 8,463
2030 7,759 1,053 810 407 225 10,254
Growth 21.30% 29.40% 17.90% 20.40% 0.00% 21.20%
Recent Trends in Based Aircraft and Aircraft operations in southern California
In order to put the FAA forecasts into context, it is worth considering the trends in the number of based aircraft and GA aircraft operations at airports in the Southern California region over the past ten years.
Data on the number of general aviation aircraft based at each airport are given on the FAA Form 5010 Airport Master Record, divided into the following categories:
� Single-engine propeller aircraft
� Multi-engine propeller aircraft
� Jet aircraft
� Helicopters
� Gliders
� Ultra-light aircraft
� Military aircraft
Although the FAA Form 5010 only provides the most recent count of based aircraft at each airport, the Caltrans Division of Aeronautics (DOA) maintains a database of historical data from the FAA Form 5010 for each airport in the state. Using the Caltrans database,
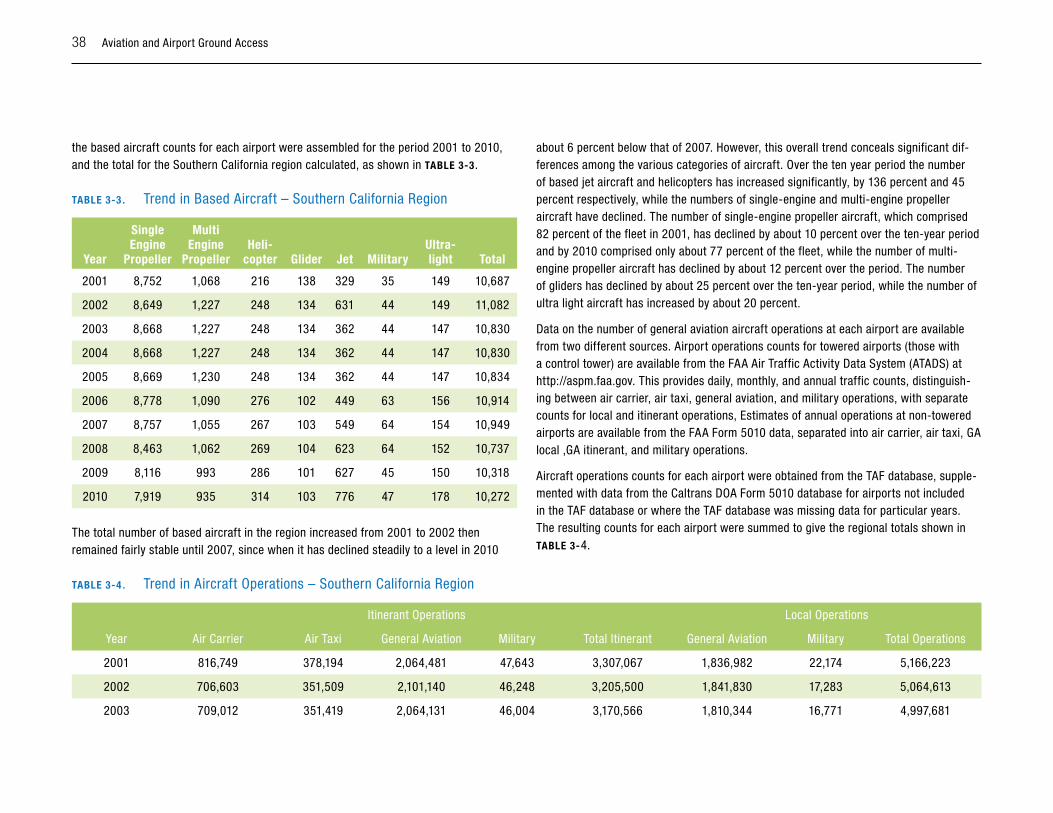
38 Aviation and Airport Ground Access
the based aircraft counts for each airport were assembled for the period 2001 to 2010, and the total for the Southern California region calculated, as shown in TABlE 3-3.
TABlE 3-3. Trend in Based Aircraft – Southern California Region
Year
Single Engine
Propeller
Multi Engine
PropellerHeli-
copter Glider Jet Militaryultra-light Total
2001 8,752 1,068 216 138 329 35 149 10,687
2002 8,649 1,227 248 134 631 44 149 11,082
2003 8,668 1,227 248 134 362 44 147 10,830
2004 8,668 1,227 248 134 362 44 147 10,830
2005 8,669 1,230 248 134 362 44 147 10,834
2006 8,778 1,090 276 102 449 63 156 10,914
2007 8,757 1,055 267 103 549 64 154 10,949
2008 8,463 1,062 269 104 623 64 152 10,737
2009 8,116 993 286 101 627 45 150 10,318
2010 7,919 935 314 103 776 47 178 10,272
The total number of based aircraft in the region increased from 2001 to 2002 then remained fairly stable until 2007, since when it has declined steadily to a level in 2010
about 6 percent below that of 2007. However, this overall trend conceals significant dif-ferences among the various categories of aircraft. Over the ten year period the number of based jet aircraft and helicopters has increased significantly, by 136 percent and 45 percent respectively, while the numbers of single-engine and multi-engine propeller aircraft have declined. The number of single-engine propeller aircraft, which comprised 82 percent of the fleet in 2001, has declined by about 10 percent over the ten-year period and by 2010 comprised only about 77 percent of the fleet, while the number of multi-engine propeller aircraft has declined by about 12 percent over the period. The number of gliders has declined by about 25 percent over the ten-year period, while the number of ultra light aircraft has increased by about 20 percent.
Data on the number of general aviation aircraft operations at each airport are available from two different sources. Airport operations counts for towered airports (those with a control tower) are available from the FAA Air Traffic Activity Data System (ATADS) at http://aspm.faa.gov. This provides daily, monthly, and annual traffic counts, distinguish-ing between air carrier, air taxi, general aviation, and military operations, with separate counts for local and itinerant operations, Estimates of annual operations at non-towered airports are available from the FAA Form 5010 data, separated into air carrier, air taxi, GA local ,GA itinerant, and military operations.
Aircraft operations counts for each airport were obtained from the TAF database, supple-mented with data from the Caltrans DOA Form 5010 database for airports not included in the TAF database or where the TAF database was missing data for particular years. The resulting counts for each airport were summed to give the regional totals shown in TABlE 3-4.
TABlE 3-4. Trend in Aircraft Operations – Southern California Region
Itinerant Operations Local Operations
Year Air Carrier Air Taxi General Aviation Military Total Itinerant General Aviation Military Total Operations
2001 816,749 378,194 2,064,481 47,643 3,307,067 1,836,982 22,174 5,166,223
2002 706,603 351,509 2,101,140 46,248 3,205,500 1,841,830 17,283 5,064,613
2003 709,012 351,419 2,064,131 46,004 3,170,566 1,810,344 16,771 4,997,681
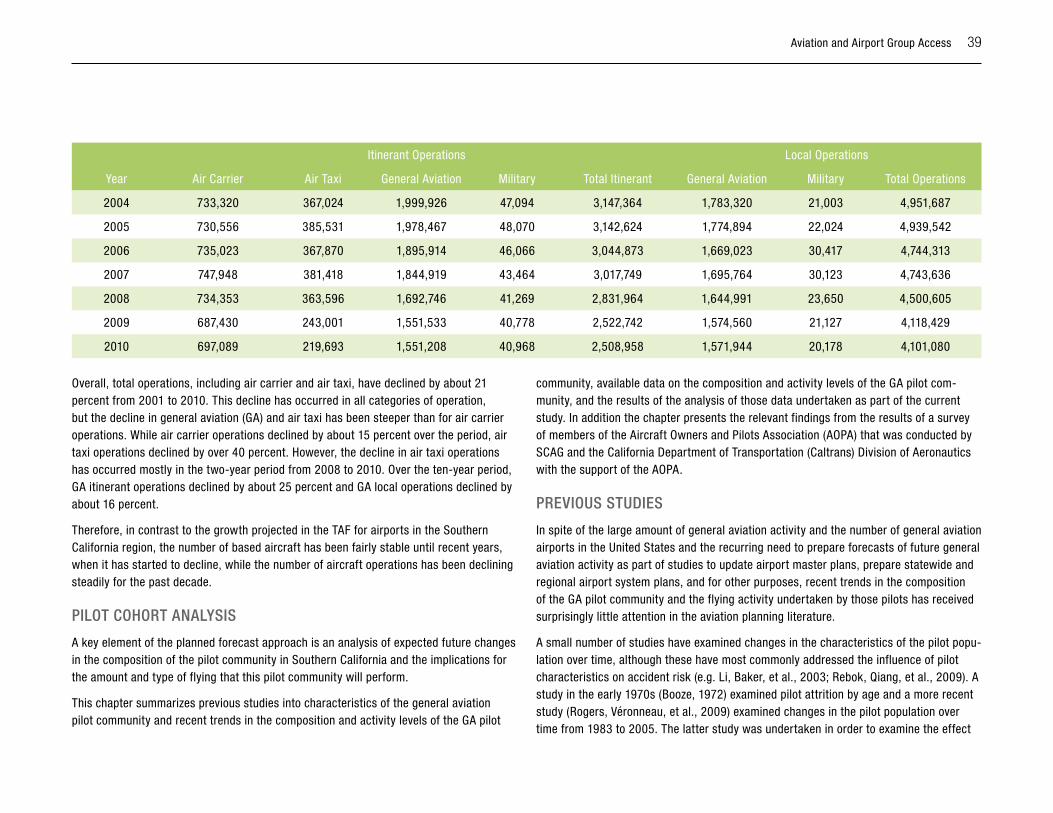
Aviation and Airport Group Access 39
Itinerant Operations Local Operations
Year Air Carrier Air Taxi General Aviation Military Total Itinerant General Aviation Military Total Operations
2004 733,320 367,024 1,999,926 47,094 3,147,364 1,783,320 21,003 4,951,687
2005 730,556 385,531 1,978,467 48,070 3,142,624 1,774,894 22,024 4,939,542
2006 735,023 367,870 1,895,914 46,066 3,044,873 1,669,023 30,417 4,744,313
2007 747,948 381,418 1,844,919 43,464 3,017,749 1,695,764 30,123 4,743,636
2008 734,353 363,596 1,692,746 41,269 2,831,964 1,644,991 23,650 4,500,605
2009 687,430 243,001 1,551,533 40,778 2,522,742 1,574,560 21,127 4,118,429
2010 697,089 219,693 1,551,208 40,968 2,508,958 1,571,944 20,178 4,101,080
Overall, total operations, including air carrier and air taxi, have declined by about 21 percent from 2001 to 2010. This decline has occurred in all categories of operation, but the decline in general aviation (GA) and air taxi has been steeper than for air carrier operations. While air carrier operations declined by about 15 percent over the period, air taxi operations declined by over 40 percent. However, the decline in air taxi operations has occurred mostly in the two-year period from 2008 to 2010. Over the ten-year period, GA itinerant operations declined by about 25 percent and GA local operations declined by about 16 percent.
Therefore, in contrast to the growth projected in the TAF for airports in the Southern California region, the number of based aircraft has been fairly stable until recent years, when it has started to decline, while the number of aircraft operations has been declining steadily for the past decade.
piloT CohoRT AnAlysis
A key element of the planned forecast approach is an analysis of expected future changes in the composition of the pilot community in Southern California and the implications for the amount and type of flying that this pilot community will perform.
This chapter summarizes previous studies into characteristics of the general aviation pilot community and recent trends in the composition and activity levels of the GA pilot
community, available data on the composition and activity levels of the GA pilot com-munity, and the results of the analysis of those data undertaken as part of the current study. In addition the chapter presents the relevant findings from the results of a survey of members of the Aircraft Owners and Pilots Association (AOPA) that was conducted by SCAG and the California Department of Transportation (Caltrans) Division of Aeronautics with the support of the AOPA.
pREvious sTuDiEs
In spite of the large amount of general aviation activity and the number of general aviation airports in the United States and the recurring need to prepare forecasts of future general aviation activity as part of studies to update airport master plans, prepare statewide and regional airport system plans, and for other purposes, recent trends in the composition of the GA pilot community and the flying activity undertaken by those pilots has received surprisingly little attention in the aviation planning literature.
A small number of studies have examined changes in the characteristics of the pilot popu-lation over time, although these have most commonly addressed the influence of pilot characteristics on accident risk (e.g. Li, Baker, et al., 2003; Rebok, Qiang, et al., 2009). A study in the early 1970s (Booze, 1972) examined pilot attrition by age and a more recent study (Rogers, Véronneau, et al., 2009) examined changes in the pilot population over time from 1983 to 2005. The latter study was undertaken in order to examine the effect
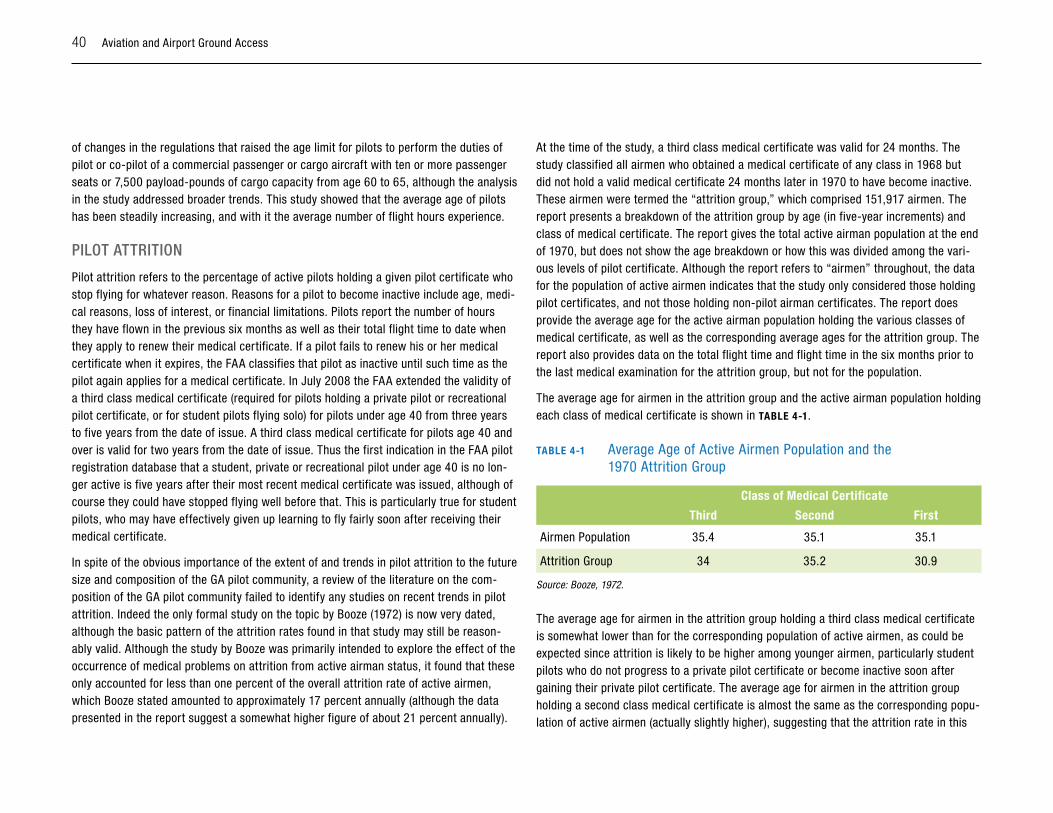
40 Aviation and Airport Ground Access
of changes in the regulations that raised the age limit for pilots to perform the duties of pilot or co-pilot of a commercial passenger or cargo aircraft with ten or more passenger seats or 7,500 payload-pounds of cargo capacity from age 60 to 65, although the analysis in the study addressed broader trends. This study showed that the average age of pilots has been steadily increasing, and with it the average number of flight hours experience.
piloT ATTRiTion
Pilot attrition refers to the percentage of active pilots holding a given pilot certificate who stop flying for whatever reason. Reasons for a pilot to become inactive include age, medi-cal reasons, loss of interest, or financial limitations. Pilots report the number of hours they have flown in the previous six months as well as their total flight time to date when they apply to renew their medical certificate. If a pilot fails to renew his or her medical certificate when it expires, the FAA classifies that pilot as inactive until such time as the pilot again applies for a medical certificate. In July 2008 the FAA extended the validity of a third class medical certificate (required for pilots holding a private pilot or recreational pilot certificate, or for student pilots flying solo) for pilots under age 40 from three years to five years from the date of issue. A third class medical certificate for pilots age 40 and over is valid for two years from the date of issue. Thus the first indication in the FAA pilot registration database that a student, private or recreational pilot under age 40 is no lon-ger active is five years after their most recent medical certificate was issued, although of course they could have stopped flying well before that. This is particularly true for student pilots, who may have effectively given up learning to fly fairly soon after receiving their medical certificate.
In spite of the obvious importance of the extent of and trends in pilot attrition to the future size and composition of the GA pilot community, a review of the literature on the com-position of the GA pilot community failed to identify any studies on recent trends in pilot attrition. Indeed the only formal study on the topic by Booze (1972) is now very dated, although the basic pattern of the attrition rates found in that study may still be reason-ably valid. Although the study by Booze was primarily intended to explore the effect of the occurrence of medical problems on attrition from active airman status, it found that these only accounted for less than one percent of the overall attrition rate of active airmen, which Booze stated amounted to approximately 17 percent annually (although the data presented in the report suggest a somewhat higher figure of about 21 percent annually).
At the time of the study, a third class medical certificate was valid for 24 months. The study classified all airmen who obtained a medical certificate of any class in 1968 but did not hold a valid medical certificate 24 months later in 1970 to have become inactive. These airmen were termed the “attrition group,” which comprised 151,917 airmen. The report presents a breakdown of the attrition group by age (in five-year increments) and class of medical certificate. The report gives the total active airman population at the end of 1970, but does not show the age breakdown or how this was divided among the vari-ous levels of pilot certificate. Although the report refers to “airmen” throughout, the data for the population of active airmen indicates that the study only considered those holding pilot certificates, and not those holding non-pilot airman certificates. The report does provide the average age for the active airman population holding the various classes of medical certificate, as well as the corresponding average ages for the attrition group. The report also provides data on the total flight time and flight time in the six months prior to the last medical examination for the attrition group, but not for the population.
The average age for airmen in the attrition group and the active airman population holding each class of medical certificate is shown in TABlE 4-1.
TABlE 4-1 Average Age of Active Airmen Population and the 1970 Attrition Group
Class of Medical Certificate
Third Second First
Airmen Population 35.4 35.1 35.1
Attrition Group 34 35.2 30.9
Source: Booze, 1972.
The average age for airmen in the attrition group holding a third class medical certificate is somewhat lower than for the corresponding population of active airmen, as could be expected since attrition is likely to be higher among younger airmen, particularly student pilots who do not progress to a private pilot certificate or become inactive soon after gaining their private pilot certificate. The average age for airmen in the attrition group holding a second class medical certificate is almost the same as the corresponding popu-lation of active airmen (actually slightly higher), suggesting that the attrition rate in this
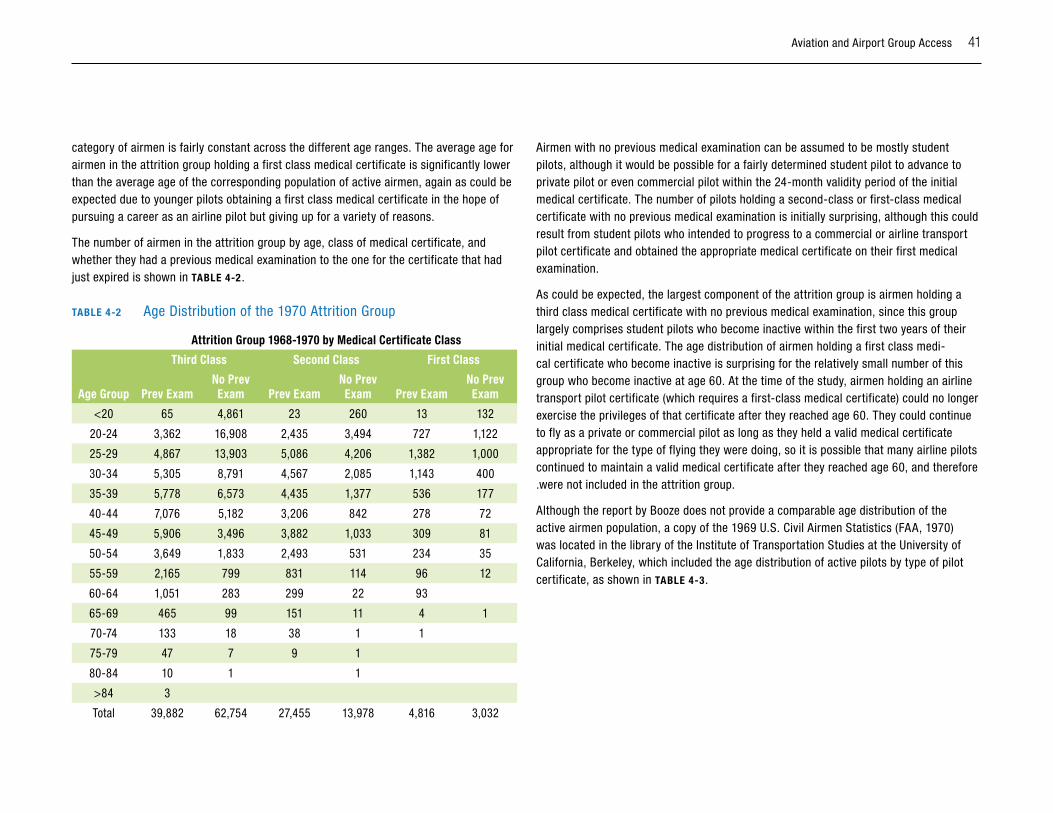
Aviation and Airport Group Access 41
category of airmen is fairly constant across the different age ranges. The average age for airmen in the attrition group holding a first class medical certificate is significantly lower than the average age of the corresponding population of active airmen, again as could be expected due to younger pilots obtaining a first class medical certificate in the hope of pursuing a career as an airline pilot but giving up for a variety of reasons.
The number of airmen in the attrition group by age, class of medical certificate, and whether they had a previous medical examination to the one for the certificate that had just expired is shown in TABlE 4-2 .
TABlE 4-2 Age Distribution of the 1970 Attrition Group
Attrition Group 1968-1970 by Medical Certificate Class
Third Class Second Class First Class
Age Group Prev ExamNo Prev Exam Prev Exam
No Prev Exam Prev Exam
No Prev Exam
<20 65 4,861 23 260 13 132
20-24 3,362 16,908 2,435 3,494 727 1,122
25-29 4,867 13,903 5,086 4,206 1,382 1,000
30-34 5,305 8,791 4,567 2,085 1,143 400
35-39 5,778 6,573 4,435 1,377 536 177
40-44 7,076 5,182 3,206 842 278 72
45-49 5,906 3,496 3,882 1,033 309 81
50-54 3,649 1,833 2,493 531 234 35
55-59 2,165 799 831 114 96 12
60-64 1,051 283 299 22 93
65-69 465 99 151 11 4 1
70-74 133 18 38 1 1
75-79 47 7 9 1
80-84 10 1 1
>84 3
Total 39,882 62,754 27,455 13,978 4,816 3,032
Airmen with no previous medical examination can be assumed to be mostly student pilots, although it would be possible for a fairly determined student pilot to advance to private pilot or even commercial pilot within the 24-month validity period of the initial medical certificate. The number of pilots holding a second-class or first-class medical certificate with no previous medical examination is initially surprising, although this could result from student pilots who intended to progress to a commercial or airline transport pilot certificate and obtained the appropriate medical certificate on their first medical examination.
As could be expected, the largest component of the attrition group is airmen holding a third class medical certificate with no previous medical examination, since this group largely comprises student pilots who become inactive within the first two years of their initial medical certificate. The age distribution of airmen holding a first class medi-cal certificate who become inactive is surprising for the relatively small number of this group who become inactive at age 60. At the time of the study, airmen holding an airline transport pilot certificate (which requires a first-class medical certificate) could no longer exercise the privileges of that certificate after they reached age 60. They could continue to fly as a private or commercial pilot as long as they held a valid medical certificate appropriate for the type of flying they were doing, so it is possible that many airline pilots continued to maintain a valid medical certificate after they reached age 60, and therefore .were not included in the attrition group.
Although the report by Booze does not provide a comparable age distribution of the active airmen population, a copy of the 1969 U.S. Civil Airmen Statistics (FAA, 1970) was located in the library of the Institute of Transportation Studies at the University of California, Berkeley, which included the age distribution of active pilots by type of pilot certificate, as shown in TABlE 4-3.
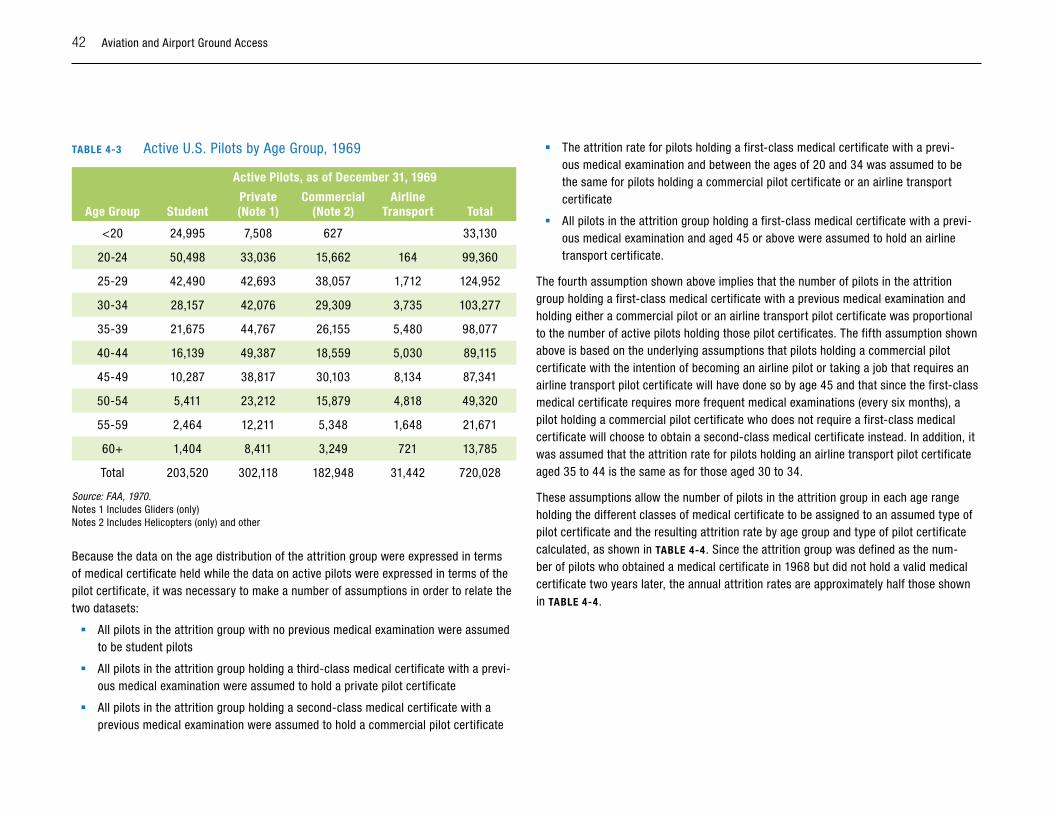
42 Aviation and Airport Ground Access
TABlE 4-3 Active U.S. Pilots by Age Group, 1969
Active Pilots, as of December 31, 1969
Age Group StudentPrivate (Note 1)
Commercial (Note 2)
Airline Transport Total
<20 24,995 7,508 627 33,130
20-24 50,498 33,036 15,662 164 99,360
25-29 42,490 42,693 38,057 1,712 124,952
30-34 28,157 42,076 29,309 3,735 103,277
35-39 21,675 44,767 26,155 5,480 98,077
40-44 16,139 49,387 18,559 5,030 89,115
45-49 10,287 38,817 30,103 8,134 87,341
50-54 5,411 23,212 15,879 4,818 49,320
55-59 2,464 12,211 5,348 1,648 21,671
60+ 1,404 8,411 3,249 721 13,785
Total 203,520 302,118 182,948 31,442 720,028
Source: FAA, 1970.Notes 1 Includes Gliders (only) Notes 2 Includes Helicopters (only) and other
Because the data on the age distribution of the attrition group were expressed in terms of medical certificate held while the data on active pilots were expressed in terms of the pilot certificate, it was necessary to make a number of assumptions in order to relate the two datasets:
� All pilots in the attrition group with no previous medical examination were assumed to be student pilots
� All pilots in the attrition group holding a third-class medical certificate with a previ-ous medical examination were assumed to hold a private pilot certificate
� All pilots in the attrition group holding a second-class medical certificate with a previous medical examination were assumed to hold a commercial pilot certificate
� The attrition rate for pilots holding a first-class medical certificate with a previ-ous medical examination and between the ages of 20 and 34 was assumed to be the same for pilots holding a commercial pilot certificate or an airline transport certificate
� All pilots in the attrition group holding a first-class medical certificate with a previ-ous medical examination and aged 45 or above were assumed to hold an airline transport certificate.
The fourth assumption shown above implies that the number of pilots in the attrition group holding a first-class medical certificate with a previous medical examination and holding either a commercial pilot or an airline transport pilot certificate was proportional to the number of active pilots holding those pilot certificates. The fifth assumption shown above is based on the underlying assumptions that pilots holding a commercial pilot certificate with the intention of becoming an airline pilot or taking a job that requires an airline transport pilot certificate will have done so by age 45 and that since the first-class medical certificate requires more frequent medical examinations (every six months), a pilot holding a commercial pilot certificate who does not require a first-class medical certificate will choose to obtain a second-class medical certificate instead. In addition, it was assumed that the attrition rate for pilots holding an airline transport pilot certificate aged 35 to 44 is the same as for those aged 30 to 34.
These assumptions allow the number of pilots in the attrition group in each age range holding the different classes of medical certificate to be assigned to an assumed type of pilot certificate and the resulting attrition rate by age group and type of pilot certificate calculated, as shown in TABlE 4-4. Since the attrition group was defined as the num-ber of pilots who obtained a medical certificate in 1968 but did not hold a valid medical certificate two years later, the annual attrition rates are approximately half those shown in TABlE 4-4.
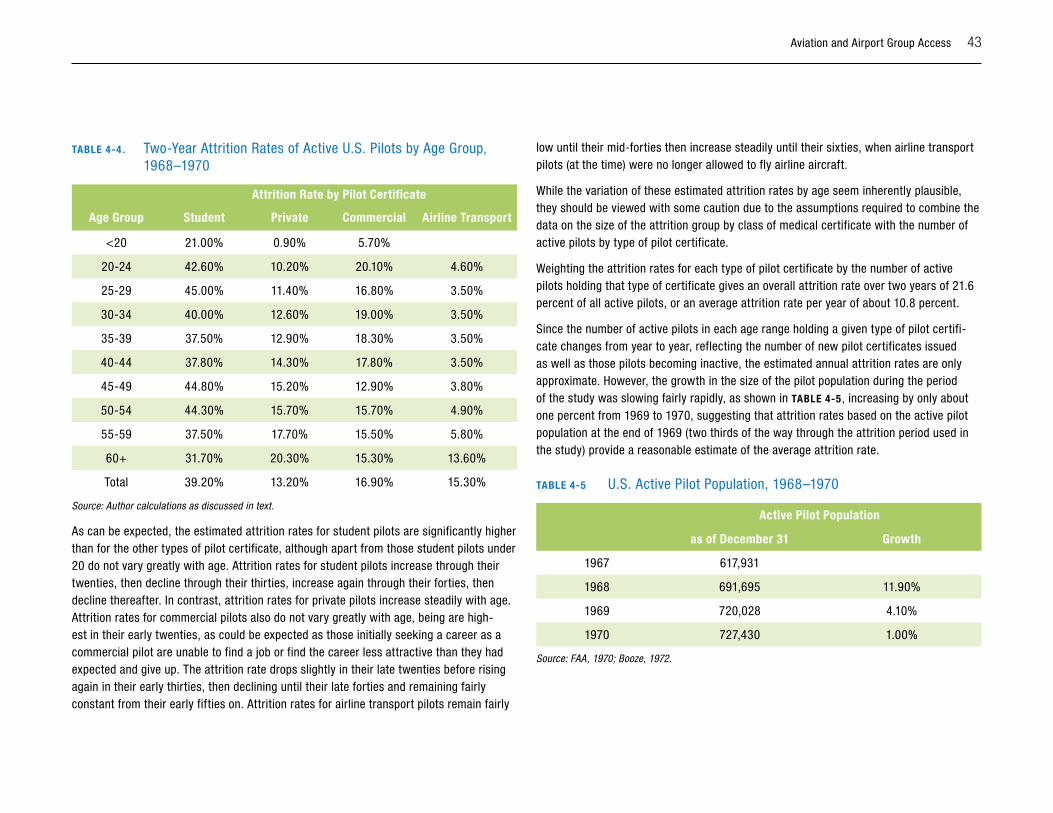
Aviation and Airport Group Access 43
TABlE 4-4. Two-Year Attrition Rates of Active U.S. Pilots by Age Group, 1968–1970
Attrition Rate by Pilot Certificate
Age Group Student Private Commercial Airline Transport
<20 21.00% 0.90% 5.70%
20-24 42.60% 10.20% 20.10% 4.60%
25-29 45.00% 11.40% 16.80% 3.50%
30-34 40.00% 12.60% 19.00% 3.50%
35-39 37.50% 12.90% 18.30% 3.50%
40-44 37.80% 14.30% 17.80% 3.50%
45-49 44.80% 15.20% 12.90% 3.80%
50-54 44.30% 15.70% 15.70% 4.90%
55-59 37.50% 17.70% 15.50% 5.80%
60+ 31.70% 20.30% 15.30% 13.60%
Total 39.20% 13.20% 16.90% 15.30%
Source: Author calculations as discussed in text.
As can be expected, the estimated attrition rates for student pilots are significantly higher than for the other types of pilot certificate, although apart from those student pilots under 20 do not vary greatly with age. Attrition rates for student pilots increase through their twenties, then decline through their thirties, increase again through their forties, then decline thereafter. In contrast, attrition rates for private pilots increase steadily with age. Attrition rates for commercial pilots also do not vary greatly with age, being are high-est in their early twenties, as could be expected as those initially seeking a career as a commercial pilot are unable to find a job or find the career less attractive than they had expected and give up. The attrition rate drops slightly in their late twenties before rising again in their early thirties, then declining until their late forties and remaining fairly constant from their early fifties on. Attrition rates for airline transport pilots remain fairly
low until their mid-forties then increase steadily until their sixties, when airline transport pilots (at the time) were no longer allowed to fly airline aircraft.
While the variation of these estimated attrition rates by age seem inherently plausible, they should be viewed with some caution due to the assumptions required to combine the data on the size of the attrition group by class of medical certificate with the number of active pilots by type of pilot certificate.
Weighting the attrition rates for each type of pilot certificate by the number of active pilots holding that type of certificate gives an overall attrition rate over two years of 21.6 percent of all active pilots, or an average attrition rate per year of about 10.8 percent.
Since the number of active pilots in each age range holding a given type of pilot certifi-cate changes from year to year, reflecting the number of new pilot certificates issued as well as those pilots becoming inactive, the estimated annual attrition rates are only approximate. However, the growth in the size of the pilot population during the period of the study was slowing fairly rapidly, as shown in TABlE 4-5, increasing by only about one percent from 1969 to 1970, suggesting that attrition rates based on the active pilot population at the end of 1969 (two thirds of the way through the attrition period used in the study) provide a reasonable estimate of the average attrition rate.
TABlE 4-5 U.S. Active Pilot Population, 1968–1970
Active Pilot Population
as of December 31 Growth
1967 617,931
1968 691,695 11.90%
1969 720,028 4.10%
1970 727,430 1.00%
Source: FAA, 1970; Booze, 1972.
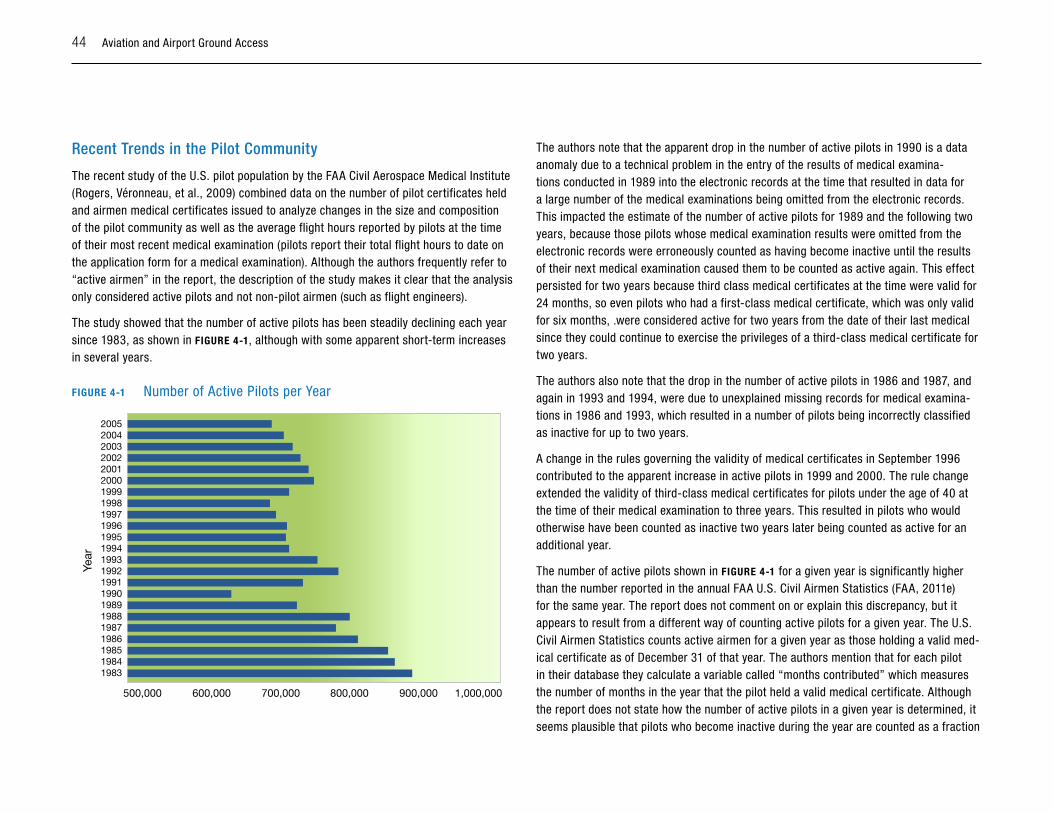
44 Aviation and Airport Ground Access
Recent Trends in the pilot Community
The recent study of the U.S. pilot population by the FAA Civil Aerospace Medical Institute (Rogers, Véronneau, et al., 2009) combined data on the number of pilot certificates held and airmen medical certificates issued to analyze changes in the size and composition of the pilot community as well as the average flight hours reported by pilots at the time of their most recent medical examination (pilots report their total flight hours to date on the application form for a medical examination). Although the authors frequently refer to “active airmen” in the report, the description of the study makes it clear that the analysis only considered active pilots and not non-pilot airmen (such as flight engineers).
The study showed that the number of active pilots has been steadily declining each year since 1983, as shown in FIGuRE 4-1, although with some apparent short-term increases in several years.
FIGuRE 4-1 Number of Active Pilots per Year
500,000 600,000
Year
700,000 800,000 900,000 1,000,000
1999
20012000
20032002
20042005
19961995199419931992199119901989198819871986198519841983
19971998
The authors note that the apparent drop in the number of active pilots in 1990 is a data anomaly due to a technical problem in the entry of the results of medical examina-tions conducted in 1989 into the electronic records at the time that resulted in data for a large number of the medical examinations being omitted from the electronic records. This impacted the estimate of the number of active pilots for 1989 and the following two years, because those pilots whose medical examination results were omitted from the electronic records were erroneously counted as having become inactive until the results of their next medical examination caused them to be counted as active again. This effect persisted for two years because third class medical certificates at the time were valid for 24 months, so even pilots who had a first-class medical certificate, which was only valid for six months, .were considered active for two years from the date of their last medical since they could continue to exercise the privileges of a third-class medical certificate for two years.
The authors also note that the drop in the number of active pilots in 1986 and 1987, and again in 1993 and 1994, were due to unexplained missing records for medical examina-tions in 1986 and 1993, which resulted in a number of pilots being incorrectly classified as inactive for up to two years.
A change in the rules governing the validity of medical certificates in September 1996 contributed to the apparent increase in active pilots in 1999 and 2000. The rule change extended the validity of third-class medical certificates for pilots under the age of 40 at the time of their medical examination to three years. This resulted in pilots who would otherwise have been counted as inactive two years later being counted as active for an additional year.
The number of active pilots shown in FIGuRE 4-1 for a given year is significantly higher than the number reported in the annual FAA U.S. Civil Airmen Statistics (FAA, 2011e) for the same year. The report does not comment on or explain this discrepancy, but it appears to result from a different way of counting active pilots for a given year. The U.S. Civil Airmen Statistics counts active airmen for a given year as those holding a valid med-ical certificate as of December 31 of that year. The authors mention that for each pilot in their database they calculate a variable called “months contributed” which measures the number of months in the year that the pilot held a valid medical certificate. Although the report does not state how the number of active pilots in a given year is determined, it seems plausible that pilots who become inactive during the year are counted as a fraction
Aviation and Airport Group Access 45
of an active pilot based on the number of months they were considered active (since otherwise there would be no reason to calculate the variable “months contributed”). This would give a higher total of active pilots for a given year than the U.S. Civil Airmen Statistics, since pilots becoming inactive during the year are not counted in the total for that year using the approach adopted in the U.S. Civil Airmen Statistics.
Assuming this to be the case, this has an interesting side effect that the difference between the number of active pilots for a given year given in the report and that given in the U.S. Civil Airmen Statistics provides a direct measure of the attrition rate for that year. Unfortunately, since the more detailed data on active pilots in the report are presented in terms of the class of medical certificate held, while the data in the U.S. Civil Airmen Statistics are presented in terms of the type of pilot certificate held, estimating differences in attrition rate by type of pilot certificate, which as suggested by the earlier study by Booze (1972) are likely to be significant, would require assumptions about the proportion of active pilots holding a given class of medical certificate who also hold a given type of pilot certificate. Furthermore, the authors only present the results of their analysis graphically in the report, and do not provide the underlying numerical data, so it is necessary to measure the values from the figures, which introduces some inaccuracy in any analysis.
Even so, the resulting estimates of the overall attrition rate of active pilots shown in TABlE 4-6 provide a useful check on the earlier estimates by Booze (1972), as well as providing an indication of the extent to which attrition rates appear to been changing over time.
The calculated attrition rates vary from 9 percent per year to about 21 percent per year, and appear to have been declining from 2001 to 2005, the last year of data in the study. No attrition rate could be calculated for 1990 due to the data anomaly in 1990 discussed above, and the attrition rates for 1989 and 1991 appear to be unreasonably low, possibly for reasons related to the 1990 data anomaly. Excluding these three years, the aver-age attrition rate for the period from 1998 to 2005 is 14.5 percent per year. This rate is somewhat higher than the average annual attrition rate across all active pilots of 10.8 percent found by Booze (1972), but not greatly so and the average value found by Booze lies within the range of values estimated from the data in the study.
Based on the total number of active pilots in each year, the authors developed a regres-sion model of the total number of active pilots in each year that includes a dummy
variable to account for the change in duration of the validity of third-class medical certificates in 1996, but otherwise assumes a linear decline in the total number of active pilots over time. The dummy variable was applied to years from 1999 on, assuming that the effect of the rule change did not appear in the estimated number of active pilots until 1999.
This gave the following regression equation:
P = 25,136,097 – 12,238.38 x Y + 85,691 x D
where P = the total number of active pilots in a year
Y = the year
D = a dummy variable set to 1 for years from 1999 on, 0 otherwise
This model suggests that if the trend over the period from 1983 to 2005 continues, the total number of active pilots will decline by about 12,200 per year. This would give an estimated number of active pilots in 2010 of 622,646. In fact the number of active pilots at the end of 2010 according to the U.S. Civil Airmen Statistics was 627,588. However, the regression model is based on the definition of active pilots used in the study, which gives a higher estimate of active pilots from the U.S. Civil Airmen Statistics by about 15 percent, for the reasons discussed above, as shown in TABlE 4-6. In addition, a further change in the rules governing the duration of the validity of medical certificates in July 2008 increased the duration of the validity of third-class medical certificates for pilots under age 40 to five years, which would have the effect of increasing the number of pilots considered to be active. From 2009 to 2010 the number of active student pilots reported in U.S. Civil Airmen Statistics increased by about 47,000 (or about 7 percent of all active pilots in 2010) at a time when the number of active pilots holding most other categories of pilot certificates declined. The combined effect of these two factors suggests that the decline in the number of active pilots since 2005 has been somewhat slower than predicted by the regression model.
In addition to the total number of active pilots, the report provides a breakdown of the number of active pilots by the class of the medical certificate held at the end of each year, as well as by gender, as shown in FIGuRE 4-2 . As expected, the data is dominated by the number of pilots holding a third-class medical certificate (student and private pilots). The decline in the number of active pilots over time occurred for pilots holding a second-class
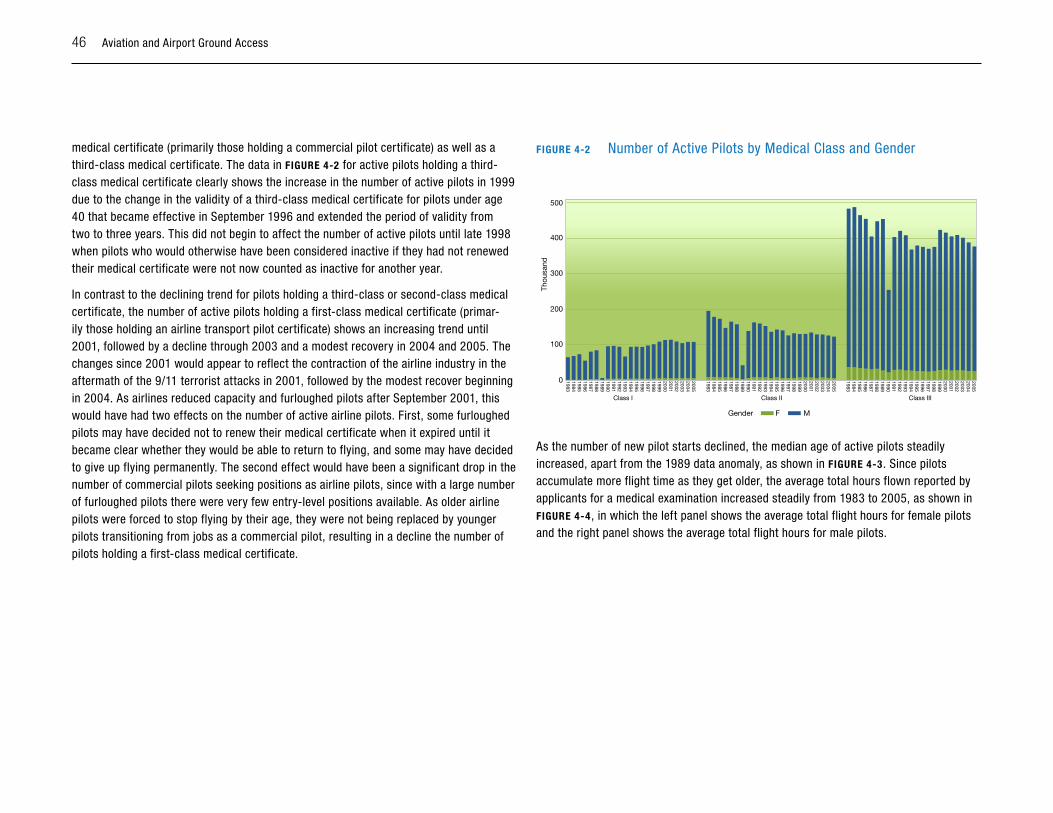
46 Aviation and Airport Ground Access
medical certificate (primarily those holding a commercial pilot certificate) as well as a third-class medical certificate. The data in FIGuRE 4-2 for active pilots holding a third-class medical certificate clearly shows the increase in the number of active pilots in 1999 due to the change in the validity of a third-class medical certificate for pilots under age 40 that became effective in September 1996 and extended the period of validity from two to three years. This did not begin to affect the number of active pilots until late 1998 when pilots who would otherwise have been considered inactive if they had not renewed their medical certificate were not now counted as inactive for another year.
In contrast to the declining trend for pilots holding a third-class or second-class medical certificate, the number of active pilots holding a first-class medical certificate (primar-ily those holding an airline transport pilot certificate) shows an increasing trend until 2001, followed by a decline through 2003 and a modest recovery in 2004 and 2005. The changes since 2001 would appear to reflect the contraction of the airline industry in the aftermath of the 9/11 terrorist attacks in 2001, followed by the modest recover beginning in 2004. As airlines reduced capacity and furloughed pilots after September 2001, this would have had two effects on the number of active airline pilots. First, some furloughed pilots may have decided not to renew their medical certificate when it expired until it became clear whether they would be able to return to flying, and some may have decided to give up flying permanently. The second effect would have been a significant drop in the number of commercial pilots seeking positions as airline pilots, since with a large number of furloughed pilots there were very few entry-level positions available. As older airline pilots were forced to stop flying by their age, they were not being replaced by younger pilots transitioning from jobs as a commercial pilot, resulting in a decline the number of pilots holding a first-class medical certificate.
FIGuRE 4-2 Number of Active Pilots by Medical Class and Gender
500
400
300
200
100
0
Thou
sand
Gender
Class I Class II Class III
F M
1999
20012000
20032002
20042005
19961995199419931992199119901989198819871986198519841983
19971998
1999
20012000
20032002
20042005
19961995199419931992199119901989198819871986198519841983
19971998
1999
20012000
20032002
20042005
19961995199419931992199119901989198819871986198519841983
19971998
As the number of new pilot starts declined, the median age of active pilots steadily increased, apart from the 1989 data anomaly, as shown in FIGuRE 4-3. Since pilots accumulate more flight time as they get older, the average total hours flown reported by applicants for a medical examination increased steadily from 1983 to 2005, as shown in FIGuRE 4-4, in which the left panel shows the average total flight hours for female pilots and the right panel shows the average total flight hours for male pilots.
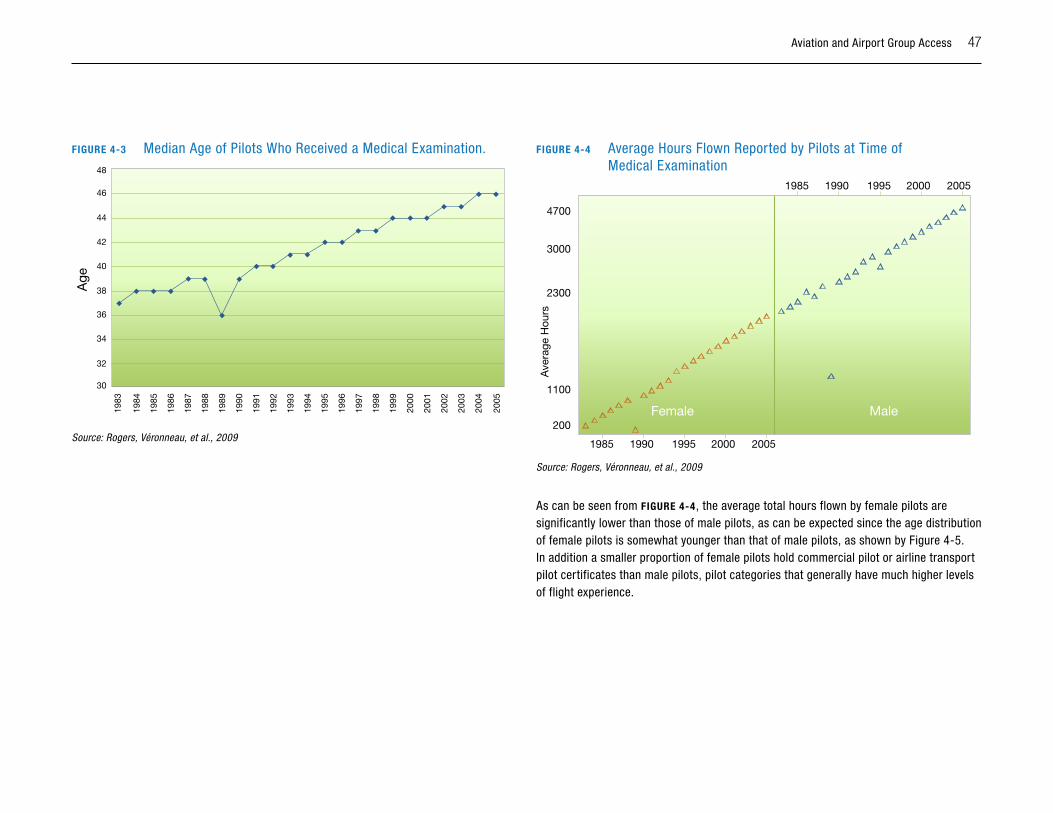
Aviation and Airport Group Access 47
FIGuRE 4-3 Median Age of Pilots Who Received a Medical Examination.
1983
1984
1985
1986
1987
1988
1989
1990
1991
1992
1993
1994
1995
1996
1997
1998
1999
2000
2001
2002
2003
2004
2005
Year
34
32
30
36
38
40
42
44
46
48
Age
◆
◆ ◆ ◆
◆ ◆
◆
◆
◆ ◆
◆ ◆
◆ ◆
◆ ◆
◆ ◆ ◆
◆ ◆
◆ ◆
Source: Rogers, Véronneau, et al., 2009
FIGuRE 4-4 Average Hours Flown Reported by Pilots at Time of Medical Examination
1985 1990 1995 2000 2005
1985 1990 1995 2000 2005
Female Male200
1100
2300
3000
4700
Ave
rage
Hou
rs
Source: Rogers, Véronneau, et al., 2009
As can be seen from FIGuRE 4-4, the average total hours flown by female pilots are significantly lower than those of male pilots, as can be expected since the age distribution of female pilots is somewhat younger than that of male pilots, as shown by Figure 4-5. In addition a smaller proportion of female pilots hold commercial pilot or airline transport pilot certificates than male pilots, pilot categories that generally have much higher levels of flight experience.
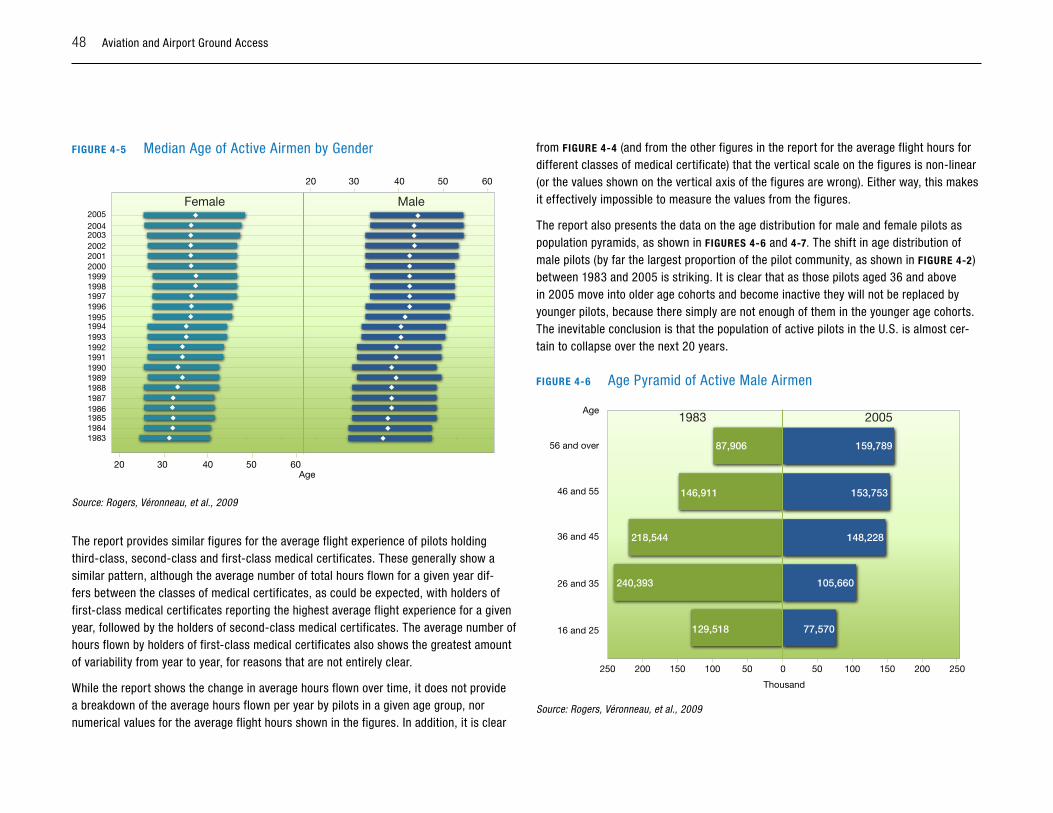
48 Aviation and Airport Ground Access
FIGuRE 4-5 Median Age of Active Airmen by Gender
Female Male
Age
20052004200320022001200019991998199719961995199419931992199119901989198819871986198519841983
20 30 40 50 60
20 30 40 50 60
Source: Rogers, Véronneau, et al., 2009
The report provides similar figures for the average flight experience of pilots holding third-class, second-class and first-class medical certificates. These generally show a similar pattern, although the average number of total hours flown for a given year dif-fers between the classes of medical certificates, as could be expected, with holders of first-class medical certificates reporting the highest average flight experience for a given year, followed by the holders of second-class medical certificates. The average number of hours flown by holders of first-class medical certificates also shows the greatest amount of variability from year to year, for reasons that are not entirely clear.
While the report shows the change in average hours flown over time, it does not provide a breakdown of the average hours flown per year by pilots in a given age group, nor numerical values for the average flight hours shown in the figures. In addition, it is clear
from FIGuRE 4-4 (and from the other figures in the report for the average flight hours for different classes of medical certificate) that the vertical scale on the figures is non-linear (or the values shown on the vertical axis of the figures are wrong). Either way, this makes it effectively impossible to measure the values from the figures.
The report also presents the data on the age distribution for male and female pilots as population pyramids, as shown in FIGuRES 4-6 and 4-7. The shift in age distribution of male pilots (by far the largest proportion of the pilot community, as shown in FIGuRE 4-2) between 1983 and 2005 is striking. It is clear that as those pilots aged 36 and above in 2005 move into older age cohorts and become inactive they will not be replaced by younger pilots, because there simply are not enough of them in the younger age cohorts. The inevitable conclusion is that the population of active pilots in the U.S. is almost cer-tain to collapse over the next 20 years.
FIGuRE 4-6 Age Pyramid of Active Male Airmen
250 250200 200150 150100 10050 500
1983 2005
16 and 25
26 and 35
36 and 45
46 and 55
56 and over
Thousand
Age
240,393
129,518
218,544
146,911
87,906
153,753
159,789
148,228
105,660
77,570
Source: Rogers, Véronneau, et al., 2009
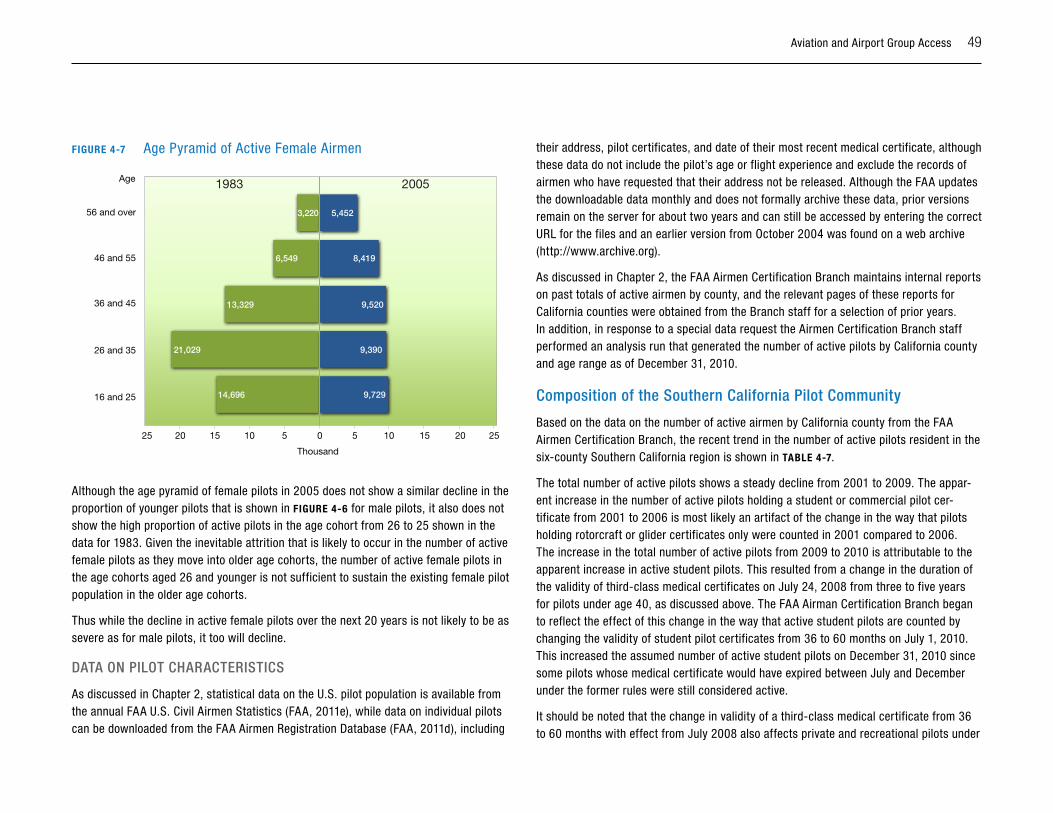
Aviation and Airport Group Access 49
FIGuRE 4-7 Age Pyramid of Active Female Airmen
25 2520 2015 1510 105 50
1983 2005
16 and 25
26 and 35
36 and 45
46 and 55
56 and over
Thousand
Age
21,029
14,696
13,329
6,549
3,220
8,419
9,520
5,452
9,390
9,729
Although the age pyramid of female pilots in 2005 does not show a similar decline in the proportion of younger pilots that is shown in FIGuRE 4-6 for male pilots, it also does not show the high proportion of active pilots in the age cohort from 26 to 25 shown in the data for 1983. Given the inevitable attrition that is likely to occur in the number of active female pilots as they move into older age cohorts, the number of active female pilots in the age cohorts aged 26 and younger is not sufficient to sustain the existing female pilot population in the older age cohorts.
Thus while the decline in active female pilots over the next 20 years is not likely to be as severe as for male pilots, it too will decline.
DATA on piloT ChARACTERisTiCs
As discussed in Chapter 2, statistical data on the U.S. pilot population is available from the annual FAA U.S. Civil Airmen Statistics (FAA, 2011e), while data on individual pilots can be downloaded from the FAA Airmen Registration Database (FAA, 2011d), including
their address, pilot certificates, and date of their most recent medical certificate, although these data do not include the pilot’s age or flight experience and exclude the records of airmen who have requested that their address not be released. Although the FAA updates the downloadable data monthly and does not formally archive these data, prior versions remain on the server for about two years and can still be accessed by entering the correct URL for the files and an earlier version from October 2004 was found on a web archive (http://www.archive.org).
As discussed in Chapter 2, the FAA Airmen Certification Branch maintains internal reports on past totals of active airmen by county, and the relevant pages of these reports for California counties were obtained from the Branch staff for a selection of prior years. In addition, in response to a special data request the Airmen Certification Branch staff performed an analysis run that generated the number of active pilots by California county and age range as of December 31, 2010.
Composition of the southern California pilot Community
Based on the data on the number of active airmen by California county from the FAA Airmen Certification Branch, the recent trend in the number of active pilots resident in the six-county Southern California region is shown in TABlE 4-7.
The total number of active pilots shows a steady decline from 2001 to 2009. The appar-ent increase in the number of active pilots holding a student or commercial pilot cer-tificate from 2001 to 2006 is most likely an artifact of the change in the way that pilots holding rotorcraft or glider certificates only were counted in 2001 compared to 2006. The increase in the total number of active pilots from 2009 to 2010 is attributable to the apparent increase in active student pilots. This resulted from a change in the duration of the validity of third-class medical certificates on July 24, 2008 from three to five years for pilots under age 40, as discussed above. The FAA Airman Certification Branch began to reflect the effect of this change in the way that active student pilots are counted by changing the validity of student pilot certificates from 36 to 60 months on July 1, 2010. This increased the assumed number of active student pilots on December 31, 2010 since some pilots whose medical certificate would have expired between July and December under the former rules were still considered active.
It should be noted that the change in validity of a third-class medical certificate from 36 to 60 months with effect from July 2008 also affects private and recreational pilots under
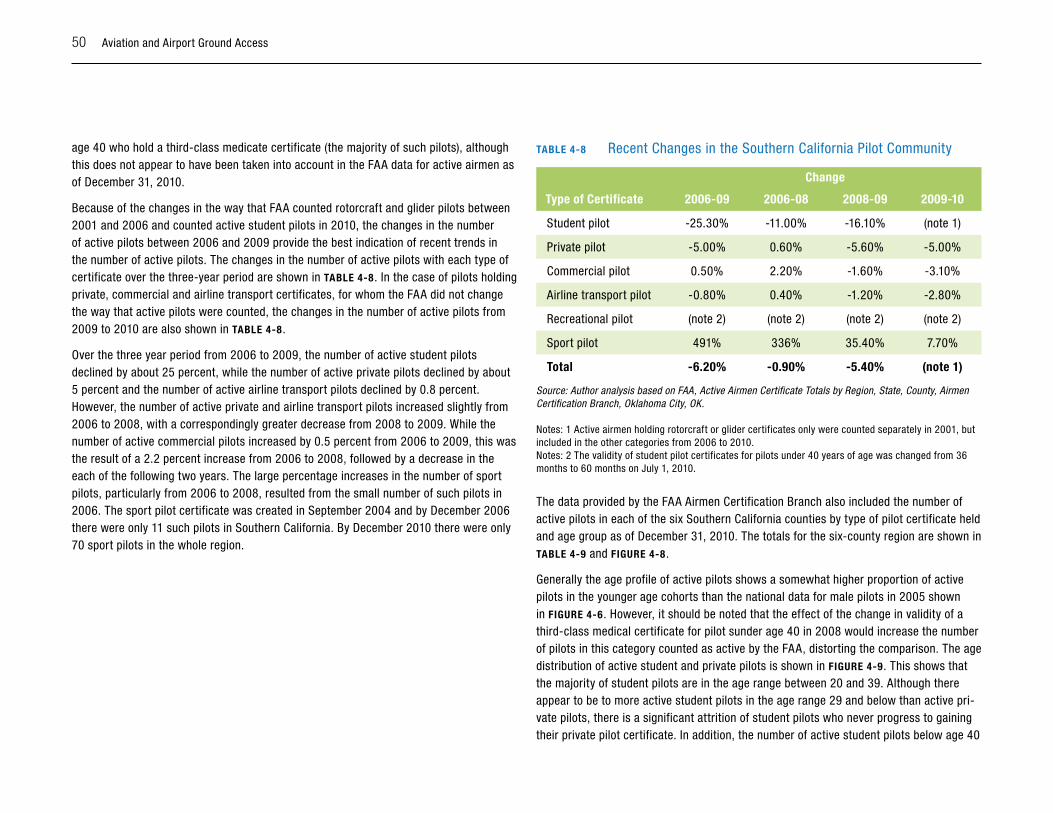
50 Aviation and Airport Ground Access
age 40 who hold a third-class medicate certificate (the majority of such pilots), although this does not appear to have been taken into account in the FAA data for active airmen as of December 31, 2010.
Because of the changes in the way that FAA counted rotorcraft and glider pilots between 2001 and 2006 and counted active student pilots in 2010, the changes in the number of active pilots between 2006 and 2009 provide the best indication of recent trends in the number of active pilots. The changes in the number of active pilots with each type of certificate over the three-year period are shown in TABlE 4-8. In the case of pilots holding private, commercial and airline transport certificates, for whom the FAA did not change the way that active pilots were counted, the changes in the number of active pilots from 2009 to 2010 are also shown in TABlE 4-8.
Over the three year period from 2006 to 2009, the number of active student pilots declined by about 25 percent, while the number of active private pilots declined by about 5 percent and the number of active airline transport pilots declined by 0.8 percent. However, the number of active private and airline transport pilots increased slightly from 2006 to 2008, with a correspondingly greater decrease from 2008 to 2009. While the number of active commercial pilots increased by 0.5 percent from 2006 to 2009, this was the result of a 2.2 percent increase from 2006 to 2008, followed by a decrease in the each of the following two years. The large percentage increases in the number of sport pilots, particularly from 2006 to 2008, resulted from the small number of such pilots in 2006. The sport pilot certificate was created in September 2004 and by December 2006 there were only 11 such pilots in Southern California. By December 2010 there were only 70 sport pilots in the whole region.
TABlE 4-8 Recent Changes in the Southern California Pilot Community
Change
Type of Certificate 2006-09 2006-08 2008-09 2009-10
Student pilot -25.30% -11.00% -16.10% (note 1)
Private pilot -5.00% 0.60% -5.60% -5.00%
Commercial pilot 0.50% 2.20% -1.60% -3.10%
Airline transport pilot -0.80% 0.40% -1.20% -2.80%
Recreational pilot (note 2) (note 2) (note 2) (note 2)
Sport pilot 491% 336% 35.40% 7.70%
Total -6.20% -0.90% -5.40% (note 1)
Source: Author analysis based on FAA, Active Airmen Certificate Totals by Region, State, County, Airmen Certification Branch, Oklahoma City, OK.
Notes: 1 Active airmen holding rotorcraft or glider certificates only were counted separately in 2001, but included in the other categories from 2006 to 2010. Notes: 2 The validity of student pilot certificates for pilots under 40 years of age was changed from 36 months to 60 months on July 1, 2010.
The data provided by the FAA Airmen Certification Branch also included the number of active pilots in each of the six Southern California counties by type of pilot certificate held and age group as of December 31, 2010. The totals for the six-county region are shown in TABlE 4-9 and FIGuRE 4-8.
Generally the age profile of active pilots shows a somewhat higher proportion of active pilots in the younger age cohorts than the national data for male pilots in 2005 shown in FIGuRE 4-6. However, it should be noted that the effect of the change in validity of a third-class medical certificate for pilot sunder age 40 in 2008 would increase the number of pilots in this category counted as active by the FAA, distorting the comparison. The age distribution of active student and private pilots is shown in FIGuRE 4-9. This shows that the majority of student pilots are in the age range between 20 and 39. Although there appear to be to more active student pilots in the age range 29 and below than active pri-vate pilots, there is a significant attrition of student pilots who never progress to gaining their private pilot certificate. In addition, the number of active student pilots below age 40
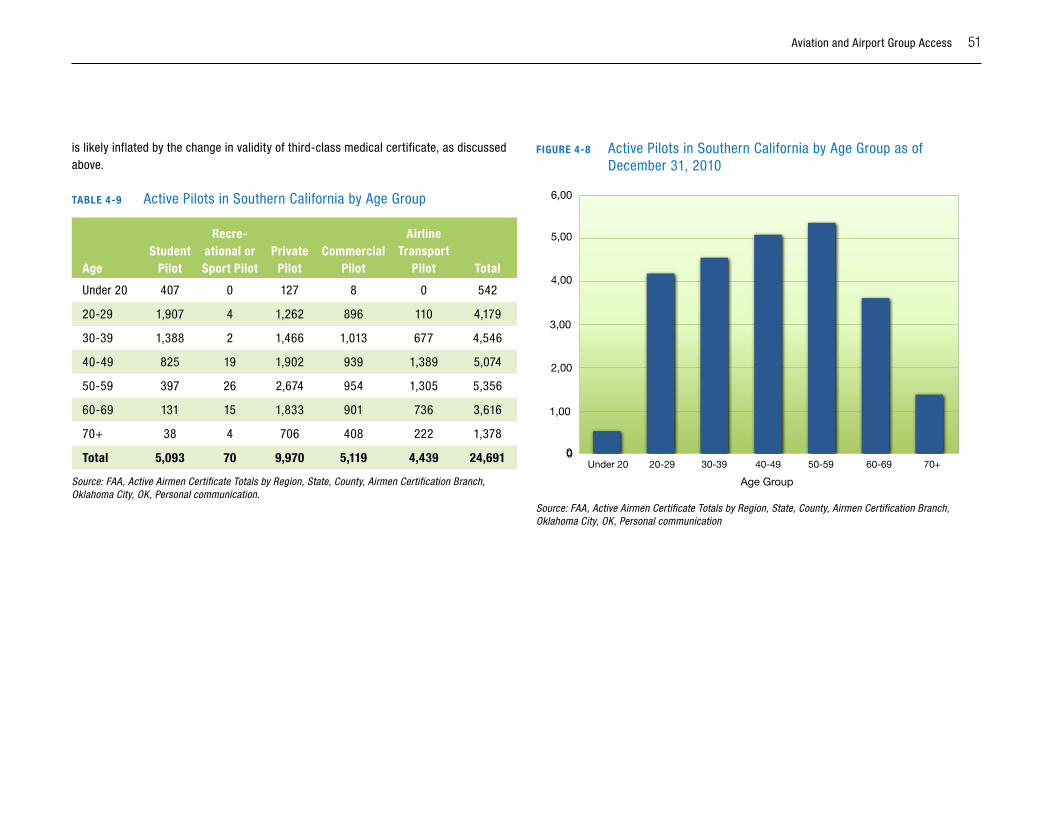
Aviation and Airport Group Access 51
is likely inflated by the change in validity of third-class medical certificate, as discussed above.
TABlE 4-9 Active Pilots in Southern California by Age Group
AgeStudent
Pilot
Recre-ational or Sport Pilot
Private Pilot
Commercial Pilot
Airline Transport
Pilot Total
Under 20 407 0 127 8 0 542
20-29 1,907 4 1,262 896 110 4,179
30-39 1,388 2 1,466 1,013 677 4,546
40-49 825 19 1,902 939 1,389 5,074
50-59 397 26 2,674 954 1,305 5,356
60-69 131 15 1,833 901 736 3,616
70+ 38 4 706 408 222 1,378
Total 5,093 70 9,970 5,119 4,439 24,691
Source: FAA, Active Airmen Certificate Totals by Region, State, County, Airmen Certification Branch, Oklahoma City, OK, Personal communication.
FIGuRE 4-8 Active Pilots in Southern California by Age Group as of December 31, 2010
6,00
5,00
4,00
2,00
3,00
1,00
00Under 20 20-29
Age Group
30-39 40-49 50-59 60-69 70+
Source: FAA, Active Airmen Certificate Totals by Region, State, County, Airmen Certification Branch, Oklahoma City, OK, Personal communication
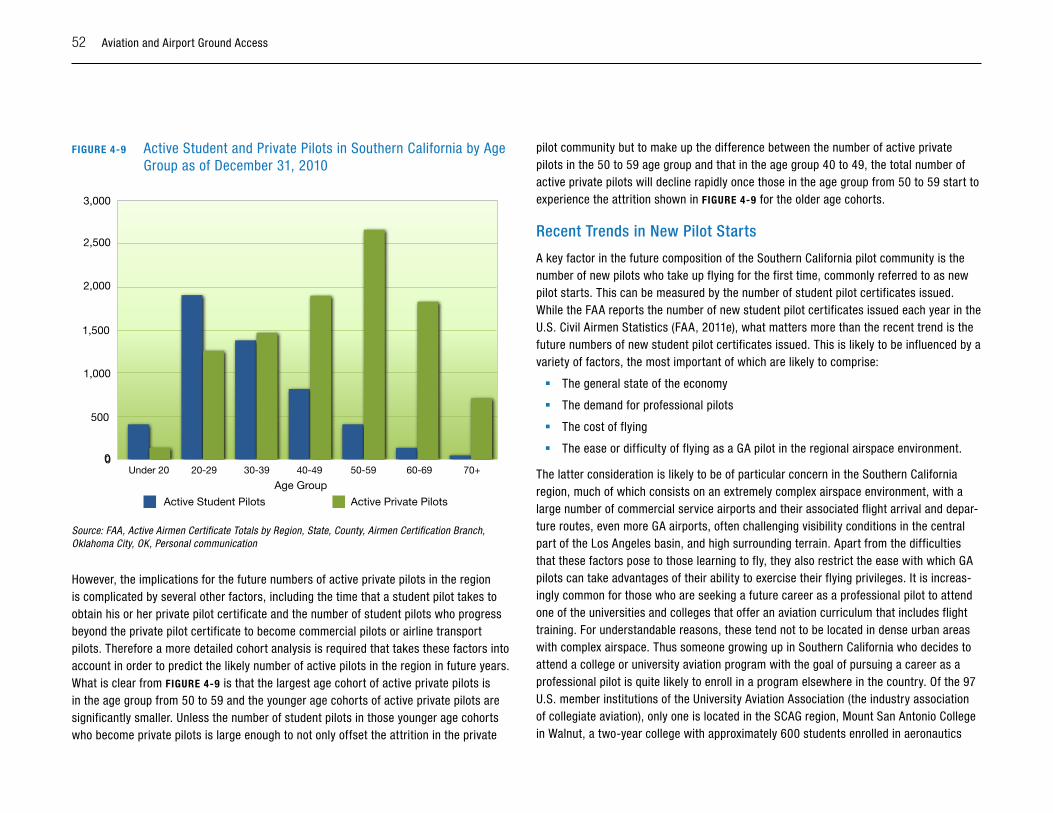
52 Aviation and Airport Ground Access
FIGuRE 4-9 Active Student and Private Pilots in Southern California by Age Group as of December 31, 2010
3,000
2,500
2,000
1,000
1,500
500
00Under 20 20-29
Age Group
Active Student Pilots Active Private Pilots
30-39 40-49 50-59 60-69 70+
Source: FAA, Active Airmen Certificate Totals by Region, State, County, Airmen Certification Branch, Oklahoma City, OK, Personal communication
However, the implications for the future numbers of active private pilots in the region is complicated by several other factors, including the time that a student pilot takes to obtain his or her private pilot certificate and the number of student pilots who progress beyond the private pilot certificate to become commercial pilots or airline transport pilots. Therefore a more detailed cohort analysis is required that takes these factors into account in order to predict the likely number of active pilots in the region in future years. What is clear from FIGuRE 4-9 is that the largest age cohort of active private pilots is in the age group from 50 to 59 and the younger age cohorts of active private pilots are significantly smaller. Unless the number of student pilots in those younger age cohorts who become private pilots is large enough to not only offset the attrition in the private
pilot community but to make up the difference between the number of active private pilots in the 50 to 59 age group and that in the age group 40 to 49, the total number of active private pilots will decline rapidly once those in the age group from 50 to 59 start to experience the attrition shown in FIGuRE 4-9 for the older age cohorts.
Recent Trends in new pilot starts
A key factor in the future composition of the Southern California pilot community is the number of new pilots who take up flying for the first time, commonly referred to as new pilot starts. This can be measured by the number of student pilot certificates issued. While the FAA reports the number of new student pilot certificates issued each year in the U.S. Civil Airmen Statistics (FAA, 2011e), what matters more than the recent trend is the future numbers of new student pilot certificates issued. This is likely to be influenced by a variety of factors, the most important of which are likely to comprise:
� The general state of the economy
� The demand for professional pilots
� The cost of flying
� The ease or difficulty of flying as a GA pilot in the regional airspace environment.
The latter consideration is likely to be of particular concern in the Southern California region, much of which consists on an extremely complex airspace environment, with a large number of commercial service airports and their associated flight arrival and depar-ture routes, even more GA airports, often challenging visibility conditions in the central part of the Los Angeles basin, and high surrounding terrain. Apart from the difficulties that these factors pose to those learning to fly, they also restrict the ease with which GA pilots can take advantages of their ability to exercise their flying privileges. It is increas-ingly common for those who are seeking a future career as a professional pilot to attend one of the universities and colleges that offer an aviation curriculum that includes flight training. For understandable reasons, these tend not to be located in dense urban areas with complex airspace. Thus someone growing up in Southern California who decides to attend a college or university aviation program with the goal of pursuing a career as a professional pilot is quite likely to enroll in a program elsewhere in the country. Of the 97 U.S. member institutions of the University Aviation Association (the industry association of collegiate aviation), only one is located in the SCAG region, Mount San Antonio College in Walnut, a two-year college with approximately 600 students enrolled in aeronautics
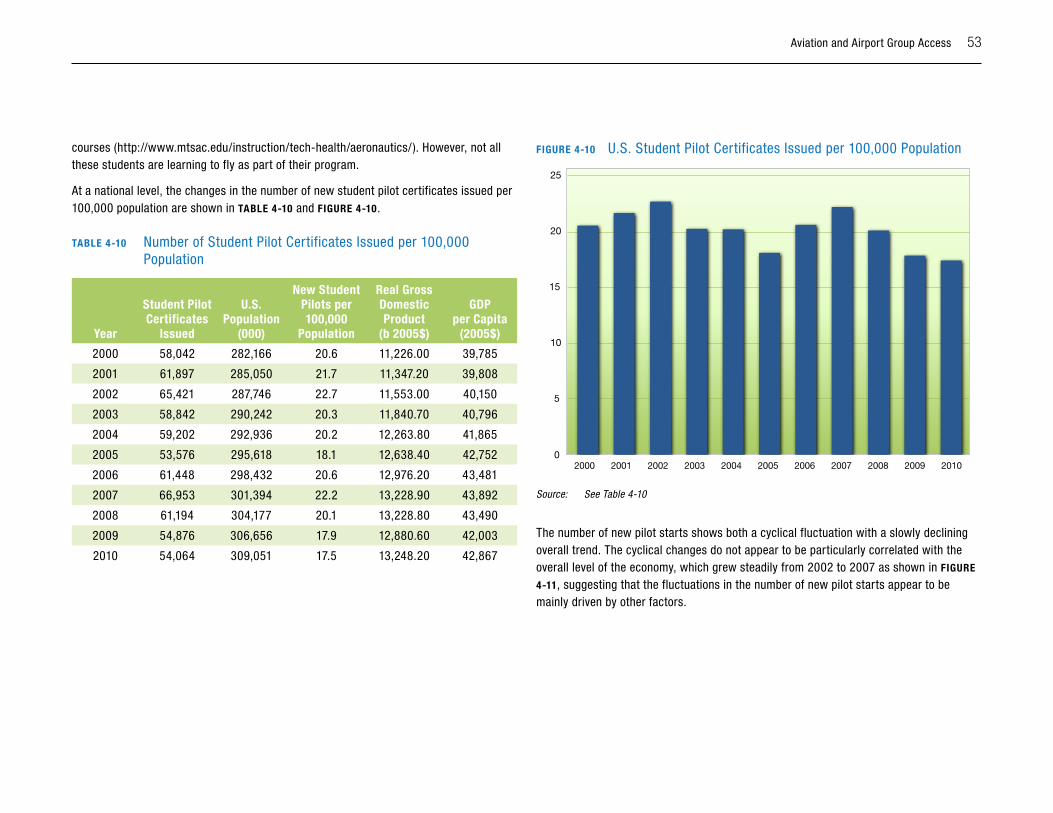
Aviation and Airport Group Access 53
courses (http://www.mtsac.edu/instruction/tech-health/aeronautics/). However, not all these students are learning to fly as part of their program.
At a national level, the changes in the number of new student pilot certificates issued per 100,000 population are shown in TABlE 4-10 and FIGuRE 4-10.
TABlE 4-10 Number of Student Pilot Certificates Issued per 100,000 Population
Year
Student Pilot Certificates
Issued
u.S. Population
(000)
New Student Pilots per 100,000
Population
Real Gross Domestic Product
(b 2005$)
GDP per Capita
(2005$)
2000 58,042 282,166 20.6 11,226.00 39,785
2001 61,897 285,050 21.7 11,347.20 39,808
2002 65,421 287,746 22.7 11,553.00 40,150
2003 58,842 290,242 20.3 11,840.70 40,796
2004 59,202 292,936 20.2 12,263.80 41,865
2005 53,576 295,618 18.1 12,638.40 42,752
2006 61,448 298,432 20.6 12,976.20 43,481
2007 66,953 301,394 22.2 13,228.90 43,892
2008 61,194 304,177 20.1 13,228.80 43,490
2009 54,876 306,656 17.9 12,880.60 42,003
2010 54,064 309,051 17.5 13,248.20 42,867
FIGuRE 4-10 U.S. Student Pilot Certificates Issued per 100,000 Population
25
20
10
15
5
02000 2001 2002 2003 2004 2005 2006 2007 2008 2009 2010
Source: See Table 4-10
The number of new pilot starts shows both a cyclical fluctuation with a slowly declining overall trend. The cyclical changes do not appear to be particularly correlated with the overall level of the economy, which grew steadily from 2002 to 2007 as shown in FIGuRE
4-11, suggesting that the fluctuations in the number of new pilot starts appear to be mainly driven by other factors.
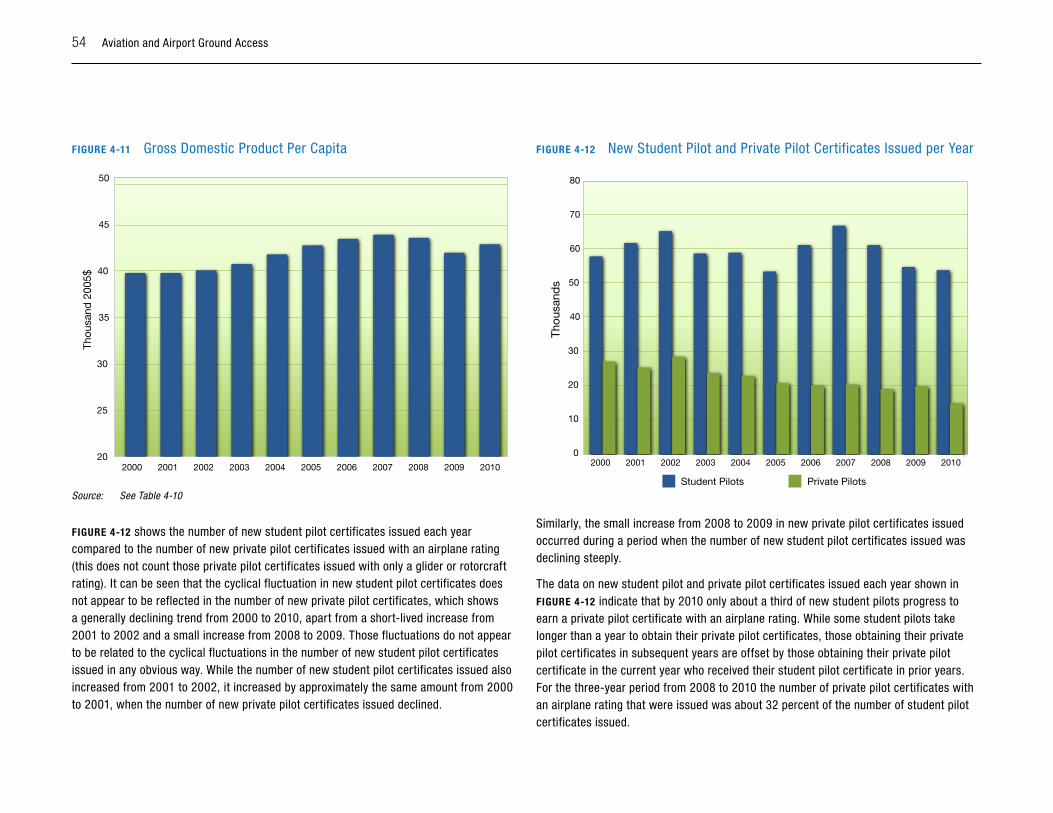
54 Aviation and Airport Ground Access
FIGuRE 4-11 Gross Domestic Product Per Capita
50
45
35
40
30
25
202000 2001 2002
Thou
sand
200
5$
2003 2004 2005 2006 2007 2008 2009 2010
Source: See Table 4-10
FIGuRE 4-12 shows the number of new student pilot certificates issued each year compared to the number of new private pilot certificates issued with an airplane rating (this does not count those private pilot certificates issued with only a glider or rotorcraft rating). It can be seen that the cyclical fluctuation in new student pilot certificates does not appear to be reflected in the number of new private pilot certificates, which shows a generally declining trend from 2000 to 2010, apart from a short-lived increase from 2001 to 2002 and a small increase from 2008 to 2009. Those fluctuations do not appear to be related to the cyclical fluctuations in the number of new student pilot certificates issued in any obvious way. While the number of new student pilot certificates issued also increased from 2001 to 2002, it increased by approximately the same amount from 2000 to 2001, when the number of new private pilot certificates issued declined.
FIGuRE 4-12 New Student Pilot and Private Pilot Certificates Issued per Year
70
80
60
40
50
30
10
20
02000 2001 2002
Thou
sand
s
2003 2004 2005 2006 2007 2008 2009 2010
Student Pilots Private Pilots
Similarly, the small increase from 2008 to 2009 in new private pilot certificates issued occurred during a period when the number of new student pilot certificates issued was declining steeply.
The data on new student pilot and private pilot certificates issued each year shown in FIGuRE 4-12 indicate that by 2010 only about a third of new student pilots progress to earn a private pilot certificate with an airplane rating. While some student pilots take longer than a year to obtain their private pilot certificates, those obtaining their private pilot certificates in subsequent years are offset by those obtaining their private pilot certificate in the current year who received their student pilot certificate in prior years. For the three-year period from 2008 to 2010 the number of private pilot certificates with an airplane rating that were issued was about 32 percent of the number of student pilot certificates issued.
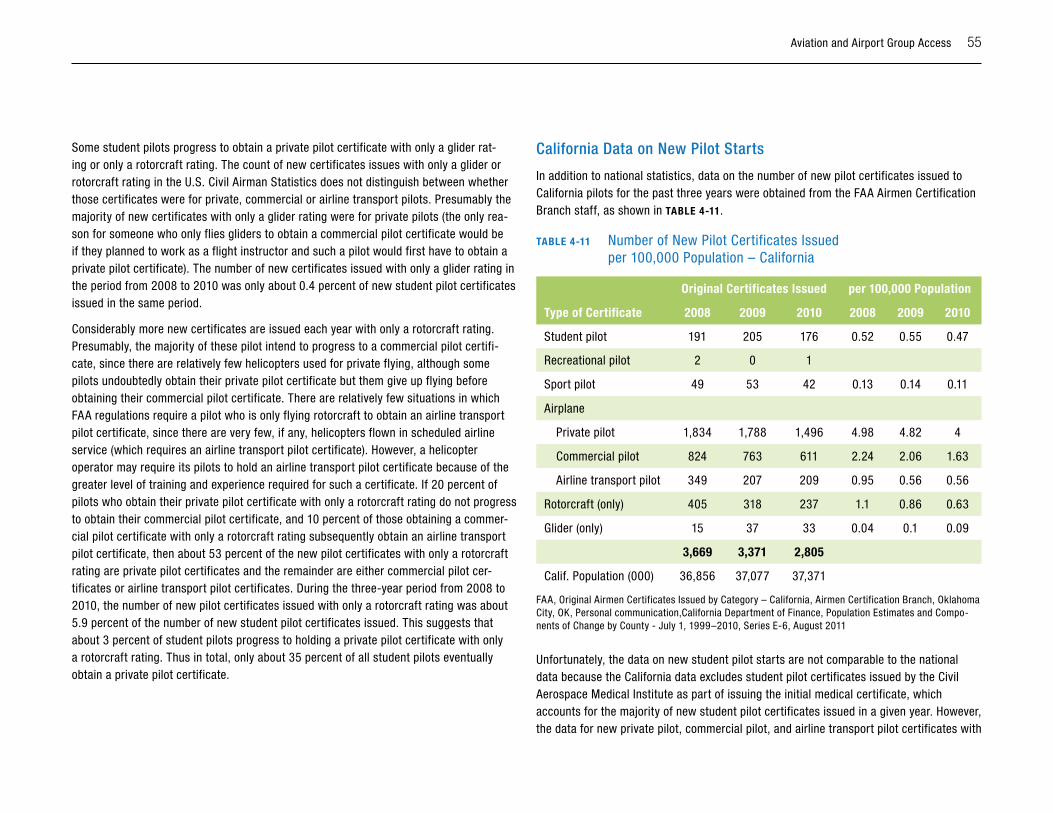
Aviation and Airport Group Access 55
Some student pilots progress to obtain a private pilot certificate with only a glider rat-ing or only a rotorcraft rating. The count of new certificates issues with only a glider or rotorcraft rating in the U.S. Civil Airman Statistics does not distinguish between whether those certificates were for private, commercial or airline transport pilots. Presumably the majority of new certificates with only a glider rating were for private pilots (the only rea-son for someone who only flies gliders to obtain a commercial pilot certificate would be if they planned to work as a flight instructor and such a pilot would first have to obtain a private pilot certificate). The number of new certificates issued with only a glider rating in the period from 2008 to 2010 was only about 0.4 percent of new student pilot certificates issued in the same period.
Considerably more new certificates are issued each year with only a rotorcraft rating. Presumably, the majority of these pilot intend to progress to a commercial pilot certifi-cate, since there are relatively few helicopters used for private flying, although some pilots undoubtedly obtain their private pilot certificate but them give up flying before obtaining their commercial pilot certificate. There are relatively few situations in which FAA regulations require a pilot who is only flying rotorcraft to obtain an airline transport pilot certificate, since there are very few, if any, helicopters flown in scheduled airline service (which requires an airline transport pilot certificate). However, a helicopter operator may require its pilots to hold an airline transport pilot certificate because of the greater level of training and experience required for such a certificate. If 20 percent of pilots who obtain their private pilot certificate with only a rotorcraft rating do not progress to obtain their commercial pilot certificate, and 10 percent of those obtaining a commer-cial pilot certificate with only a rotorcraft rating subsequently obtain an airline transport pilot certificate, then about 53 percent of the new pilot certificates with only a rotorcraft rating are private pilot certificates and the remainder are either commercial pilot cer-tificates or airline transport pilot certificates. During the three-year period from 2008 to 2010, the number of new pilot certificates issued with only a rotorcraft rating was about 5.9 percent of the number of new student pilot certificates issued. This suggests that about 3 percent of student pilots progress to holding a private pilot certificate with only a rotorcraft rating. Thus in total, only about 35 percent of all student pilots eventually obtain a private pilot certificate.
California Data on new pilot starts
In addition to national statistics, data on the number of new pilot certificates issued to California pilots for the past three years were obtained from the FAA Airmen Certification Branch staff, as shown in TABlE 4-11.
TABlE 4-11 Number of New Pilot Certificates Issued per 100,000 Population – California
Original Certificates Issued per 100,000 Population
Type of Certificate 2008 2009 2010 2008 2009 2010
Student pilot 191 205 176 0.52 0.55 0.47
Recreational pilot 2 0 1
Sport pilot 49 53 42 0.13 0.14 0.11
Airplane
Private pilot 1,834 1,788 1,496 4.98 4.82 4
Commercial pilot 824 763 611 2.24 2.06 1.63
Airline transport pilot 349 207 209 0.95 0.56 0.56
Rotorcraft (only) 405 318 237 1.1 0.86 0.63
Glider (only) 15 37 33 0.04 0.1 0.09
3,669 3,371 2,805
Calif. Population (000) 36,856 37,077 37,371
FAA, Original Airmen Certificates Issued by Category – California, Airmen Certification Branch, Oklahoma City, OK, Personal communication,California Department of Finance, Population Estimates and Compo-nents of Change by County - July 1, 1999–2010, Series E-6, August 2011
Unfortunately, the data on new student pilot starts are not comparable to the national data because the California data excludes student pilot certificates issued by the Civil Aerospace Medical Institute as part of issuing the initial medical certificate, which accounts for the majority of new student pilot certificates issued in a given year. However, the data for new private pilot, commercial pilot, and airline transport pilot certificates with
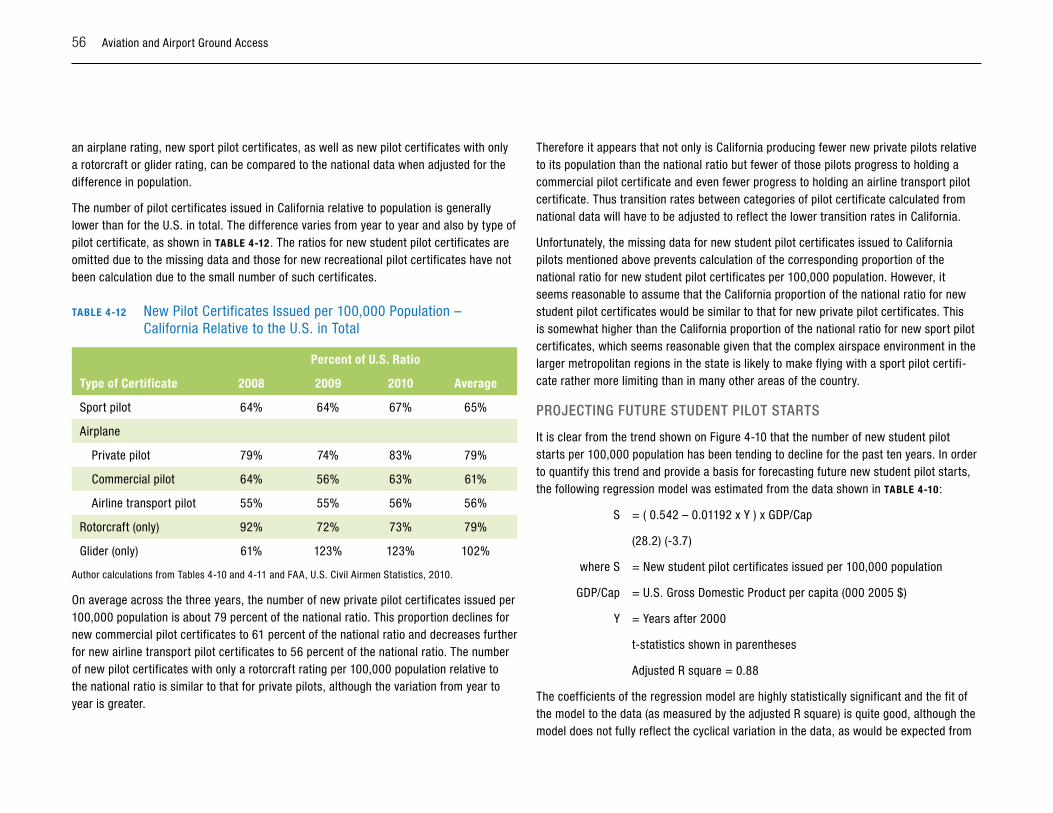
56 Aviation and Airport Ground Access
an airplane rating, new sport pilot certificates, as well as new pilot certificates with only a rotorcraft or glider rating, can be compared to the national data when adjusted for the difference in population.
The number of pilot certificates issued in California relative to population is generally lower than for the U.S. in total. The difference varies from year to year and also by type of pilot certificate, as shown in TABlE 4-12 . The ratios for new student pilot certificates are omitted due to the missing data and those for new recreational pilot certificates have not been calculation due to the small number of such certificates.
TABlE 4-12 New Pilot Certificates Issued per 100,000 Population – California Relative to the U.S. in Total
Percent of u.S. Ratio
Type of Certificate 2008 2009 2010 Average
Sport pilot 64% 64% 67% 65%
Airplane
Private pilot 79% 74% 83% 79%
Commercial pilot 64% 56% 63% 61%
Airline transport pilot 55% 55% 56% 56%
Rotorcraft (only) 92% 72% 73% 79%
Glider (only) 61% 123% 123% 102%
Author calculations from Tables 4-10 and 4-11 and FAA, U.S. Civil Airmen Statistics, 2010.
On average across the three years, the number of new private pilot certificates issued per 100,000 population is about 79 percent of the national ratio. This proportion declines for new commercial pilot certificates to 61 percent of the national ratio and decreases further for new airline transport pilot certificates to 56 percent of the national ratio. The number of new pilot certificates with only a rotorcraft rating per 100,000 population relative to the national ratio is similar to that for private pilots, although the variation from year to year is greater.
Therefore it appears that not only is California producing fewer new private pilots relative to its population than the national ratio but fewer of those pilots progress to holding a commercial pilot certificate and even fewer progress to holding an airline transport pilot certificate. Thus transition rates between categories of pilot certificate calculated from national data will have to be adjusted to reflect the lower transition rates in California.
Unfortunately, the missing data for new student pilot certificates issued to California pilots mentioned above prevents calculation of the corresponding proportion of the national ratio for new student pilot certificates per 100,000 population. However, it seems reasonable to assume that the California proportion of the national ratio for new student pilot certificates would be similar to that for new private pilot certificates. This is somewhat higher than the California proportion of the national ratio for new sport pilot certificates, which seems reasonable given that the complex airspace environment in the larger metropolitan regions in the state is likely to make flying with a sport pilot certifi-cate rather more limiting than in many other areas of the country.
pRojECTinG FuTuRE sTuDEnT piloT sTARTs
It is clear from the trend shown on Figure 4-10 that the number of new student pilot starts per 100,000 population has been tending to decline for the past ten years. In order to quantify this trend and provide a basis for forecasting future new student pilot starts, the following regression model was estimated from the data shown in TABlE 4-10:
S = ( 0.542 – 0.01192 x Y ) x GDP/Cap
(28.2) (-3.7)
where S = New student pilot certificates issued per 100,000 population
GDP/Cap = U.S. Gross Domestic Product per capita (000 2005 $)
Y = Years after 2000
t-statistics shown in parentheses
Adjusted R square = 0.88
The coefficients of the regression model are highly statistically significant and the fit of the model to the data (as measured by the adjusted R square) is quite good, although the model does not fully reflect the cyclical variation in the data, as would be expected from
Aviation and Airport Group Access 57
FIGuRES 4-10 and 4-11. The signs of the terms are intuitively reasonable, with the number of new student pilot certificates issued increasing with real Gross Domestic Product (GDP) per capita, as would be expected, and a decreasing trend with time, as the data shows.
An initial version of this model included a term that expressed the new student pilot rate as a constant times the real GDP per capita and a second term that decreased the new student pilot rate linearly by year. This model fitted the general trend in new student pilot starts for the period from 2000 to 2010 fairly well. However, it became apparent that reducing the new student pilot rate by a constant amount per year, irrespective of the value of predicted new student pilot rate, would tend to overestimate the reduction for areas with lower student pilot rates and underestimate the reduction for areas with higher rates. Therefore the model was modified to reduce the coefficient of the GDP per capita term by a constant rate per year, rather than the new student pilot rate itself, as shown above. This resulted in a reduction that was proportional to the value of the new student pilot rate, which resolved the problem.
A comparison was made between the number of active student pilots in California per 100,000 population and the national data for the years 2008 to 2010. The new student pilot model was applied to California population and GDP and the projected new stu-dent pilot rate given by the model was compared to the number of new student pilots in California per 100,000 population, assuming that the California rate of new student pilots relative to the national rate is proportional to the ratio of active student pilots per 100,000 population in California to the active student pilots per 100,000 population for the United States. This suggested that the new student pilot rate in California, after controlling for differences in real GDP per capita, is about 80 percent of the national rate, and this adjustment was applied to the model in developing the forecast.
If the GDP per capita remains constant in real terms at the 2010 level, the annual number of new student pilot certificates issued per 100,000 population would decline from 17.5 in 2010 to 5.4 in 2035. However, if the real GDP per capita grows at an average rate of 1.5 percent per year over the period, the predicted annual number of new student pilot certificates issued per 100,000 population would only decline to 7.8 in 2035. Even if the real GDP per capita grows at an average rate of 3 percent per year over the period, the predicted annual number of new student pilot certificates issued per 100,000 population given by the relationship would still decline significantly to 11.2 in 2035. Thus while the future strength of the economy will have a major influence on the number of new pilot
starts, assuming that the relationship between the changes in the economy over the past ten years and the changes in the number of student pilot certificates issued continue into the future, the effect of the declining trend in new pilot starts per 100,000 population is not likely to be reversed by any plausible future growth in the strength of the economy. Of course, there are undoubtedly other factors not included in the model such as the cost of flying or the demand for commercial pilots that will also have an important influence.
ThE AopA MEMBER suRvEy
In order to provide more detailed information on the characteristics and flying activity of general aviation pilots in Southern California, an online survey of California members of the Aircraft Owners and Pilots Association (AOPA) was performed by SCAG and the California Department of Transportation (Caltrans) Division of Aeronautics with the assis-tance of the AOPA. The AOPA agreed to invite its California members to participate in the survey and provide them with the web address of the survey website where they can complete the survey. Survey respondents were not asked to provide identifying informa-tion, but they were asked to provide their zip code of residence and (if they are an aircraft owner) the airport where they base their aircraft. They were also asked to provide the following information:
� Whether they have flown general aviation aircraft in the past six months
� How long ago they last flew as general aviation pilot (if no longer active)
� The highest level of pilot certificate that they currently hold (or have held)
� Their total flight hours in all types of aircraft
� Their flight hours in general aviation aircraft in the past year
� Whether they are a current or former aircraft owner
� The type(s) or aircraft that they own (or owned), if any
� Their zip code of residence
� Their age range (in ten year intervals)
In addition, the survey asked a number of questions about services that respondents have used or would like to see at airports that they use, as well as issues that they believe should be addressed at the airport where they base their aircraft or use most frequently, or that should be considered in developing a general aviation demand forecast. Since these issues are not germane to the analysis of the composition and activity levels of the
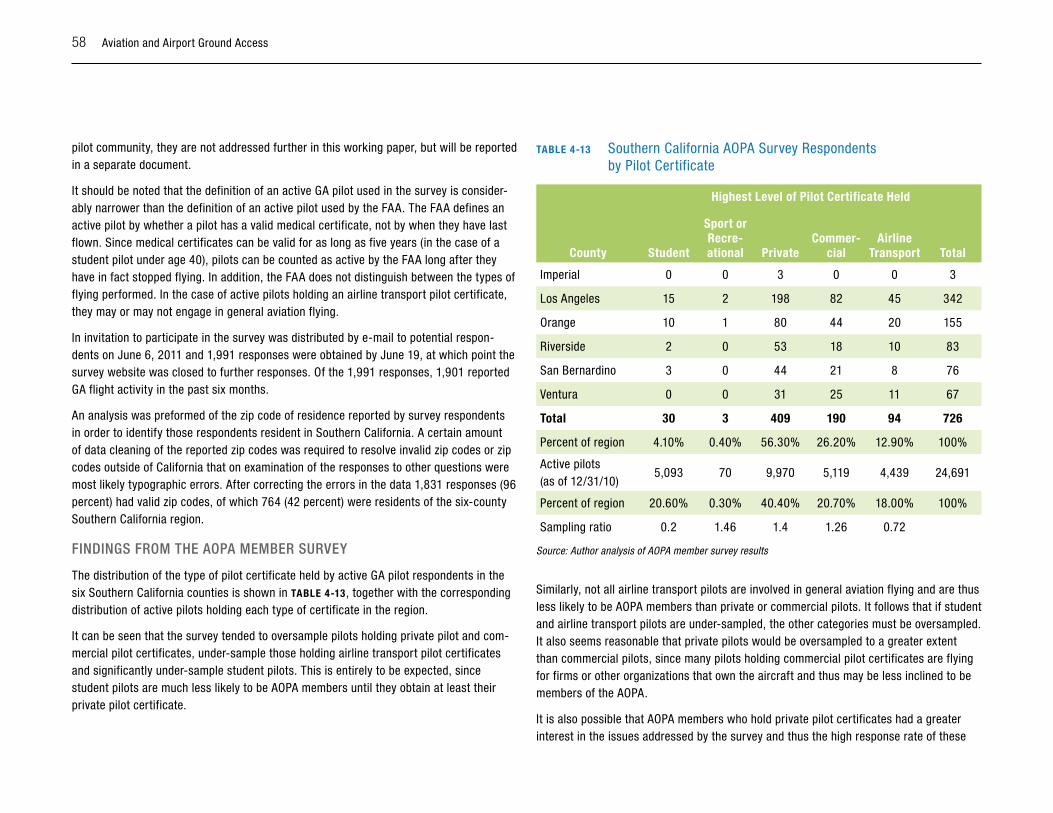
58 Aviation and Airport Ground Access
pilot community, they are not addressed further in this working paper, but will be reported in a separate document.
It should be noted that the definition of an active GA pilot used in the survey is consider-ably narrower than the definition of an active pilot used by the FAA. The FAA defines an active pilot by whether a pilot has a valid medical certificate, not by when they have last flown. Since medical certificates can be valid for as long as five years (in the case of a student pilot under age 40), pilots can be counted as active by the FAA long after they have in fact stopped flying. In addition, the FAA does not distinguish between the types of flying performed. In the case of active pilots holding an airline transport pilot certificate, they may or may not engage in general aviation flying.
In invitation to participate in the survey was distributed by e-mail to potential respon-dents on June 6, 2011 and 1,991 responses were obtained by June 19, at which point the survey website was closed to further responses. Of the 1,991 responses, 1,901 reported GA flight activity in the past six months.
An analysis was preformed of the zip code of residence reported by survey respondents in order to identify those respondents resident in Southern California. A certain amount of data cleaning of the reported zip codes was required to resolve invalid zip codes or zip codes outside of California that on examination of the responses to other questions were most likely typographic errors. After correcting the errors in the data 1,831 responses (96 percent) had valid zip codes, of which 764 (42 percent) were residents of the six-county Southern California region.
FinDinGs FRoM ThE AopA MEMBER suRvEy
The distribution of the type of pilot certificate held by active GA pilot respondents in the six Southern California counties is shown in TABlE 4-13, together with the corresponding distribution of active pilots holding each type of certificate in the region.
It can be seen that the survey tended to oversample pilots holding private pilot and com-mercial pilot certificates, under-sample those holding airline transport pilot certificates and significantly under-sample student pilots. This is entirely to be expected, since student pilots are much less likely to be AOPA members until they obtain at least their private pilot certificate.
TABlE 4-13 Southern California AOPA Survey Respondents by Pilot Certificate
Highest level of Pilot Certificate Held
County Student
Sport or Recre-ational Private
Commer-cial
Airline Transport Total
Imperial 0 0 3 0 0 3
Los Angeles 15 2 198 82 45 342
Orange 10 1 80 44 20 155
Riverside 2 0 53 18 10 83
San Bernardino 3 0 44 21 8 76
Ventura 0 0 31 25 11 67
Total 30 3 409 190 94 726
Percent of region 4.10% 0.40% 56.30% 26.20% 12.90% 100%
Active pilots (as of 12/31/10)
5,093 70 9,970 5,119 4,439 24,691
Percent of region 20.60% 0.30% 40.40% 20.70% 18.00% 100%
Sampling ratio 0.2 1.46 1.4 1.26 0.72
Source: Author analysis of AOPA member survey results
Similarly, not all airline transport pilots are involved in general aviation flying and are thus less likely to be AOPA members than private or commercial pilots. It follows that if student and airline transport pilots are under-sampled, the other categories must be oversampled. It also seems reasonable that private pilots would be oversampled to a greater extent than commercial pilots, since many pilots holding commercial pilot certificates are flying for firms or other organizations that own the aircraft and thus may be less inclined to be members of the AOPA.
It is also possible that AOPA members who hold private pilot certificates had a greater interest in the issues addressed by the survey and thus the high response rate of these
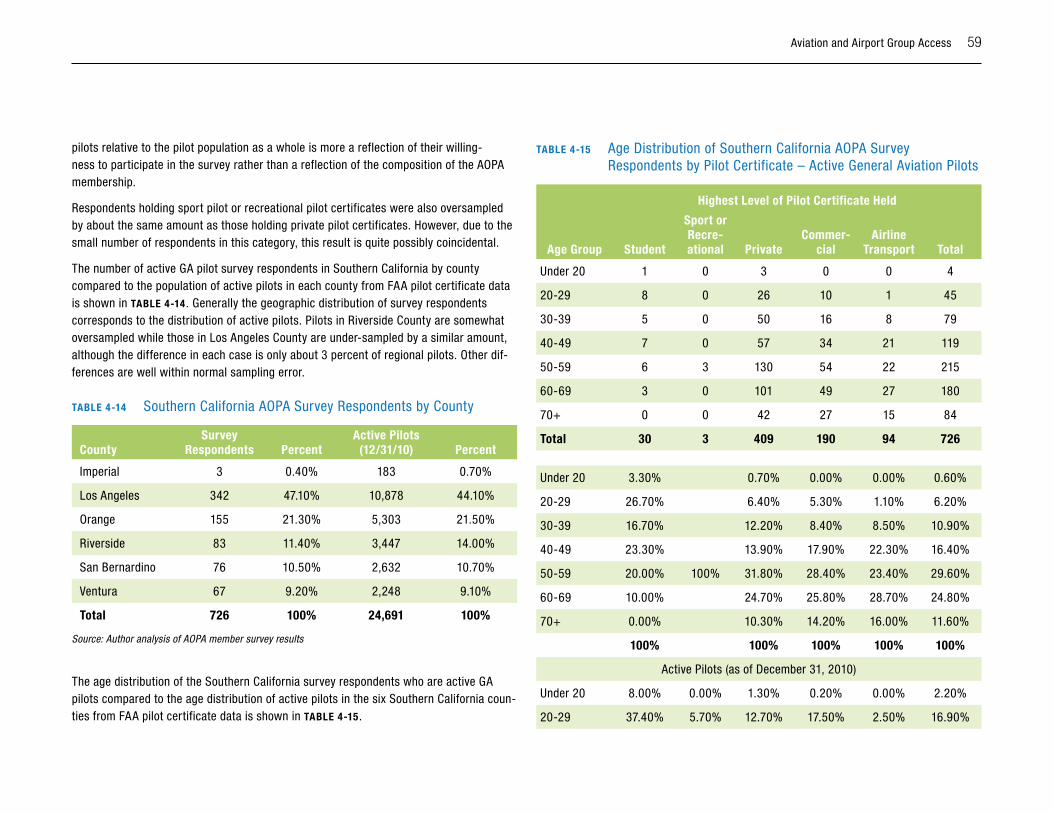
Aviation and Airport Group Access 59
pilots relative to the pilot population as a whole is more a reflection of their willing-ness to participate in the survey rather than a reflection of the composition of the AOPA membership.
Respondents holding sport pilot or recreational pilot certificates were also oversampled by about the same amount as those holding private pilot certificates. However, due to the small number of respondents in this category, this result is quite possibly coincidental.
The number of active GA pilot survey respondents in Southern California by county compared to the population of active pilots in each county from FAA pilot certificate data is shown in TABlE 4-14. Generally the geographic distribution of survey respondents corresponds to the distribution of active pilots. Pilots in Riverside County are somewhat oversampled while those in Los Angeles County are under-sampled by a similar amount, although the difference in each case is only about 3 percent of regional pilots. Other dif-ferences are well within normal sampling error.
TABlE 4-14 Southern California AOPA Survey Respondents by County
CountySurvey
Respondents PercentActive Pilots
(12/31/10) Percent
Imperial 3 0.40% 183 0.70%
Los Angeles 342 47.10% 10,878 44.10%
Orange 155 21.30% 5,303 21.50%
Riverside 83 11.40% 3,447 14.00%
San Bernardino 76 10.50% 2,632 10.70%
Ventura 67 9.20% 2,248 9.10%
Total 726 100% 24,691 100%
Source: Author analysis of AOPA member survey results
The age distribution of the Southern California survey respondents who are active GA pilots compared to the age distribution of active pilots in the six Southern California coun-ties from FAA pilot certificate data is shown in TABlE 4-15.
TABlE 4-15 Age Distribution of Southern California AOPA Survey Respondents by Pilot Certificate – Active General Aviation Pilots
Highest level of Pilot Certificate Held
Age Group Student
Sport or Recre-ational Private
Commer-cial
Airline Transport Total
Under 20 1 0 3 0 0 4
20-29 8 0 26 10 1 45
30-39 5 0 50 16 8 79
40-49 7 0 57 34 21 119
50-59 6 3 130 54 22 215
60-69 3 0 101 49 27 180
70+ 0 0 42 27 15 84
Total 30 3 409 190 94 726
Under 20 3.30% 0.70% 0.00% 0.00% 0.60%
20-29 26.70% 6.40% 5.30% 1.10% 6.20%
30-39 16.70% 12.20% 8.40% 8.50% 10.90%
40-49 23.30% 13.90% 17.90% 22.30% 16.40%
50-59 20.00% 100% 31.80% 28.40% 23.40% 29.60%
60-69 10.00% 24.70% 25.80% 28.70% 24.80%
70+ 0.00% 10.30% 14.20% 16.00% 11.60%
100% 100% 100% 100% 100%
Active Pilots (as of December 31, 2010)
Under 20 8.00% 0.00% 1.30% 0.20% 0.00% 2.20%
20-29 37.40% 5.70% 12.70% 17.50% 2.50% 16.90%
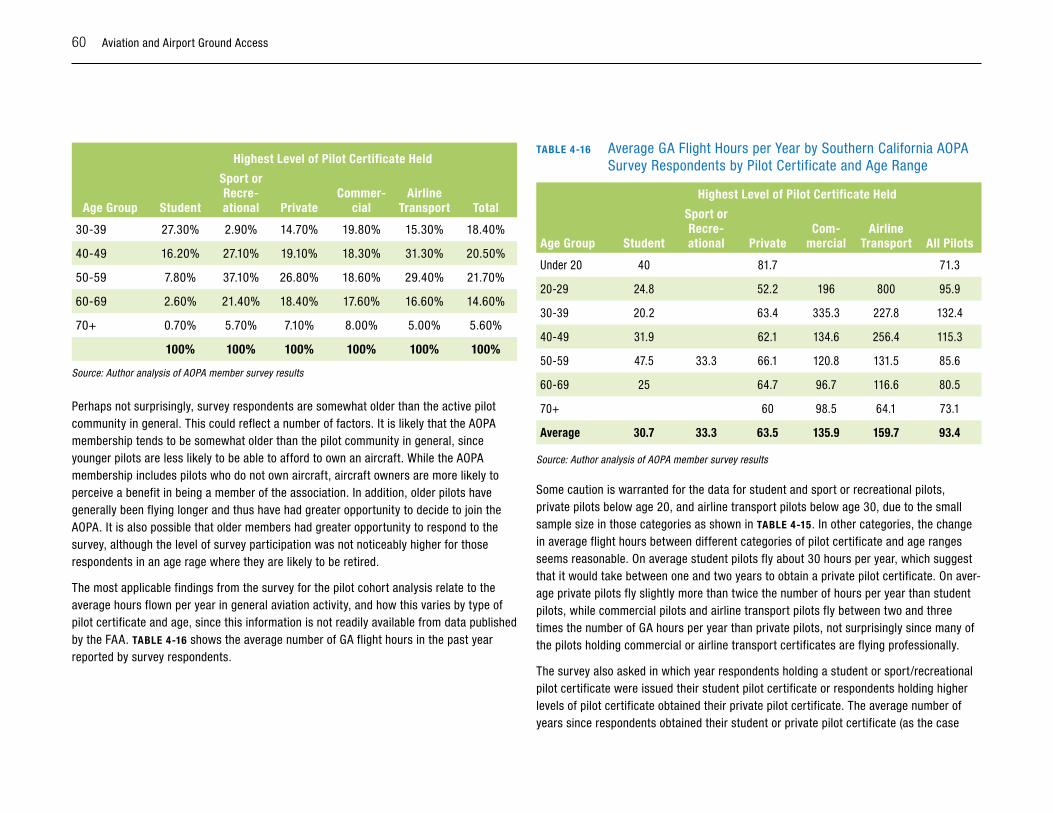
60 Aviation and Airport Ground Access
Highest level of Pilot Certificate Held
Age Group Student
Sport or Recre-ational Private
Commer-cial
Airline Transport Total
30-39 27.30% 2.90% 14.70% 19.80% 15.30% 18.40%
40-49 16.20% 27.10% 19.10% 18.30% 31.30% 20.50%
50-59 7.80% 37.10% 26.80% 18.60% 29.40% 21.70%
60-69 2.60% 21.40% 18.40% 17.60% 16.60% 14.60%
70+ 0.70% 5.70% 7.10% 8.00% 5.00% 5.60%
100% 100% 100% 100% 100% 100%
Source: Author analysis of AOPA member survey results
Perhaps not surprisingly, survey respondents are somewhat older than the active pilot community in general. This could reflect a number of factors. It is likely that the AOPA membership tends to be somewhat older than the pilot community in general, since younger pilots are less likely to be able to afford to own an aircraft. While the AOPA membership includes pilots who do not own aircraft, aircraft owners are more likely to perceive a benefit in being a member of the association. In addition, older pilots have generally been flying longer and thus have had greater opportunity to decide to join the AOPA. It is also possible that older members had greater opportunity to respond to the survey, although the level of survey participation was not noticeably higher for those respondents in an age rage where they are likely to be retired.
The most applicable findings from the survey for the pilot cohort analysis relate to the average hours flown per year in general aviation activity, and how this varies by type of pilot certificate and age, since this information is not readily available from data published by the FAA. TABlE 4-16 shows the average number of GA flight hours in the past year reported by survey respondents.
TABlE 4-16 Average GA Flight Hours per Year by Southern California AOPA Survey Respondents by Pilot Certificate and Age Range
Highest level of Pilot Certificate Held
Age Group Student
Sport or Recre-ational Private
Com-mercial
Airline Transport All Pilots
Under 20 40 81.7 71.3
20-29 24.8 52.2 196 800 95.9
30-39 20.2 63.4 335.3 227.8 132.4
40-49 31.9 62.1 134.6 256.4 115.3
50-59 47.5 33.3 66.1 120.8 131.5 85.6
60-69 25 64.7 96.7 116.6 80.5
70+ 60 98.5 64.1 73.1
Average 30.7 33.3 63.5 135.9 159.7 93.4
Source: Author analysis of AOPA member survey results
Some caution is warranted for the data for student and sport or recreational pilots, private pilots below age 20, and airline transport pilots below age 30, due to the small sample size in those categories as shown in TABlE 4-15. In other categories, the change in average flight hours between different categories of pilot certificate and age ranges seems reasonable. On average student pilots fly about 30 hours per year, which suggest that it would take between one and two years to obtain a private pilot certificate. On aver-age private pilots fly slightly more than twice the number of hours per year than student pilots, while commercial pilots and airline transport pilots fly between two and three times the number of GA hours per year than private pilots, not surprisingly since many of the pilots holding commercial or airline transport certificates are flying professionally.
The survey also asked in which year respondents holding a student or sport/recreational pilot certificate were issued their student pilot certificate or respondents holding higher levels of pilot certificate obtained their private pilot certificate. The average number of years since respondents obtained their student or private pilot certificate (as the case
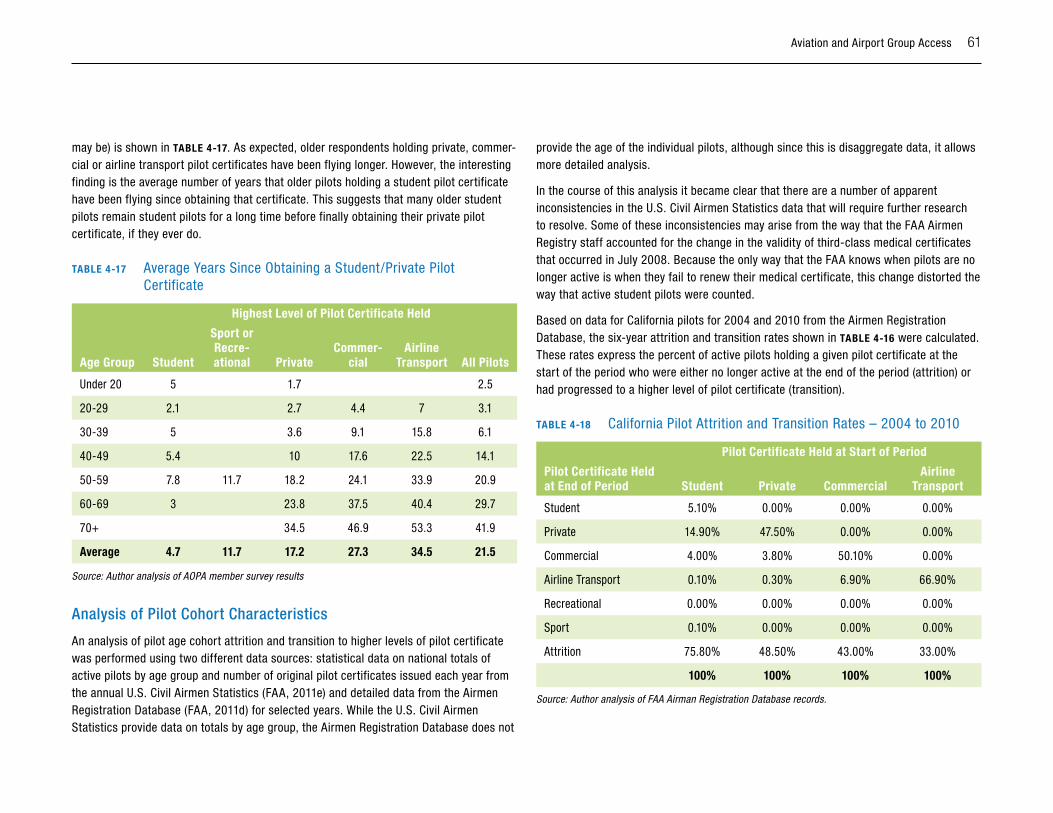
Aviation and Airport Group Access 61
may be) is shown in TABlE 4-17. As expected, older respondents holding private, commer-cial or airline transport pilot certificates have been flying longer. However, the interesting finding is the average number of years that older pilots holding a student pilot certificate have been flying since obtaining that certificate. This suggests that many older student pilots remain student pilots for a long time before finally obtaining their private pilot certificate, if they ever do.
TABlE 4-17 Average Years Since Obtaining a Student/Private Pilot Certificate
Highest level of Pilot Certificate Held
Age Group Student
Sport or Recre-ational Private
Commer-cial
Airline Transport All Pilots
Under 20 5 1.7 2.5
20-29 2.1 2.7 4.4 7 3.1
30-39 5 3.6 9.1 15.8 6.1
40-49 5.4 10 17.6 22.5 14.1
50-59 7.8 11.7 18.2 24.1 33.9 20.9
60-69 3 23.8 37.5 40.4 29.7
70+ 34.5 46.9 53.3 41.9
Average 4.7 11.7 17.2 27.3 34.5 21.5
Source: Author analysis of AOPA member survey results
Analysis of pilot Cohort Characteristics
An analysis of pilot age cohort attrition and transition to higher levels of pilot certificate was performed using two different data sources: statistical data on national totals of active pilots by age group and number of original pilot certificates issued each year from the annual U.S. Civil Airmen Statistics (FAA, 2011e) and detailed data from the Airmen Registration Database (FAA, 2011d) for selected years. While the U.S. Civil Airmen Statistics provide data on totals by age group, the Airmen Registration Database does not
provide the age of the individual pilots, although since this is disaggregate data, it allows more detailed analysis.
In the course of this analysis it became clear that there are a number of apparent inconsistencies in the U.S. Civil Airmen Statistics data that will require further research to resolve. Some of these inconsistencies may arise from the way that the FAA Airmen Registry staff accounted for the change in the validity of third-class medical certificates that occurred in July 2008. Because the only way that the FAA knows when pilots are no longer active is when they fail to renew their medical certificate, this change distorted the way that active student pilots were counted.
Based on data for California pilots for 2004 and 2010 from the Airmen Registration Database, the six-year attrition and transition rates shown in TABlE 4-16 were calculated. These rates express the percent of active pilots holding a given pilot certificate at the start of the period who were either no longer active at the end of the period (attrition) or had progressed to a higher level of pilot certificate (transition).
TABlE 4-18 California Pilot Attrition and Transition Rates – 2004 to 2010
Pilot Certificate Held at Start of Period
Pilot Certificate Held at End of Period Student Private Commercial
Airline Transport
Student 5.10% 0.00% 0.00% 0.00%
Private 14.90% 47.50% 0.00% 0.00%
Commercial 4.00% 3.80% 50.10% 0.00%
Airline Transport 0.10% 0.30% 6.90% 66.90%
Recreational 0.00% 0.00% 0.00% 0.00%
Sport 0.10% 0.00% 0.00% 0.00%
Attrition 75.80% 48.50% 43.00% 33.00%
100% 100% 100% 100%
Source: Author analysis of FAA Airman Registration Database records.
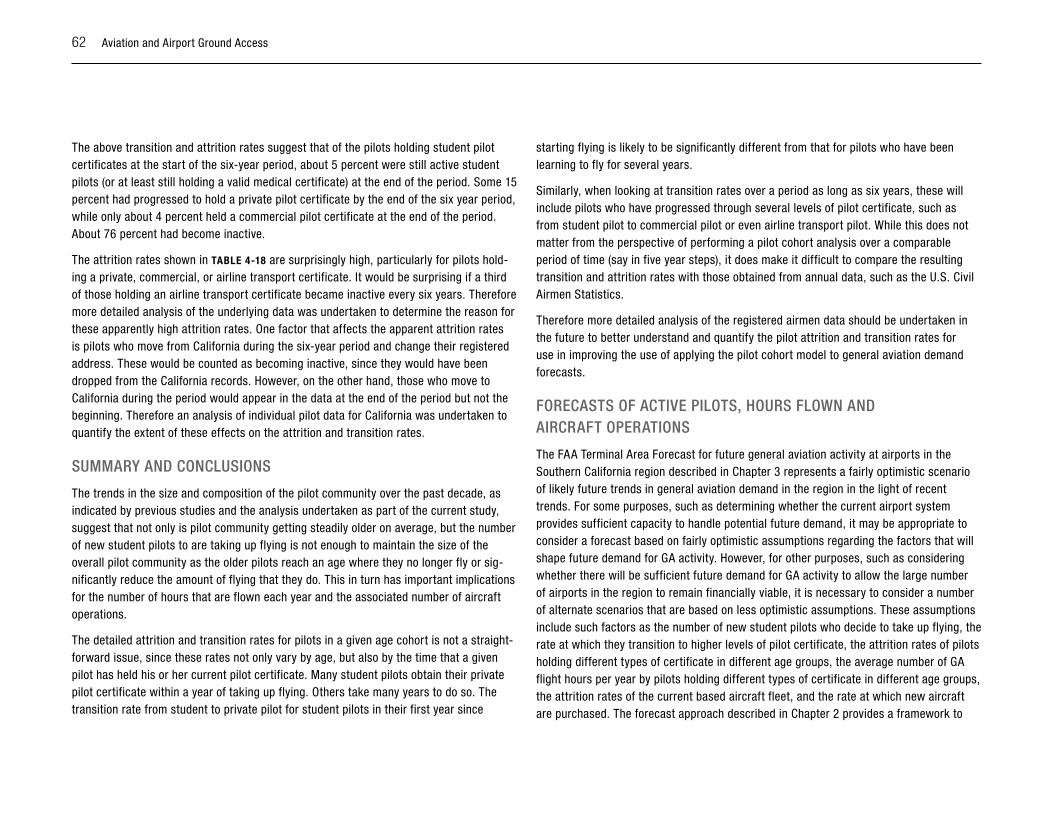
62 Aviation and Airport Ground Access
The above transition and attrition rates suggest that of the pilots holding student pilot certificates at the start of the six-year period, about 5 percent were still active student pilots (or at least still holding a valid medical certificate) at the end of the period. Some 15 percent had progressed to hold a private pilot certificate by the end of the six year period, while only about 4 percent held a commercial pilot certificate at the end of the period. About 76 percent had become inactive.
The attrition rates shown in TABlE 4-18 are surprisingly high, particularly for pilots hold-ing a private, commercial, or airline transport certificate. It would be surprising if a third of those holding an airline transport certificate became inactive every six years. Therefore more detailed analysis of the underlying data was undertaken to determine the reason for these apparently high attrition rates. One factor that affects the apparent attrition rates is pilots who move from California during the six-year period and change their registered address. These would be counted as becoming inactive, since they would have been dropped from the California records. However, on the other hand, those who move to California during the period would appear in the data at the end of the period but not the beginning. Therefore an analysis of individual pilot data for California was undertaken to quantify the extent of these effects on the attrition and transition rates.
suMMARy AnD ConClusions
The trends in the size and composition of the pilot community over the past decade, as indicated by previous studies and the analysis undertaken as part of the current study, suggest that not only is pilot community getting steadily older on average, but the number of new student pilots to are taking up flying is not enough to maintain the size of the overall pilot community as the older pilots reach an age where they no longer fly or sig-nificantly reduce the amount of flying that they do. This in turn has important implications for the number of hours that are flown each year and the associated number of aircraft operations.
The detailed attrition and transition rates for pilots in a given age cohort is not a straight-forward issue, since these rates not only vary by age, but also by the time that a given pilot has held his or her current pilot certificate. Many student pilots obtain their private pilot certificate within a year of taking up flying. Others take many years to do so. The transition rate from student to private pilot for student pilots in their first year since
starting flying is likely to be significantly different from that for pilots who have been learning to fly for several years.
Similarly, when looking at transition rates over a period as long as six years, these will include pilots who have progressed through several levels of pilot certificate, such as from student pilot to commercial pilot or even airline transport pilot. While this does not matter from the perspective of performing a pilot cohort analysis over a comparable period of time (say in five year steps), it does make it difficult to compare the resulting transition and attrition rates with those obtained from annual data, such as the U.S. Civil Airmen Statistics.
Therefore more detailed analysis of the registered airmen data should be undertaken in the future to better understand and quantify the pilot attrition and transition rates for use in improving the use of applying the pilot cohort model to general aviation demand forecasts.
FoRECAsTs oF ACTivE piloTs, houRs Flown AnD AiRCRAFT opERATions
The FAA Terminal Area Forecast for future general aviation activity at airports in the Southern California region described in Chapter 3 represents a fairly optimistic scenario of likely future trends in general aviation demand in the region in the light of recent trends. For some purposes, such as determining whether the current airport system provides sufficient capacity to handle potential future demand, it may be appropriate to consider a forecast based on fairly optimistic assumptions regarding the factors that will shape future demand for GA activity. However, for other purposes, such as considering whether there will be sufficient future demand for GA activity to allow the large number of airports in the region to remain financially viable, it is necessary to consider a number of alternate scenarios that are based on less optimistic assumptions. These assumptions include such factors as the number of new student pilots who decide to take up flying, the rate at which they transition to higher levels of pilot certificate, the attrition rates of pilots holding different types of certificate in different age groups, the average number of GA flight hours per year by pilots holding different types of certificate in different age groups, the attrition rates of the current based aircraft fleet, and the rate at which new aircraft are purchased. The forecast approach described in Chapter 2 provides a framework to
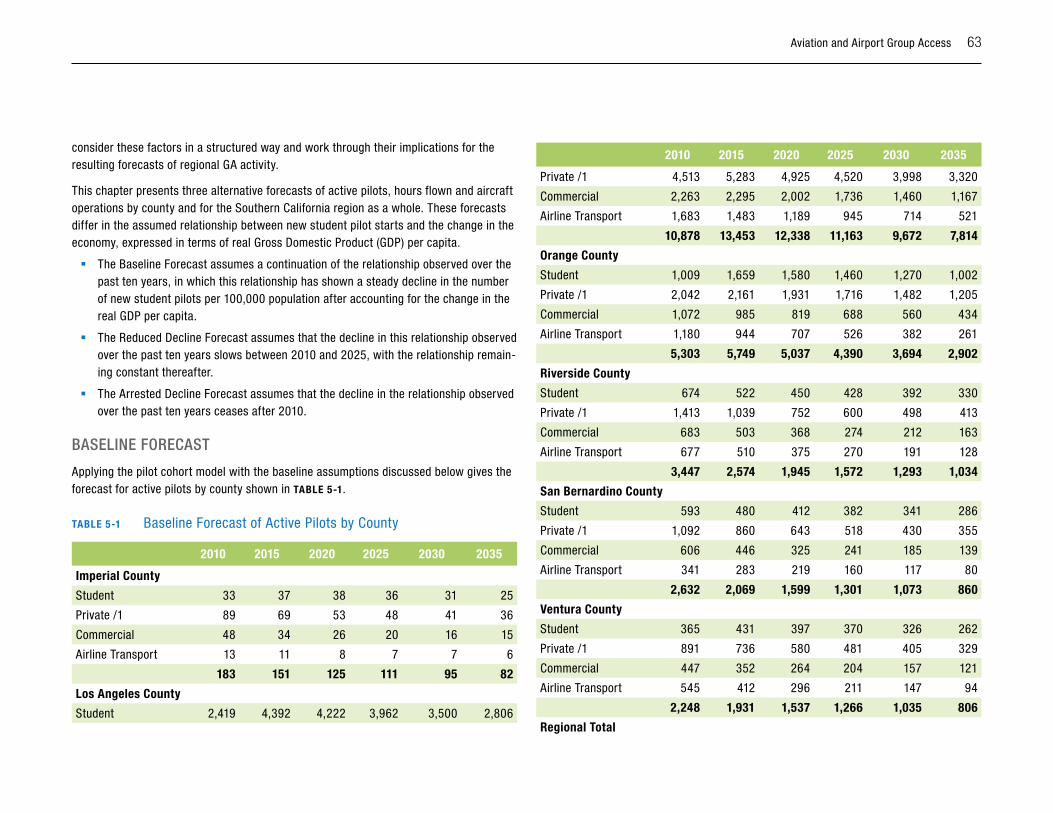
Aviation and Airport Group Access 63
consider these factors in a structured way and work through their implications for the resulting forecasts of regional GA activity.
This chapter presents three alternative forecasts of active pilots, hours flown and aircraft operations by county and for the Southern California region as a whole. These forecasts differ in the assumed relationship between new student pilot starts and the change in the economy, expressed in terms of real Gross Domestic Product (GDP) per capita.
� The Baseline Forecast assumes a continuation of the relationship observed over the past ten years, in which this relationship has shown a steady decline in the number of new student pilots per 100,000 population after accounting for the change in the real GDP per capita.
� The Reduced Decline Forecast assumes that the decline in this relationship observed over the past ten years slows between 2010 and 2025, with the relationship remain-ing constant thereafter.
� The Arrested Decline Forecast assumes that the decline in the relationship observed over the past ten years ceases after 2010.
BAsElinE FoRECAsT
Applying the pilot cohort model with the baseline assumptions discussed below gives the forecast for active pilots by county shown in TABlE 5-1.
TABlE 5-1 Baseline Forecast of Active Pilots by County
2010 2015 2020 2025 2030 2035
Imperial County
Student 33 37 38 36 31 25
Private /1 89 69 53 48 41 36
Commercial 48 34 26 20 16 15
Airline Transport 13 11 8 7 7 6
183 151 125 111 95 82
los Angeles County
Student 2,419 4,392 4,222 3,962 3,500 2,806
2010 2015 2020 2025 2030 2035
Private /1 4,513 5,283 4,925 4,520 3,998 3,320
Commercial 2,263 2,295 2,002 1,736 1,460 1,167
Airline Transport 1,683 1,483 1,189 945 714 521
10,878 13,453 12,338 11,163 9,672 7,814
Orange County
Student 1,009 1,659 1,580 1,460 1,270 1,002
Private /1 2,042 2,161 1,931 1,716 1,482 1,205
Commercial 1,072 985 819 688 560 434
Airline Transport 1,180 944 707 526 382 261
5,303 5,749 5,037 4,390 3,694 2,902
Riverside County
Student 674 522 450 428 392 330
Private /1 1,413 1,039 752 600 498 413
Commercial 683 503 368 274 212 163
Airline Transport 677 510 375 270 191 128
3,447 2,574 1,945 1,572 1,293 1,034
San Bernardino County
Student 593 480 412 382 341 286
Private /1 1,092 860 643 518 430 355
Commercial 606 446 325 241 185 139
Airline Transport 341 283 219 160 117 80
2,632 2,069 1,599 1,301 1,073 860
Ventura County
Student 365 431 397 370 326 262
Private /1 891 736 580 481 405 329
Commercial 447 352 264 204 157 121
Airline Transport 545 412 296 211 147 94
2,248 1,931 1,537 1,266 1,035 806
Regional Total
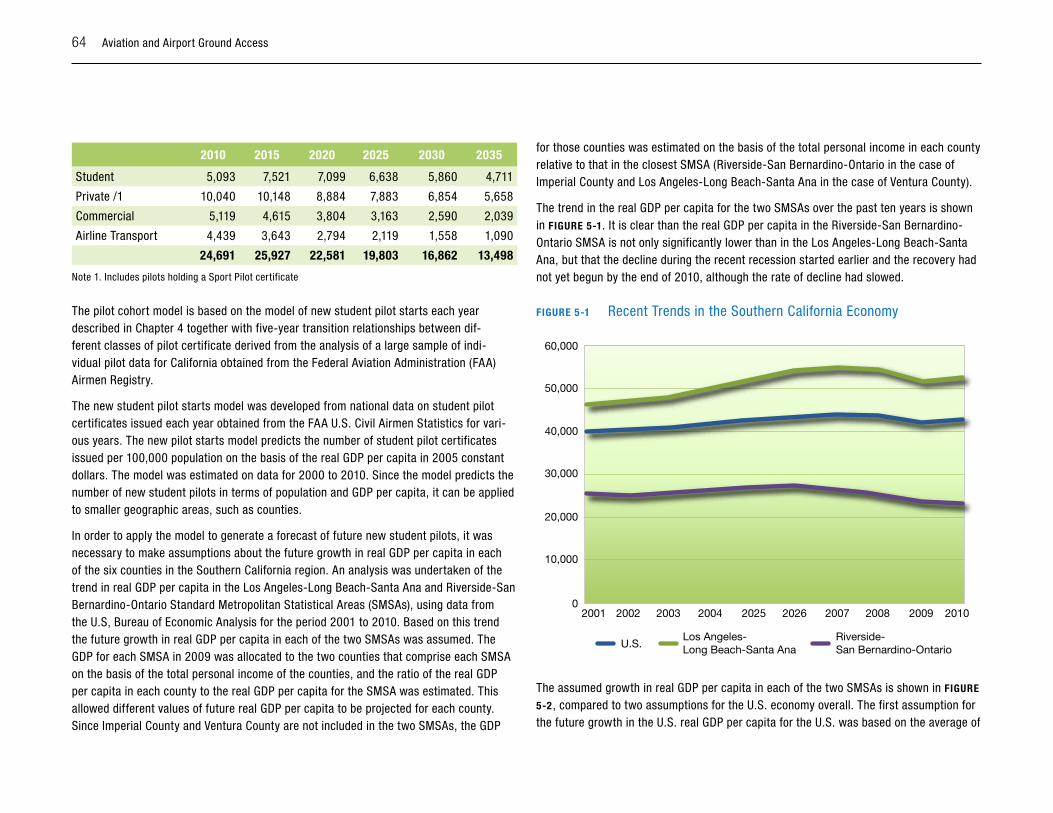
64 Aviation and Airport Ground Access
2010 2015 2020 2025 2030 2035
Student 5,093 7,521 7,099 6,638 5,860 4,711
Private /1 10,040 10,148 8,884 7,883 6,854 5,658
Commercial 5,119 4,615 3,804 3,163 2,590 2,039
Airline Transport 4,439 3,643 2,794 2,119 1,558 1,090
24,691 25,927 22,581 19,803 16,862 13,498
Note 1. Includes pilots holding a Sport Pilot certificate
The pilot cohort model is based on the model of new student pilot starts each year described in Chapter 4 together with five-year transition relationships between dif-ferent classes of pilot certificate derived from the analysis of a large sample of indi-vidual pilot data for California obtained from the Federal Aviation Administration (FAA) Airmen Registry.
The new student pilot starts model was developed from national data on student pilot certificates issued each year obtained from the FAA U.S. Civil Airmen Statistics for vari-ous years. The new pilot starts model predicts the number of student pilot certificates issued per 100,000 population on the basis of the real GDP per capita in 2005 constant dollars. The model was estimated on data for 2000 to 2010. Since the model predicts the number of new student pilots in terms of population and GDP per capita, it can be applied to smaller geographic areas, such as counties.
In order to apply the model to generate a forecast of future new student pilots, it was necessary to make assumptions about the future growth in real GDP per capita in each of the six counties in the Southern California region. An analysis was undertaken of the trend in real GDP per capita in the Los Angeles-Long Beach-Santa Ana and Riverside-San Bernardino-Ontario Standard Metropolitan Statistical Areas (SMSAs), using data from the U.S, Bureau of Economic Analysis for the period 2001 to 2010. Based on this trend the future growth in real GDP per capita in each of the two SMSAs was assumed. The GDP for each SMSA in 2009 was allocated to the two counties that comprise each SMSA on the basis of the total personal income of the counties, and the ratio of the real GDP per capita in each county to the real GDP per capita for the SMSA was estimated. This allowed different values of future real GDP per capita to be projected for each county. Since Imperial County and Ventura County are not included in the two SMSAs, the GDP
for those counties was estimated on the basis of the total personal income in each county relative to that in the closest SMSA (Riverside-San Bernardino-Ontario in the case of Imperial County and Los Angeles-Long Beach-Santa Ana in the case of Ventura County).
The trend in the real GDP per capita for the two SMSAs over the past ten years is shown in FIGuRE 5-1. It is clear than the real GDP per capita in the Riverside-San Bernardino-Ontario SMSA is not only significantly lower than in the Los Angeles-Long Beach-Santa Ana, but that the decline during the recent recession started earlier and the recovery had not yet begun by the end of 2010, although the rate of decline had slowed.
FIGuRE 5-1 Recent Trends in the Southern California Economy
60,000
50,000
40,000
30,000
20,000
10,000
02001 20032002
U.S.Riverside-San Bernardino-Ontario
Los Angeles-Long Beach-Santa Ana
2004 20262025 2007 201020092008
The assumed growth in real GDP per capita in each of the two SMSAs is shown in FIGuRE
5-2 , compared to two assumptions for the U.S. economy overall. The first assumption for the future growth in the U.S. real GDP per capita for the U.S. was based on the average of
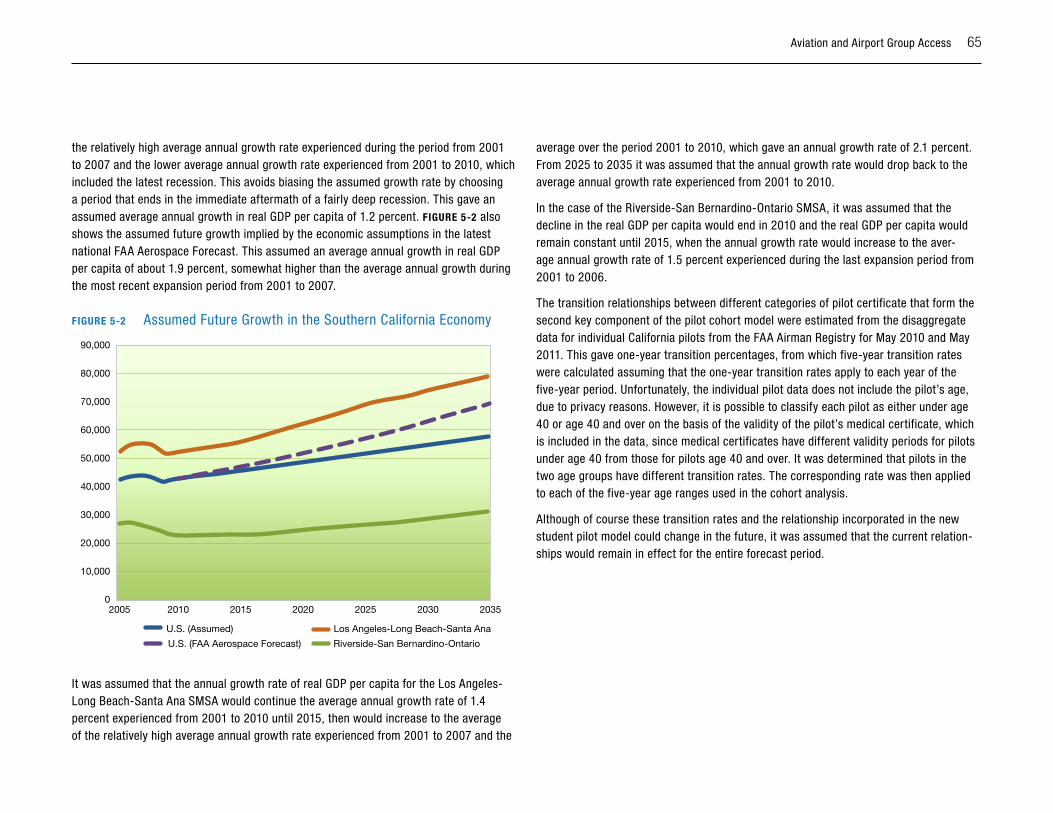
Aviation and Airport Group Access 65
the relatively high average annual growth rate experienced during the period from 2001 to 2007 and the lower average annual growth rate experienced from 2001 to 2010, which included the latest recession. This avoids biasing the assumed growth rate by choosing a period that ends in the immediate aftermath of a fairly deep recession. This gave an assumed average annual growth in real GDP per capita of 1.2 percent. FIGuRE 5-2 also shows the assumed future growth implied by the economic assumptions in the latest national FAA Aerospace Forecast. This assumed an average annual growth in real GDP per capita of about 1.9 percent, somewhat higher than the average annual growth during the most recent expansion period from 2001 to 2007.
FIGuRE 5-2 Assumed Future Growth in the Southern California Economy
90,000
80,000
70,000
40,000
50,000
60,000
30,000
20,000
10,000
02005 2010
U.S. (FAA Aerospace Forecast) Riverside-San Bernardino-Ontario
Los Angeles-Long Beach-Santa Ana
2015 2020 2025 20352030
U.S. (Assumed)
It was assumed that the annual growth rate of real GDP per capita for the Los Angeles-Long Beach-Santa Ana SMSA would continue the average annual growth rate of 1.4 percent experienced from 2001 to 2010 until 2015, then would increase to the average of the relatively high average annual growth rate experienced from 2001 to 2007 and the
average over the period 2001 to 2010, which gave an annual growth rate of 2.1 percent. From 2025 to 2035 it was assumed that the annual growth rate would drop back to the average annual growth rate experienced from 2001 to 2010.
In the case of the Riverside-San Bernardino-Ontario SMSA, it was assumed that the decline in the real GDP per capita would end in 2010 and the real GDP per capita would remain constant until 2015, when the annual growth rate would increase to the aver-age annual growth rate of 1.5 percent experienced during the last expansion period from 2001 to 2006.
The transition relationships between different categories of pilot certificate that form the second key component of the pilot cohort model were estimated from the disaggregate data for individual California pilots from the FAA Airman Registry for May 2010 and May 2011. This gave one-year transition percentages, from which five-year transition rates were calculated assuming that the one-year transition rates apply to each year of the five-year period. Unfortunately, the individual pilot data does not include the pilot’s age, due to privacy reasons. However, it is possible to classify each pilot as either under age 40 or age 40 and over on the basis of the validity of the pilot’s medical certificate, which is included in the data, since medical certificates have different validity periods for pilots under age 40 from those for pilots age 40 and over. It was determined that pilots in the two age groups have different transition rates. The corresponding rate was then applied to each of the five-year age ranges used in the cohort analysis.
Although of course these transition rates and the relationship incorporated in the new student pilot model could change in the future, it was assumed that the current relation-ships would remain in effect for the entire forecast period.
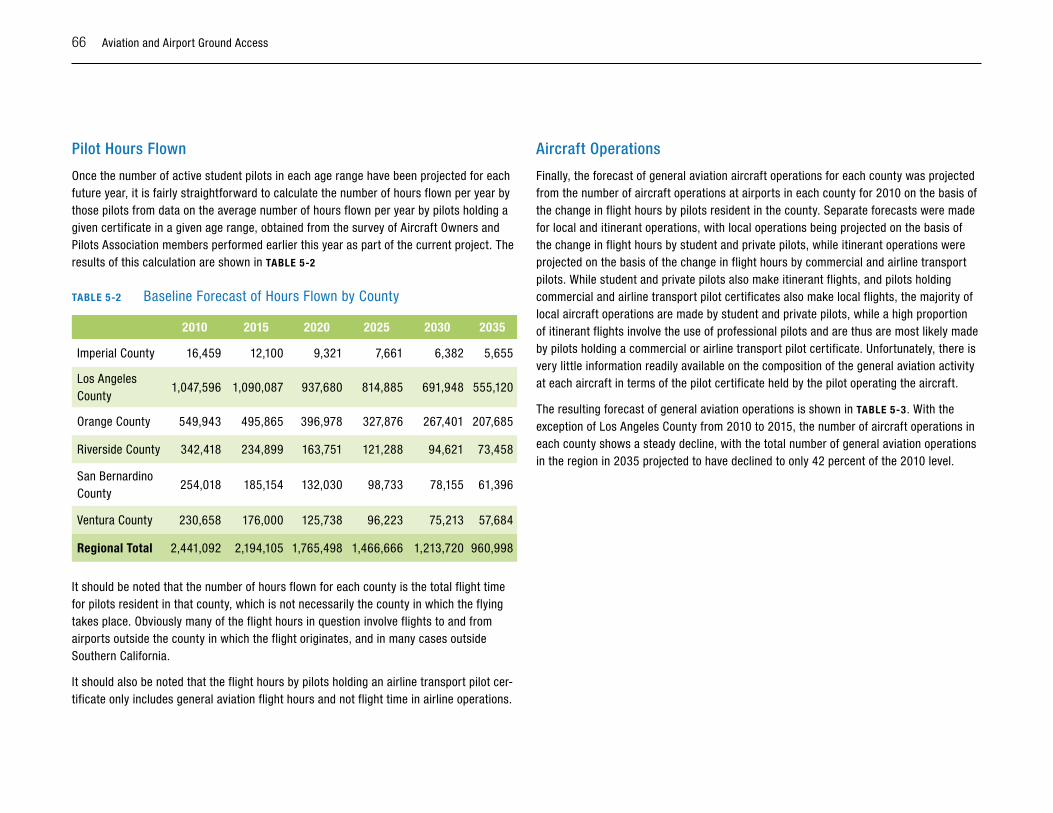
66 Aviation and Airport Ground Access
pilot hours Flown
Once the number of active student pilots in each age range have been projected for each future year, it is fairly straightforward to calculate the number of hours flown per year by those pilots from data on the average number of hours flown per year by pilots holding a given certificate in a given age range, obtained from the survey of Aircraft Owners and Pilots Association members performed earlier this year as part of the current project. The results of this calculation are shown in TABlE 5-2
TABlE 5-2 Baseline Forecast of Hours Flown by County
2010 2015 2020 2025 2030 2035
Imperial County 16,459 12,100 9,321 7,661 6,382 5,655
Los Angeles County
1,047,596 1,090,087 937,680 814,885 691,948 555,120
Orange County 549,943 495,865 396,978 327,876 267,401 207,685
Riverside County 342,418 234,899 163,751 121,288 94,621 73,458
San Bernardino County
254,018 185,154 132,030 98,733 78,155 61,396
Ventura County 230,658 176,000 125,738 96,223 75,213 57,684
Regional Total 2,441,092 2,194,105 1,765,498 1,466,666 1,213,720 960,998
It should be noted that the number of hours flown for each county is the total flight time for pilots resident in that county, which is not necessarily the county in which the flying takes place. Obviously many of the flight hours in question involve flights to and from airports outside the county in which the flight originates, and in many cases outside Southern California.
It should also be noted that the flight hours by pilots holding an airline transport pilot cer-tificate only includes general aviation flight hours and not flight time in airline operations.
Aircraft operations
Finally, the forecast of general aviation aircraft operations for each county was projected from the number of aircraft operations at airports in each county for 2010 on the basis of the change in flight hours by pilots resident in the county. Separate forecasts were made for local and itinerant operations, with local operations being projected on the basis of the change in flight hours by student and private pilots, while itinerant operations were projected on the basis of the change in flight hours by commercial and airline transport pilots. While student and private pilots also make itinerant flights, and pilots holding commercial and airline transport pilot certificates also make local flights, the majority of local aircraft operations are made by student and private pilots, while a high proportion of itinerant flights involve the use of professional pilots and are thus are most likely made by pilots holding a commercial or airline transport pilot certificate. Unfortunately, there is very little information readily available on the composition of the general aviation activity at each aircraft in terms of the pilot certificate held by the pilot operating the aircraft.
The resulting forecast of general aviation operations is shown in TABlE 5-3. With the exception of Los Angeles County from 2010 to 2015, the number of aircraft operations in each county shows a steady decline, with the total number of general aviation operations in the region in 2035 projected to have declined to only 42 percent of the 2010 level.
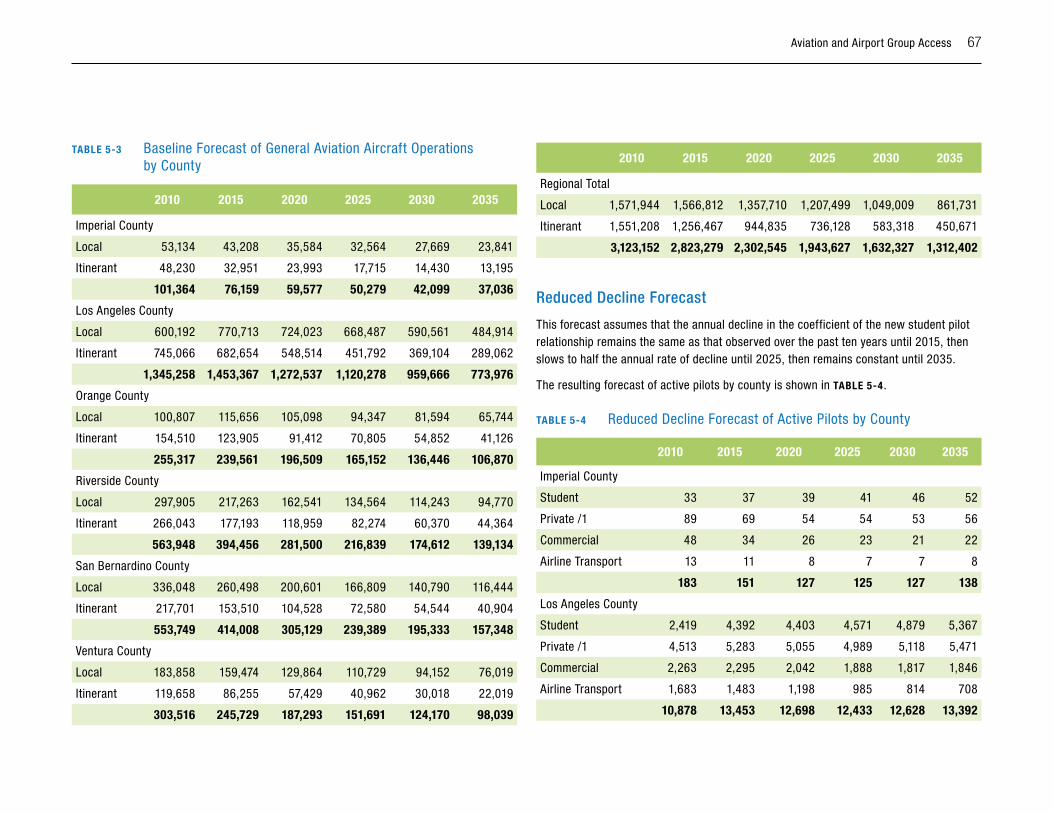
Aviation and Airport Group Access 67
TABlE 5-3 Baseline Forecast of General Aviation Aircraft Operations by County
2010 2015 2020 2025 2030 2035
Imperial County
Local 53,134 43,208 35,584 32,564 27,669 23,841
Itinerant 48,230 32,951 23,993 17,715 14,430 13,195
101,364 76,159 59,577 50,279 42,099 37,036
Los Angeles County
Local 600,192 770,713 724,023 668,487 590,561 484,914
Itinerant 745,066 682,654 548,514 451,792 369,104 289,062
1,345,258 1,453,367 1,272,537 1,120,278 959,666 773,976
Orange County
Local 100,807 115,656 105,098 94,347 81,594 65,744
Itinerant 154,510 123,905 91,412 70,805 54,852 41,126
255,317 239,561 196,509 165,152 136,446 106,870
Riverside County
Local 297,905 217,263 162,541 134,564 114,243 94,770
Itinerant 266,043 177,193 118,959 82,274 60,370 44,364
563,948 394,456 281,500 216,839 174,612 139,134
San Bernardino County
Local 336,048 260,498 200,601 166,809 140,790 116,444
Itinerant 217,701 153,510 104,528 72,580 54,544 40,904
553,749 414,008 305,129 239,389 195,333 157,348
Ventura County
Local 183,858 159,474 129,864 110,729 94,152 76,019
Itinerant 119,658 86,255 57,429 40,962 30,018 22,019
303,516 245,729 187,293 151,691 124,170 98,039
2010 2015 2020 2025 2030 2035
Regional Total
Local 1,571,944 1,566,812 1,357,710 1,207,499 1,049,009 861,731
Itinerant 1,551,208 1,256,467 944,835 736,128 583,318 450,671
3,123,152 2,823,279 2,302,545 1,943,627 1,632,327 1,312,402
Reduced Decline Forecast
This forecast assumes that the annual decline in the coefficient of the new student pilot relationship remains the same as that observed over the past ten years until 2015, then slows to half the annual rate of decline until 2025, then remains constant until 2035.
The resulting forecast of active pilots by county is shown in TABlE 5-4.
TABlE 5-4 Reduced Decline Forecast of Active Pilots by County
2010 2015 2020 2025 2030 2035
Imperial County
Student 33 37 39 41 46 52
Private /1 89 69 54 54 53 56
Commercial 48 34 26 23 21 22
Airline Transport 13 11 8 7 7 8
183 151 127 125 127 138
Los Angeles County
Student 2,419 4,392 4,403 4,571 4,879 5,367
Private /1 4,513 5,283 5,055 4,989 5,118 5,471
Commercial 2,263 2,295 2,042 1,888 1,817 1,846
Airline Transport 1,683 1,483 1,198 985 814 708
10,878 13,453 12,698 12,433 12,628 13,392

68 Aviation and Airport Ground Access
2010 2015 2020 2025 2030 2035
Orange County
Student 1,009 1,659 1,650 1,685 1,772 1,912
Private /1 2,042 2,161 1,981 1,887 1,891 1,973
Commercial 1,072 985 834 743 687 677
Airline Transport 1,180 944 712 541 417 327
5,303 5,749 5,177 4,856 4,767 4,889
Riverside County
Student 674 522 466 490 545 631
Private /1 1,413 1,039 766 650 624 664
Commercial 683 503 371 291 248 240
Airline Transport 677 510 376 273 202 150
3,447 2,574 1,979 1,704 1,619 1,685
San Bernardino County
Student 593 480 425 435 476 541
Private /1 1,092 860 653 558 538 569
Commercial 606 446 326 256 221 203
Airline Transport 341 283 219 165 124 99
2,632 2,069 1,623 1,414 1,359 1,412
Ventura County
Student 365 431 414 428 454 499
Private /1 891 736 594 527 506 527
Commercial 447 352 268 217 189 182
Airline Transport 545 412 298 215 155 109
2,248 1,931 1,574 1,387 1,304 1,317
Regional Total
Student 5,093 7,521 7,397 7,650 8,172 9,002
2010 2015 2020 2025 2030 2035
Private /1 10,040 10,148 9,103 8,665 8,730 9,260
Commercial 5,119 4,615 3,867 3,418 3,183 3,170
Airline Transport 4,439 3,643 2,811 2,186 1,719 1,401
24,691 25,927 23,178 21,919 21,804 22,833
Note 1. Includes pilots holding a Sport Pilot certificate
The revised assumptions result in a doubling in the number of active student pilots in Los Angeles and Orange Counties by 2035, with a more modest growth in Ventura County. Active student pilots in Riverside and San Bernardino Counties decline from 2010 to 2020, then increase to levels in 2035 slightly below those of 2010. There is a modest increase in active private pilots in Los Angeles County from 2010 to 2035, but otherwise active private, commercial and airline transport pilots decline in all counties.
The effect of this is to give an increase in total active pilots in Los Angeles County from 2010 to 2035, with a decline in all the other counties. For the region as a whole, total active pilots decline by about 7.5 percent from 2010 to 2035.
piloT houRs Flown
The corresponding forecast for pilot hours flown is shown in TABlE 5-5.
AiRCRAFT opERATions
The resulting forecast of aircraft operations is shown in TABlE 5-6. The revised assump-tions result in a decline in the number of aircraft operations in all counties from 2010 to 2035 by about 30 percent. The decline is obviously less in Los Angeles County, due to the greater increase in active student pilots, where aircraft operations decline by only about 3 percent from 2010 to 2035.
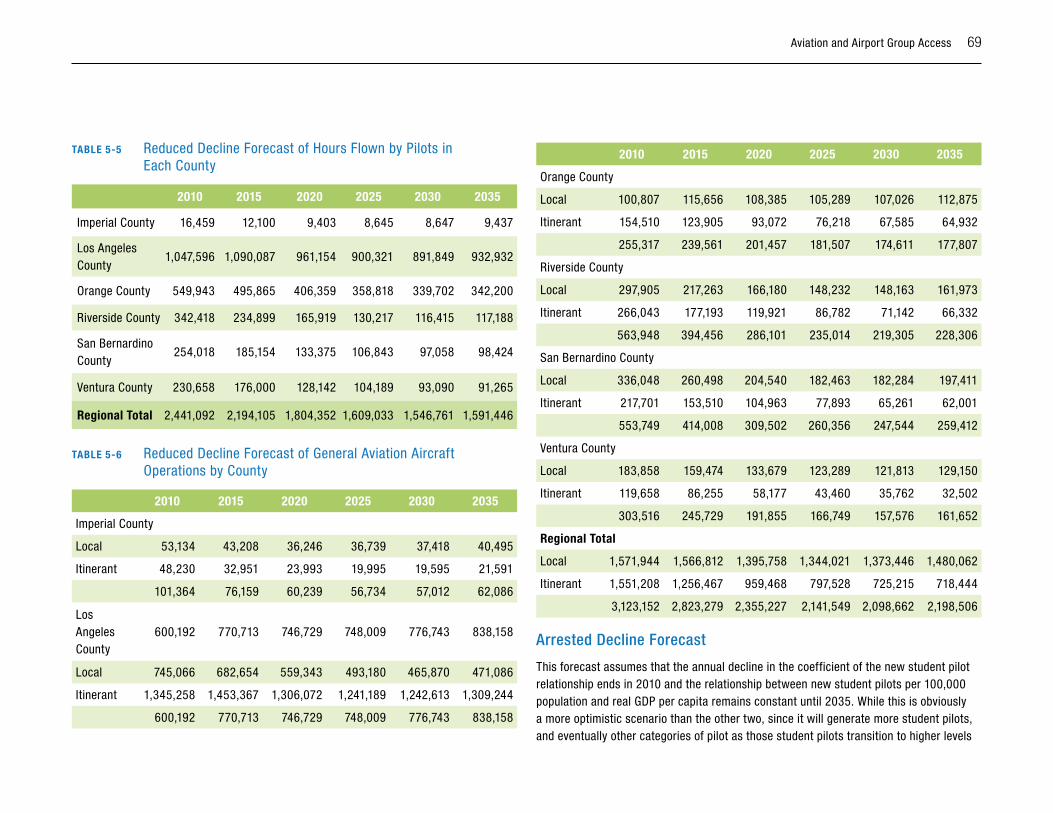
Aviation and Airport Group Access 69
TABlE 5-5 Reduced Decline Forecast of Hours Flown by Pilots in Each County
2010 2015 2020 2025 2030 2035
Imperial County 16,459 12,100 9,403 8,645 8,647 9,437
Los Angeles County
1,047,596 1,090,087 961,154 900,321 891,849 932,932
Orange County 549,943 495,865 406,359 358,818 339,702 342,200
Riverside County 342,418 234,899 165,919 130,217 116,415 117,188
San Bernardino County
254,018 185,154 133,375 106,843 97,058 98,424
Ventura County 230,658 176,000 128,142 104,189 93,090 91,265
Regional Total 2,441,092 2,194,105 1,804,352 1,609,033 1,546,761 1,591,446
TABlE 5-6 Reduced Decline Forecast of General Aviation Aircraft Operations by County
2010 2015 2020 2025 2030 2035
Imperial County
Local 53,134 43,208 36,246 36,739 37,418 40,495
Itinerant 48,230 32,951 23,993 19,995 19,595 21,591
101,364 76,159 60,239 56,734 57,012 62,086
Los Angeles County
600,192 770,713 746,729 748,009 776,743 838,158
Local 745,066 682,654 559,343 493,180 465,870 471,086
Itinerant 1,345,258 1,453,367 1,306,072 1,241,189 1,242,613 1,309,244
600,192 770,713 746,729 748,009 776,743 838,158
2010 2015 2020 2025 2030 2035
Orange County
Local 100,807 115,656 108,385 105,289 107,026 112,875
Itinerant 154,510 123,905 93,072 76,218 67,585 64,932
255,317 239,561 201,457 181,507 174,611 177,807
Riverside County
Local 297,905 217,263 166,180 148,232 148,163 161,973
Itinerant 266,043 177,193 119,921 86,782 71,142 66,332
563,948 394,456 286,101 235,014 219,305 228,306
San Bernardino County
Local 336,048 260,498 204,540 182,463 182,284 197,411
Itinerant 217,701 153,510 104,963 77,893 65,261 62,001
553,749 414,008 309,502 260,356 247,544 259,412
Ventura County
Local 183,858 159,474 133,679 123,289 121,813 129,150
Itinerant 119,658 86,255 58,177 43,460 35,762 32,502
303,516 245,729 191,855 166,749 157,576 161,652
Regional Total
Local 1,571,944 1,566,812 1,395,758 1,344,021 1,373,446 1,480,062
Itinerant 1,551,208 1,256,467 959,468 797,528 725,215 718,444
3,123,152 2,823,279 2,355,227 2,141,549 2,098,662 2,198,506
Arrested Decline Forecast
This forecast assumes that the annual decline in the coefficient of the new student pilot relationship ends in 2010 and the relationship between new student pilots per 100,000 population and real GDP per capita remains constant until 2035. While this is obviously a more optimistic scenario than the other two, since it will generate more student pilots, and eventually other categories of pilot as those student pilots transition to higher levels
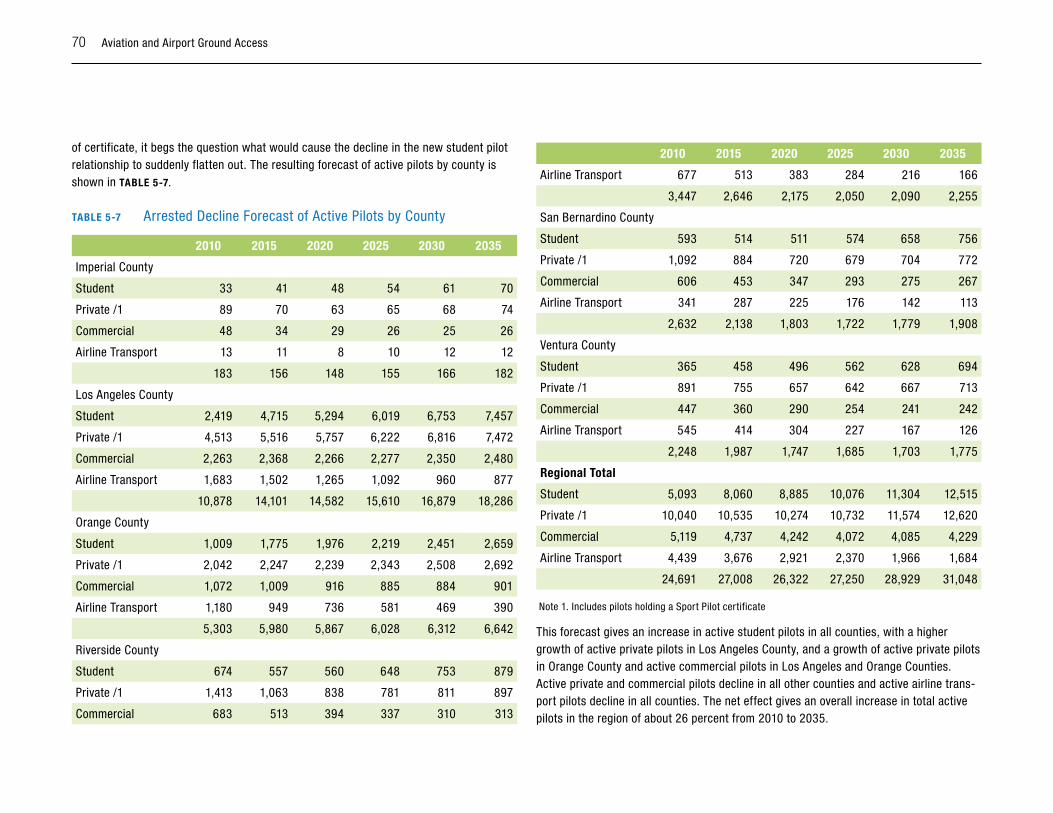
70 Aviation and Airport Ground Access
of certificate, it begs the question what would cause the decline in the new student pilot relationship to suddenly flatten out. The resulting forecast of active pilots by county is shown in TABlE 5-7.
TABlE 5-7 Arrested Decline Forecast of Active Pilots by County
2010 2015 2020 2025 2030 2035
Imperial County
Student 33 41 48 54 61 70
Private /1 89 70 63 65 68 74
Commercial 48 34 29 26 25 26
Airline Transport 13 11 8 10 12 12
183 156 148 155 166 182
Los Angeles County
Student 2,419 4,715 5,294 6,019 6,753 7,457
Private /1 4,513 5,516 5,757 6,222 6,816 7,472
Commercial 2,263 2,368 2,266 2,277 2,350 2,480
Airline Transport 1,683 1,502 1,265 1,092 960 877
10,878 14,101 14,582 15,610 16,879 18,286
Orange County
Student 1,009 1,775 1,976 2,219 2,451 2,659
Private /1 2,042 2,247 2,239 2,343 2,508 2,692
Commercial 1,072 1,009 916 885 884 901
Airline Transport 1,180 949 736 581 469 390
5,303 5,980 5,867 6,028 6,312 6,642
Riverside County
Student 674 557 560 648 753 879
Private /1 1,413 1,063 838 781 811 897
Commercial 683 513 394 337 310 313
2010 2015 2020 2025 2030 2035
Airline Transport 677 513 383 284 216 166
3,447 2,646 2,175 2,050 2,090 2,255
San Bernardino County
Student 593 514 511 574 658 756
Private /1 1,092 884 720 679 704 772
Commercial 606 453 347 293 275 267
Airline Transport 341 287 225 176 142 113
2,632 2,138 1,803 1,722 1,779 1,908
Ventura County
Student 365 458 496 562 628 694
Private /1 891 755 657 642 667 713
Commercial 447 360 290 254 241 242
Airline Transport 545 414 304 227 167 126
2,248 1,987 1,747 1,685 1,703 1,775
Regional Total
Student 5,093 8,060 8,885 10,076 11,304 12,515
Private /1 10,040 10,535 10,274 10,732 11,574 12,620
Commercial 5,119 4,737 4,242 4,072 4,085 4,229
Airline Transport 4,439 3,676 2,921 2,370 1,966 1,684
24,691 27,008 26,322 27,250 28,929 31,048
Note 1. Includes pilots holding a Sport Pilot certificate
This forecast gives an increase in active student pilots in all counties, with a higher growth of active private pilots in Los Angeles County, and a growth of active private pilots in Orange County and active commercial pilots in Los Angeles and Orange Counties. Active private and commercial pilots decline in all other counties and active airline trans-port pilots decline in all counties. The net effect gives an overall increase in total active pilots in the region of about 26 percent from 2010 to 2035.
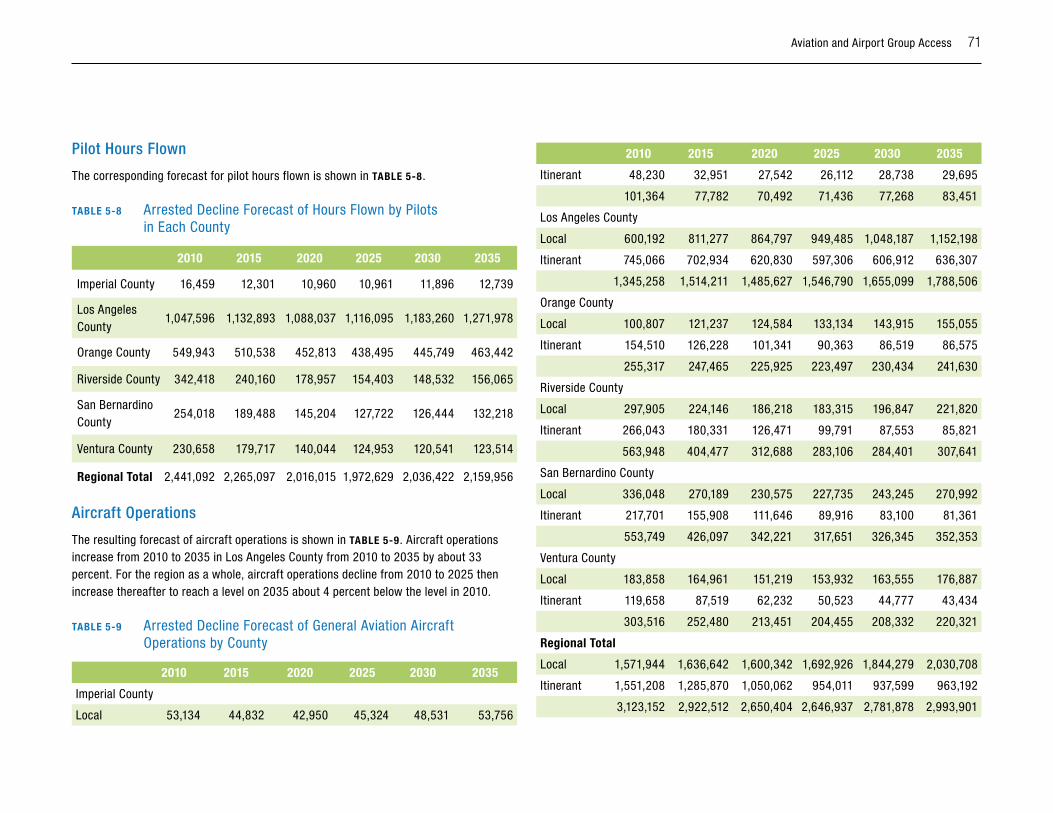
Aviation and Airport Group Access 71
pilot hours Flown
The corresponding forecast for pilot hours flown is shown in TABlE 5-8.
TABlE 5-8 Arrested Decline Forecast of Hours Flown by Pilots in Each County
2010 2015 2020 2025 2030 2035
Imperial County 16,459 12,301 10,960 10,961 11,896 12,739
Los Angeles County
1,047,596 1,132,893 1,088,037 1,116,095 1,183,260 1,271,978
Orange County 549,943 510,538 452,813 438,495 445,749 463,442
Riverside County 342,418 240,160 178,957 154,403 148,532 156,065
San Bernardino County
254,018 189,488 145,204 127,722 126,444 132,218
Ventura County 230,658 179,717 140,044 124,953 120,541 123,514
Regional Total 2,441,092 2,265,097 2,016,015 1,972,629 2,036,422 2,159,956
Aircraft operations
The resulting forecast of aircraft operations is shown in TABlE 5-9. Aircraft operations increase from 2010 to 2035 in Los Angeles County from 2010 to 2035 by about 33 percent. For the region as a whole, aircraft operations decline from 2010 to 2025 then increase thereafter to reach a level on 2035 about 4 percent below the level in 2010.
TABlE 5-9 Arrested Decline Forecast of General Aviation Aircraft Operations by County
2010 2015 2020 2025 2030 2035
Imperial County
Local 53,134 44,832 42,950 45,324 48,531 53,756
2010 2015 2020 2025 2030 2035
Itinerant 48,230 32,951 27,542 26,112 28,738 29,695
101,364 77,782 70,492 71,436 77,268 83,451
Los Angeles County
Local 600,192 811,277 864,797 949,485 1,048,187 1,152,198
Itinerant 745,066 702,934 620,830 597,306 606,912 636,307
1,345,258 1,514,211 1,485,627 1,546,790 1,655,099 1,788,506
Orange County
Local 100,807 121,237 124,584 133,134 143,915 155,055
Itinerant 154,510 126,228 101,341 90,363 86,519 86,575
255,317 247,465 225,925 223,497 230,434 241,630
Riverside County
Local 297,905 224,146 186,218 183,315 196,847 221,820
Itinerant 266,043 180,331 126,471 99,791 87,553 85,821
563,948 404,477 312,688 283,106 284,401 307,641
San Bernardino County
Local 336,048 270,189 230,575 227,735 243,245 270,992
Itinerant 217,701 155,908 111,646 89,916 83,100 81,361
553,749 426,097 342,221 317,651 326,345 352,353
Ventura County
Local 183,858 164,961 151,219 153,932 163,555 176,887
Itinerant 119,658 87,519 62,232 50,523 44,777 43,434
303,516 252,480 213,451 204,455 208,332 220,321
Regional Total
Local 1,571,944 1,636,642 1,600,342 1,692,926 1,844,279 2,030,708
Itinerant 1,551,208 1,285,870 1,050,062 954,011 937,599 963,192
3,123,152 2,922,512 2,650,404 2,646,937 2,781,878 2,993,901
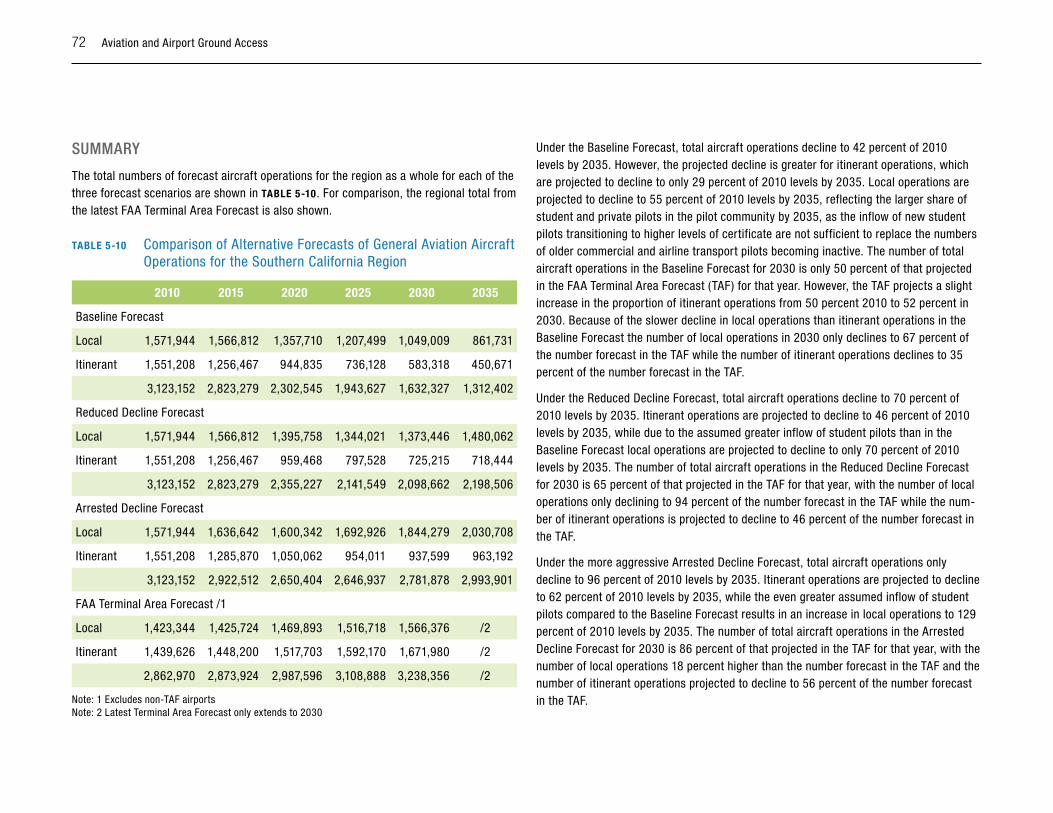
72 Aviation and Airport Ground Access
suMMARy
The total numbers of forecast aircraft operations for the region as a whole for each of the three forecast scenarios are shown in TABlE 5-10. For comparison, the regional total from the latest FAA Terminal Area Forecast is also shown.
TABlE 5-10 Comparison of Alternative Forecasts of General Aviation Aircraft Operations for the Southern California Region
2010 2015 2020 2025 2030 2035
Baseline Forecast
Local 1,571,944 1,566,812 1,357,710 1,207,499 1,049,009 861,731
Itinerant 1,551,208 1,256,467 944,835 736,128 583,318 450,671
3,123,152 2,823,279 2,302,545 1,943,627 1,632,327 1,312,402
Reduced Decline Forecast
Local 1,571,944 1,566,812 1,395,758 1,344,021 1,373,446 1,480,062
Itinerant 1,551,208 1,256,467 959,468 797,528 725,215 718,444
3,123,152 2,823,279 2,355,227 2,141,549 2,098,662 2,198,506
Arrested Decline Forecast
Local 1,571,944 1,636,642 1,600,342 1,692,926 1,844,279 2,030,708
Itinerant 1,551,208 1,285,870 1,050,062 954,011 937,599 963,192
3,123,152 2,922,512 2,650,404 2,646,937 2,781,878 2,993,901
FAA Terminal Area Forecast /1
Local 1,423,344 1,425,724 1,469,893 1,516,718 1,566,376 /2
Itinerant 1,439,626 1,448,200 1,517,703 1,592,170 1,671,980 /2
2,862,970 2,873,924 2,987,596 3,108,888 3,238,356 /2
Note: 1 Excludes non-TAF airports Note: 2 Latest Terminal Area Forecast only extends to 2030
Under the Baseline Forecast, total aircraft operations decline to 42 percent of 2010 levels by 2035. However, the projected decline is greater for itinerant operations, which are projected to decline to only 29 percent of 2010 levels by 2035. Local operations are projected to decline to 55 percent of 2010 levels by 2035, reflecting the larger share of student and private pilots in the pilot community by 2035, as the inflow of new student pilots transitioning to higher levels of certificate are not sufficient to replace the numbers of older commercial and airline transport pilots becoming inactive. The number of total aircraft operations in the Baseline Forecast for 2030 is only 50 percent of that projected in the FAA Terminal Area Forecast (TAF) for that year. However, the TAF projects a slight increase in the proportion of itinerant operations from 50 percent 2010 to 52 percent in 2030. Because of the slower decline in local operations than itinerant operations in the Baseline Forecast the number of local operations in 2030 only declines to 67 percent of the number forecast in the TAF while the number of itinerant operations declines to 35 percent of the number forecast in the TAF.
Under the Reduced Decline Forecast, total aircraft operations decline to 70 percent of 2010 levels by 2035. Itinerant operations are projected to decline to 46 percent of 2010 levels by 2035, while due to the assumed greater inflow of student pilots than in the Baseline Forecast local operations are projected to decline to only 70 percent of 2010 levels by 2035. The number of total aircraft operations in the Reduced Decline Forecast for 2030 is 65 percent of that projected in the TAF for that year, with the number of local operations only declining to 94 percent of the number forecast in the TAF while the num-ber of itinerant operations is projected to decline to 46 percent of the number forecast in the TAF.
Under the more aggressive Arrested Decline Forecast, total aircraft operations only decline to 96 percent of 2010 levels by 2035. Itinerant operations are projected to decline to 62 percent of 2010 levels by 2035, while the even greater assumed inflow of student pilots compared to the Baseline Forecast results in an increase in local operations to 129 percent of 2010 levels by 2035. The number of total aircraft operations in the Arrested Decline Forecast for 2030 is 86 percent of that projected in the TAF for that year, with the number of local operations 18 percent higher than the number forecast in the TAF and the number of itinerant operations projected to decline to 56 percent of the number forecast in the TAF.
Aviation and Airport Group Access 73
It should be noted that the greater decline in forecast itinerant operations compared to local operations in all three forecast scenarios is a consequence of the interaction of two effects:
� The more rapid forecast decline in the number of active commercial and airline transport pilots compared to student and private pilots
� The assumption that the change in the number of local operations is proportional to the change in hours flown by student and private pilots, while the change in the number of itinerant operations is proportional to the change in the hours flown by commercial and airline transport pilots.
However the first result could change if the demand for commercial pilots in the general aviation sector (some of whom are required by their employers to hold an airline transport pilot certificate) causes a higher proportion of student and private pilots to transition to higher levels of pilot certificate. A shortage of commercial pilots could also cause those commercial pilots who are active to fly more, leading to an increase in flight hours by commercial and airline transport pilots and the associated aircraft operations.
Since student and private pilots do perform itinerant operation as well as local operations, although typically not as many, an increase in the proportion of student and private pilots relative to commercial and airline transport pilots should contribute to an increase in the number of itinerant operations, rather than these being determined solely by the change in the number of flight hours by commercial and airline transport pilots. Further research is needed to better understand the relative proportions of local and itinerant operations flown by pilots holding different levels of pilot certificate, as well as any trends in these proportions over time.
Forecasts of Based Aircraft and Associated Aircraft operationsThe forecasts of active pilots in Southern California and the hours flown by those pilots provides one perspective on the future levels of general aviation activity in the region. However, the size and composition of the based aircraft is only indirectly related to the level of flying activity. Aircraft do not disappear when the amount of flying declines; rather they tend to be flown less and the percentage of the fleet that is inactive increases. Even so, some new aircraft will be added to the fleet each year and some aircraft will be sold
and relocated outside the region, or even outside the country. Eventually older aircraft that are no longer airworthy or no longer economic to maintain and operate will be sold or scrapped. From the perspective of the Southern California based aircraft fleet, it does not matter whether an aircraft is sold to a new owner located outside the region or scrapped. In any year there will of course be some used aircraft that are purchased by new owners in Southern California and imported into the region. Therefore what matters is the net attrition of aircraft of a given age due to the balance between those aircraft that are sold and exported from the region or scrapped and the addition of used aircraft that are imported in to the region from elsewhere.
Thus a forecast of the potential size and composition of the future based aircraft fleet in the region can be developed by considering the net attrition rate of the current aircraft fleet and the future addition of newly manufactured aircraft to the fleet.
AppRoACh
The based aircraft forecast is based on the list of registered aircraft in each county for 2010 prepared by the County Assessor and obtained from the California Department of Transportation, Division of Aeronautics. The County Assessor record for each aircraft includes the Federal Aviation Administration (FAA) aircraft registration number (tail number) and in principle includes the year of manufacture and the aircraft make and model. However, the year of manufacture is missing for many records and the terminology used for the aircraft make and model are not standardized, making it extremely difficult to classify each aircraft into a consistent set of aircraft categories. Therefore additional data for each aircraft was obtained from the FAA Aircraft Registration Database using the aircraft tail number to search for the aircraft in the FAA data. The additional data included the aircraft type (fixed-wing, rotorcraft, etc.), number of engines, and type of engines, as well as the year of manufacture.
This allowed each aircraft in the County Assessor data to be classified into the following categories:
� Single-engine piston (SEP)
� Single-engine turboprop (SET)
� Multi-engine piston (MEP)
� Multi-engine turboprop (MET)
74 Aviation and Airport Ground Access
� Jet aircraft (JET)
� Helicopter (HELI)
� Glider (GLI)
� Balloon (BAL)
� Other (OTH)
In addition missing data on the year of manufacture in the County Assessor records was filled in where possible from the FAA aircraft registration data. Many of the FAA records are also missing the year of manufacture, but with some effort this could be determined in many cases from other data in the FAA aircraft registration record, such as the airwor-thiness date, the date when the aircraft was first certificated, or the serial number of the aircraft. Aircraft manufacturers generally assign serial numbers for each aircraft model sequentially, so the year of manufacture can be determined from that for other aircraft of the same model with adjacent serial numbers for which the year of manufacture is given.
A number of aircraft records in the County Assessor data turned out to be duplicate entries for the same aircraft, such as cases where an aircraft had been assigned a new tail number after a sale. Quite a few of the aircraft in the County Assessor data did not appear in the FAA database of currently registered aircraft. Further investigation estab-lished that these were often explained by the following situations:
� The aircraft had been exported or sold to a new owner who had registered the aircraft under a different tail number
� The aircraft owner had cancelled the registration, presumably because the aircraft was no longer being used
� The aircraft tail number had been issued to an owner who was building a homebuilt aircraft which had not yet been registered (presumably because it was still under construction)
Based Aircraft Forecast Methodology
The forecast of based aircraft needs to consider two effects. The first is the attrition of the current (2010) based aircraft fleet over time. The second is the addition of new air-craft to the fleet in the future. Those aircraft will also experience attrition over the period of the forecast. Therefore the forecast requires two sets of assumptions:
1. An attrition function that predicts the percentage of aircraft in the based aircraft fleet in a given year that will remain in the fleet one year later.
2. The number of aircraft of each type that will enter the fleet in each future year.
Given these two sets of assumptions, it is a fairly simple matter to calculate the change in the size of the based aircraft fleet over time. However, neither assumption is a simple matter, since both the attrition rate and the rate of new aircraft entering the fleet are likely to change over time in response to changing conditions in the general aviation sector.
For the purposes of the current forecasts, the aircraft fleet attrition relationship devel-oped in a study for the FAA by Optimum Computer Systems, Inc. (OCS) in the mid 1970s (Rocks, 1976) has been adopted. While this study is now somewhat dated, the underly-ing factors that determine the rate at which aircraft are withdrawn from the aircraft fleet may not have changed that much over the past 35 years, although this is a subject that is deserving of future research. The attrition relationship developed in the OCS report expresses the attrition rate per year as a function of the age of the aircraft. This attrition rate initially increases as the aircraft becomes older, reaching a maximum of 2.7 percent per year at 18 years, then declining in subsequent years to a rate of 1.75 percent per year at 25 years. Unfortunately, the OCS study did not analyze the change in attrition rates for aircraft older than 25 years, but simply grouped all aircraft older than 25 years into a single category for which they suggested an attrition rate of 1.0 percent per year.
This is potentially problematical for developing forecasts of the based aircraft fleet from 2010 to 2035, since a large proportion of the aircraft fleet is already well over 30 years old, and by 2035 the majority of these aircraft (if they are still in service) will be over 60 years old. However, the annual FAA General Aviation and Part 135 Activity Survey (FAA, 2011c) provides estimates of the number of registered and active aircraft in five-year age ranges for aircraft 60 years old or less, with older aircraft grouped into a single category. It is apparent from these data that attrition of older aircraft from the fleet does indeed occur at about 1 percent per year. However, the percent of the registered aircraft fleet that was reported as being actively flown reduces steadily with age, as shown in FIGuRE 6-1. The trend shown in Figure 6-1 points out the need to distinguish between registered aircraft and active aircraft in forecasting based aircraft, since registered aircraft determine the size of the based aircraft fleet, while the number of active aircraft determines how much flying those aircraft do.
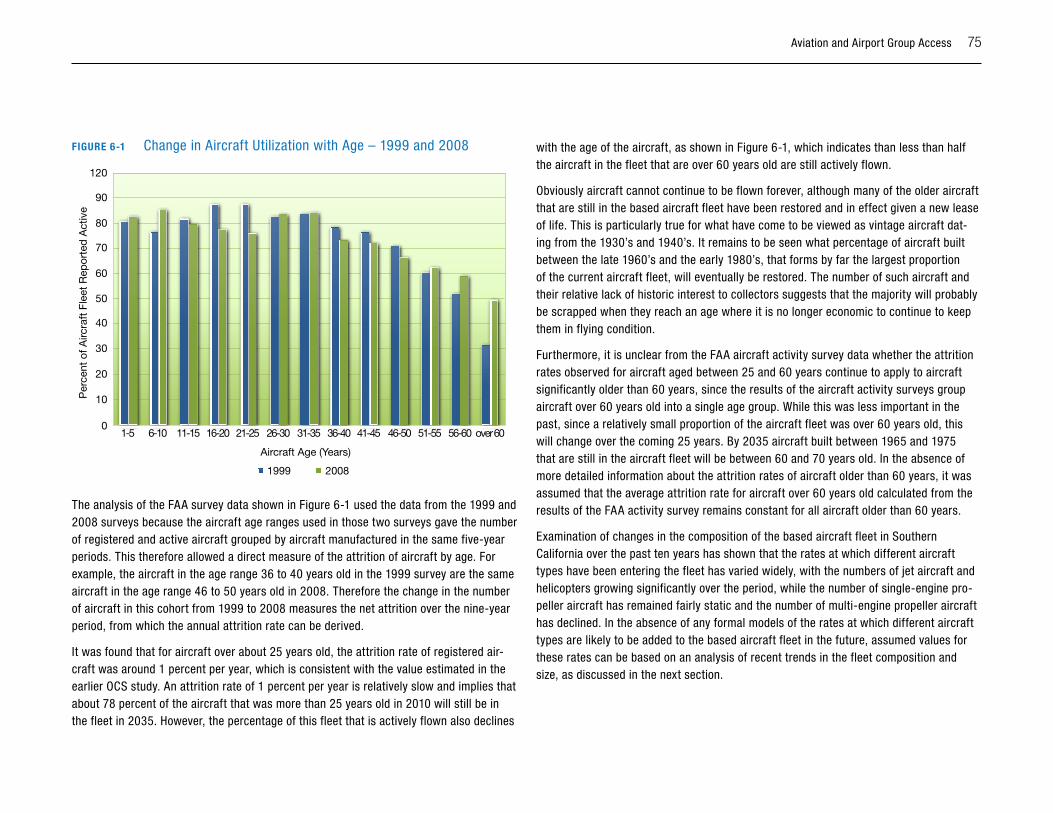
Aviation and Airport Group Access 75
FIGuRE 6-1 Change in Aircraft Utilization with Age – 1999 and 2008
120
90
80
70
60
40
50
30
20
10
01-5 6-10
Aircraft Age (Years)
Per
cent
of A
ircra
ft F
leet
Rep
orte
d A
ctiv
e
11-15 16-20 21-25 26-30 31-35 36-40 41-45 46-50 51-55 56-60 over 60
1999 2008
The analysis of the FAA survey data shown in Figure 6-1 used the data from the 1999 and 2008 surveys because the aircraft age ranges used in those two surveys gave the number of registered and active aircraft grouped by aircraft manufactured in the same five-year periods. This therefore allowed a direct measure of the attrition of aircraft by age. For example, the aircraft in the age range 36 to 40 years old in the 1999 survey are the same aircraft in the age range 46 to 50 years old in 2008. Therefore the change in the number of aircraft in this cohort from 1999 to 2008 measures the net attrition over the nine-year period, from which the annual attrition rate can be derived.
It was found that for aircraft over about 25 years old, the attrition rate of registered air-craft was around 1 percent per year, which is consistent with the value estimated in the earlier OCS study. An attrition rate of 1 percent per year is relatively slow and implies that about 78 percent of the aircraft that was more than 25 years old in 2010 will still be in the fleet in 2035. However, the percentage of this fleet that is actively flown also declines
with the age of the aircraft, as shown in Figure 6-1, which indicates than less than half the aircraft in the fleet that are over 60 years old are still actively flown.
Obviously aircraft cannot continue to be flown forever, although many of the older aircraft that are still in the based aircraft fleet have been restored and in effect given a new lease of life. This is particularly true for what have come to be viewed as vintage aircraft dat-ing from the 1930’s and 1940’s. It remains to be seen what percentage of aircraft built between the late 1960’s and the early 1980’s, that forms by far the largest proportion of the current aircraft fleet, will eventually be restored. The number of such aircraft and their relative lack of historic interest to collectors suggests that the majority will probably be scrapped when they reach an age where it is no longer economic to continue to keep them in flying condition.
Furthermore, it is unclear from the FAA aircraft activity survey data whether the attrition rates observed for aircraft aged between 25 and 60 years continue to apply to aircraft significantly older than 60 years, since the results of the aircraft activity surveys group aircraft over 60 years old into a single age group. While this was less important in the past, since a relatively small proportion of the aircraft fleet was over 60 years old, this will change over the coming 25 years. By 2035 aircraft built between 1965 and 1975 that are still in the aircraft fleet will be between 60 and 70 years old. In the absence of more detailed information about the attrition rates of aircraft older than 60 years, it was assumed that the average attrition rate for aircraft over 60 years old calculated from the results of the FAA activity survey remains constant for all aircraft older than 60 years.
Examination of changes in the composition of the based aircraft fleet in Southern California over the past ten years has shown that the rates at which different aircraft types have been entering the fleet has varied widely, with the numbers of jet aircraft and helicopters growing significantly over the period, while the number of single-engine pro-peller aircraft has remained fairly static and the number of multi-engine propeller aircraft has declined. In the absence of any formal models of the rates at which different aircraft types are likely to be added to the based aircraft fleet in the future, assumed values for these rates can be based on an analysis of recent trends in the fleet composition and size, as discussed in the next section.
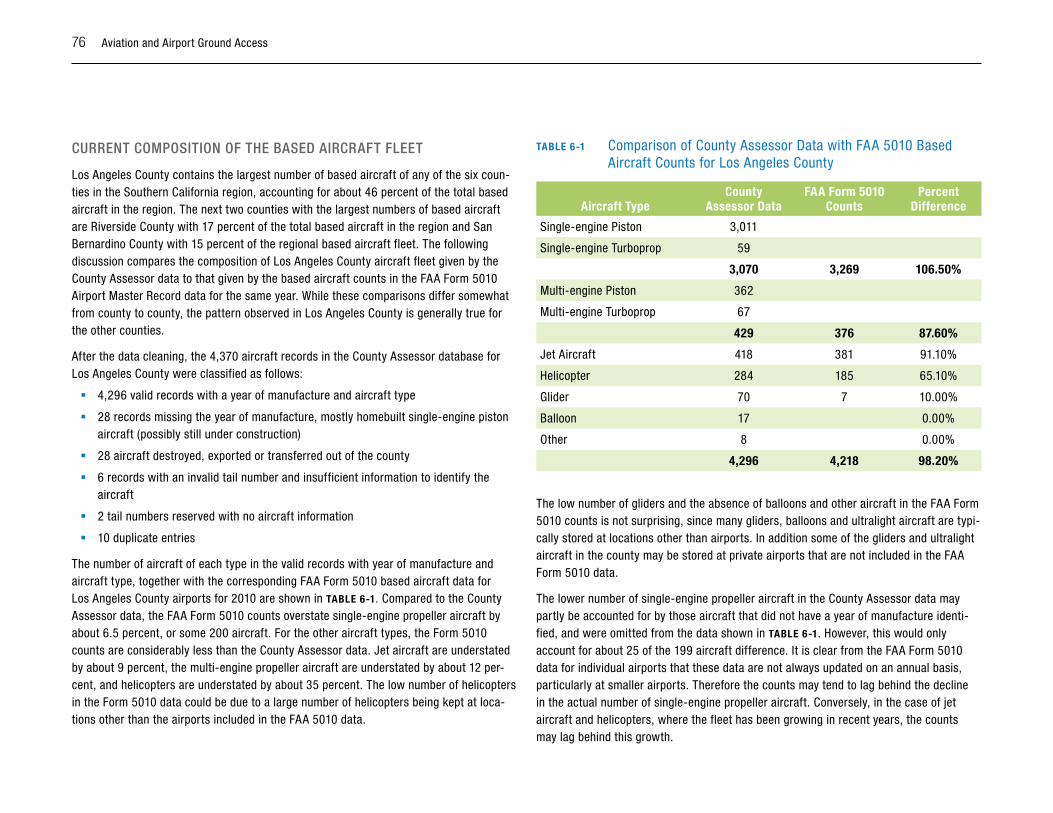
76 Aviation and Airport Ground Access
CuRREnT CoMposiTion oF ThE BAsED AiRCRAFT FlEET
Los Angeles County contains the largest number of based aircraft of any of the six coun-ties in the Southern California region, accounting for about 46 percent of the total based aircraft in the region. The next two counties with the largest numbers of based aircraft are Riverside County with 17 percent of the total based aircraft in the region and San Bernardino County with 15 percent of the regional based aircraft fleet. The following discussion compares the composition of Los Angeles County aircraft fleet given by the County Assessor data to that given by the based aircraft counts in the FAA Form 5010 Airport Master Record data for the same year. While these comparisons differ somewhat from county to county, the pattern observed in Los Angeles County is generally true for the other counties.
After the data cleaning, the 4,370 aircraft records in the County Assessor database for Los Angeles County were classified as follows:
� 4,296 valid records with a year of manufacture and aircraft type
� 28 records missing the year of manufacture, mostly homebuilt single-engine piston aircraft (possibly still under construction)
� 28 aircraft destroyed, exported or transferred out of the county
� 6 records with an invalid tail number and insufficient information to identify the aircraft
� 2 tail numbers reserved with no aircraft information
� 10 duplicate entries
The number of aircraft of each type in the valid records with year of manufacture and aircraft type, together with the corresponding FAA Form 5010 based aircraft data for Los Angeles County airports for 2010 are shown in TABlE 6-1. Compared to the County Assessor data, the FAA Form 5010 counts overstate single-engine propeller aircraft by about 6.5 percent, or some 200 aircraft. For the other aircraft types, the Form 5010 counts are considerably less than the County Assessor data. Jet aircraft are understated by about 9 percent, the multi-engine propeller aircraft are understated by about 12 per-cent, and helicopters are understated by about 35 percent. The low number of helicopters in the Form 5010 data could be due to a large number of helicopters being kept at loca-tions other than the airports included in the FAA 5010 data.
TABlE 6-1 Comparison of County Assessor Data with FAA 5010 Based Aircraft Counts for Los Angeles County
Aircraft TypeCounty
Assessor DataFAA Form 5010
CountsPercent
Difference
Single-engine Piston 3,011
Single-engine Turboprop 59
3,070 3,269 106.50%
Multi-engine Piston 362
Multi-engine Turboprop 67
429 376 87.60%
Jet Aircraft 418 381 91.10%
Helicopter 284 185 65.10%
Glider 70 7 10.00%
Balloon 17 0.00%
Other 8 0.00%
4,296 4,218 98.20%
The low number of gliders and the absence of balloons and other aircraft in the FAA Form 5010 counts is not surprising, since many gliders, balloons and ultralight aircraft are typi-cally stored at locations other than airports. In addition some of the gliders and ultralight aircraft in the county may be stored at private airports that are not included in the FAA Form 5010 data.
The lower number of single-engine propeller aircraft in the County Assessor data may partly be accounted for by those aircraft that did not have a year of manufacture identi-fied, and were omitted from the data shown in TABlE 6-1. However, this would only account for about 25 of the 199 aircraft difference. It is clear from the FAA Form 5010 data for individual airports that these data are not always updated on an annual basis, particularly at smaller airports. Therefore the counts may tend to lag behind the decline in the actual number of single-engine propeller aircraft. Conversely, in the case of jet aircraft and helicopters, where the fleet has been growing in recent years, the counts may lag behind this growth.
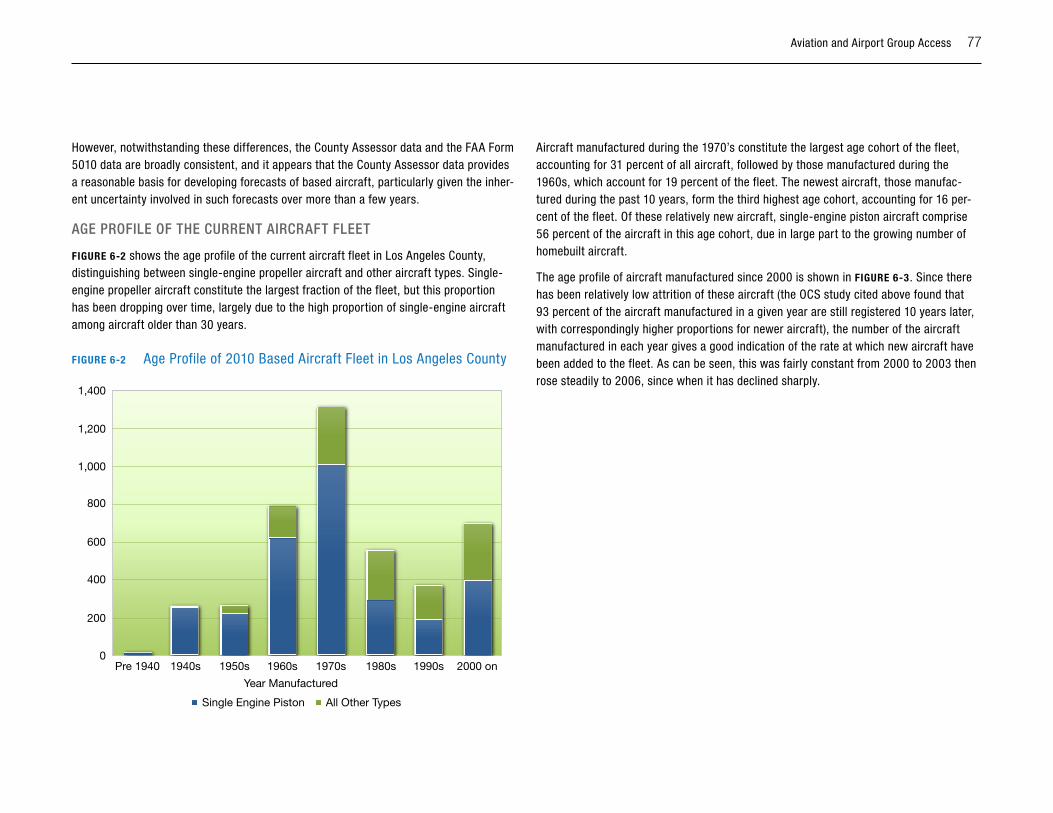
Aviation and Airport Group Access 77
However, notwithstanding these differences, the County Assessor data and the FAA Form 5010 data are broadly consistent, and it appears that the County Assessor data provides a reasonable basis for developing forecasts of based aircraft, particularly given the inher-ent uncertainty involved in such forecasts over more than a few years.
AGE pRoFilE oF ThE CuRREnT AiRCRAFT FlEET
FIGuRE 6-2 shows the age profile of the current aircraft fleet in Los Angeles County, distinguishing between single-engine propeller aircraft and other aircraft types. Single-engine propeller aircraft constitute the largest fraction of the fleet, but this proportion has been dropping over time, largely due to the high proportion of single-engine aircraft among aircraft older than 30 years.
FIGuRE 6-2 Age Profile of 2010 Based Aircraft Fleet in Los Angeles County
1,400
1,200
1,000
600
800
400
200
0Pre 1940 1940s
Year Manufactured
1950s 1960s 1970s 1980s 1990s 2000 on
Single Engine Piston All Other Types
Aircraft manufactured during the 1970’s constitute the largest age cohort of the fleet, accounting for 31 percent of all aircraft, followed by those manufactured during the 1960s, which account for 19 percent of the fleet. The newest aircraft, those manufac-tured during the past 10 years, form the third highest age cohort, accounting for 16 per-cent of the fleet. Of these relatively new aircraft, single-engine piston aircraft comprise 56 percent of the aircraft in this age cohort, due in large part to the growing number of homebuilt aircraft.
The age profile of aircraft manufactured since 2000 is shown in FIGuRE 6-3. Since there has been relatively low attrition of these aircraft (the OCS study cited above found that 93 percent of the aircraft manufactured in a given year are still registered 10 years later, with correspondingly higher proportions for newer aircraft), the number of the aircraft manufactured in each year gives a good indication of the rate at which new aircraft have been added to the fleet. As can be seen, this was fairly constant from 2000 to 2003 then rose steadily to 2006, since when it has declined sharply.
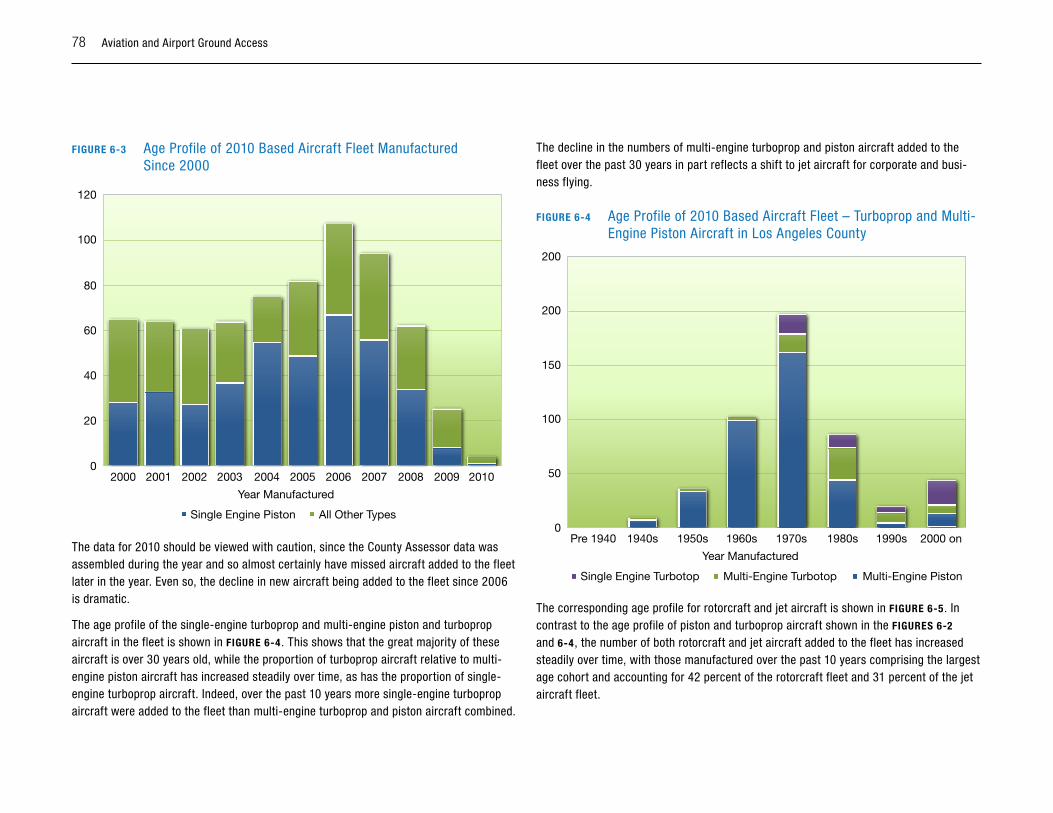
78 Aviation and Airport Ground Access
FIGuRE 6-3 Age Profile of 2010 Based Aircraft Fleet Manufactured Since 2000
120
100
80
60
40
20
02000 2001
Year Manufactured
2002 2003 2004 2005 2006 2007 2008 2009 2010
Single Engine Piston All Other Types
The data for 2010 should be viewed with caution, since the County Assessor data was assembled during the year and so almost certainly have missed aircraft added to the fleet later in the year. Even so, the decline in new aircraft being added to the fleet since 2006 is dramatic.
The age profile of the single-engine turboprop and multi-engine piston and turboprop aircraft in the fleet is shown in FIGuRE 6-4. This shows that the great majority of these aircraft is over 30 years old, while the proportion of turboprop aircraft relative to multi-engine piston aircraft has increased steadily over time, as has the proportion of single-engine turboprop aircraft. Indeed, over the past 10 years more single-engine turboprop aircraft were added to the fleet than multi-engine turboprop and piston aircraft combined.
The decline in the numbers of multi-engine turboprop and piston aircraft added to the fleet over the past 30 years in part reflects a shift to jet aircraft for corporate and busi-ness flying.
FIGuRE 6-4 Age Profile of 2010 Based Aircraft Fleet – Turboprop and Multi-Engine Piston Aircraft in Los Angeles County
200
200
150
100
50
0Pre 1940 1940s
Year Manufactured
1950s 1960s 1970s 1980s 1990s 2000 on
Single Engine Turbotop Multi-Engine PistonMulti-Engine Turbotop
The corresponding age profile for rotorcraft and jet aircraft is shown in FIGuRE 6-5. In contrast to the age profile of piston and turboprop aircraft shown in the FIGuRES 6-2 and 6-4, the number of both rotorcraft and jet aircraft added to the fleet has increased steadily over time, with those manufactured over the past 10 years comprising the largest age cohort and accounting for 42 percent of the rotorcraft fleet and 31 percent of the jet aircraft fleet.
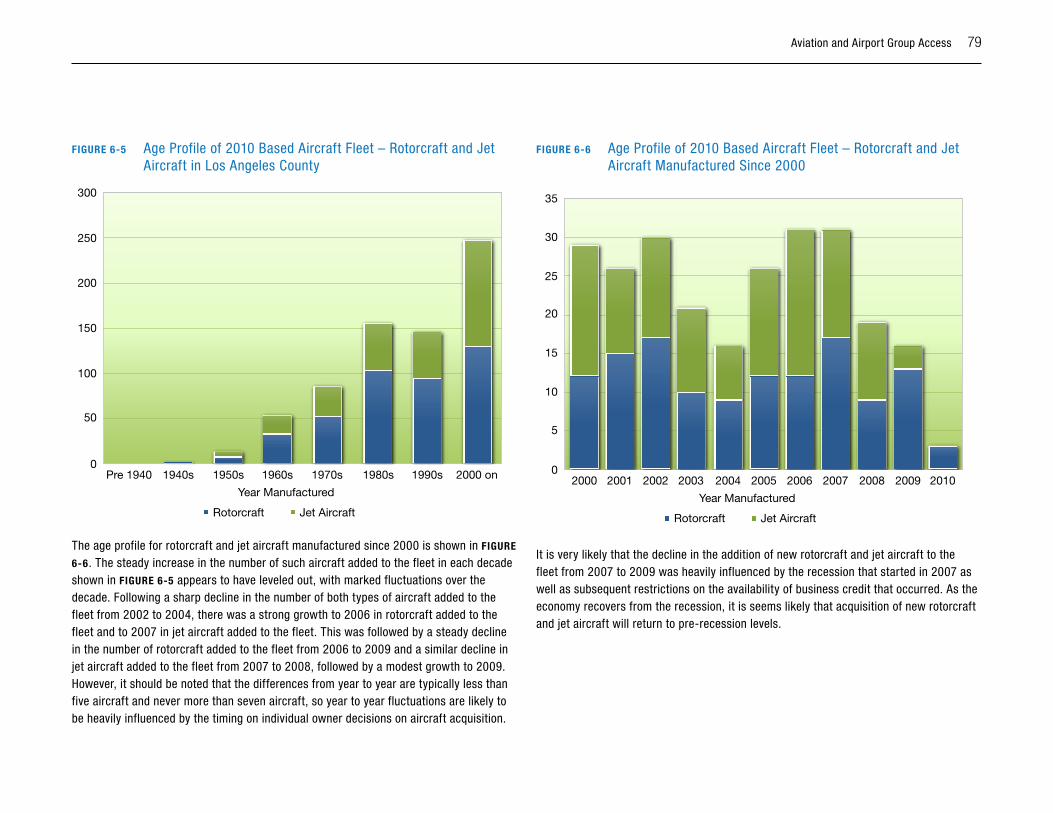
Aviation and Airport Group Access 79
FIGuRE 6-5 Age Profile of 2010 Based Aircraft Fleet – Rotorcraft and Jet Aircraft in Los Angeles County
300
250
200
150
100
50
0Pre 1940 1940s
Year Manufactured
1950s 1960s 1970s 1980s 1990s 2000 on
Rotorcraft Jet Aircraft
The age profile for rotorcraft and jet aircraft manufactured since 2000 is shown in FIGuRE
6-6. The steady increase in the number of such aircraft added to the fleet in each decade shown in FIGuRE 6-5 appears to have leveled out, with marked fluctuations over the decade. Following a sharp decline in the number of both types of aircraft added to the fleet from 2002 to 2004, there was a strong growth to 2006 in rotorcraft added to the fleet and to 2007 in jet aircraft added to the fleet. This was followed by a steady decline in the number of rotorcraft added to the fleet from 2006 to 2009 and a similar decline in jet aircraft added to the fleet from 2007 to 2008, followed by a modest growth to 2009. However, it should be noted that the differences from year to year are typically less than five aircraft and never more than seven aircraft, so year to year fluctuations are likely to be heavily influenced by the timing on individual owner decisions on aircraft acquisition.
FIGuRE 6-6 Age Profile of 2010 Based Aircraft Fleet – Rotorcraft and Jet Aircraft Manufactured Since 2000
35
30
25
15
20
10
5
02000 2001
Year Manufactured
2002 2003 2004 2005 2006 2007 2008 2009 2010
Rotorcraft Jet Aircraft
It is very likely that the decline in the addition of new rotorcraft and jet aircraft to the fleet from 2007 to 2009 was heavily influenced by the recession that started in 2007 as well as subsequent restrictions on the availability of business credit that occurred. As the economy recovers from the recession, it is seems likely that acquisition of new rotorcraft and jet aircraft will return to pre-recession levels.
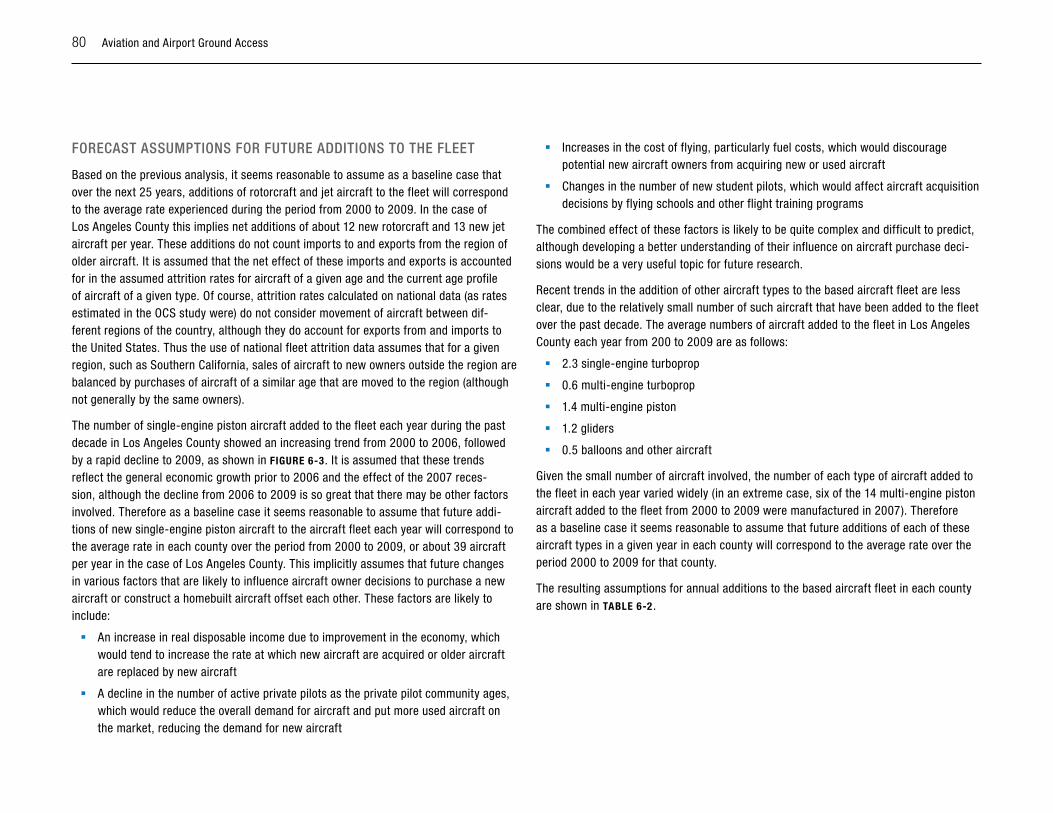
80 Aviation and Airport Ground Access
FoRECAsT AssuMpTions FoR FuTuRE ADDiTions To ThE FlEET
Based on the previous analysis, it seems reasonable to assume as a baseline case that over the next 25 years, additions of rotorcraft and jet aircraft to the fleet will correspond to the average rate experienced during the period from 2000 to 2009. In the case of Los Angeles County this implies net additions of about 12 new rotorcraft and 13 new jet aircraft per year. These additions do not count imports to and exports from the region of older aircraft. It is assumed that the net effect of these imports and exports is accounted for in the assumed attrition rates for aircraft of a given age and the current age profile of aircraft of a given type. Of course, attrition rates calculated on national data (as rates estimated in the OCS study were) do not consider movement of aircraft between dif-ferent regions of the country, although they do account for exports from and imports to the United States. Thus the use of national fleet attrition data assumes that for a given region, such as Southern California, sales of aircraft to new owners outside the region are balanced by purchases of aircraft of a similar age that are moved to the region (although not generally by the same owners).
The number of single-engine piston aircraft added to the fleet each year during the past decade in Los Angeles County showed an increasing trend from 2000 to 2006, followed by a rapid decline to 2009, as shown in FIGuRE 6-3. It is assumed that these trends reflect the general economic growth prior to 2006 and the effect of the 2007 reces-sion, although the decline from 2006 to 2009 is so great that there may be other factors involved. Therefore as a baseline case it seems reasonable to assume that future addi-tions of new single-engine piston aircraft to the aircraft fleet each year will correspond to the average rate in each county over the period from 2000 to 2009, or about 39 aircraft per year in the case of Los Angeles County. This implicitly assumes that future changes in various factors that are likely to influence aircraft owner decisions to purchase a new aircraft or construct a homebuilt aircraft offset each other. These factors are likely to include:
� An increase in real disposable income due to improvement in the economy, which would tend to increase the rate at which new aircraft are acquired or older aircraft are replaced by new aircraft
� A decline in the number of active private pilots as the private pilot community ages, which would reduce the overall demand for aircraft and put more used aircraft on the market, reducing the demand for new aircraft
� Increases in the cost of flying, particularly fuel costs, which would discourage potential new aircraft owners from acquiring new or used aircraft
� Changes in the number of new student pilots, which would affect aircraft acquisition decisions by flying schools and other flight training programs
The combined effect of these factors is likely to be quite complex and difficult to predict, although developing a better understanding of their influence on aircraft purchase deci-sions would be a very useful topic for future research.
Recent trends in the addition of other aircraft types to the based aircraft fleet are less clear, due to the relatively small number of such aircraft that have been added to the fleet over the past decade. The average numbers of aircraft added to the fleet in Los Angeles County each year from 200 to 2009 are as follows:
� 2.3 single-engine turboprop
� 0.6 multi-engine turboprop
� 1.4 multi-engine piston
� 1.2 gliders
� 0.5 balloons and other aircraft
Given the small number of aircraft involved, the number of each type of aircraft added to the fleet in each year varied widely (in an extreme case, six of the 14 multi-engine piston aircraft added to the fleet from 2000 to 2009 were manufactured in 2007). Therefore as a baseline case it seems reasonable to assume that future additions of each of these aircraft types in a given year in each county will correspond to the average rate over the period 2000 to 2009 for that county.
The resulting assumptions for annual additions to the based aircraft fleet in each county are shown in TABlE 6-2 .
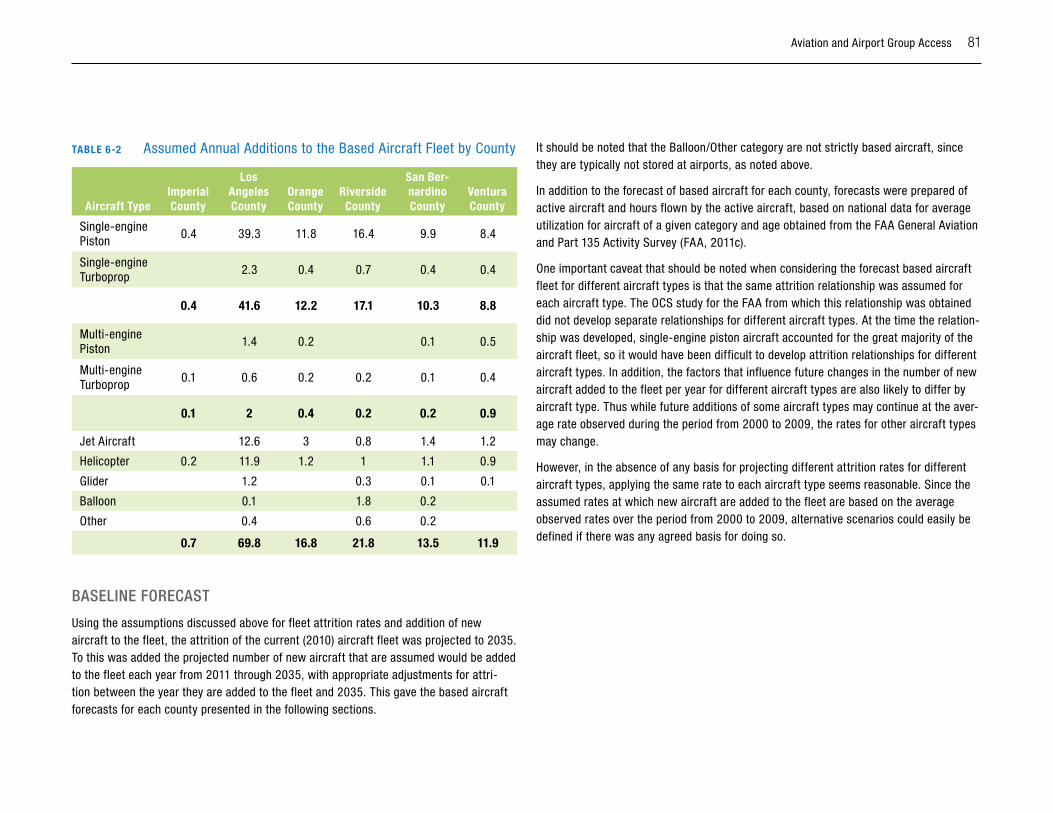
Aviation and Airport Group Access 81
TABlE 6-2 Assumed Annual Additions to the Based Aircraft Fleet by County
Aircraft TypeImperial County
los Angeles County
Orange County
Riverside County
San Ber-nardino County
Ventura County
Single-engine Piston
0.4 39.3 11.8 16.4 9.9 8.4
Single-engine Turboprop
2.3 0.4 0.7 0.4 0.4
0.4 41.6 12.2 17.1 10.3 8.8
Multi-engine Piston
1.4 0.2 0.1 0.5
Multi-engine Turboprop
0.1 0.6 0.2 0.2 0.1 0.4
0.1 2 0.4 0.2 0.2 0.9
Jet Aircraft 12.6 3 0.8 1.4 1.2
Helicopter 0.2 11.9 1.2 1 1.1 0.9
Glider 1.2 0.3 0.1 0.1
Balloon 0.1 1.8 0.2
Other 0.4 0.6 0.2
0.7 69.8 16.8 21.8 13.5 11.9
BAsElinE FoRECAsT
Using the assumptions discussed above for fleet attrition rates and addition of new aircraft to the fleet, the attrition of the current (2010) aircraft fleet was projected to 2035. To this was added the projected number of new aircraft that are assumed would be added to the fleet each year from 2011 through 2035, with appropriate adjustments for attri-tion between the year they are added to the fleet and 2035. This gave the based aircraft forecasts for each county presented in the following sections.
It should be noted that the Balloon/Other category are not strictly based aircraft, since they are typically not stored at airports, as noted above.
In addition to the forecast of based aircraft for each county, forecasts were prepared of active aircraft and hours flown by the active aircraft, based on national data for average utilization for aircraft of a given category and age obtained from the FAA General Aviation and Part 135 Activity Survey (FAA, 2011c).
One important caveat that should be noted when considering the forecast based aircraft fleet for different aircraft types is that the same attrition relationship was assumed for each aircraft type. The OCS study for the FAA from which this relationship was obtained did not develop separate relationships for different aircraft types. At the time the relation-ship was developed, single-engine piston aircraft accounted for the great majority of the aircraft fleet, so it would have been difficult to develop attrition relationships for different aircraft types. In addition, the factors that influence future changes in the number of new aircraft added to the fleet per year for different aircraft types are also likely to differ by aircraft type. Thus while future additions of some aircraft types may continue at the aver-age rate observed during the period from 2000 to 2009, the rates for other aircraft types may change.
However, in the absence of any basis for projecting different attrition rates for different aircraft types, applying the same rate to each aircraft type seems reasonable. Since the assumed rates at which new aircraft are added to the fleet are based on the average observed rates over the period from 2000 to 2009, alternative scenarios could easily be defined if there was any agreed basis for doing so.
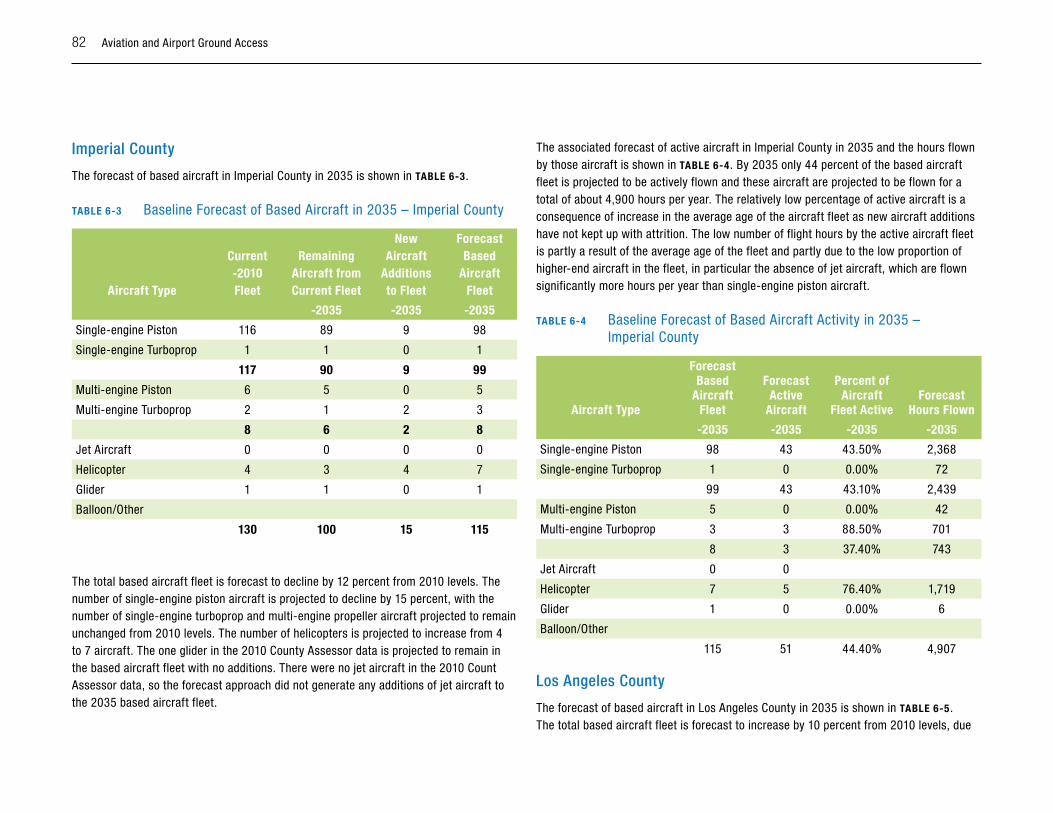
82 Aviation and Airport Ground Access
imperial County
The forecast of based aircraft in Imperial County in 2035 is shown in TABlE 6-3.
TABlE 6-3 Baseline Forecast of Based Aircraft in 2035 – Imperial County
Aircraft Type
Current -2010 Fleet
Remaining Aircraft from Current Fleet
New Aircraft
Additions to Fleet
Forecast Based
Aircraft Fleet
-2035 -2035 -2035
Single-engine Piston 116 89 9 98
Single-engine Turboprop 1 1 0 1
117 90 9 99
Multi-engine Piston 6 5 0 5
Multi-engine Turboprop 2 1 2 3
8 6 2 8
Jet Aircraft 0 0 0 0
Helicopter 4 3 4 7
Glider 1 1 0 1
Balloon/Other
130 100 15 115
The total based aircraft fleet is forecast to decline by 12 percent from 2010 levels. The number of single-engine piston aircraft is projected to decline by 15 percent, with the number of single-engine turboprop and multi-engine propeller aircraft projected to remain unchanged from 2010 levels. The number of helicopters is projected to increase from 4 to 7 aircraft. The one glider in the 2010 County Assessor data is projected to remain in the based aircraft fleet with no additions. There were no jet aircraft in the 2010 Count Assessor data, so the forecast approach did not generate any additions of jet aircraft to the 2035 based aircraft fleet.
The associated forecast of active aircraft in Imperial County in 2035 and the hours flown by those aircraft is shown in TABlE 6-4. By 2035 only 44 percent of the based aircraft fleet is projected to be actively flown and these aircraft are projected to be flown for a total of about 4,900 hours per year. The relatively low percentage of active aircraft is a consequence of increase in the average age of the aircraft fleet as new aircraft additions have not kept up with attrition. The low number of flight hours by the active aircraft fleet is partly a result of the average age of the fleet and partly due to the low proportion of higher-end aircraft in the fleet, in particular the absence of jet aircraft, which are flown significantly more hours per year than single-engine piston aircraft.
TABlE 6-4 Baseline Forecast of Based Aircraft Activity in 2035 – Imperial County
Aircraft Type
Forecast Based
Aircraft Fleet
Forecast Active
Aircraft
Percent of Aircraft
Fleet ActiveForecast
Hours Flown
-2035 -2035 -2035 -2035
Single-engine Piston 98 43 43.50% 2,368
Single-engine Turboprop 1 0 0.00% 72
99 43 43.10% 2,439
Multi-engine Piston 5 0 0.00% 42
Multi-engine Turboprop 3 3 88.50% 701
8 3 37.40% 743
Jet Aircraft 0 0
Helicopter 7 5 76.40% 1,719
Glider 1 0 0.00% 6
Balloon/Other
115 51 44.40% 4,907
los Angeles County
The forecast of based aircraft in Los Angeles County in 2035 is shown in TABlE 6-5. The total based aircraft fleet is forecast to increase by 10 percent from 2010 levels, due

Aviation and Airport Group Access 83
principally to the additions of higher-end aircraft to the fleet between 2010 and 2035. The number of single-engine turboprop aircraft is projected to increase by 56 percent, with the number of helicopters increasing by 61 percent, and the number of jet aircraft increasing by 36 percent. The number of single-engine piston aircraft is projected to increase by just 4 percent, with the number of multi-engine turboprop aircraft projected to decline by 5 percent and the number of multi-engine piston aircraft projected to decline by 14 percent. The number of gliders is projected to increase by 11 percent, with the number of balloons and other aircraft types projected to increase by 17 percent.
The associated forecast of active aircraft in Los Angeles County in 2035 and the hours flown by those aircraft are shown in TABlE 6-6. By 2035 61 percent of the based aircraft fleet is projected to be actively flown and these aircraft will be flown for a total of about 394,000 hours per year. Jet aircraft and helicopters are projected to account for the majority of the hours flown, 28 percent and 27 percent respectively. However, single-engine propeller aircraft are projected to account for 39 percent of the hours flown, the majority of which (34 percent of the total hours flown) is accounted for by single-engine piston aircraft.
TABlE 6-5 Baseline Forecast of Based Aircraft in 2035 – Los Angeles County
Aircraft TypeCurrent
-2010 Fleet
Remaining Aircraft from Current Fleet
New Aircraft Additions to
Fleet
Forecast Based
Aircraft Fleet
-2035 -2035 -2035
Single-engine Piston 3,011 2,265 854 3,119
Single-engine Turboprop 59 42 50 92
3,070 2,307 904 3,211
Multi-engine Piston 362 280 30 310
Multi-engine Turboprop 67 50 13 63
429 330 43 373
Jet Aircraft 418 296 274 570
Helicopter 284 198 259 457
Aircraft TypeCurrent
-2010 Fleet
Remaining Aircraft from Current Fleet
New Aircraft Additions to
Fleet
Forecast Based
Aircraft Fleet
-2035 -2035 -2035
Glider 70 52 26 78
Balloon/Other 25 18 11 29
4,296 3,200 1,517 4,717
TABlE 6-6 Baseline Forecast of Based Aircraft Activity in 2035 – Los Angeles County
Aircraft Type
Forecast Based
Aircraft Fleet
Forecast Active
Aircraft
Percent of Aircraft Fleet
ActiveForecast
Hours Flown
-2035 -2035 -2035
Single-engine Piston 3,119 1,814 58.10% 134,687
Single-engine Turboprop 92 76 82.90% 19,791
3,211 1,890 58.80% 154,477
Multi-engine Piston 310 117 37.70% 11,980
Multi-engine Turboprop 63 39 61.50% 8,153
373 156 41.80% 20,134
Jet Aircraft 570 432 75.80% 111,823
Helicopter 457 340 74.40% 106,159
Glider 78 35 45.10% 1,153
Balloon/Other 29 14 49.40% 476
4,717 2,867 60.80% 394,223
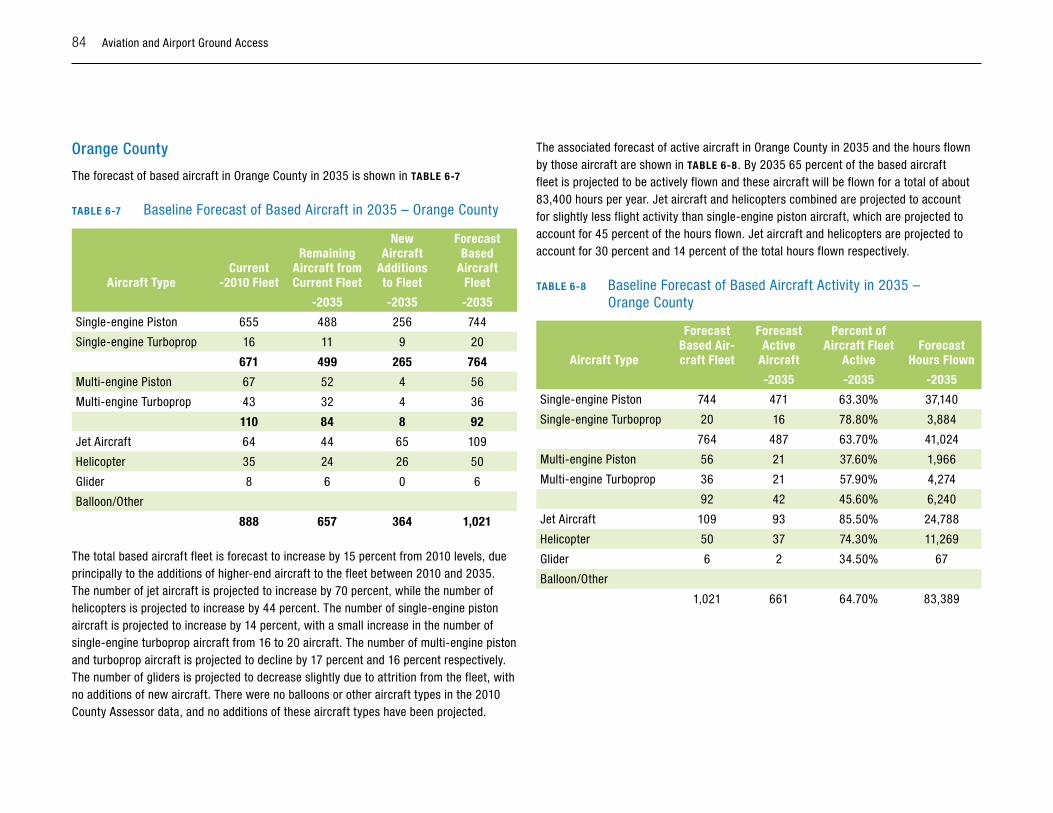
84 Aviation and Airport Ground Access
orange County
The forecast of based aircraft in Orange County in 2035 is shown in TABlE 6-7
TABlE 6-7 Baseline Forecast of Based Aircraft in 2035 – Orange County
Aircraft TypeCurrent
-2010 Fleet
Remaining Aircraft from Current Fleet
New Aircraft
Additions to Fleet
Forecast Based
Aircraft Fleet
-2035 -2035 -2035
Single-engine Piston 655 488 256 744
Single-engine Turboprop 16 11 9 20
671 499 265 764
Multi-engine Piston 67 52 4 56
Multi-engine Turboprop 43 32 4 36
110 84 8 92
Jet Aircraft 64 44 65 109
Helicopter 35 24 26 50
Glider 8 6 0 6
Balloon/Other
888 657 364 1,021
The total based aircraft fleet is forecast to increase by 15 percent from 2010 levels, due principally to the additions of higher-end aircraft to the fleet between 2010 and 2035. The number of jet aircraft is projected to increase by 70 percent, while the number of helicopters is projected to increase by 44 percent. The number of single-engine piston aircraft is projected to increase by 14 percent, with a small increase in the number of single-engine turboprop aircraft from 16 to 20 aircraft. The number of multi-engine piston and turboprop aircraft is projected to decline by 17 percent and 16 percent respectively. The number of gliders is projected to decrease slightly due to attrition from the fleet, with no additions of new aircraft. There were no balloons or other aircraft types in the 2010 County Assessor data, and no additions of these aircraft types have been projected.
The associated forecast of active aircraft in Orange County in 2035 and the hours flown by those aircraft are shown in TABlE 6-8. By 2035 65 percent of the based aircraft fleet is projected to be actively flown and these aircraft will be flown for a total of about 83,400 hours per year. Jet aircraft and helicopters combined are projected to account for slightly less flight activity than single-engine piston aircraft, which are projected to account for 45 percent of the hours flown. Jet aircraft and helicopters are projected to account for 30 percent and 14 percent of the total hours flown respectively.
TABlE 6-8 Baseline Forecast of Based Aircraft Activity in 2035 – Orange County
Aircraft Type
Forecast Based Air-craft Fleet
Forecast Active
Aircraft
Percent of Aircraft Fleet
ActiveForecast
Hours Flown
-2035 -2035 -2035
Single-engine Piston 744 471 63.30% 37,140
Single-engine Turboprop 20 16 78.80% 3,884
764 487 63.70% 41,024
Multi-engine Piston 56 21 37.60% 1,966
Multi-engine Turboprop 36 21 57.90% 4,274
92 42 45.60% 6,240
Jet Aircraft 109 93 85.50% 24,788
Helicopter 50 37 74.30% 11,269
Glider 6 2 34.50% 67
Balloon/Other
1,021 661 64.70% 83,389
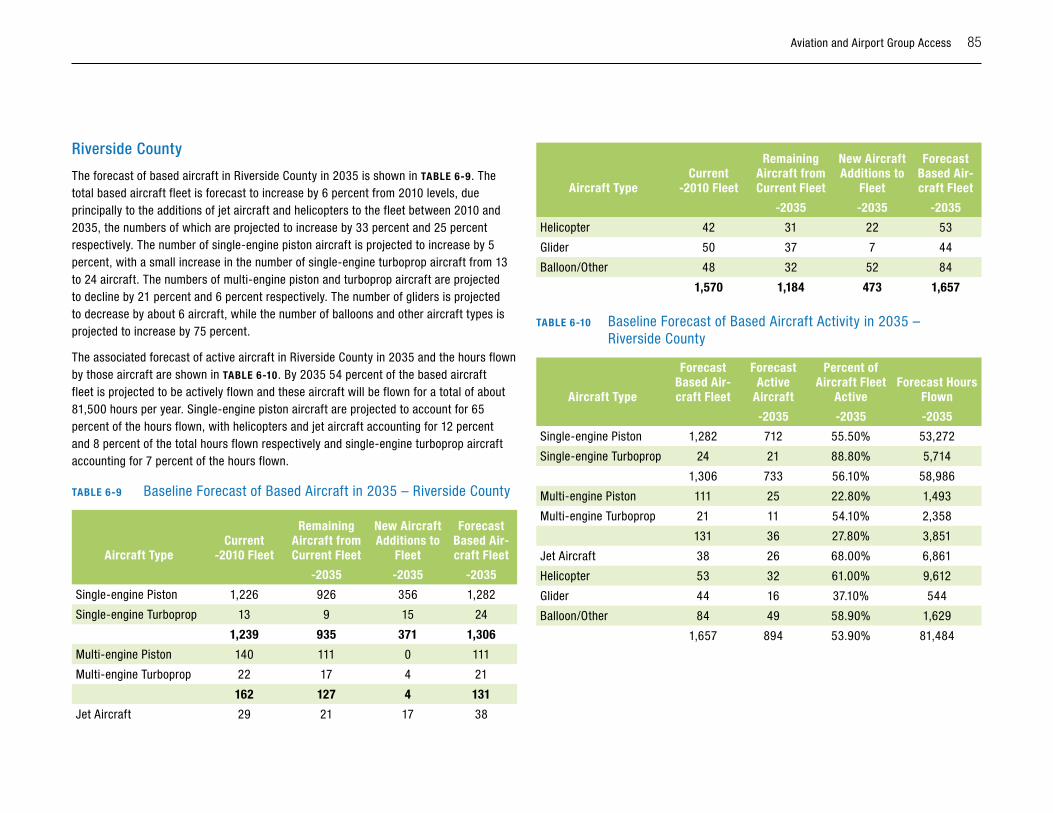
Aviation and Airport Group Access 85
Riverside County
The forecast of based aircraft in Riverside County in 2035 is shown in TABlE 6-9. The total based aircraft fleet is forecast to increase by 6 percent from 2010 levels, due principally to the additions of jet aircraft and helicopters to the fleet between 2010 and 2035, the numbers of which are projected to increase by 33 percent and 25 percent respectively. The number of single-engine piston aircraft is projected to increase by 5 percent, with a small increase in the number of single-engine turboprop aircraft from 13 to 24 aircraft. The numbers of multi-engine piston and turboprop aircraft are projected to decline by 21 percent and 6 percent respectively. The number of gliders is projected to decrease by about 6 aircraft, while the number of balloons and other aircraft types is projected to increase by 75 percent.
The associated forecast of active aircraft in Riverside County in 2035 and the hours flown by those aircraft are shown in TABlE 6-10. By 2035 54 percent of the based aircraft fleet is projected to be actively flown and these aircraft will be flown for a total of about 81,500 hours per year. Single-engine piston aircraft are projected to account for 65 percent of the hours flown, with helicopters and jet aircraft accounting for 12 percent and 8 percent of the total hours flown respectively and single-engine turboprop aircraft accounting for 7 percent of the hours flown.
TABlE 6-9 Baseline Forecast of Based Aircraft in 2035 – Riverside County
Aircraft TypeCurrent
-2010 Fleet
Remaining Aircraft from Current Fleet
New Aircraft Additions to
Fleet
Forecast Based Air-craft Fleet
-2035 -2035 -2035
Single-engine Piston 1,226 926 356 1,282
Single-engine Turboprop 13 9 15 24
1,239 935 371 1,306
Multi-engine Piston 140 111 0 111
Multi-engine Turboprop 22 17 4 21
162 127 4 131
Jet Aircraft 29 21 17 38
Aircraft TypeCurrent
-2010 Fleet
Remaining Aircraft from Current Fleet
New Aircraft Additions to
Fleet
Forecast Based Air-craft Fleet
-2035 -2035 -2035
Helicopter 42 31 22 53
Glider 50 37 7 44
Balloon/Other 48 32 52 84
1,570 1,184 473 1,657
TABlE 6-10 Baseline Forecast of Based Aircraft Activity in 2035 – Riverside County
Aircraft Type
Forecast Based Air-craft Fleet
Forecast Active
Aircraft
Percent of Aircraft Fleet
ActiveForecast Hours
Flown
-2035 -2035 -2035
Single-engine Piston 1,282 712 55.50% 53,272
Single-engine Turboprop 24 21 88.80% 5,714
1,306 733 56.10% 58,986
Multi-engine Piston 111 25 22.80% 1,493
Multi-engine Turboprop 21 11 54.10% 2,358
131 36 27.80% 3,851
Jet Aircraft 38 26 68.00% 6,861
Helicopter 53 32 61.00% 9,612
Glider 44 16 37.10% 544
Balloon/Other 84 49 58.90% 1,629
1,657 894 53.90% 81,484
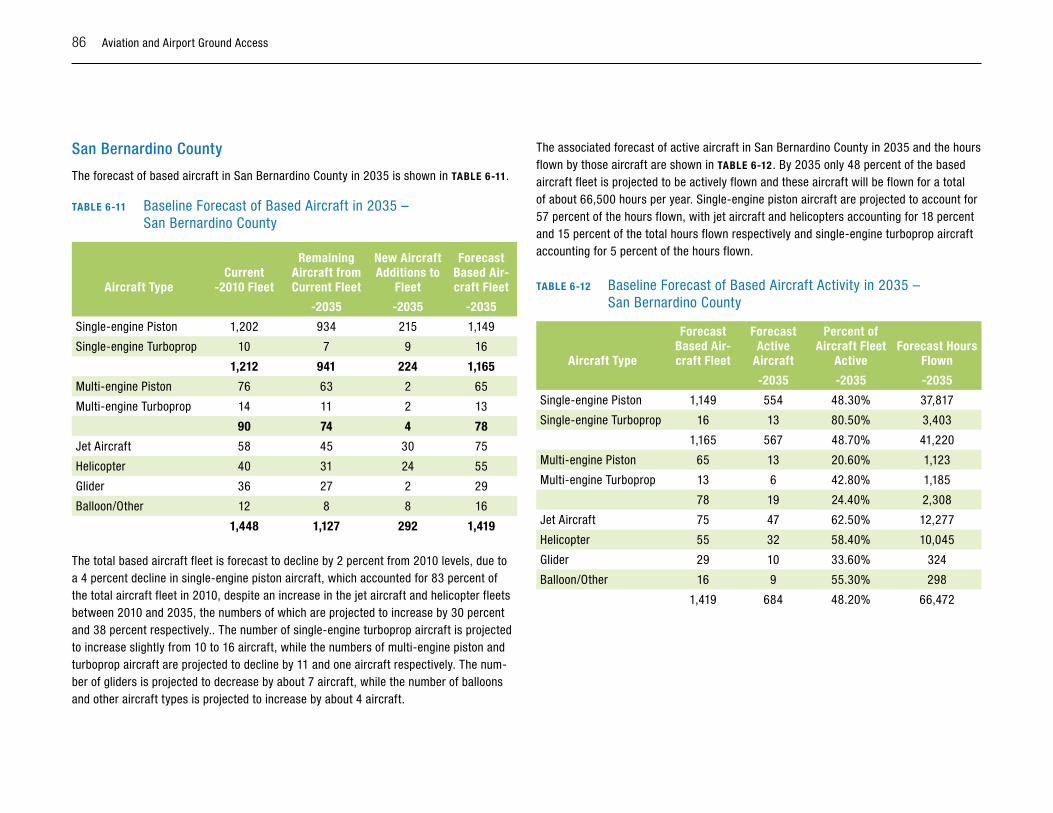
86 Aviation and Airport Ground Access
san Bernardino County
The forecast of based aircraft in San Bernardino County in 2035 is shown in TABlE 6-11.
TABlE 6-11 Baseline Forecast of Based Aircraft in 2035 – San Bernardino County
Aircraft TypeCurrent
-2010 Fleet
Remaining Aircraft from Current Fleet
New Aircraft Additions to
Fleet
Forecast Based Air-craft Fleet
-2035 -2035 -2035
Single-engine Piston 1,202 934 215 1,149
Single-engine Turboprop 10 7 9 16
1,212 941 224 1,165
Multi-engine Piston 76 63 2 65
Multi-engine Turboprop 14 11 2 13
90 74 4 78
Jet Aircraft 58 45 30 75
Helicopter 40 31 24 55
Glider 36 27 2 29
Balloon/Other 12 8 8 16
1,448 1,127 292 1,419
The total based aircraft fleet is forecast to decline by 2 percent from 2010 levels, due to a 4 percent decline in single-engine piston aircraft, which accounted for 83 percent of the total aircraft fleet in 2010, despite an increase in the jet aircraft and helicopter fleets between 2010 and 2035, the numbers of which are projected to increase by 30 percent and 38 percent respectively.. The number of single-engine turboprop aircraft is projected to increase slightly from 10 to 16 aircraft, while the numbers of multi-engine piston and turboprop aircraft are projected to decline by 11 and one aircraft respectively. The num-ber of gliders is projected to decrease by about 7 aircraft, while the number of balloons and other aircraft types is projected to increase by about 4 aircraft.
The associated forecast of active aircraft in San Bernardino County in 2035 and the hours flown by those aircraft are shown in TABlE 6-12 . By 2035 only 48 percent of the based aircraft fleet is projected to be actively flown and these aircraft will be flown for a total of about 66,500 hours per year. Single-engine piston aircraft are projected to account for 57 percent of the hours flown, with jet aircraft and helicopters accounting for 18 percent and 15 percent of the total hours flown respectively and single-engine turboprop aircraft accounting for 5 percent of the hours flown.
TABlE 6-12 Baseline Forecast of Based Aircraft Activity in 2035 – San Bernardino County
Aircraft Type
Forecast Based Air-craft Fleet
Forecast Active
Aircraft
Percent of Aircraft Fleet
ActiveForecast Hours
Flown
-2035 -2035 -2035
Single-engine Piston 1,149 554 48.30% 37,817
Single-engine Turboprop 16 13 80.50% 3,403
1,165 567 48.70% 41,220
Multi-engine Piston 65 13 20.60% 1,123
Multi-engine Turboprop 13 6 42.80% 1,185
78 19 24.40% 2,308
Jet Aircraft 75 47 62.50% 12,277
Helicopter 55 32 58.40% 10,045
Glider 29 10 33.60% 324
Balloon/Other 16 9 55.30% 298
1,419 684 48.20% 66,472
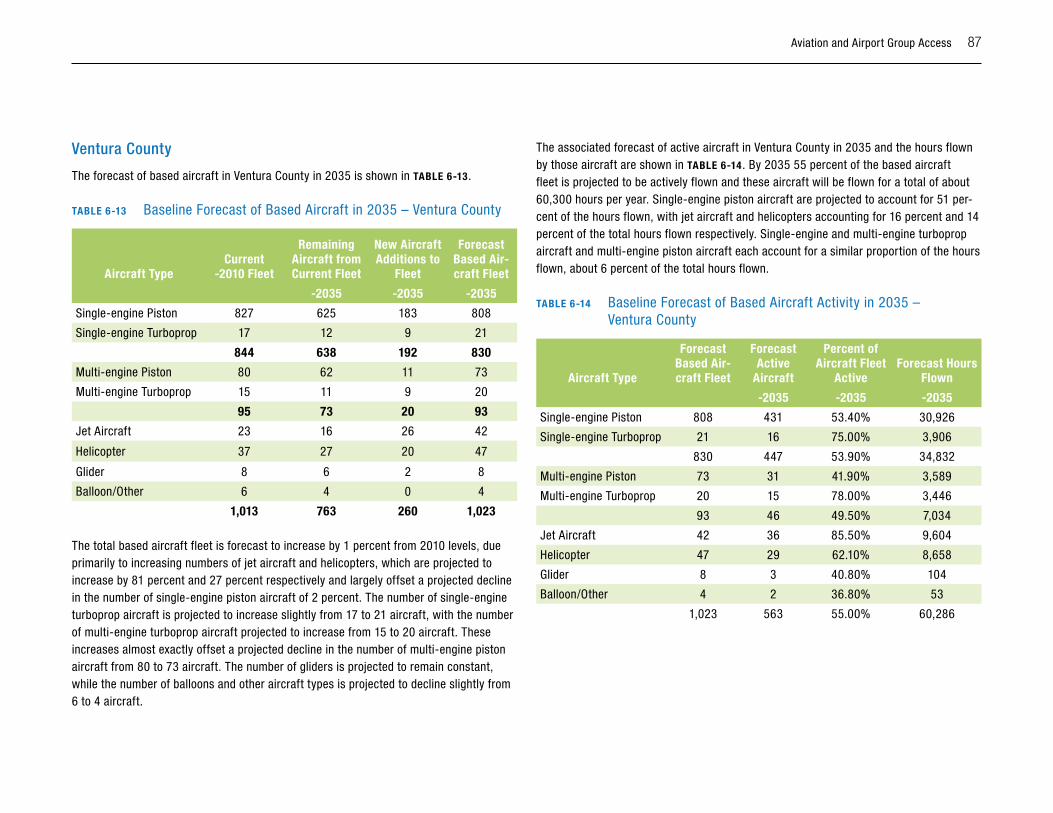
Aviation and Airport Group Access 87
ventura County
The forecast of based aircraft in Ventura County in 2035 is shown in TABlE 6-13.
TABlE 6-13 Baseline Forecast of Based Aircraft in 2035 – Ventura County
Aircraft TypeCurrent
-2010 Fleet
Remaining Aircraft from Current Fleet
New Aircraft Additions to
Fleet
Forecast Based Air-craft Fleet
-2035 -2035 -2035
Single-engine Piston 827 625 183 808
Single-engine Turboprop 17 12 9 21
844 638 192 830
Multi-engine Piston 80 62 11 73
Multi-engine Turboprop 15 11 9 20
95 73 20 93
Jet Aircraft 23 16 26 42
Helicopter 37 27 20 47
Glider 8 6 2 8
Balloon/Other 6 4 0 4
1,013 763 260 1,023
The total based aircraft fleet is forecast to increase by 1 percent from 2010 levels, due primarily to increasing numbers of jet aircraft and helicopters, which are projected to increase by 81 percent and 27 percent respectively and largely offset a projected decline in the number of single-engine piston aircraft of 2 percent. The number of single-engine turboprop aircraft is projected to increase slightly from 17 to 21 aircraft, with the number of multi-engine turboprop aircraft projected to increase from 15 to 20 aircraft. These increases almost exactly offset a projected decline in the number of multi-engine piston aircraft from 80 to 73 aircraft. The number of gliders is projected to remain constant, while the number of balloons and other aircraft types is projected to decline slightly from 6 to 4 aircraft.
The associated forecast of active aircraft in Ventura County in 2035 and the hours flown by those aircraft are shown in TABlE 6-14. By 2035 55 percent of the based aircraft fleet is projected to be actively flown and these aircraft will be flown for a total of about 60,300 hours per year. Single-engine piston aircraft are projected to account for 51 per-cent of the hours flown, with jet aircraft and helicopters accounting for 16 percent and 14 percent of the total hours flown respectively. Single-engine and multi-engine turboprop aircraft and multi-engine piston aircraft each account for a similar proportion of the hours flown, about 6 percent of the total hours flown.
TABlE 6-14 Baseline Forecast of Based Aircraft Activity in 2035 – Ventura County
Aircraft Type
Forecast Based Air-craft Fleet
Forecast Active
Aircraft
Percent of Aircraft Fleet
ActiveForecast Hours
Flown
-2035 -2035 -2035
Single-engine Piston 808 431 53.40% 30,926
Single-engine Turboprop 21 16 75.00% 3,906
830 447 53.90% 34,832
Multi-engine Piston 73 31 41.90% 3,589
Multi-engine Turboprop 20 15 78.00% 3,446
93 46 49.50% 7,034
Jet Aircraft 42 36 85.50% 9,604
Helicopter 47 29 62.10% 8,658
Glider 8 3 40.80% 104
Balloon/Other 4 2 36.80% 53
1,023 563 55.00% 60,286
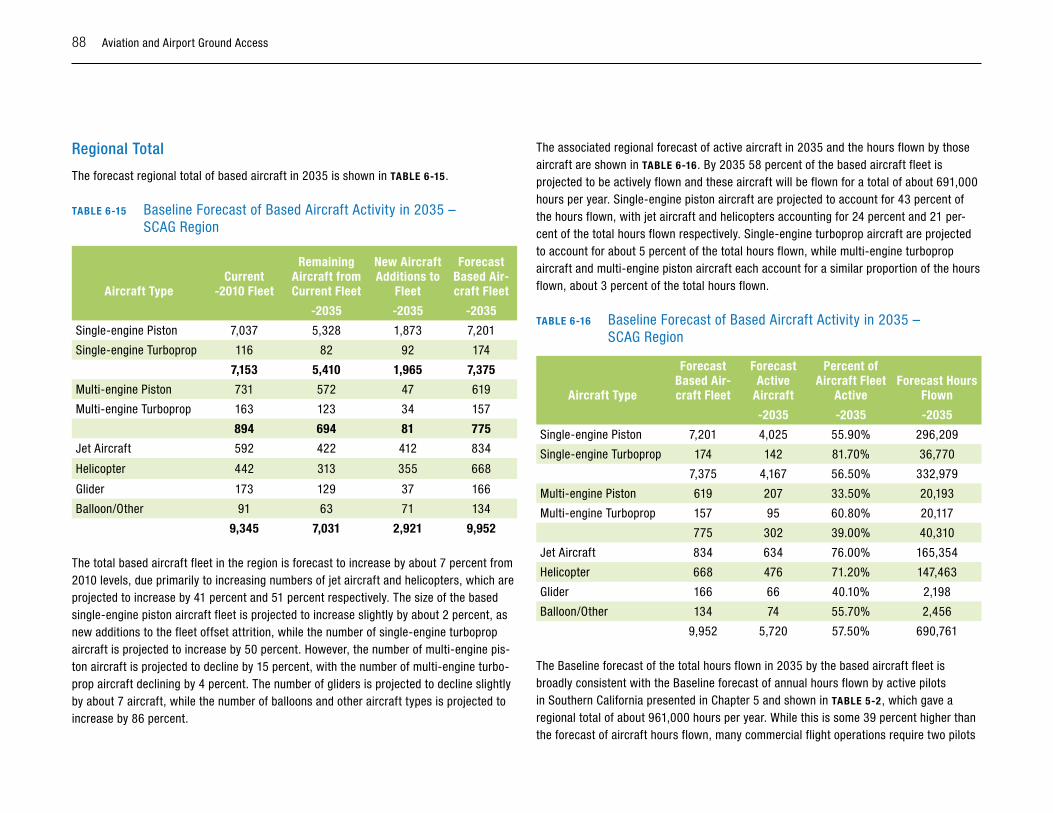
88 Aviation and Airport Ground Access
Regional Total
The forecast regional total of based aircraft in 2035 is shown in TABlE 6-15.
TABlE 6-15 Baseline Forecast of Based Aircraft Activity in 2035 – SCAG Region
Aircraft TypeCurrent
-2010 Fleet
Remaining Aircraft from Current Fleet
New Aircraft Additions to
Fleet
Forecast Based Air-craft Fleet
-2035 -2035 -2035
Single-engine Piston 7,037 5,328 1,873 7,201
Single-engine Turboprop 116 82 92 174
7,153 5,410 1,965 7,375
Multi-engine Piston 731 572 47 619
Multi-engine Turboprop 163 123 34 157
894 694 81 775
Jet Aircraft 592 422 412 834
Helicopter 442 313 355 668
Glider 173 129 37 166
Balloon/Other 91 63 71 134
9,345 7,031 2,921 9,952
The total based aircraft fleet in the region is forecast to increase by about 7 percent from 2010 levels, due primarily to increasing numbers of jet aircraft and helicopters, which are projected to increase by 41 percent and 51 percent respectively. The size of the based single-engine piston aircraft fleet is projected to increase slightly by about 2 percent, as new additions to the fleet offset attrition, while the number of single-engine turboprop aircraft is projected to increase by 50 percent. However, the number of multi-engine pis-ton aircraft is projected to decline by 15 percent, with the number of multi-engine turbo-prop aircraft declining by 4 percent. The number of gliders is projected to decline slightly by about 7 aircraft, while the number of balloons and other aircraft types is projected to increase by 86 percent.
The associated regional forecast of active aircraft in 2035 and the hours flown by those aircraft are shown in TABlE 6-16. By 2035 58 percent of the based aircraft fleet is projected to be actively flown and these aircraft will be flown for a total of about 691,000 hours per year. Single-engine piston aircraft are projected to account for 43 percent of the hours flown, with jet aircraft and helicopters accounting for 24 percent and 21 per-cent of the total hours flown respectively. Single-engine turboprop aircraft are projected to account for about 5 percent of the total hours flown, while multi-engine turboprop aircraft and multi-engine piston aircraft each account for a similar proportion of the hours flown, about 3 percent of the total hours flown.
TABlE 6-16 Baseline Forecast of Based Aircraft Activity in 2035 – SCAG Region
Aircraft Type
Forecast Based Air-craft Fleet
Forecast Active
Aircraft
Percent of Aircraft Fleet
ActiveForecast Hours
Flown
-2035 -2035 -2035
Single-engine Piston 7,201 4,025 55.90% 296,209
Single-engine Turboprop 174 142 81.70% 36,770
7,375 4,167 56.50% 332,979
Multi-engine Piston 619 207 33.50% 20,193
Multi-engine Turboprop 157 95 60.80% 20,117
775 302 39.00% 40,310
Jet Aircraft 834 634 76.00% 165,354
Helicopter 668 476 71.20% 147,463
Glider 166 66 40.10% 2,198
Balloon/Other 134 74 55.70% 2,456
9,952 5,720 57.50% 690,761
The Baseline forecast of the total hours flown in 2035 by the based aircraft fleet is broadly consistent with the Baseline forecast of annual hours flown by active pilots in Southern California presented in Chapter 5 and shown in TABlE 5-2 , which gave a regional total of about 961,000 hours per year. While this is some 39 percent higher than the forecast of aircraft hours flown, many commercial flight operations require two pilots

Aviation and Airport Group Access 89
and of course dual instructional flying involves two pilots (the student and the instructor). In these cases both pilots will count the flight time. The higher number of pilot flight hours implies that about 39 percent of the flights involve two pilots, which does not appear an unreasonable amount given the proportion of total pilot flight hours accounted for by stu-dent pilots and the proportion of the higher-end aircraft flight hours flown by jet aircraft, which typically require two pilots.
summary and ConclusionsThis report has presented a review of recent trends in the size and composition of the pilot community in Southern California, as well as changes in the size and composition of the based aircraft fleet and aircraft operations at airports in the region, together with alternative forecasts of how these measures of general aviation activity may evolve in the future. The size of the active pilot community has been slowly declining over the past ten years, and if current trends continue it appears that the number of new student pilots who progress to higher levels of pilot certificate and continue as active pilots will not be suf-ficient to offset the natural attrition of the existing active pilot community, which is largely comprised of older pilots. At the same time, the size of the based aircraft fleet at airports in the region, which has been fairly stable for most of the past decade, has recently also started to show signs of declining. However, the apparent stability in the size of the aircraft fleet for most of the decade concealed a pattern of changes in the composition of the fleet, in which the number of jet aircraft and helicopters has been increasing, while the number of single-engine propeller aircraft, which comprise the majority of the based aircraft fleet, has been steadily declining. In recent years the number of multi-engine propeller aircraft, which had grown somewhat during the first part of the past decade has also begun to decrease.
While the total size of the based aircraft fleet has been fairly stable until the past few years, the number of total aircraft operations across all airports in the Southern California region has been declining steadily throughout the past decade. This decline has been greatest for air taxi and itinerant general aviation operations, but has also occurred for general aviation local operations and even air carrier operations. The fact that the decline in general aviation aircraft operations has been greater than that for the number of active pilots in the region or for the number of based aircraft suggests that not only is the num-ber of active pilots declining, but that those pilot are flying less and the average utilization of the based aircraft fleet is also declining. Since the composition of the based aircraft
fleet has also been changing, with the number of jet aircraft and helicopters, which are generally used more intensively than single-engine propeller aircraft, increasing and the number of single-engine propeller aircraft declining more slowly that general aviation aircraft operations, this suggests that the average utilization of single-engine propeller aircraft has been declining quite steeply.
These findings are broadly consistent with the results of recent FAA surveys of general aviation aircraft owners that have collected data on aircraft utilization. These data show quite clearly that average aircraft utilization declines with the age of the aircraft, both in terms of the percent of the registered aircraft fleet that is actively flown and the average number of hours flown per year by active aircraft. Furthermore there is some evidence from the survey data that in addition to the decline in average utilization as the average age of the aircraft fleet is increasing, the average utilization of aircraft of a given age is also declining.
In contrast to the recent decline in the size of the pilot community and general avia-tion aircraft operations in the Southern California region, the most recent FAA forecast for general aviation activity at the airports in the region projects that this decline in GA activity will reverse in 2012 and be followed by a steady growth to 2030, increasing the number of GA itinerant operations by 16 percent above 2010 levels and the number of GA local operations by 10 percent above 2010 levels. The FAA forecast also projects that based aircraft in the region will increase by 21 percent from 2010 to 2030. Surprisingly, the forecast projects that the number of single-engine and multi-engine propeller air-craft based in the region will increase more rapidly than the number of jet aircraft and helicopters, whereas the trend over the past decade has been quite the reverse, with the numbers of jet aircraft and helicopters increasing, while the numbers of propeller aircraft have declined.
This fairly rosy view of the future of general aviation activity in the Southern California region is not supported by recent studies of the demographics of the pilot community, or the pilot cohort analysis undertaken as part of the current study. Of course, the future is inherently unknown, and there may well be factors that cause the recent trends in new student pilot starts to reverse and the size of the pilot community to begin to grow again, and with it the number of aircraft operations and new aircraft purchases. However, against this has to be set possible future trends in such factors as the cost of flying and
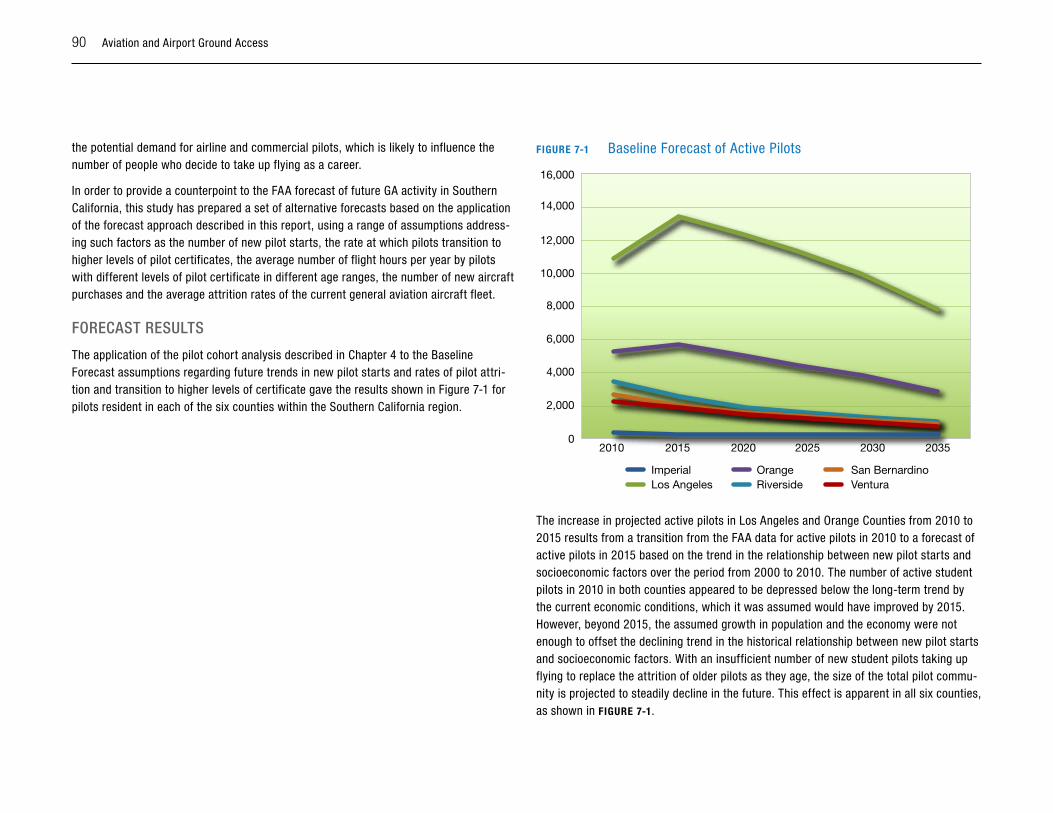
90 Aviation and Airport Ground Access
the potential demand for airline and commercial pilots, which is likely to influence the number of people who decide to take up flying as a career.
In order to provide a counterpoint to the FAA forecast of future GA activity in Southern California, this study has prepared a set of alternative forecasts based on the application of the forecast approach described in this report, using a range of assumptions address-ing such factors as the number of new pilot starts, the rate at which pilots transition to higher levels of pilot certificates, the average number of flight hours per year by pilots with different levels of pilot certificate in different age ranges, the number of new aircraft purchases and the average attrition rates of the current general aviation aircraft fleet.
FoRECAsT REsulTs
The application of the pilot cohort analysis described in Chapter 4 to the Baseline Forecast assumptions regarding future trends in new pilot starts and rates of pilot attri-tion and transition to higher levels of certificate gave the results shown in Figure 7-1 for pilots resident in each of the six counties within the Southern California region.
FIGuRE 7-1 Baseline Forecast of Active Pilots
16,000
14,000
12,000
10,000
8,000
6,000
4,000
2,000
02010 2015
ImperialLos Angeles
OrangeRiverside
San BernardinoVentura
2020 2025 2030 2035
The increase in projected active pilots in Los Angeles and Orange Counties from 2010 to 2015 results from a transition from the FAA data for active pilots in 2010 to a forecast of active pilots in 2015 based on the trend in the relationship between new pilot starts and socioeconomic factors over the period from 2000 to 2010. The number of active student pilots in 2010 in both counties appeared to be depressed below the long-term trend by the current economic conditions, which it was assumed would have improved by 2015. However, beyond 2015, the assumed growth in population and the economy were not enough to offset the declining trend in the historical relationship between new pilot starts and socioeconomic factors. With an insufficient number of new student pilots taking up flying to replace the attrition of older pilots as they age, the size of the total pilot commu-nity is projected to steadily decline in the future. This effect is apparent in all six counties, as shown in FIGuRE 7-1.
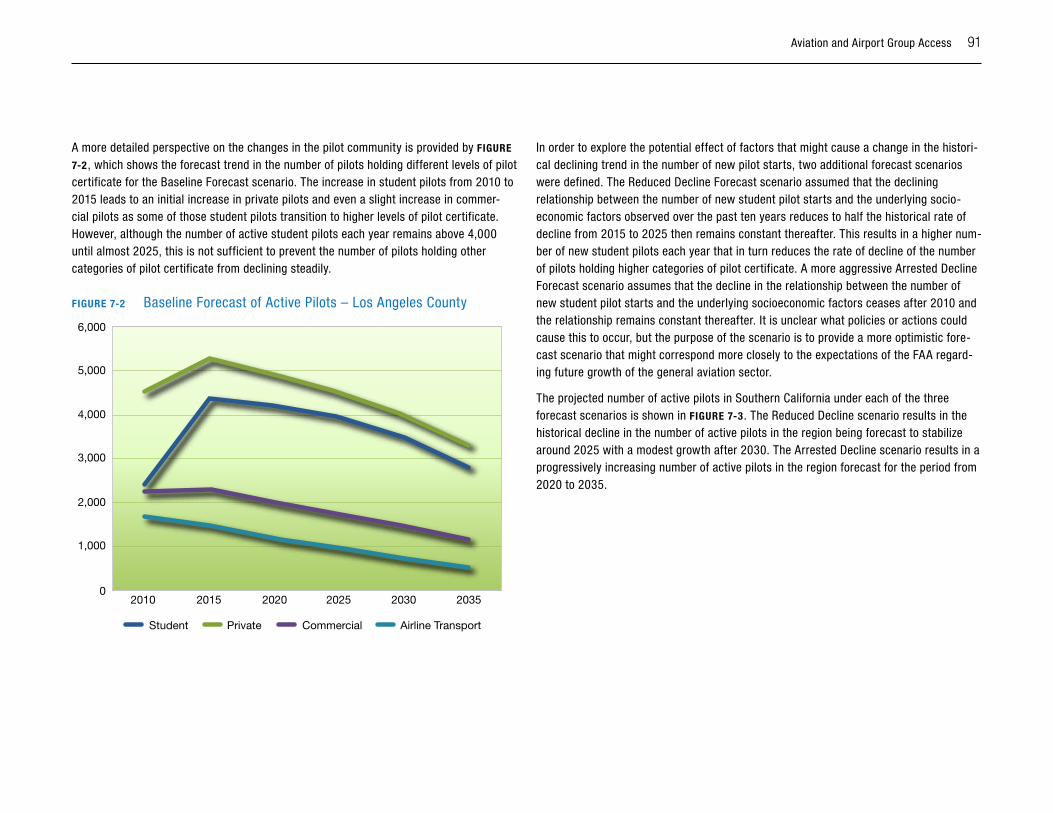
Aviation and Airport Group Access 91
A more detailed perspective on the changes in the pilot community is provided by FIGuRE
7-2 , which shows the forecast trend in the number of pilots holding different levels of pilot certificate for the Baseline Forecast scenario. The increase in student pilots from 2010 to 2015 leads to an initial increase in private pilots and even a slight increase in commer-cial pilots as some of those student pilots transition to higher levels of pilot certificate. However, although the number of active student pilots each year remains above 4,000 until almost 2025, this is not sufficient to prevent the number of pilots holding other categories of pilot certificate from declining steadily.
FIGuRE 7-2 Baseline Forecast of Active Pilots – Los Angeles County
6,000
5,000
4,000
3,000
2,000
1,000
02010 2015
Student CommercialPrivate Airline Transport
2020 2025 2030 2035
In order to explore the potential effect of factors that might cause a change in the histori-cal declining trend in the number of new pilot starts, two additional forecast scenarios were defined. The Reduced Decline Forecast scenario assumed that the declining relationship between the number of new student pilot starts and the underlying socio-economic factors observed over the past ten years reduces to half the historical rate of decline from 2015 to 2025 then remains constant thereafter. This results in a higher num-ber of new student pilots each year that in turn reduces the rate of decline of the number of pilots holding higher categories of pilot certificate. A more aggressive Arrested Decline Forecast scenario assumes that the decline in the relationship between the number of new student pilot starts and the underlying socioeconomic factors ceases after 2010 and the relationship remains constant thereafter. It is unclear what policies or actions could cause this to occur, but the purpose of the scenario is to provide a more optimistic fore-cast scenario that might correspond more closely to the expectations of the FAA regard-ing future growth of the general aviation sector.
The projected number of active pilots in Southern California under each of the three forecast scenarios is shown in FIGuRE 7-3. The Reduced Decline scenario results in the historical decline in the number of active pilots in the region being forecast to stabilize around 2025 with a modest growth after 2030. The Arrested Decline scenario results in a progressively increasing number of active pilots in the region forecast for the period from 2020 to 2035.
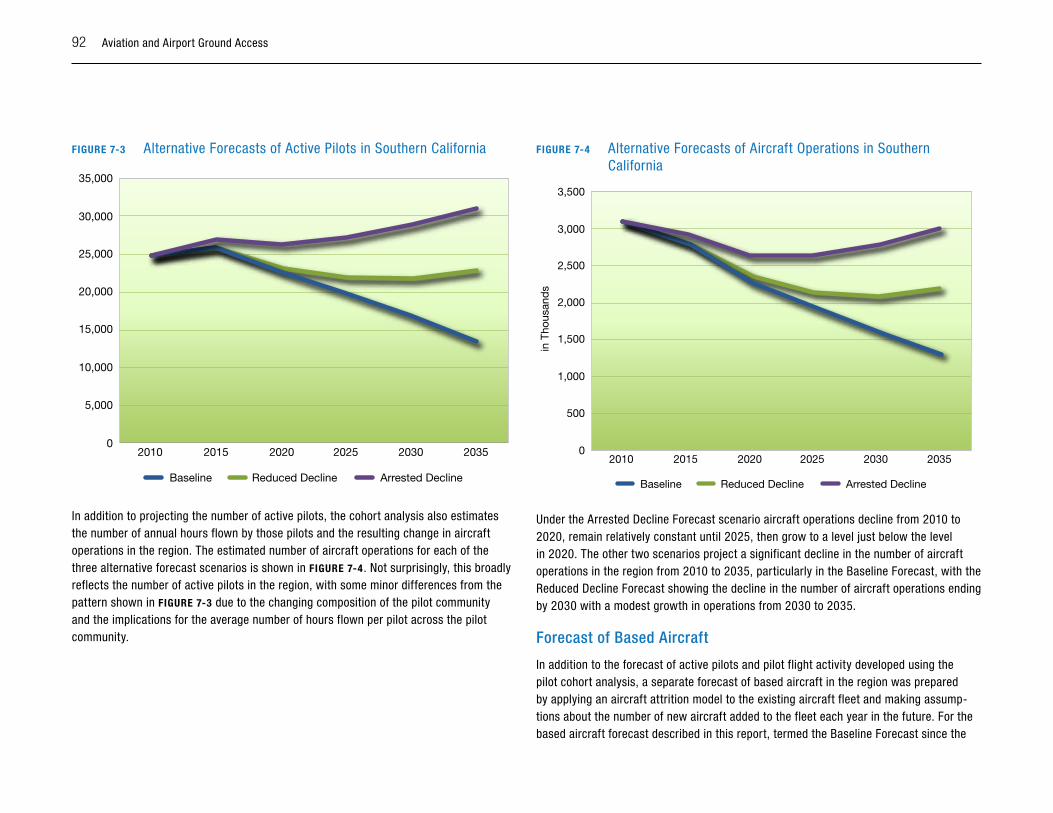
92 Aviation and Airport Ground Access
FIGuRE 7-3 Alternative Forecasts of Active Pilots in Southern California
35,000
30,000
25,000
20,000
10,000
15,000
5,000
02010 2015
Baseline Arrested DeclineReduced Decline
2020 2025 2030 2035
In addition to projecting the number of active pilots, the cohort analysis also estimates the number of annual hours flown by those pilots and the resulting change in aircraft operations in the region. The estimated number of aircraft operations for each of the three alternative forecast scenarios is shown in FIGuRE 7-4. Not surprisingly, this broadly reflects the number of active pilots in the region, with some minor differences from the pattern shown in FIGuRE 7-3 due to the changing composition of the pilot community and the implications for the average number of hours flown per pilot across the pilot community.
FIGuRE 7-4 Alternative Forecasts of Aircraft Operations in Southern California
3,500
3,000
2,500
2,000
1,000
1,500
500
02010 2015
Baseline Arrested DeclineReduced Decline
in T
hous
and
s
2020 2025 2030 2035
Under the Arrested Decline Forecast scenario aircraft operations decline from 2010 to 2020, remain relatively constant until 2025, then grow to a level just below the level in 2020. The other two scenarios project a significant decline in the number of aircraft operations in the region from 2010 to 2035, particularly in the Baseline Forecast, with the Reduced Decline Forecast showing the decline in the number of aircraft operations ending by 2030 with a modest growth in operations from 2030 to 2035.
Forecast of Based Aircraft
In addition to the forecast of active pilots and pilot flight activity developed using the pilot cohort analysis, a separate forecast of based aircraft in the region was prepared by applying an aircraft attrition model to the existing aircraft fleet and making assump-tions about the number of new aircraft added to the fleet each year in the future. For the based aircraft forecast described in this report, termed the Baseline Forecast since the
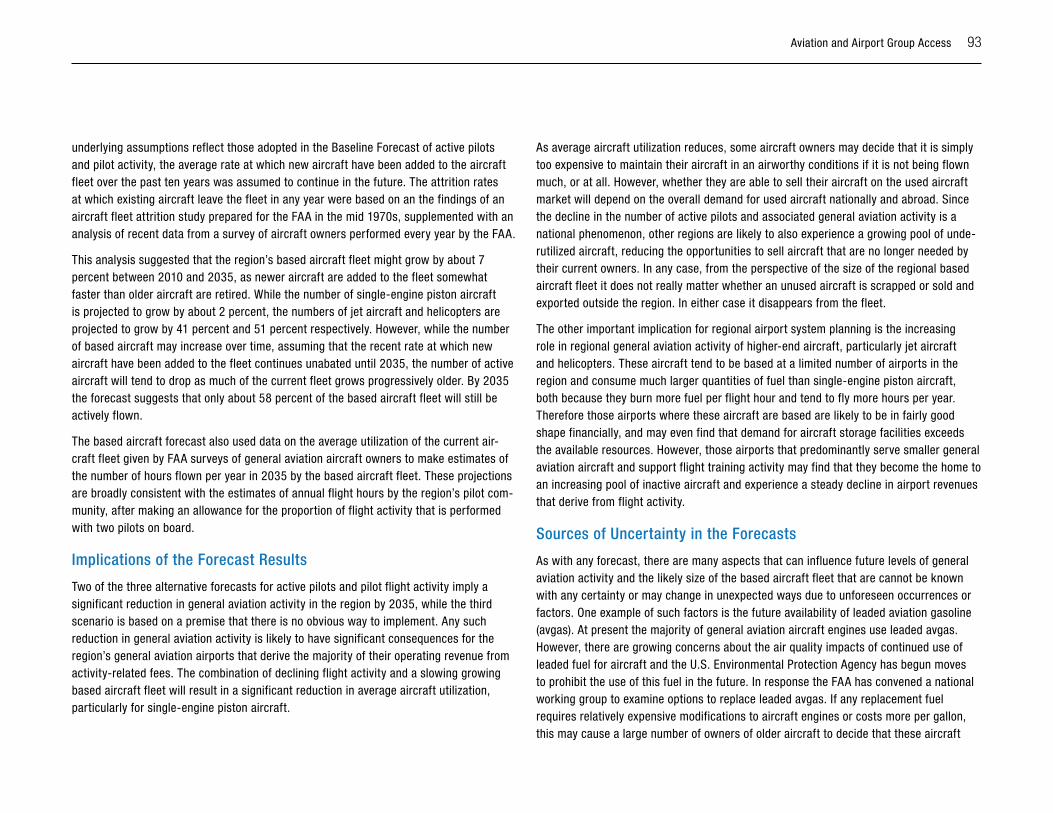
Aviation and Airport Group Access 93
underlying assumptions reflect those adopted in the Baseline Forecast of active pilots and pilot activity, the average rate at which new aircraft have been added to the aircraft fleet over the past ten years was assumed to continue in the future. The attrition rates at which existing aircraft leave the fleet in any year were based on an the findings of an aircraft fleet attrition study prepared for the FAA in the mid 1970s, supplemented with an analysis of recent data from a survey of aircraft owners performed every year by the FAA.
This analysis suggested that the region’s based aircraft fleet might grow by about 7 percent between 2010 and 2035, as newer aircraft are added to the fleet somewhat faster than older aircraft are retired. While the number of single-engine piston aircraft is projected to grow by about 2 percent, the numbers of jet aircraft and helicopters are projected to grow by 41 percent and 51 percent respectively. However, while the number of based aircraft may increase over time, assuming that the recent rate at which new aircraft have been added to the fleet continues unabated until 2035, the number of active aircraft will tend to drop as much of the current fleet grows progressively older. By 2035 the forecast suggests that only about 58 percent of the based aircraft fleet will still be actively flown.
The based aircraft forecast also used data on the average utilization of the current air-craft fleet given by FAA surveys of general aviation aircraft owners to make estimates of the number of hours flown per year in 2035 by the based aircraft fleet. These projections are broadly consistent with the estimates of annual flight hours by the region’s pilot com-munity, after making an allowance for the proportion of flight activity that is performed with two pilots on board.
implications of the Forecast Results
Two of the three alternative forecasts for active pilots and pilot flight activity imply a significant reduction in general aviation activity in the region by 2035, while the third scenario is based on a premise that there is no obvious way to implement. Any such reduction in general aviation activity is likely to have significant consequences for the region’s general aviation airports that derive the majority of their operating revenue from activity-related fees. The combination of declining flight activity and a slowing growing based aircraft fleet will result in a significant reduction in average aircraft utilization, particularly for single-engine piston aircraft.
As average aircraft utilization reduces, some aircraft owners may decide that it is simply too expensive to maintain their aircraft in an airworthy conditions if it is not being flown much, or at all. However, whether they are able to sell their aircraft on the used aircraft market will depend on the overall demand for used aircraft nationally and abroad. Since the decline in the number of active pilots and associated general aviation activity is a national phenomenon, other regions are likely to also experience a growing pool of unde-rutilized aircraft, reducing the opportunities to sell aircraft that are no longer needed by their current owners. In any case, from the perspective of the size of the regional based aircraft fleet it does not really matter whether an unused aircraft is scrapped or sold and exported outside the region. In either case it disappears from the fleet.
The other important implication for regional airport system planning is the increasing role in regional general aviation activity of higher-end aircraft, particularly jet aircraft and helicopters. These aircraft tend to be based at a limited number of airports in the region and consume much larger quantities of fuel than single-engine piston aircraft, both because they burn more fuel per flight hour and tend to fly more hours per year. Therefore those airports where these aircraft are based are likely to be in fairly good shape financially, and may even find that demand for aircraft storage facilities exceeds the available resources. However, those airports that predominantly serve smaller general aviation aircraft and support flight training activity may find that they become the home to an increasing pool of inactive aircraft and experience a steady decline in airport revenues that derive from flight activity.
sources of uncertainty in the Forecasts
As with any forecast, there are many aspects that can influence future levels of general aviation activity and the likely size of the based aircraft fleet that are cannot be known with any certainty or may change in unexpected ways due to unforeseen occurrences or factors. One example of such factors is the future availability of leaded aviation gasoline (avgas). At present the majority of general aviation aircraft engines use leaded avgas. However, there are growing concerns about the air quality impacts of continued use of leaded fuel for aircraft and the U.S. Environmental Protection Agency has begun moves to prohibit the use of this fuel in the future. In response the FAA has convened a national working group to examine options to replace leaded avgas. If any replacement fuel requires relatively expensive modifications to aircraft engines or costs more per gallon, this may cause a large number of owners of older aircraft to decide that these aircraft
94 Aviation and Airport Ground Access
are not worth modifying or continuing to operate, with implications for the aircraft fleet attrition rates.
In the other direction, a growing demand for airline pilots as many current airline pilots approach retirement could stimulate a renewed interest in careers as a professional pilot, leading to a surge in new student pilots taking up flying. Continued growth in business aviation could exacerbate the demand for commercial pilots as many of the current com-mercial pilots also approach retirement or are unable to maintain their medical certificate as they grow older.
Beyond these larger trends that may affect the underlying dynamics of the industry, there are other sources of uncertainty that arise from limitations of current data sources and a lack of recent studies that have examined underlying issues in any detail. A good example of this is that fact that most recent formal study of aircraft attrition rates was performed in the mid-1970s when the general aviation sector was very different. There have been no studies that have looked at how aircraft attrition rates vary across different categories of aircraft, such as between single-engine piston aircraft, jet aircraft, and helicopters. Similar, data on the average number of hours flown per year by pilots of difference ages and holding different types of pilot certificate, or even the type of flying that they do, is extremely limited. For example, while the FAA provides detailed data on the certificates held by individual pilots on its website, the data contain no information on the number of hours those pilots fly or the type of flying that they do. While the FAA knows the age of every pilot, for privacy reasons this information is not made public.
It is thus unclear how many pilots holding a commercial pilot or airline transport pilot certificate are in fact working as a profession pilot or flight instructor, or obtained the certificate with an intention of working as a professional pilot but are not currently doing so. Similarly it is not clear how many individuals holding a student pilot certificate are actively progressing to obtaining a private pilot certificate and how many have long since given up learning to fly or are keeping the medical certificate valid in the hope of one day resuming their flight training but are not currently actively doing so.
next steps
The regional general aviation demand forecasts presented in this report complete the first phase of a two-phase study for the Southern California Association of Governments. The second phase, not currently funded, will develop a based airport choice model that can
be used to examine how the forecast regional demand is likely to be distributed among the airports in each county and how this allocation of general aviation activity may be influenced by actions that SCAG or others could take.
As part of this modeling work, the second phase of the study could revisit some of the issues identified in the analysis performed to date and refine the assumptions used in the pilot cohort analysis and the based aircraft forecast. These issues could include a more detailed study of general aviation aircraft attrition rates using the data from the FAA general aviation aircraft activity surveys and further analysis of pilot attrition rates and transition to higher levels of pilot certificate.
A large amount of data has been assembled in the course of the current phase of the study and a number of extremely complex spreadsheet models have been developed to implement the pilot cohort analysis and the based aircraft forecast model. It would be highly desirable for SCAG to devote some resources to organizing and documenting these data and models so that they can be easily updated and reused in the future without hav-ing to invest a large amount of money and time reinventing this particular wheel.
ReferencesAircraft Owners and Pilots Association (AOPA), “General Aviation Trends Report – Fourth Quarter 2010,” AOPA Online: General Aviation Trends, at
http://www.aopa.org/whatsnew/trend.html (accessed May 21, 2011).
Ashiabor, Senanu, Hojong Baik, and Antonio Trani, “Logit Models for Forecasting Nationwide Intercity Travel Demand in the United States,” Transportation Research Record: Journal of the Transportation Research Board, No. 2007, pp. 1-12, 2006.
Baik, Hojong, Senanu Ashiabor, and Antonio Trani, “Development of an Airport Choice Model for General Aviation Operations,” Transportation Research Record: Journal of the Transportation Research Board, No. 1951, pp. 17-29, 2006.
Baik, Hojong, Antonio A. Trani, et al., “Forecasting Model for Air Taxi, Commercial Airline, and Automobile Demand in the United States,” Transportation Research Record: Journal of the Transportation Research Board, No. 2052, pp. 9-20, 2008.
Aviation and Airport Group Access 95
Booze, Charles F., Jr., Attrition from Active Airman Status during 1970, Report FAA-AM-72-13, Civil Aeromedical Institute, Federal Aviation Administration, Oklahoma City, Oklahoma, March 1972.
Executive Resource Associates, Inc., General Aviation Pilot and Aircraft Activity Survey – Calendar Year 1990, Prepared for the Federal Aviation Administration, Office of Management Systems, Arlington, Virginia, 1991.
General Aviation Manufacturers Association (GAMA), 2010 General Aviation Statistical Databook & Industry Outlook, Washington, DC, February 2011. Available at: http://www.gama.aero/publications/
Gosling, Geoffrey D., and Liping Cao, Aviation Forecasting for System Planning – Review of Recent Literature and Annotated Bibliography, Working Paper UCB-ITS-WP-94-4, Institute of Transportation Studies, University of California, Berkeley, June 1994.
GRA, Inc., Forecasting Aviation Activity by Airport, Prepared for U.S. Federal Aviation Administration, Office of Aviation Policy and Plans, Washington, DC, July 2001. Available at http://www.faa.gov/data_research/aviation_data_statistics/
GRA, Inc., Model for Estimating General Aviation Operations at Non-Towered Airports Using Towered and Non-Towered Airport Data, Prepared for U.S. Federal Aviation Administration, Office of Aviation Policy and Plans, Jenkintown, Pennsylvania, July 2001. Available at http://www.faa.gov/data_research/aviation_data_statistics/
J.P. Morgan Aerospace and Defense, Business Jet Monthly - May 2011, May 11, 2011. Available at https://www.chase.com/online/commercial-bank/document/BusinessJetMonthly.pdf
Li, Guohua, Susan P. Baker, et al., “Age, Flight Experience, and Risk of Crash Involvement in a Cohort of Professional Pilots,” American Journal of Epidemiology, Vol. 157, No. 10, pp. 874-880, 2003.
National Business Aviation Association (NBAA), 2010 NBAA Business Aviation Fact Book, Washington, DC, 2011. Available at: http://www.nbaa.org/business-aviation/fact-book/
North Central Texas Council of Governments (NCTCOG), General Aviation and Heliport Activity Forecasting – Modeling, White Paper #2, Prepared for the NCTCOG Regional General Aviation and Heliport System Plan, Arlington, Texas, August 2009.
Metropolitan Transportation Commission (MTC), Regional Airport System Plan Update – San Francisco Bay Area, Oakland, California, November 1994. Available at http://ntl.bts.gov/lib/000/500/563/ra.html
Peterman, Connie L., Paul B. Rogers, et al., Development of an Aeromedical Scientific Information System for Aviation Safety, Report DOT/FAA/AM-08/1, Civil Aerospace Medical Institute, Federal Aviation Administration, Oklahoma City, Oklahoma, January 2008. Available at: http://www.faa.gov/library/reports/medical/oamtechreports/2000s/media/200801.pdf
Rebok, George W., Yandong Qiang, et al., “Pilot Age and Error in Air-Taxi Crashes,” Aviation, Space, and Environmental Medicine, Vol. 80, No. 7, pp. 647-651, 2009.
Rocks, James K., A Study of Attrition in the Domestic General Aviation Fleet, Report FAA-AVP-75-14, Prepared for the U.S. Federal Aviation Administration, Office of Aviation Policy, Optimum Computer Systems, Inc., Washington, DC, April 1976.
Rogers, Paul B, Stephen J.H. Véronneau, et al., An Analysis of the U.S. Pilot Population From 1983-2005: Evaluating the Effects of Regulatory Change, Report DOT/FAA/AM-09/9, Civil Aerospace Medical Institute, Federal Aviation Administration, Oklahoma City, Oklahoma, May 2009. Available at: http://www.faa.gov/library/reports/medical/oamtechreports/2000s/media/200909.pdf
Rohacs, Daniel, “Potential European Small Aircraft Prediction and Demand Models,” Paper presented at the 6th International Conference on Nonlinear Problems in Aviation and Aerospace, Budapest, Hungary, June 21-23, 2006, Eurocontrol Experimental Center, Bretigny, France. Available at http://www.eurocontrol.int/eec/public/standard_page/LIB_Conf_2006.html
Spitz, William, and Richard Golaszewski, Airport Aviation Activity Forecasting, ACRP Synthesis 2, Airport Cooperative Research Program, Transportation Research Board, Washington, DC, January 2007. Available at http://www.trb.org/Publications/PubsACRPSynthesisReports.aspx
Trani, Antonio A., Hojong Baik, et al., “Integrated Model for Studying Small Aircraft Transportation System,” Transportation Research Record: Journal of the Transportation Research Board, No. 1850, pp. 1-10, 2003.

96 Aviation and Airport Ground Access
Transportation Research Board (TRB), Aviation Demand Forecasting - A Survey of Methodologies, Transportation Research E-Circular, Number E-C040, Washington, DC, August 2002. Available at: http://www.trb.org/Publications/PubsTransportationResearchCirculars.aspx
U.S. Federal Aviation Administration, 1969 U.S. Civil Airmen Statistics, Washington, DC, 1970.
U.S. Federal Aviation Administration, FAA Aerospace Forecast, Fiscal Years 2011-2031, Washington, DC, February, 2011, at http://www.faa.gov/about/office_org/headquarters_offices/apl/aviation_forecasts/ (accessed April 26, 2011).
U.S. Federal Aviation Administration, Terminal Area Forecast Summary, Fiscal Years 2010-2030, Washington, DC, February, 2011, at http://aspm.faa.gov/main/taf.asp (accessed April 29, 2011).
U.S. Federal Aviation Administration, General Aviation and Part 135 Activity Survey, Washington, DC, annual, last updated with Calendar Year 2009 survey on April 19, 2011, at http://www.faa.gov/data_research/aviation_data_statistics/general_aviation/ (accessed May 25, 2011).
U.S. Federal Aviation Administration, Airmen Certification: Airmen Registration Database, Washington, DC, periodic, last updated May 2, 2011, at http://www.faa.gov/licenses_cer-tificates/airmen_certification/releasable_airmen_download/ (accessed May 3, 2011)
U.S. Federal Aviation Administration, U.S. Civil Airmen Statistics, Washington, DC, annual, last updated May 16, 2011, at http://www.faa.gov/data_research/aviation_data_statis-tics/civil_airmen_statistics/ (accessed May 19, 2011)
U.S. Federal Aviation Administration, Airmen Certification: Regional Active Airmen Totals, Washington, DC, periodic, last updated May 24, 2011, at http://registry.faa.gov/activeair-men/ (accessed May 24, 2011)
Aviation and Airport Group Access 97
Regional Aviation policies and Action stepsRecommended by the SCAG Aviation Technical Advisory Committee for the 1012 Regional Transportation Plan.
BackgroundThe SCAG Aviation Technical Advisory Committee (ATAC) participated in a series of round table discussions over a six month period to identify regional aviation policy issues that merited further evaluation for inclusion in the 2012 Regional Transportation Plan (RTP). The end result of these discussions and debates was a recommended list of high-priority regional aviation policies and implementing action steps for inclusion in the 2012-2035 RTP. The intent of these policies and action steps is to set a future agenda for the SCAG Aviation Program, to be used in supporting new aviation-related legislation and identifying and carrying out new projects for future RTPs. The recommended regional aviation poli-cies and action steps are listed below, grouped in four categories: (1) Regional Aviation Demand, Airport Infrastructure and Airport Ground Access; (2) Airport Economics, Finance and Funding; (3) Airport Land Use Compatibility and Environmental Impacts; and (4) Airspace Planning and New Technologies.
i. REGionAl AviATion DEMAnD, AiRpoRT inFRAsTRuCTuRE AnD AiRpoRT GRounD ACCEss
A. policies � The capability of uncongested secondary airports in the region to accommodate
future aviation demand, where such growth is desired, should be preserved during periods of declining or stagnant air traffic
� Uncongested secondary airports in the region, where additional activity is desired, should be supported through appropriate incentives, marketing, and projects that enhance their capacity and regional accessibility
� The factors that most influence the growth in demand for air travel and the composi-tion of the market should be identified
� A regional consensus should be developed on how best to support the develop-ment of new air services at uncongested secondary airports, where such growth is desired
� State-of-the-art aviation demand forecast methodologies should be employed to accurately forecast future aviation demand in the region’s complex multi-airport sys-tem, and regional aviation demand forecasts should be regularly updated to address changing conditions
� Existing and planned regional highway and high-occupancy transit improvements should be leveraged to the extent possible to increase the regional accessibility of uncongested secondary airports, where traffic is desired, while minimizing improve-ment needs
B. Action steps � SCAG should work with the region’s airport operators to conduct a region-wide air
passenger survey on an ongoing basis, designed to enhance and inform regional aviation demand forecasting and airport marketing efforts
� SCAG should develop an in-house aviation demand forecasting model that can support the development of future forecasts and allocation of forecast demand to airports in a complex multi-airport regional system. The model should be fully inte-grated with SCAG’s regional transportation model, and should have airport ground access modeling capabilities
� SCAG should work with the region’s airport operators and business community to define a region-wide marketing effort to promote alternatives to increased use of congested urban airports, consistent with the policy directions of airport operators
� SCAG should identify and define incentives that airports can effectively use to encourage airlines to provide new air service
� SCAG should establish a Regional Airport Ground Access Task Force to define poten-tial projects and programs to improve airport accessibility to secondary airports, and reduce vehicular traffic generated by the large urban airports. The Task Force would help plan and promote rail and express bus service improvements and extensions to airports in the region, as well as an integrated regional system of remote air terminals (“FlyAways”)
98 Aviation and Airport Ground Access
ii. AiRpoRT EConoMiCs, FinAnCE AnD FunDinG
A. policies � New funding mechanisms should be identified for implementing regional infrastruc-
ture and airport ground access improvements
� Efforts by airport operators to develop strategic financial plans and explore non-aeronautical revenue-generating use of underutilized airport property should be supported
� Strategies that enhance the economic contribution of aviation to the regional economy should be identified and implemented
B. Action steps � SCAG should sponsor and support new legislation that allows for more flexible use
of airport revenues for off-airport ground access projects when requested by airport operators
� The Airport Ground Access Task Force should explore and develop potential new funding sources to support specific projects they have identified for improving regional airport accessibility
� SCAG should coordinate with the region’s County Transportation Commissions and other transportation agencies to include joint funding of airport ground access proj-ects identified in SCAG’s Regional Transportation Plan in those agencies’ plans
� SCAG should sponsor new legislation to allow for underutilized airport property to be used for revenue-generating non-aeronautical uses, and should coordinate with the Federal Aviation Administration to make appropriate changes in their guidelines concerning non-aeronautical uses
� SCAG should conduct regional aviation economic impact studies that identify the economic benefits to the region of different types and levels of regional aviation activity, and the likely economic impacts of implementing alternative strategies for serving future regional aviation demand
iii. AiRpoRT lAnD usE CoMpATiBiliTy AnD EnviRonMEnTAl iMpACTs
A. policies � Increased coordination between airport planning and land use planning on both
regional and local levels should be promoted
� Regional support and coordination should be extended to the region’s Airport Land Use Commissions
� Information on aviation environmental “best practices” should be shared and dis-seminated on a regional level
� Mechanisms for promoting cleaner and quieter aircraft at the region’s airports should be identified and supported
B. Action steps � SCAG should continue to conduct airport “smart growth” projects, using the
Airport Smart Growth Framework developed for the Chino Airport Smart Growth Demonstration Project and applying it to different airport settings
� SCAG should incorporate airport “smart growth” land use principles in land use forecasts used by future regional transportation plans
� SCAG should periodically conduct information sharing forums for the region’s Airport Land Use Commissions in cooperation with the Caltrans Division Aeronautics on “best practices” for airport land use compatibility planning
� SCAG should serve as a clearinghouse for information on aviation environmental “best practices” by airports for mitigating air, noise and water pollution and reduc-ing greenhouse gas emissions
� SCAG should sponsor and support new legislation for creating substantial incentives for airlines to upgrade their aircraft fleets to cleaner, quieter aircraft and NextGen-compatible aircraft

Aviation and Airport Group Access 99
iv. AiRspACE plAnninG AnD nEw TEChnoloGiEs
A. policies � Modifications to the regional airspace system that reduce potential airspace con-
flicts, increase passenger safety, reduce costs to airlines, and reduce noise and air quality impacts should be identified and promoted
� Opportunities should be pursued for increasingly the region’s airspace capac-ity, reducing potential future airspace conflicts and increasing airline efficiencies through new navigation and air traffic control technologies
� Existing and potential future airspace constraints should be incorporated into regional aviation planning
B. Action steps � SCAG should continue to coordinate and provide input to the FAA’s Optimization of
Airspace and Procedures in the Metroplex (OAPM) Program for Southern California, and similar airspace modernization activities, including updated operational forecasts
� The SCAG Aviation Technical Advisory Committee (ATAC) should continue and enhance its coordination with the Southern California Airspace Users Working Group (SCAUWG) on airspace issues of regional importance
� SCAG should continue to advocate that the region should serve as an early “test bed” for the phased implementation of new airspace technologies, including new satellite-based NextGen technologies developed by the FAA, that have the poten-tial to reduce airspace conflicts and reduce noise and air quality impacts on local communities
� SCAG should explore how new navigation and air traffic control technologies can contribute to the region’s airspace capacity, and should incorporate potential airspace constraints in aviation demand forecasts developed for future regional transportation plans.
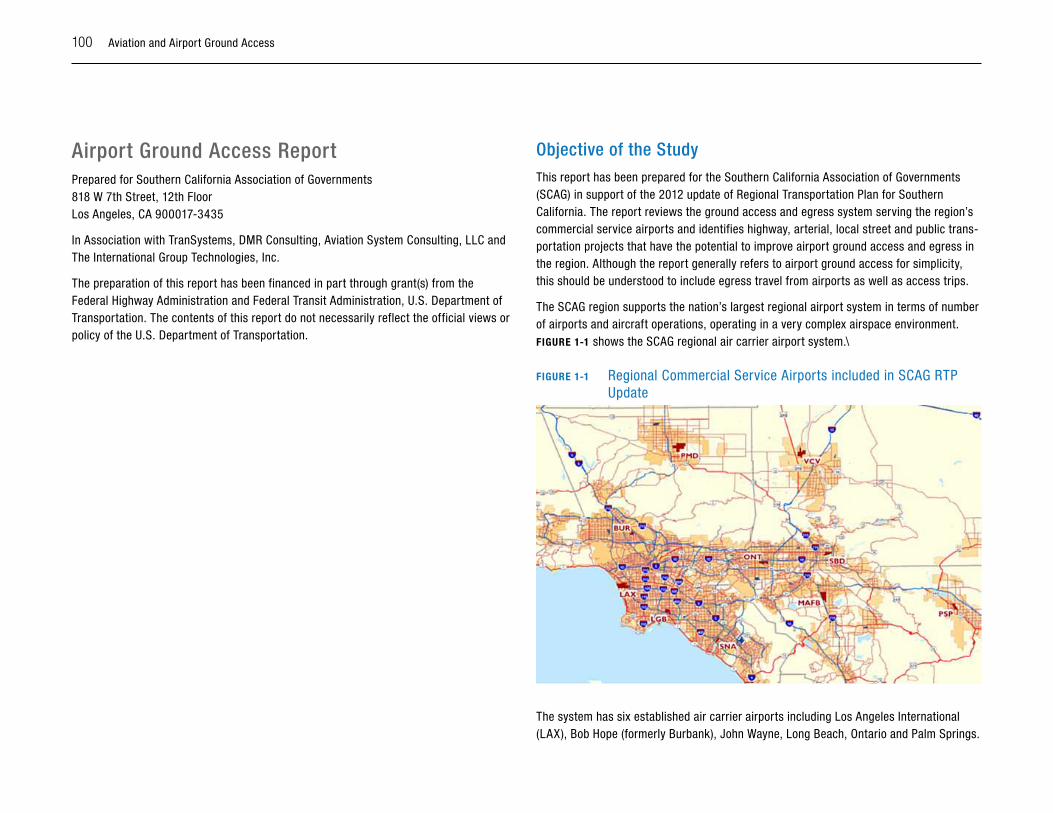
100 Aviation and Airport Ground Access
Airport Ground Access ReportPrepared for Southern California Association of Governments 818 W 7th Street, 12th Floor Los Angeles, CA 900017-3435
In Association with TranSystems, DMR Consulting, Aviation System Consulting, LLC and The International Group Technologies, Inc.
The preparation of this report has been financed in part through grant(s) from the Federal Highway Administration and Federal Transit Administration, U.S. Department of Transportation. The contents of this report do not necessarily reflect the official views or policy of the U.S. Department of Transportation.
objective of the studyThis report has been prepared for the Southern California Association of Governments (SCAG) in support of the 2012 update of Regional Transportation Plan for Southern California. The report reviews the ground access and egress system serving the region’s commercial service airports and identifies highway, arterial, local street and public trans-portation projects that have the potential to improve airport ground access and egress in the region. Although the report generally refers to airport ground access for simplicity, this should be understood to include egress travel from airports as well as access trips.
The SCAG region supports the nation’s largest regional airport system in terms of number of airports and aircraft operations, operating in a very complex airspace environment. FIGuRE 1-1 shows the SCAG regional air carrier airport system.\
FIGuRE 1-1 Regional Commercial Service Airports included in SCAG RTP Update
The system has six established air carrier airports including Los Angeles International (LAX), Bob Hope (formerly Burbank), John Wayne, Long Beach, Ontario and Palm Springs.
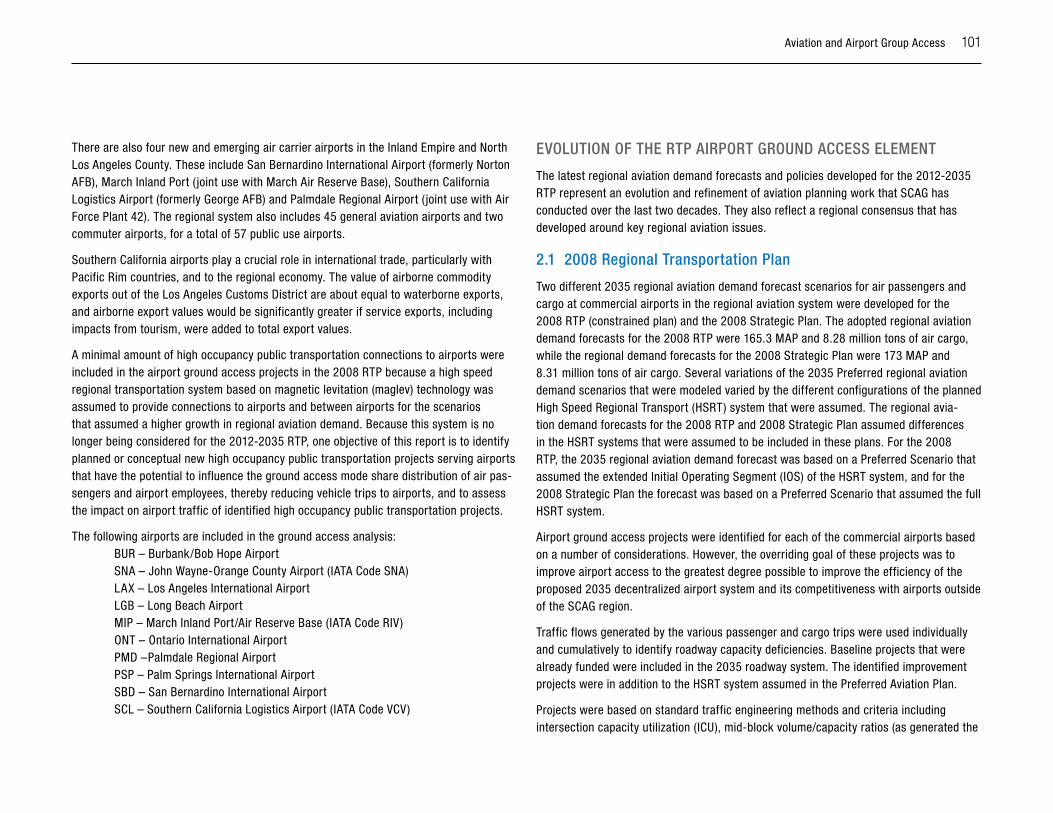
Aviation and Airport Group Access 101
There are also four new and emerging air carrier airports in the Inland Empire and North Los Angeles County. These include San Bernardino International Airport (formerly Norton AFB), March Inland Port ( joint use with March Air Reserve Base), Southern California Logistics Airport (formerly George AFB) and Palmdale Regional Airport ( joint use with Air Force Plant 42). The regional system also includes 45 general aviation airports and two commuter airports, for a total of 57 public use airports.
Southern California airports play a crucial role in international trade, particularly with Pacific Rim countries, and to the regional economy. The value of airborne commodity exports out of the Los Angeles Customs District are about equal to waterborne exports, and airborne export values would be significantly greater if service exports, including impacts from tourism, were added to total export values.
A minimal amount of high occupancy public transportation connections to airports were included in the airport ground access projects in the 2008 RTP because a high speed regional transportation system based on magnetic levitation (maglev) technology was assumed to provide connections to airports and between airports for the scenarios that assumed a higher growth in regional aviation demand. Because this system is no longer being considered for the 2012-2035 RTP, one objective of this report is to identify planned or conceptual new high occupancy public transportation projects serving airports that have the potential to influence the ground access mode share distribution of air pas-sengers and airport employees, thereby reducing vehicle trips to airports, and to assess the impact on airport traffic of identified high occupancy public transportation projects.
The following airports are included in the ground access analysis:BUR – Burbank/Bob Hope AirportSNA – John Wayne-Orange County Airport (IATA Code SNA)LAX – Los Angeles International AirportLGB – Long Beach AirportMIP – March Inland Port/Air Reserve Base (IATA Code RIV)ONT – Ontario International AirportPMD –Palmdale Regional AirportPSP – Palm Springs International AirportSBD – San Bernardino International AirportSCL – Southern California Logistics Airport (IATA Code VCV)
EvoluTion oF ThE RTp AiRpoRT GRounD ACCEss ElEMEnT
The latest regional aviation demand forecasts and policies developed for the 2012-2035 RTP represent an evolution and refinement of aviation planning work that SCAG has conducted over the last two decades. They also reflect a regional consensus that has developed around key regional aviation issues.
2.1 2008 Regional Transportation plan
Two different 2035 regional aviation demand forecast scenarios for air passengers and cargo at commercial airports in the regional aviation system were developed for the 2008 RTP (constrained plan) and the 2008 Strategic Plan. The adopted regional aviation demand forecasts for the 2008 RTP were 165.3 MAP and 8.28 million tons of air cargo, while the regional demand forecasts for the 2008 Strategic Plan were 173 MAP and 8.31 million tons of air cargo. Several variations of the 2035 Preferred regional aviation demand scenarios that were modeled varied by the different configurations of the planned High Speed Regional Transport (HSRT) system that were assumed. The regional avia-tion demand forecasts for the 2008 RTP and 2008 Strategic Plan assumed differences in the HSRT systems that were assumed to be included in these plans. For the 2008 RTP, the 2035 regional aviation demand forecast was based on a Preferred Scenario that assumed the extended Initial Operating Segment (IOS) of the HSRT system, and for the 2008 Strategic Plan the forecast was based on a Preferred Scenario that assumed the full HSRT system.
Airport ground access projects were identified for each of the commercial airports based on a number of considerations. However, the overriding goal of these projects was to improve airport access to the greatest degree possible to improve the efficiency of the proposed 2035 decentralized airport system and its competitiveness with airports outside of the SCAG region.
Traffic flows generated by the various passenger and cargo trips were used individually and cumulatively to identify roadway capacity deficiencies. Baseline projects that were already funded were included in the 2035 roadway system. The identified improvement projects were in addition to the HSRT system assumed in the Preferred Aviation Plan.
Projects were based on standard traffic engineering methods and criteria including intersection capacity utilization (ICU), mid-block volume/capacity ratios (as generated the
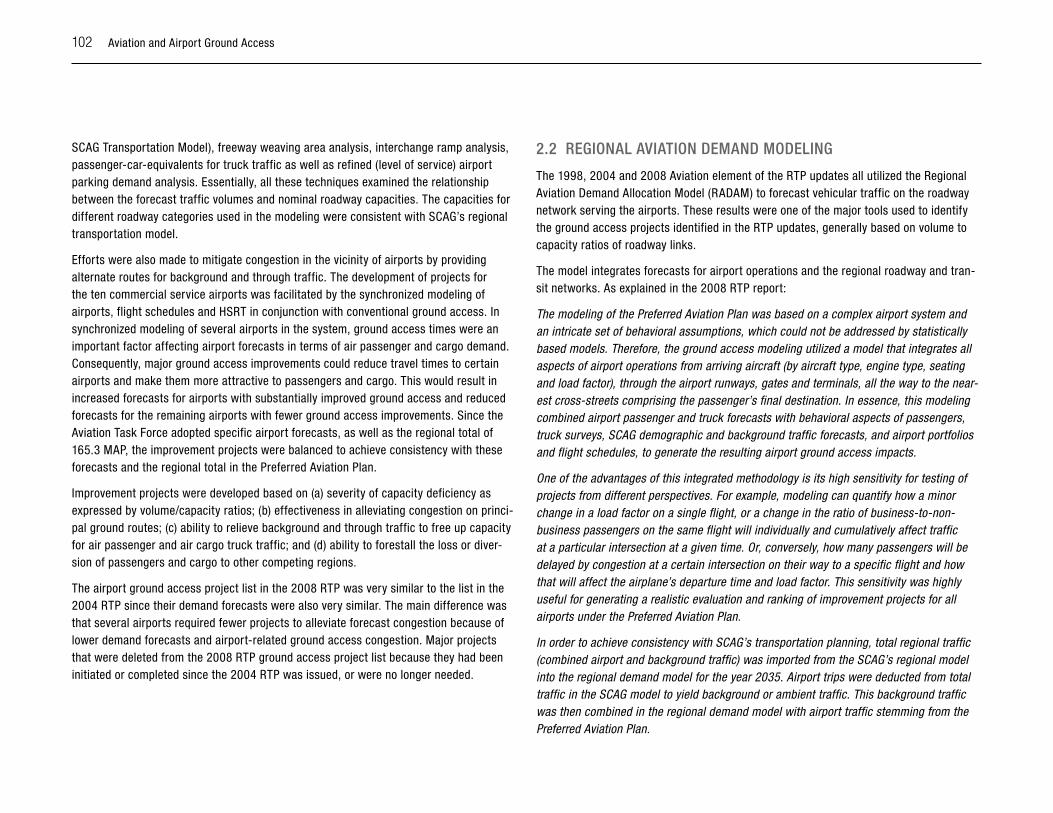
102 Aviation and Airport Ground Access
SCAG Transportation Model), freeway weaving area analysis, interchange ramp analysis, passenger-car-equivalents for truck traffic as well as refined (level of service) airport parking demand analysis. Essentially, all these techniques examined the relationship between the forecast traffic volumes and nominal roadway capacities. The capacities for different roadway categories used in the modeling were consistent with SCAG’s regional transportation model.
Efforts were also made to mitigate congestion in the vicinity of airports by providing alternate routes for background and through traffic. The development of projects for the ten commercial service airports was facilitated by the synchronized modeling of airports, flight schedules and HSRT in conjunction with conventional ground access. In synchronized modeling of several airports in the system, ground access times were an important factor affecting airport forecasts in terms of air passenger and cargo demand. Consequently, major ground access improvements could reduce travel times to certain airports and make them more attractive to passengers and cargo. This would result in increased forecasts for airports with substantially improved ground access and reduced forecasts for the remaining airports with fewer ground access improvements. Since the Aviation Task Force adopted specific airport forecasts, as well as the regional total of 165.3 MAP, the improvement projects were balanced to achieve consistency with these forecasts and the regional total in the Preferred Aviation Plan.
Improvement projects were developed based on (a) severity of capacity deficiency as expressed by volume/capacity ratios; (b) effectiveness in alleviating congestion on princi-pal ground routes; (c) ability to relieve background and through traffic to free up capacity for air passenger and air cargo truck traffic; and (d) ability to forestall the loss or diver-sion of passengers and cargo to other competing regions.
The airport ground access project list in the 2008 RTP was very similar to the list in the 2004 RTP since their demand forecasts were also very similar. The main difference was that several airports required fewer projects to alleviate forecast congestion because of lower demand forecasts and airport-related ground access congestion. Major projects that were deleted from the 2008 RTP ground access project list because they had been initiated or completed since the 2004 RTP was issued, or were no longer needed.
2.2 REGionAl AviATion DEMAnD MoDElinG
The 1998, 2004 and 2008 Aviation element of the RTP updates all utilized the Regional Aviation Demand Allocation Model (RADAM) to forecast vehicular traffic on the roadway network serving the airports. These results were one of the major tools used to identify the ground access projects identified in the RTP updates, generally based on volume to capacity ratios of roadway links.
The model integrates forecasts for airport operations and the regional roadway and tran-sit networks. As explained in the 2008 RTP report:
The modeling of the Preferred Aviation Plan was based on a complex airport system and an intricate set of behavioral assumptions, which could not be addressed by statistically based models. Therefore, the ground access modeling utilized a model that integrates all aspects of airport operations from arriving aircraft (by aircraft type, engine type, seating and load factor), through the airport runways, gates and terminals, all the way to the near-est cross-streets comprising the passenger’s final destination. In essence, this modeling combined airport passenger and truck forecasts with behavioral aspects of passengers, truck surveys, SCAG demographic and background traffic forecasts, and airport portfolios and flight schedules, to generate the resulting airport ground access impacts.
One of the advantages of this integrated methodology is its high sensitivity for testing of projects from different perspectives. For example, modeling can quantify how a minor change in a load factor on a single flight, or a change in the ratio of business-to-non-business passengers on the same flight will individually and cumulatively affect traffic at a particular intersection at a given time. Or, conversely, how many passengers will be delayed by congestion at a certain intersection on their way to a specific flight and how that will affect the airplane’s departure time and load factor. This sensitivity was highly useful for generating a realistic evaluation and ranking of improvement projects for all airports under the Preferred Aviation Plan.
In order to achieve consistency with SCAG’s transportation planning, total regional traffic (combined airport and background traffic) was imported from the SCAG’s regional model into the regional demand model for the year 2035. Airport trips were deducted from total traffic in the SCAG model to yield background or ambient traffic. This background traffic was then combined in the regional demand model with airport traffic stemming from the Preferred Aviation Plan.
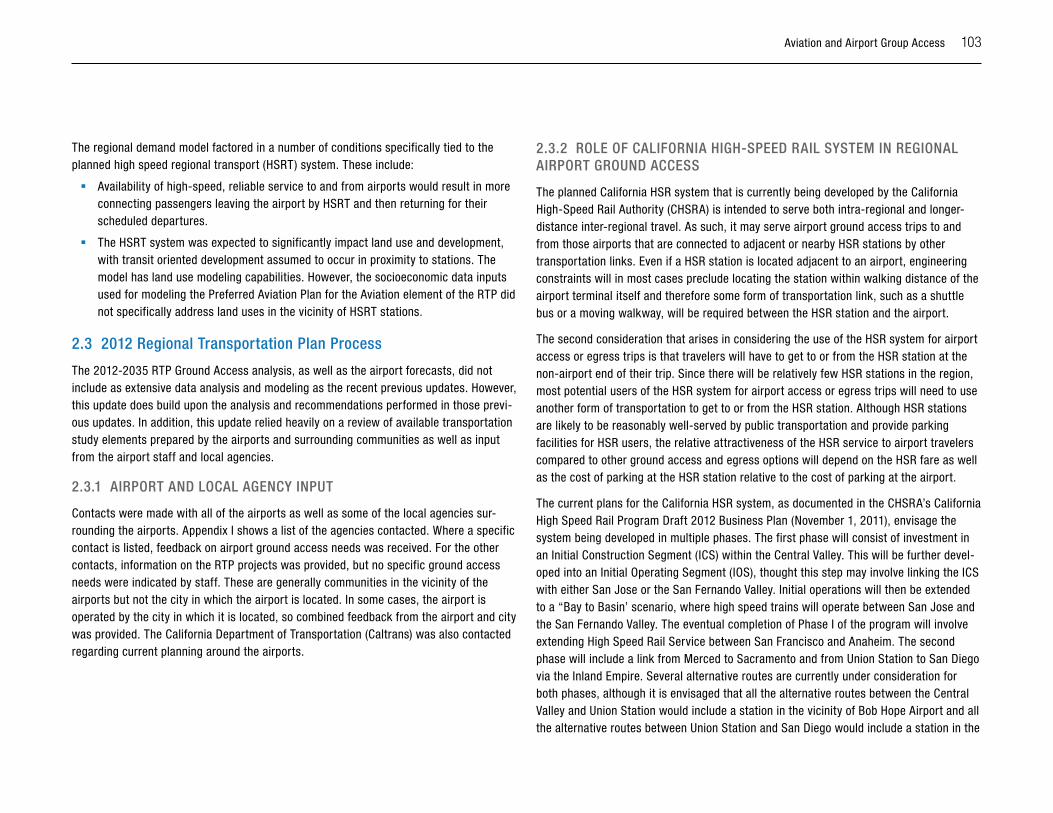
Aviation and Airport Group Access 103
The regional demand model factored in a number of conditions specifically tied to the planned high speed regional transport (HSRT) system. These include:
� Availability of high-speed, reliable service to and from airports would result in more connecting passengers leaving the airport by HSRT and then returning for their scheduled departures.
� The HSRT system was expected to significantly impact land use and development, with transit oriented development assumed to occur in proximity to stations. The model has land use modeling capabilities. However, the socioeconomic data inputs used for modeling the Preferred Aviation Plan for the Aviation element of the RTP did not specifically address land uses in the vicinity of HSRT stations.
2.3 2012 Regional Transportation plan process
The 2012-2035 RTP Ground Access analysis, as well as the airport forecasts, did not include as extensive data analysis and modeling as the recent previous updates. However, this update does build upon the analysis and recommendations performed in those previ-ous updates. In addition, this update relied heavily on a review of available transportation study elements prepared by the airports and surrounding communities as well as input from the airport staff and local agencies.
2.3.1 AiRpoRT AnD loCAl AGEnCy inpuT
Contacts were made with all of the airports as well as some of the local agencies sur-rounding the airports. Appendix I shows a list of the agencies contacted. Where a specific contact is listed, feedback on airport ground access needs was received. For the other contacts, information on the RTP projects was provided, but no specific ground access needs were indicated by staff. These are generally communities in the vicinity of the airports but not the city in which the airport is located. In some cases, the airport is operated by the city in which it is located, so combined feedback from the airport and city was provided. The California Department of Transportation (Caltrans) was also contacted regarding current planning around the airports.
2.3.2 RolE oF CAliFoRniA hiGh-spEED RAil sysTEM in REGionAl AiRpoRT GRounD ACCEss
The planned California HSR system that is currently being developed by the California High-Speed Rail Authority (CHSRA) is intended to serve both intra-regional and longer-distance inter-regional travel. As such, it may serve airport ground access trips to and from those airports that are connected to adjacent or nearby HSR stations by other transportation links. Even if a HSR station is located adjacent to an airport, engineering constraints will in most cases preclude locating the station within walking distance of the airport terminal itself and therefore some form of transportation link, such as a shuttle bus or a moving walkway, will be required between the HSR station and the airport.
The second consideration that arises in considering the use of the HSR system for airport access or egress trips is that travelers will have to get to or from the HSR station at the non-airport end of their trip. Since there will be relatively few HSR stations in the region, most potential users of the HSR system for airport access or egress trips will need to use another form of transportation to get to or from the HSR station. Although HSR stations are likely to be reasonably well-served by public transportation and provide parking facilities for HSR users, the relative attractiveness of the HSR service to airport travelers compared to other ground access and egress options will depend on the HSR fare as well as the cost of parking at the HSR station relative to the cost of parking at the airport.
The current plans for the California HSR system, as documented in the CHSRA’s California High Speed Rail Program Draft 2012 Business Plan (November 1, 2011), envisage the system being developed in multiple phases. The first phase will consist of investment in an Initial Construction Segment (ICS) within the Central Valley. This will be further devel-oped into an Initial Operating Segment (IOS), thought this step may involve linking the ICS with either San Jose or the San Fernando Valley. Initial operations will then be extended to a “Bay to Basin’ scenario, where high speed trains will operate between San Jose and the San Fernando Valley. The eventual completion of Phase I of the program will involve extending High Speed Rail Service between San Francisco and Anaheim. The second phase will include a link from Merced to Sacramento and from Union Station to San Diego via the Inland Empire. Several alternative routes are currently under consideration for both phases, although it is envisaged that all the alternative routes between the Central Valley and Union Station would include a station in the vicinity of Bob Hope Airport and all the alternative routes between Union Station and San Diego would include a station in the
104 Aviation and Airport Ground Access
vicinity of Ontario International Airport. None of the alternative routes go anywhere near Los Angeles International Airport (LAX), although there is already a FlyAway express bus service between Union Station and LAX.
The CHSRA intends to complete the ICS by 2017, and to begin IOS operations by 2022. The Bay to Basin section is intended to be complete by 2027, and the full completion of Phase I by 2034. The funding to complete these segments is by no means assured at the present time and there are a number of environmental and engineering challenges that are not yet resolved and that could well delay completion of the first phase. The second phase will be operational well after 2035, and the planning horizon of the 2012-2035 RTP.
More details on the potential contribution of the planned California HSR system to ground access and egress at the region’s airports are discussed in Appendix II.
2.3.3 AppRoACh To hiGh oCCupAnCy puBliC TRAnspoRTATion pRojECTs
Public transportation systems in the United States have often been developed to accom-modate commuters with traditional work schedules from Monday through Friday between 8 a.m. and 6 p.m. Public transportation hours of operation and frequency of service are built around peak departure and arrival times, with lower frequencies in the middle of the day and before and after peak commuting times, and typically with minimal or no service for a period of time after midnight and before the start of peak morning service. Weekend service typically operates at lesser frequencies and for shorter hours of operation. Furthermore, more public transportation options are available to accommodate travel to concentrated employment centers, such as the downtown area. This is true for the public transportation system in Southern California.
Because one objective of this report is to identify high occupancy public transportation projects that have the potential to influence the air passenger and airport employee mode shares for their airport trips, it is important to understand the factors that are important to air passengers and airport employees when they make decisions on how to travel to and from an airport. Appendix III presents a discussion of the characteristics of air pas-sengers and airport employees that influence their airport ground access choices and the service characteristics of high occupancy public transportation services that make them viable choices for each customer group. In addition to their role in changing air passenger
mode use for travel to and from airports, high occupancy public transportation services can play a role in the choice of airport selected by an air passenger.
Considering the characteristics and ground transportation needs of airport users, a list of high occupancy public transportation projects was developed for each airport by review-ing documents and having conversations with staff at SCAG, the airports and transit agencies. In addition to projects identified in planning documents or discussions with agency staff, other projects were identified based on the knowledge and experience of the consultant team that appear worth being considered for analysis to determine their potential for shifting air passengers and airport employees from low occupancy modes to high occupancy public transportation.
To provide a comprehensive picture of high occupancy public transportation services that have the potential to influence ground access mode choice to the airport, the high occupancy public transportation projects listed in section IV are categorized into existing projects anticipated to be operating in 2035, funded projects for the strategic plan, and projects suggested for analysis to determine their potential to influence airport ground access mode choice.
2.3.4 hiGhwAy, ARTERiAl AnD loCAl sTREET pRojECTs
For highway, arterial and local street projects, the 2012-2035 RTP Ground Access analysis, as well as the airport forecasts, did not include as extensive of data analysis and modeling as the recent previous updates. However, this update does build upon the analysis and recommendations performed in those previous updates. In addition, this update relied heavily on review of available transportation study elements prepared by the airports and surrounding communities as well as input from the airport staff and local agencies.
iii. upDATED AiRpoRT DEMAnD FoRECAsTs
3.1 summary of Airport Forecasts
3.1.1 pAssEnGER FoRECAsTs
The SCAG Aviation Technical Advisory Committee (ATAC) has reviewed three alterna-tive 2035 regional air passenger demand forecast scenarios for commercial airports, for
Aviation and Airport Group Access 105
potential inclusion in SCAG’s 2012 Regional Transportation Plan (RTP). These include baseline/medium growth, low growth, and high growth forecast scenarios, at 145.9 million annual air passengers (MAP), 130 MAP, and 164 MAP, respectively. ATAC mem-bers agreed that the scenarios present a reasonable range of possible growth rates for commercial aviation in the region over the next 25 years. At its September 22, 2011 meeting, ATAC recommended the Baseline Scenario to serve as the Preferred Regional Air Passenger Demand Forecast for the 2012-2035 RTP, with several caveats. These caveats include:
� The Baseline/Medium Growth Forecast seems to be reasonable in that it is con-sistent with the 2008 RTP Constrained Scenario, which is based on conservative assumptions that are consistent with recent trends. However, the forecast is based on a number of variables that history has shown can change significantly over time, and it is important to update the forecast on an ongoing basis, most importantly for the next (2016) RTP.
� The forecast does not consider the potential impacts of the California High-Speed Rail Project on future regional aviation demand generation and allocation to airports. Future forecast updates should incorporate these potential impacts if and when the project is underway, and has a reasonably achievable implementation schedule.
� The forecast recognizes defined legally-enforceable and physical capacity con-straints at the constrained urban airports including LAX, Bob Hope, Long Beach and John Wayne. However, it does not recognize the fact that the settlement agree-ments at both LAX and John Wayne airports expire in the 2015-2020 time period. Relaxation or elimination of the settlement agreement constraints at these airports could significantly impact forecast allocations of aviation demand at other airport in the regional system. Future updates of the forecast, such as for the 2016 RTP, should incorporate any new information provided by local airport authorities on revised constraints at capacity-constrained airports.
The recommended 2035 Baseline Forecast is essentially the same as the 2035 Constrained/No Project Scenario that was modeled and evaluated by the 2008 RTP. In the 2008 RTP the Constrained Scenario was characterized as a very conservative vision of the regional airport system. It assumed no intra-regional high-speed rail system, no mar-ket incentives, and very conservative behavior on the part of the airlines in adding flights at new and emerging airports (although all air carrier airports that desire commercial
service were allocated some passenger demand even if they currently serve none, which in reality is unlikely, but this scenario did not seek to choose winners and losers). Like the other scenarios in the 2008 RTP, the Constrained Scenario respected existing legally-enforceable policy and physical capacity constraints at urban airports. The approved Baseline Forecast is summarized in TABlE 3-1 below, and compared with forecast scenar-ios modeled for the 2004 and 2008 RTPs.
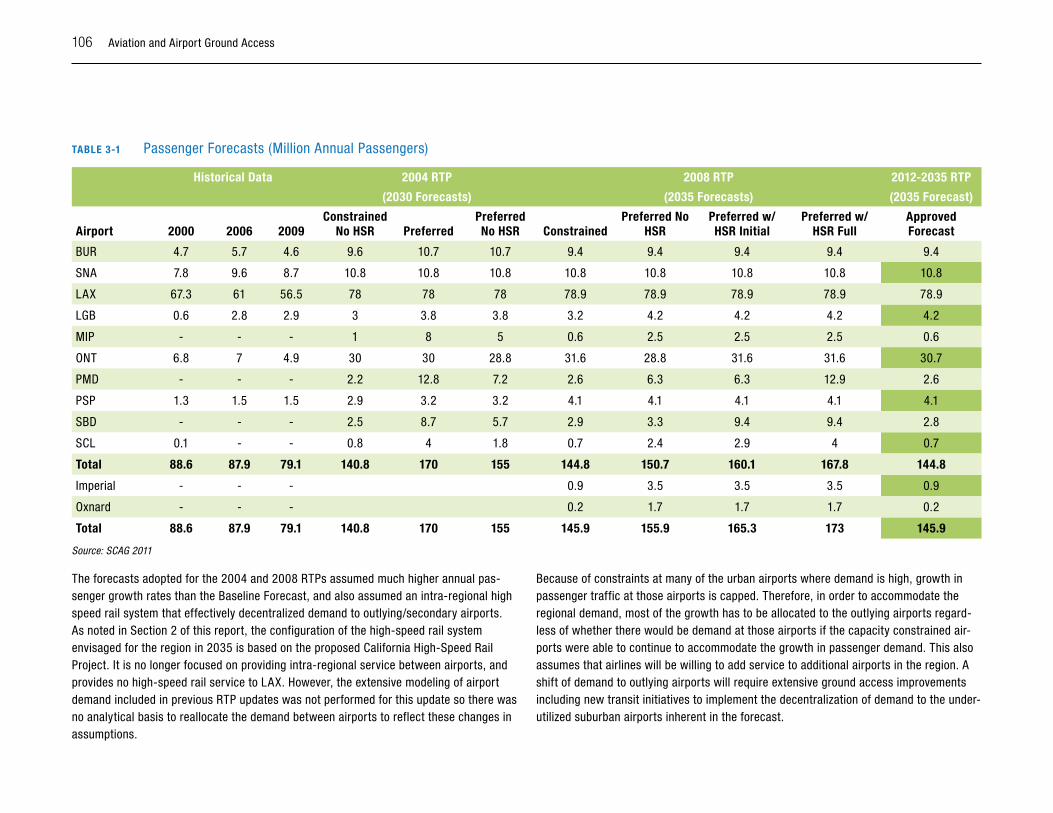
106 Aviation and Airport Ground Access
TABlE 3-1 Passenger Forecasts (Million Annual Passengers)
Historical Data 2004 RTP 2008 RTP 2012-2035 RTP
(2030 Forecasts) (2035 Forecasts) (2035 Forecast)
Airport 2000 2006 2009Constrained
No HSR PreferredPreferred No HSR Constrained
Preferred No HSR
Preferred w/HSR Initial
Preferred w/HSR Full
Approved Forecast
BUR 4.7 5.7 4.6 9.6 10.7 10.7 9.4 9.4 9.4 9.4 9.4
SNA 7.8 9.6 8.7 10.8 10.8 10.8 10.8 10.8 10.8 10.8 10.8
LAX 67.3 61 56.5 78 78 78 78.9 78.9 78.9 78.9 78.9
LGB 0.6 2.8 2.9 3 3.8 3.8 3.2 4.2 4.2 4.2 4.2
MIP - - - 1 8 5 0.6 2.5 2.5 2.5 0.6
ONT 6.8 7 4.9 30 30 28.8 31.6 28.8 31.6 31.6 30.7
PMD - - - 2.2 12.8 7.2 2.6 6.3 6.3 12.9 2.6
PSP 1.3 1.5 1.5 2.9 3.2 3.2 4.1 4.1 4.1 4.1 4.1
SBD - - - 2.5 8.7 5.7 2.9 3.3 9.4 9.4 2.8
SCL 0.1 - - 0.8 4 1.8 0.7 2.4 2.9 4 0.7
Total 88.6 87.9 79.1 140.8 170 155 144.8 150.7 160.1 167.8 144.8
Imperial - - - 0.9 3.5 3.5 3.5 0.9
Oxnard - - - 0.2 1.7 1.7 1.7 0.2
Total 88.6 87.9 79.1 140.8 170 155 145.9 155.9 165.3 173 145.9
Source: SCAG 2011
The forecasts adopted for the 2004 and 2008 RTPs assumed much higher annual pas-senger growth rates than the Baseline Forecast, and also assumed an intra-regional high speed rail system that effectively decentralized demand to outlying/secondary airports. As noted in Section 2 of this report, the configuration of the high-speed rail system envisaged for the region in 2035 is based on the proposed California High-Speed Rail Project. It is no longer focused on providing intra-regional service between airports, and provides no high-speed rail service to LAX. However, the extensive modeling of airport demand included in previous RTP updates was not performed for this update so there was no analytical basis to reallocate the demand between airports to reflect these changes in assumptions.
Because of constraints at many of the urban airports where demand is high, growth in passenger traffic at those airports is capped. Therefore, in order to accommodate the regional demand, most of the growth has to be allocated to the outlying airports regard-less of whether there would be demand at those airports if the capacity constrained air-ports were able to continue to accommodate the growth in passenger demand. This also assumes that airlines will be willing to add service to additional airports in the region. A shift of demand to outlying airports will require extensive ground access improvements including new transit initiatives to implement the decentralization of demand to the under-utilized suburban airports inherent in the forecast.
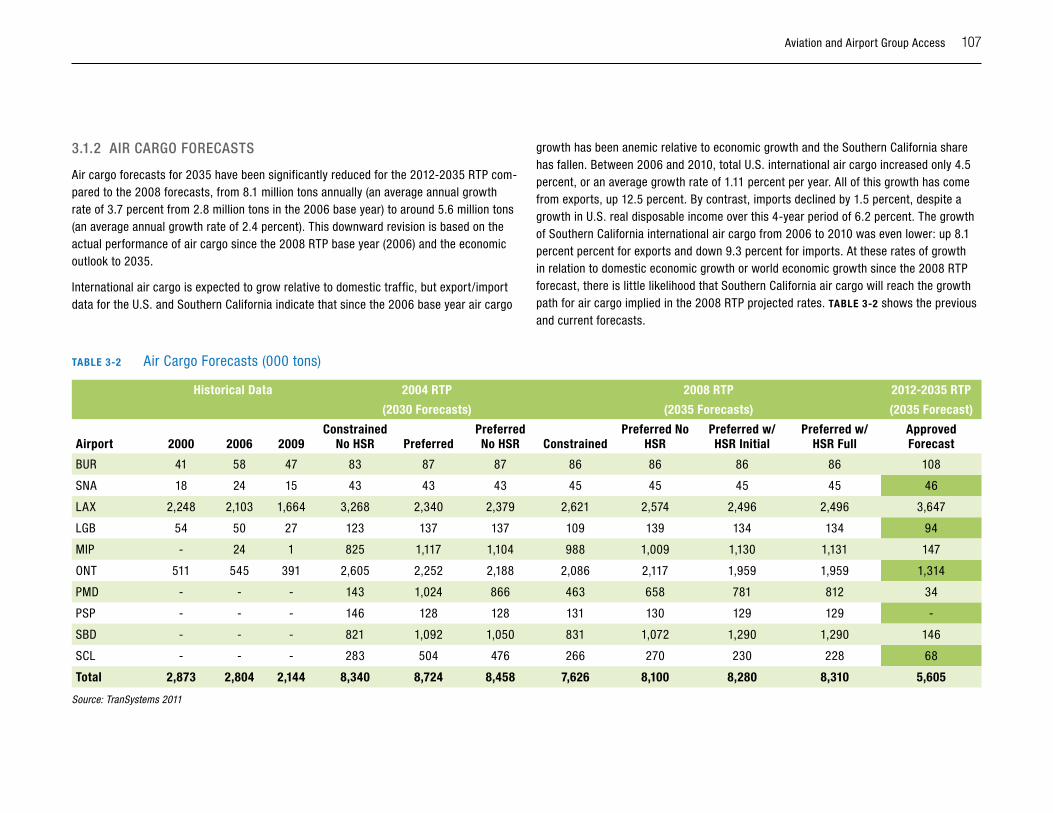
Aviation and Airport Group Access 107
3.1.2 AiR CARGo FoRECAsTs
Air cargo forecasts for 2035 have been significantly reduced for the 2012-2035 RTP com-pared to the 2008 forecasts, from 8.1 million tons annually (an average annual growth rate of 3.7 percent from 2.8 million tons in the 2006 base year) to around 5.6 million tons (an average annual growth rate of 2.4 percent). This downward revision is based on the actual performance of air cargo since the 2008 RTP base year (2006) and the economic outlook to 2035.
International air cargo is expected to grow relative to domestic traffic, but export/import data for the U.S. and Southern California indicate that since the 2006 base year air cargo
growth has been anemic relative to economic growth and the Southern California share has fallen. Between 2006 and 2010, total U.S. international air cargo increased only 4.5 percent, or an average growth rate of 1.11 percent per year. All of this growth has come from exports, up 12.5 percent. By contrast, imports declined by 1.5 percent, despite a growth in U.S. real disposable income over this 4-year period of 6.2 percent. The growth of Southern California international air cargo from 2006 to 2010 was even lower: up 8.1 percent percent for exports and down 9.3 percent for imports. At these rates of growth in relation to domestic economic growth or world economic growth since the 2008 RTP forecast, there is little likelihood that Southern California air cargo will reach the growth path for air cargo implied in the 2008 RTP projected rates. TABlE 3-2 shows the previous and current forecasts.
TABlE 3-2 Air Cargo Forecasts (000 tons)
Historical Data 2004 RTP 2008 RTP 2012-2035 RTP
(2030 Forecasts) (2035 Forecasts) (2035 Forecast)
Airport 2000 2006 2009Constrained
No HSR PreferredPreferred No HSR Constrained
Preferred No HSR
Preferred w/HSR Initial
Preferred w/HSR Full
Approved Forecast
BUR 41 58 47 83 87 87 86 86 86 86 108
SNA 18 24 15 43 43 43 45 45 45 45 46
LAX 2,248 2,103 1,664 3,268 2,340 2,379 2,621 2,574 2,496 2,496 3,647
LGB 54 50 27 123 137 137 109 139 134 134 94
MIP - 24 1 825 1,117 1,104 988 1,009 1,130 1,131 147
ONT 511 545 391 2,605 2,252 2,188 2,086 2,117 1,959 1,959 1,314
PMD - - - 143 1,024 866 463 658 781 812 34
PSP - - - 146 128 128 131 130 129 129 -
SBD - - - 821 1,092 1,050 831 1,072 1,290 1,290 146
SCL - - - 283 504 476 266 270 230 228 68
Total 2,873 2,804 2,144 8,340 8,724 8,458 7,626 8,100 8,280 8,310 5,605
Source: TranSystems 2011
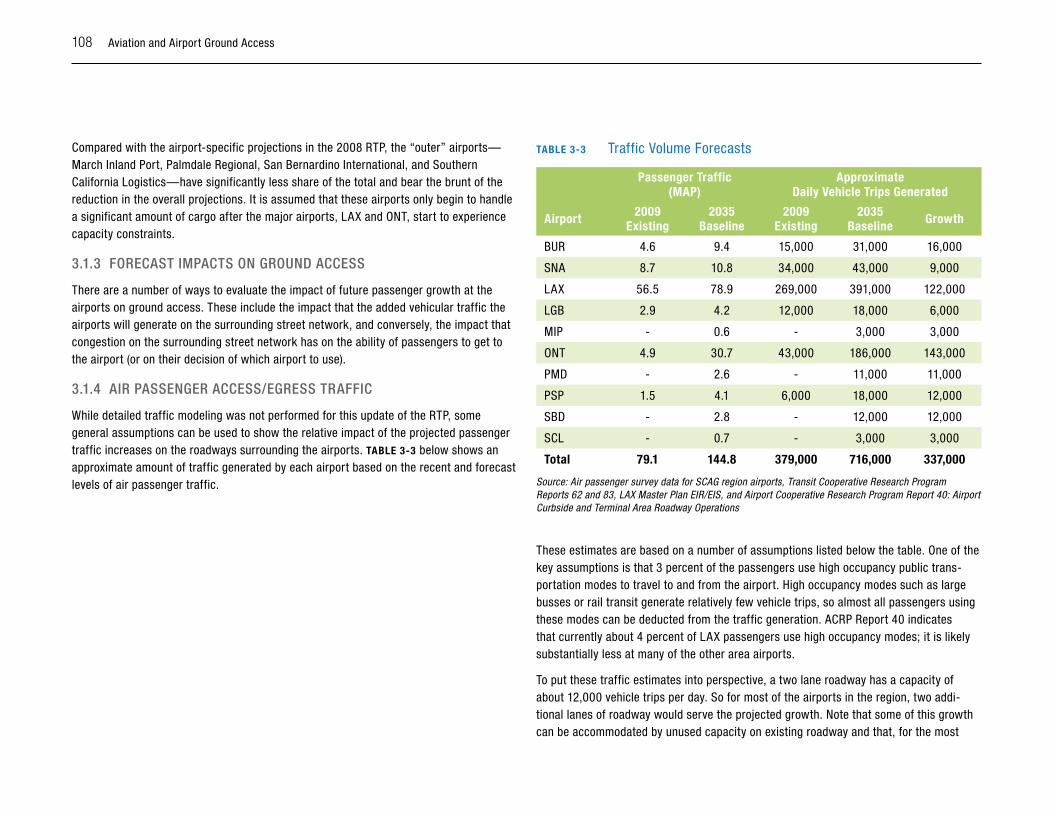
108 Aviation and Airport Ground Access
Compared with the airport-specific projections in the 2008 RTP, the “outer” airports—March Inland Port, Palmdale Regional, San Bernardino International, and Southern California Logistics—have significantly less share of the total and bear the brunt of the reduction in the overall projections. It is assumed that these airports only begin to handle a significant amount of cargo after the major airports, LAX and ONT, start to experience capacity constraints.
3.1.3 FoRECAsT iMpACTs on GRounD ACCEss
There are a number of ways to evaluate the impact of future passenger growth at the airports on ground access. These include the impact that the added vehicular traffic the airports will generate on the surrounding street network, and conversely, the impact that congestion on the surrounding street network has on the ability of passengers to get to the airport (or on their decision of which airport to use).
3.1.4 AiR pAssEnGER ACCEss/EGREss TRAFFiC
While detailed traffic modeling was not performed for this update of the RTP, some general assumptions can be used to show the relative impact of the projected passenger traffic increases on the roadways surrounding the airports. TABlE 3-3 below shows an approximate amount of traffic generated by each airport based on the recent and forecast levels of air passenger traffic.
TABlE 3-3 Traffic Volume Forecasts
Passenger Traffic (MAP)
Approximate Daily Vehicle Trips Generated
Airport 2009 Existing
2035 Baseline
2009 Existing
2035 Baseline Growth
BUR 4.6 9.4 15,000 31,000 16,000
SNA 8.7 10.8 34,000 43,000 9,000
LAX 56.5 78.9 269,000 391,000 122,000
LGB 2.9 4.2 12,000 18,000 6,000
MIP - 0.6 - 3,000 3,000
ONT 4.9 30.7 43,000 186,000 143,000
PMD - 2.6 - 11,000 11,000
PSP 1.5 4.1 6,000 18,000 12,000
SBD - 2.8 - 12,000 12,000
SCL - 0.7 - 3,000 3,000
Total 79.1 144.8 379,000 716,000 337,000
Source: Air passenger survey data for SCAG region airports, Transit Cooperative Research Program Reports 62 and 83, LAX Master Plan EIR/EIS, and Airport Cooperative Research Program Report 40: Airport Curbside and Terminal Area Roadway Operations
These estimates are based on a number of assumptions listed below the table. One of the key assumptions is that 3 percent of the passengers use high occupancy public trans-portation modes to travel to and from the airport. High occupancy modes such as large busses or rail transit generate relatively few vehicle trips, so almost all passengers using these modes can be deducted from the traffic generation. ACRP Report 40 indicates that currently about 4 percent of LAX passengers use high occupancy modes; it is likely substantially less at many of the other area airports.
To put these traffic estimates into perspective, a two lane roadway has a capacity of about 12,000 vehicle trips per day. So for most of the airports in the region, two addi-tional lanes of roadway would serve the projected growth. Note that some of this growth can be accommodated by unused capacity on existing roadway and that, for the most
Aviation and Airport Group Access 109
part, the demand would be spread out over the many roadways that serve the airports. Many of the capacity improvements around these airports are likely to be “spot” improve-ments – adding turn lanes at intersections, grade separations at railroad crossings, access management along key roadways, etc.
However, for the high growth airports such as LAX and Ontario, the forecast increase in passenger traffic may result in over 100,000 additional vehicle trips per day on the adjacent roads. If concentrated onto one roadway, this would require a new eight to ten-lane road. It may be difficult to add this level of capacity to the surrounding roads (as well as the capacity to accommodate growth in non-airport related traffic on these roads). Therefore, it is essential that increased public transportation service be provided at these airports.
3.1.5 FREiGhT TRAFFiC
As with passenger traffic, a simplified estimation process was used to gauge the magni-tude of the impact of projected freight traffic on the roadways surrounding the airports. Based on 2009 freight truck data available for six of the airports in the region (BUR, SNA, LAX, LGB, MIP and ONT), truck trip generation rates were developed as shown in TABlE 3-4.
The data showed about 0.5 daily truck trips per 1,000 annual tons of air cargo at LAX and 0.6 at ONT and MIP. At the other airports, the rate was higher, at about 1.6 truck trips per 1,000 tons. This is due to the fact that much more of the cargo at the high freight airports is either “through” freight being transferred from one aircraft to another (and thus never onto a truck) or moved using larger trucks (some semi-trailer trucks versus small trucks or vans).
TABlE 3-4 Air Cargo Truck Volume Forecasts
Cargo (000 tons) Approximate Daily Truck Trips Generated
2009 Existing 2035 Baseline 2009 Existing 2035 Baseline Growth
47 108 75 173 98
15 46 24 74 50
1,664 3,647 832 1,824 992
27 94 43 150 107
1 147 1 88 88
391 1,314 235 788 554
- 34 - 54 54
- - - - -
- 146 - 234 234
- 68 - 109 109
2,144 5,605 1,210 3,494 2,284
Source: TranSystems 2011
Assumptions: 0.5 daily trips per 1,000 tons at LAX, 0.6 trips/1,000 tons at ONT and MAFB, 1.6 trips/1,000 tons at other airports, 312 days/year (6 days/week). Assumptions derived from data in “Air Cargo Mode Choice and Demand Study – Final Report” CalTrans (prepared by TranSystems Corp.), July 2, 2010, page 7, Table 1-2
The resulting calculations show that the forecast increase in cargo traffic will gener-ally result in between 100 and 600 new truck trips per day at each airport. As with the passenger vehicle traffic estimates, the same capacity rules apply for roadways – a two lane road accommodates about 12,000 passenger vehicles per day. From a road-way capacity standpoint, a truck is equivalent to between about 1.5 and 3.0 passenger vehicles, depending on the size of the truck (e.g. panel van versus semi-trailer truck) and roadway characteristics (width, grade, etc.). Therefore, the projected increase in truck traffic due to air cargo operations has an impact of generally less than about 1,000 pas-senger vehicles per day. This level of impact typically would not require construction of new roadways or major roadway widening projects. Instead, it would likely require spot improvements near freight access points to the airports – e.g. intersection improvements or added gate capacity at entrances to the airport cargo areas.
110 Aviation and Airport Ground Access
3.1.6 FoRECAsT ChAnGE iMpACTs on GRounD ACCEss nEEDs
Based on these projections, the level of evaluation needed for the ground access needs can generally be placed into three categories: airports with a high passenger/freight forecast of vehicle trips and a significant forecast change; airports with a high passenger/freight forecast of vehicle trips but similar to the 2008 RTP projections; and airports with a low passenger/freight forecast of vehicle trips. Those airports with high traffic and a significant projected change in vehicle trips versus the 2008 RTP would require a more detailed analysis of ground access needs. However, this was not the case with any of the airports. The high passenger traffic airports, LAX, ONT, SNA and BUR all have similar MAP projections in this RTP as in the 2008 RTP. With regard to freight projections at the high freight volume airports, the forecast increased about 40 percent at LAX, decreased about 40 percent at ONT and decreased by more than 85 percent at MIP, PMD and SBD, but these changes are not expected to have a major impact on ground access needs. Therefore, in general, the long term ground access needs for these airports remain similar as to 2008.
For the lower volume airports, in terms of passenger traffic, none of the airports showed an increase in 2035 projections in this RTP versus the 2008 RTP. Several showed a sig-nificant decrease – MIP, PMD and SCL. For air cargo, the forecasts at all of these airports either stayed about the same in this RTP or showed significant decline. While the declin-ing forecasts would decrease the need for ground access improvements at these airports, generally the projects identified are to support basic airport operations such as terminal roadways, or are projects to improve general accessibility to the airport, so significant changes in the ground access recommendations are not expected.
3.2 implications of Airport Forecasts for Airport Ground Access
The forecasts of air passenger demand at the region’s commercial service airports in 2035 shown in TABlE 3-1 imply a significant increase in the number of regional air-port ground access trips compared to 2009 air passenger activity levels. However, the growth in air passenger demand is not forecast to occur at an equal rate at each airport in the region. The four primary airports that serve the urban core of the region, Bob Hope Airport in Burbank (BUR), John Wayne Airport in Orange County (SNA), Long Beach Airport (LGB), and Los Angeles International Airport (LAX), have policy or physical capac-ity constraints that restrict the growth in passenger traffic that they can handle. As a
result, the more outlying or suburban airports are forecast to handle an increasing share of the regional passenger traffic, as shown on TABlE 3-1.
Changes in the distribution of the regional air passenger demand among the airports in the region are likely to affect the composition of the air passenger traffic at each airport, and hence the relationship between air passenger volumes and the number of ground access trips generated by that activity. However, the approach to allocating the regional air passenger demand to airports taken in this RTP precludes a detailed analysis of this effect. Therefore it is been assumed that the level of ground access trips generated at each airport varies in proportion to the air passenger activity at each airport.
3.2.1 ConsTRAinED uRBAn AiRpoRTs
Although each of the four constrained urban commercial service airports will experi-ence an increase in airport ground access traffic by 2035, the increase in air passenger activity over 2009 levels varies from 1.3 million annual passengers (MAP) at LGB to 22.4 MAP at LAX. Air passenger activity at SNA will increase by 2.1 MAP, while that at BUR will increase by 4.8 MAP. As a percent of 2009 activity, the air passenger traffic is projected to increase by about 24 percent at SNA and more than double at BUR (an increase of about 105 percent). The percentage increase at LAX is about 40 percent, while that at LGB is about 44 percent.
Clearly, increases of these magnitudes will have significant implications for ground access vehicle traffic at all airports, although the increases at BUR and LAX are likely to have the greatest impacts, at BUR because of the large proportional increase and at LAX because of the absolute magnitude of the increase. However, it should be noted that all four airports have experienced higher passenger activity levels prior to 2009, so the projected increases over the highest air passenger activity levels experienced to date are somewhat lower. Compared to the highest passenger activity levels experienced in recent years, the forecast air passenger growth at BUR is about 59 percent, while that at LAX is about 26 percent. The forecast growth at SNA compared to the highest passenger activity levels experienced in recent years is only about 8 percent, while that at LGB is about 38 percent.
Aviation and Airport Group Access 111
3.2.2 unConsTRAinED suBuRBAn AiRpoRTs
As can be seen from TABlE 3-1, the constraints at the urban airports will result in signifi-cant growth in passenger activity at the outlying unconstrained suburban airports, several of which do not currently have commercial air service. The greatest growth is projected to occur at Ontario International Airport (ONT), for which the passenger traffic is projected to increase to more than five times the 2009 level from 2009 to 2035 under the cur-rent forecast, an increase of 25.8 MAP, or about 527 percent. Palm Springs International Airport (PSP) is projected to experience an increase in passenger activity to nearly three times its 2009 level, an increase of 2.6 MAP, or about 173 percent. Two of the suburban airports that do not currently have commercial air service are projected to experience a combined level of passenger activity by 2035 under the forecast that is similar to the current passenger activity at ONT (4.9 MAP in 2009). San Bernardino International Airport (SBD) is projected to handle 2.8 MAP, while Palmdale Regional Airport is projected to handle 2.6 MAP. March Inland Port (MIP) and Southern California Logistics Airport (SCL) are projected to handle somewhat lower levels of passenger traffic by 2035. Under the 2035 forecast, MIP is projected to handle only 0.6 MAP, while SCL is projected to handle 0.7 MAP.
Other than ONT, none of the suburban airports are projected to experience levels of pas-senger activity that could not be handled by the existing arterial and street system, with some local improvements.
3.2.3 REGionAl AiRlinE AnD GEnERAl AviATion AiRpoRTs
Until recently, two smaller airports in the region, Imperial County Airport (IPL) and Oxnard Airport (OXR), had regional airline service by United Express to LAX. The service from OXR was discontinued in June 2010 but United Express continues to operate two flights a day each way between IPL and LAX. The air passenger demand forecast assumes that limited service would be restored to OXR by 2035, while air service at IPL would expand significantly. Under the approved forecast, IPL is projected to handle 0.9 MAP in 2035 and OXR, 0.2 MAP. These activity levels could easily be handled by the existing arterial and street system.
In addition to the airports with current and projected future commercial air service, there are currently 44 public use general aviation airports in the region. None of these airports have a level of aviation activity that would generate a volume of ground access traffic
that cannot be adequately handled by the existing arterial and street system serving the airport.
iv. suMMARy oF pRojECTs By AiRpoRT
4.1 Bob hope Airport/Burbank (BuR)
Bob Hope Airport in Burbank, California is a very convenient airport for its local service area comprising the cities of Burbank, Glendale and Pasadena, with good access to and from Los Angeles and the San Fernando Valley. Service is provided by Alaska, American, Delta Connection, JetBlue, Southwest, United Express, and US Airways, with frequent schedules along the West Coast and connecting flights across the entire country.
Passenger and Cargo Trends and Constraints: Air passenger and cargo activity are expected to increase steadily, with air passenger traffic growing from 4.6 MAP to 9.4 MAP prior to 2035. The airport is contractually limited to 14 gates, which has been esti-mated by SCAG to limit passenger capacity to 9.4 MAP. Bob Hope Airport does not handle a significant amount of cargo traffic and is not projected to carry a substantial amount in the future (86,000 annual tons).
Studies and Major Planned Projects: Ground Access Study - A 1987 $4.3M STURAA grant remains active and is available for a Bob Hope Airport Ground Access Study. Including the local match totals $5.5 million that is available for the study. The Airport Authority has retained the Orangeline Development Authority (OLDA) as its Project Manager for this study, planned to begin in 2012. Three fundamental objectives have been established by the Airport Authority for this study: Develop linkages to Santa Clarita to Union Station Corridor; reduce north/south traffic on Hollywood Way; evaluate the feasibility of an airport rail station along the Antelope Valley Line in the vicinity of Hollywood Way; and explore east/west connectivity to Pasadena. Results from this study are likely to identify new projects for inclusion in future Airport RTPs.
RITC – The Airport Authority will initiate construction in May/June of 2012 of a new Regional Intermodal Transportation Center (RITC) northwest of the intersection of Hollywood Way and Empire Ave. The RITC will include additional parking, a consolidated car rental facility, an enclosed pedestrian linkage between the adjacent train station and parking facilities, and a moving sidewalk connection to the airport terminal. Another ele-ment of the RITC will be intermodal bus layover center to enhance destination bus service
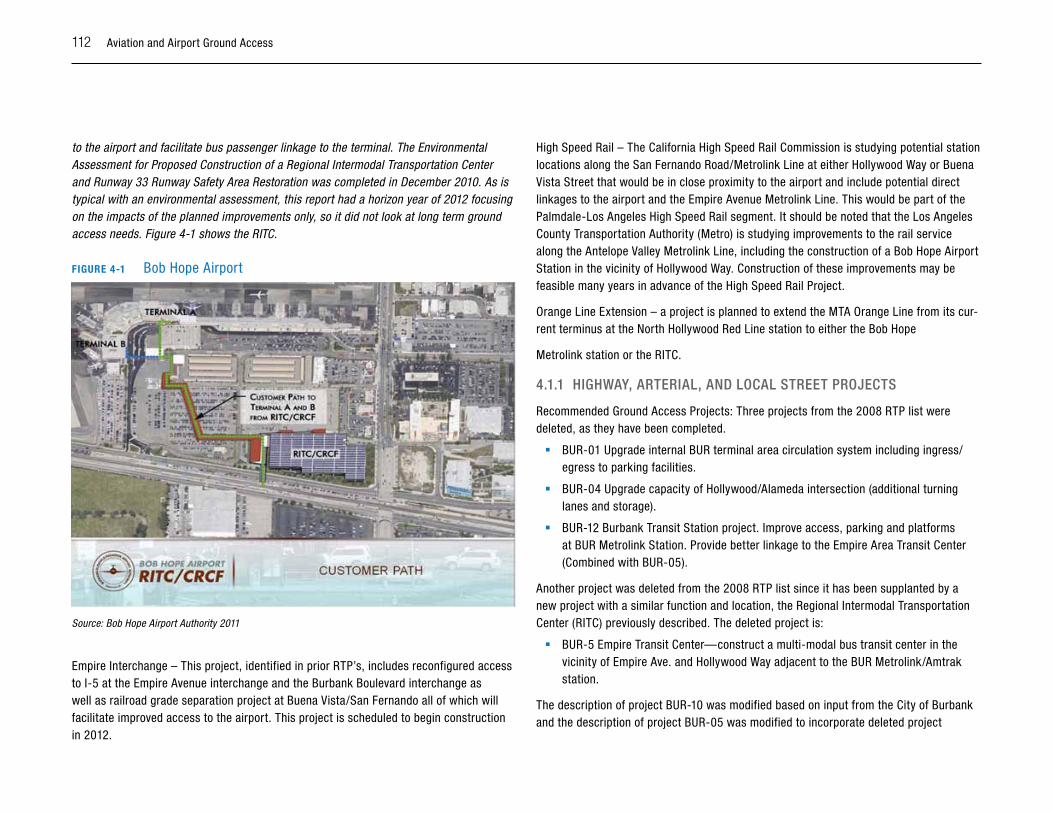
112 Aviation and Airport Ground Access
to the airport and facilitate bus passenger linkage to the terminal. The Environmental Assessment for Proposed Construction of a Regional Intermodal Transportation Center and Runway 33 Runway Safety Area Restoration was completed in December 2010. As is typical with an environmental assessment, this report had a horizon year of 2012 focusing on the impacts of the planned improvements only, so it did not look at long term ground access needs. Figure 4-1 shows the RITC.
FIGuRE 4-1 Bob Hope Airport
Source: Bob Hope Airport Authority 2011
Empire Interchange – This project, identified in prior RTP’s, includes reconfigured access to I-5 at the Empire Avenue interchange and the Burbank Boulevard interchange as well as railroad grade separation project at Buena Vista/San Fernando all of which will facilitate improved access to the airport. This project is scheduled to begin construction in 2012.
High Speed Rail – The California High Speed Rail Commission is studying potential station locations along the San Fernando Road/Metrolink Line at either Hollywood Way or Buena Vista Street that would be in close proximity to the airport and include potential direct linkages to the airport and the Empire Avenue Metrolink Line. This would be part of the Palmdale-Los Angeles High Speed Rail segment. It should be noted that the Los Angeles County Transportation Authority (Metro) is studying improvements to the rail service along the Antelope Valley Metrolink Line, including the construction of a Bob Hope Airport Station in the vicinity of Hollywood Way. Construction of these improvements may be feasible many years in advance of the High Speed Rail Project.
Orange Line Extension – a project is planned to extend the MTA Orange Line from its cur-rent terminus at the North Hollywood Red Line station to either the Bob Hope
Metrolink station or the RITC.
4.1.1 hiGhwAy, ARTERiAl, AnD loCAl sTREET pRojECTs
Recommended Ground Access Projects: Three projects from the 2008 RTP list were deleted, as they have been completed.
� BUR-01 Upgrade internal BUR terminal area circulation system including ingress/egress to parking facilities.
� BUR-04 Upgrade capacity of Hollywood/Alameda intersection (additional turning lanes and storage).
� BUR-12 Burbank Transit Station project. Improve access, parking and platforms at BUR Metrolink Station. Provide better linkage to the Empire Area Transit Center (Combined with BUR-05).
Another project was deleted from the 2008 RTP list since it has been supplanted by a new project with a similar function and location, the Regional Intermodal Transportation Center (RITC) previously described. The deleted project is:
� BUR-5 Empire Transit Center—construct a multi-modal bus transit center in the vicinity of Empire Ave. and Hollywood Way adjacent to the BUR Metrolink/Amtrak station.
The description of project BUR-10 was modified based on input from the City of Burbank and the description of project BUR-05 was modified to incorporate deleted project
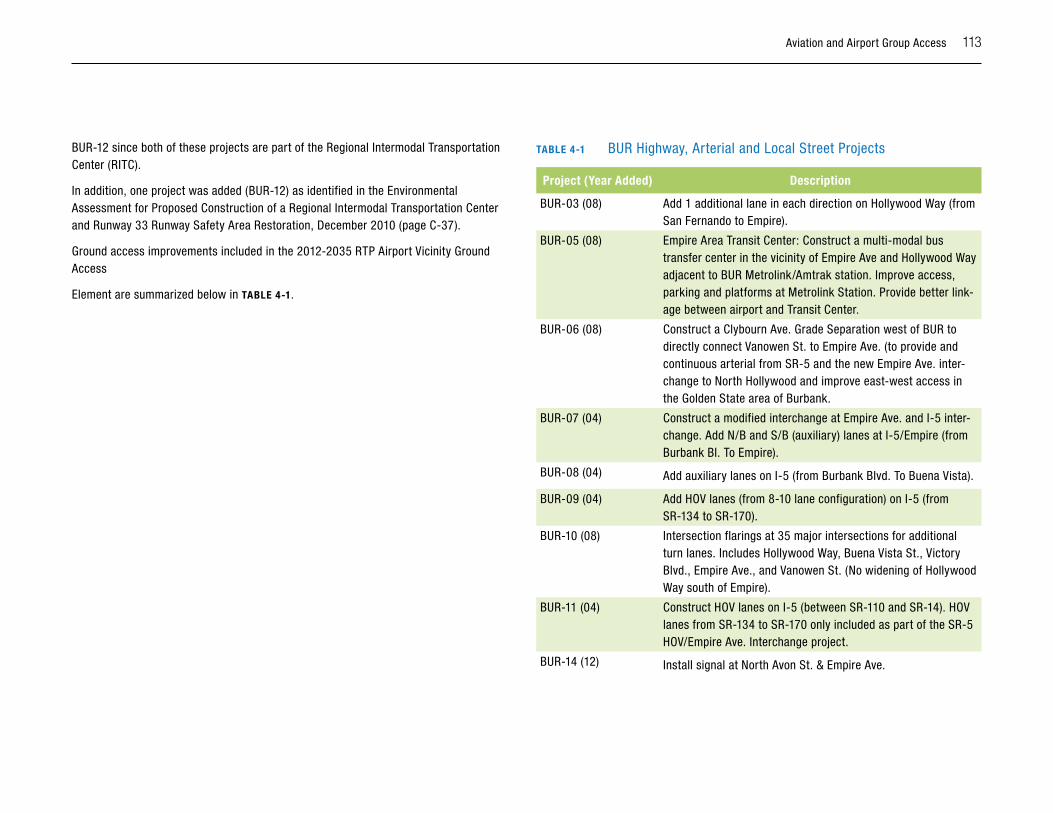
Aviation and Airport Group Access 113
BUR-12 since both of these projects are part of the Regional Intermodal Transportation Center (RITC).
In addition, one project was added (BUR-12) as identified in the Environmental Assessment for Proposed Construction of a Regional Intermodal Transportation Center and Runway 33 Runway Safety Area Restoration, December 2010 (page C-37).
Ground access improvements included in the 2012-2035 RTP Airport Vicinity Ground Access
Element are summarized below in TABlE 4-1.
TABlE 4-1 BUR Highway, Arterial and Local Street Projects
Project (Year Added) Description
BUR-03 (08) Add 1 additional lane in each direction on Hollywood Way (from San Fernando to Empire).
BUR-05 (08) Empire Area Transit Center: Construct a multi-modal bus transfer center in the vicinity of Empire Ave and Hollywood Way adjacent to BUR Metrolink/Amtrak station. Improve access, parking and platforms at Metrolink Station. Provide better link-age between airport and Transit Center.
BUR-06 (08) Construct a Clybourn Ave. Grade Separation west of BUR to directly connect Vanowen St. to Empire Ave. (to provide and continuous arterial from SR-5 and the new Empire Ave. inter-change to North Hollywood and improve east-west access in the Golden State area of Burbank.
BUR-07 (04) Construct a modified interchange at Empire Ave. and I-5 inter-change. Add N/B and S/B (auxiliary) lanes at I-5/Empire (from Burbank Bl. To Empire).
BUR-08 (04) Add auxiliary lanes on I-5 (from Burbank Blvd. To Buena Vista).
BUR-09 (04) Add HOV lanes (from 8-10 lane configuration) on I-5 (from SR-134 to SR-170).
BUR-10 (08) Intersection flarings at 35 major intersections for additional turn lanes. Includes Hollywood Way, Buena Vista St., Victory Blvd., Empire Ave., and Vanowen St. (No widening of Hollywood Way south of Empire).
BUR-11 (04) Construct HOV lanes on I-5 (between SR-110 and SR-14). HOV lanes from SR-134 to SR-170 only included as part of the SR-5 HOV/Empire Ave. Interchange project.
BUR-14 (12) Install signal at North Avon St. & Empire Ave.
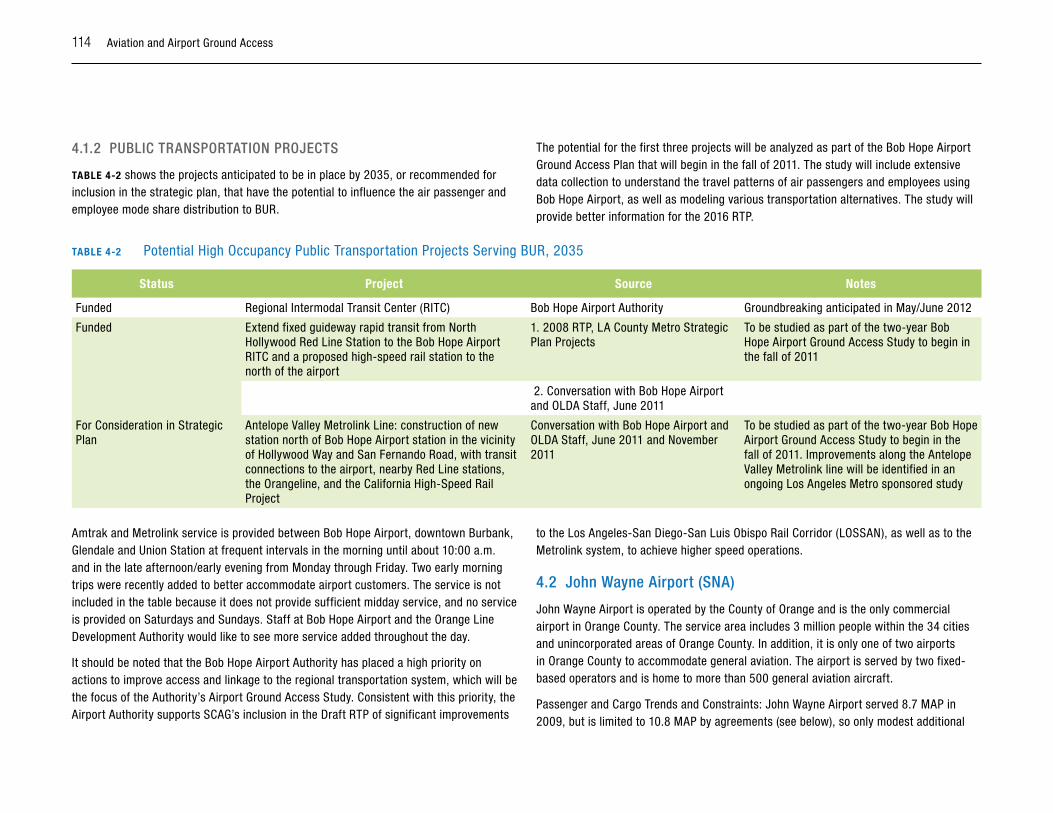
114 Aviation and Airport Ground Access
4.1.2 puBliC TRAnspoRTATion pRojECTs
TABlE 4-2 shows the projects anticipated to be in place by 2035, or recommended for inclusion in the strategic plan, that have the potential to influence the air passenger and employee mode share distribution to BUR.
The potential for the first three projects will be analyzed as part of the Bob Hope Airport Ground Access Plan that will begin in the fall of 2011. The study will include extensive data collection to understand the travel patterns of air passengers and employees using Bob Hope Airport, as well as modeling various transportation alternatives. The study will provide better information for the 2016 RTP.
TABlE 4-2 Potential High Occupancy Public Transportation Projects Serving BUR, 2035
Status Project Source Notes
Funded Regional Intermodal Transit Center (RITC) Bob Hope Airport Authority Groundbreaking anticipated in May/June 2012
Funded Extend fixed guideway rapid transit from North Hollywood Red Line Station to the Bob Hope Airport RITC and a proposed high-speed rail station to the north of the airport
1. 2008 RTP, LA County Metro Strategic Plan Projects
To be studied as part of the two-year Bob Hope Airport Ground Access Study to begin in the fall of 2011
2. Conversation with Bob Hope Airport and OLDA Staff, June 2011
For Consideration in Strategic Plan
Antelope Valley Metrolink Line: construction of new station north of Bob Hope Airport station in the vicinity of Hollywood Way and San Fernando Road, with transit connections to the airport, nearby Red Line stations, the Orangeline, and the California High-Speed Rail Project
Conversation with Bob Hope Airport and OLDA Staff, June 2011 and November 2011
To be studied as part of the two-year Bob Hope Airport Ground Access Study to begin in the fall of 2011. Improvements along the Antelope Valley Metrolink line will be identified in an ongoing Los Angeles Metro sponsored study
Amtrak and Metrolink service is provided between Bob Hope Airport, downtown Burbank, Glendale and Union Station at frequent intervals in the morning until about 10:00 a.m. and in the late afternoon/early evening from Monday through Friday. Two early morning trips were recently added to better accommodate airport customers. The service is not included in the table because it does not provide sufficient midday service, and no service is provided on Saturdays and Sundays. Staff at Bob Hope Airport and the Orange Line Development Authority would like to see more service added throughout the day.
It should be noted that the Bob Hope Airport Authority has placed a high priority on actions to improve access and linkage to the regional transportation system, which will be the focus of the Authority’s Airport Ground Access Study. Consistent with this priority, the Airport Authority supports SCAG’s inclusion in the Draft RTP of significant improvements
to the Los Angeles-San Diego-San Luis Obispo Rail Corridor (LOSSAN), as well as to the Metrolink system, to achieve higher speed operations.
4.2 john wayne Airport (snA)
John Wayne Airport is operated by the County of Orange and is the only commercial airport in Orange County. The service area includes 3 million people within the 34 cities and unincorporated areas of Orange County. In addition, it is only one of two airports in Orange County to accommodate general aviation. The airport is served by two fixed-based operators and is home to more than 500 general aviation aircraft.
Passenger and Cargo Trends and Constraints: John Wayne Airport served 8.7 MAP in 2009, but is limited to 10.8 MAP by agreements (see below), so only modest additional
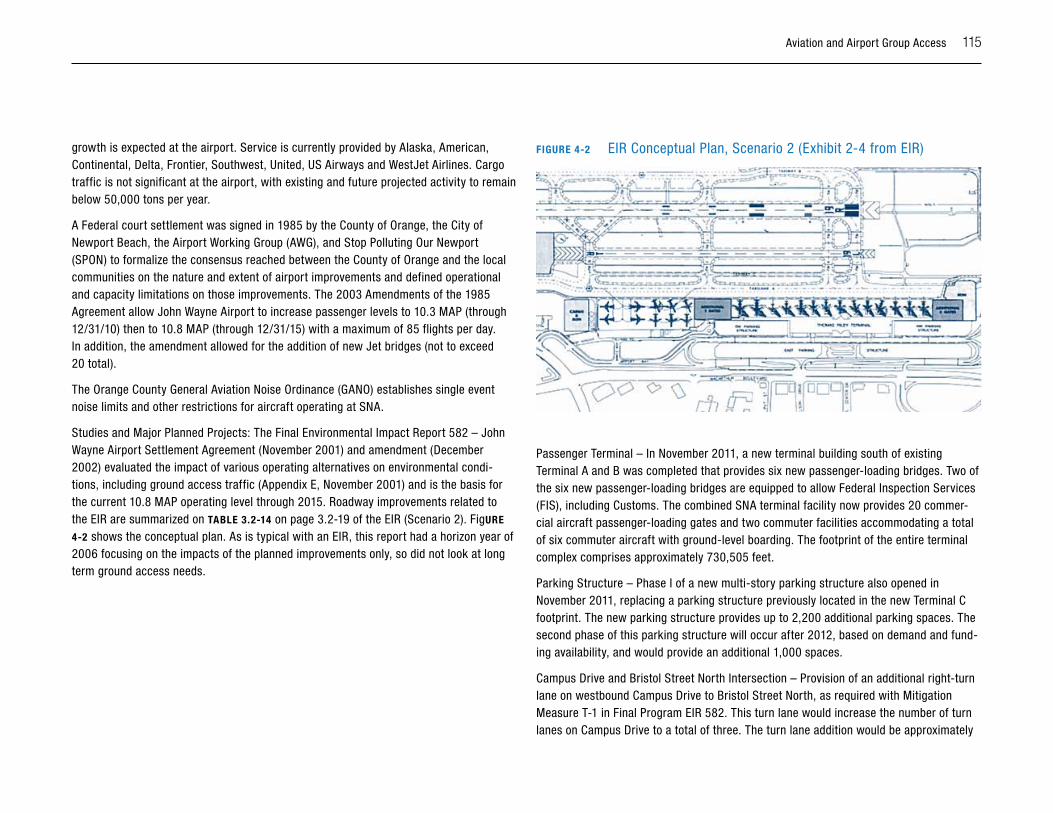
Aviation and Airport Group Access 115
growth is expected at the airport. Service is currently provided by Alaska, American, Continental, Delta, Frontier, Southwest, United, US Airways and WestJet Airlines. Cargo traffic is not significant at the airport, with existing and future projected activity to remain below 50,000 tons per year.
A Federal court settlement was signed in 1985 by the County of Orange, the City of Newport Beach, the Airport Working Group (AWG), and Stop Polluting Our Newport (SPON) to formalize the consensus reached between the County of Orange and the local communities on the nature and extent of airport improvements and defined operational and capacity limitations on those improvements. The 2003 Amendments of the 1985 Agreement allow John Wayne Airport to increase passenger levels to 10.3 MAP (through 12/31/10) then to 10.8 MAP (through 12/31/15) with a maximum of 85 flights per day. In addition, the amendment allowed for the addition of new Jet bridges (not to exceed 20 total).
The Orange County General Aviation Noise Ordinance (GANO) establishes single event noise limits and other restrictions for aircraft operating at SNA.
Studies and Major Planned Projects: The Final Environmental Impact Report 582 – John Wayne Airport Settlement Agreement (November 2001) and amendment (December 2002) evaluated the impact of various operating alternatives on environmental condi-tions, including ground access traffic (Appendix E, November 2001) and is the basis for the current 10.8 MAP operating level through 2015. Roadway improvements related to the EIR are summarized on TABlE 3.2-14 on page 3.2-19 of the EIR (Scenario 2). FiguRE
4-2 shows the conceptual plan. As is typical with an EIR, this report had a horizon year of 2006 focusing on the impacts of the planned improvements only, so did not look at long term ground access needs.
FIGuRE 4-2 EIR Conceptual Plan, Scenario 2 (Exhibit 2-4 from EIR)
Passenger Terminal – In November 2011, a new terminal building south of existing Terminal A and B was completed that provides six new passenger-loading bridges. Two of the six new passenger-loading bridges are equipped to allow Federal Inspection Services (FIS), including Customs. The combined SNA terminal facility now provides 20 commer-cial aircraft passenger-loading gates and two commuter facilities accommodating a total of six commuter aircraft with ground-level boarding. The footprint of the entire terminal complex comprises approximately 730,505 feet.
Parking Structure – Phase I of a new multi-story parking structure also opened in November 2011, replacing a parking structure previously located in the new Terminal C footprint. The new parking structure provides up to 2,200 additional parking spaces. The second phase of this parking structure will occur after 2012, based on demand and fund-ing availability, and would provide an additional 1,000 spaces.
Campus Drive and Bristol Street North Intersection – Provision of an additional right-turn lane on westbound Campus Drive to Bristol Street North, as required with Mitigation Measure T-1 in Final Program EIR 582. This turn lane would increase the number of turn lanes on Campus Drive to a total of three. The turn lane addition would be approximately
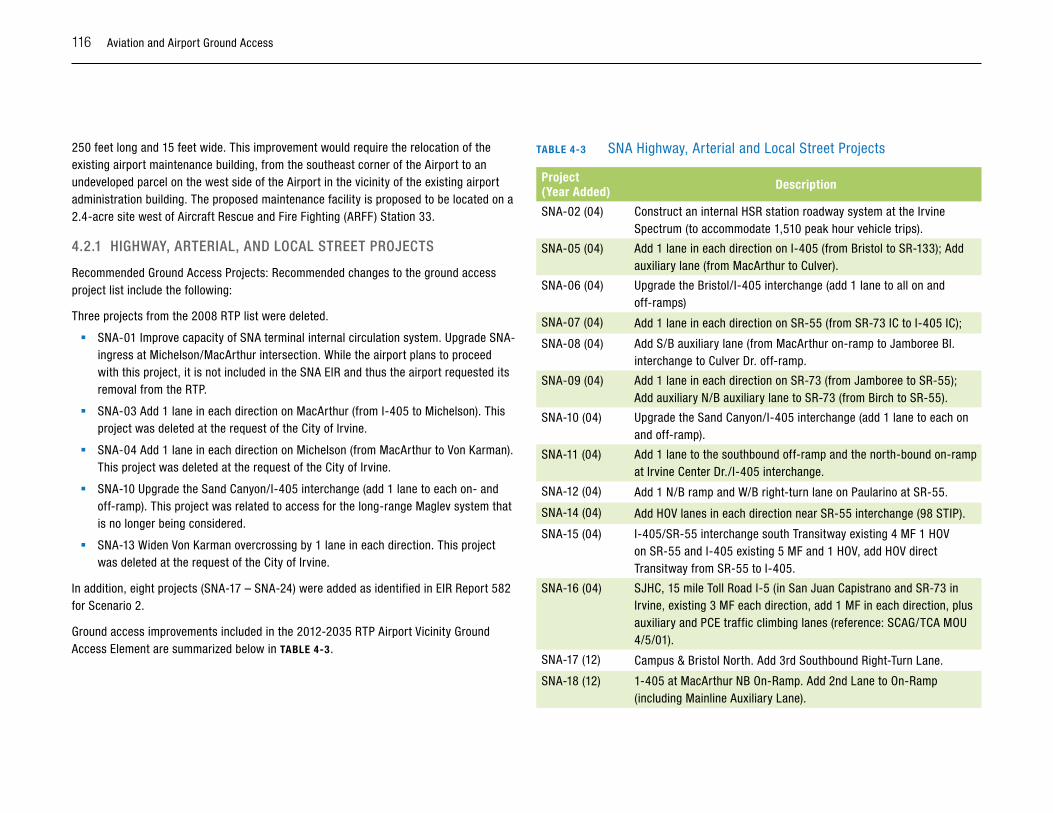
116 Aviation and Airport Ground Access
250 feet long and 15 feet wide. This improvement would require the relocation of the existing airport maintenance building, from the southeast corner of the Airport to an undeveloped parcel on the west side of the Airport in the vicinity of the existing airport administration building. The proposed maintenance facility is proposed to be located on a 2.4-acre site west of Aircraft Rescue and Fire Fighting (ARFF) Station 33.
4.2.1 hiGhwAy, ARTERiAl, AnD loCAl sTREET pRojECTs
Recommended Ground Access Projects: Recommended changes to the ground access project list include the following:
Three projects from the 2008 RTP list were deleted.
� SNA-01 Improve capacity of SNA terminal internal circulation system. Upgrade SNA-ingress at Michelson/MacArthur intersection. While the airport plans to proceed with this project, it is not included in the SNA EIR and thus the airport requested its removal from the RTP.
� SNA-03 Add 1 lane in each direction on MacArthur (from I-405 to Michelson). This project was deleted at the request of the City of Irvine.
� SNA-04 Add 1 lane in each direction on Michelson (from MacArthur to Von Karman). This project was deleted at the request of the City of Irvine.
� SNA-10 Upgrade the Sand Canyon/I-405 interchange (add 1 lane to each on- and off-ramp). This project was related to access for the long-range Maglev system that is no longer being considered.
� SNA-13 Widen Von Karman overcrossing by 1 lane in each direction. This project was deleted at the request of the City of Irvine.
In addition, eight projects (SNA-17 – SNA-24) were added as identified in EIR Report 582 for Scenario 2.
Ground access improvements included in the 2012-2035 RTP Airport Vicinity Ground Access Element are summarized below in TABlE 4-3.
TABlE 4-3 SNA Highway, Arterial and Local Street Projects
Project (Year Added) Description
SNA-02 (04) Construct an internal HSR station roadway system at the Irvine Spectrum (to accommodate 1,510 peak hour vehicle trips).
SNA-05 (04) Add 1 lane in each direction on I-405 (from Bristol to SR-133); Add auxiliary lane (from MacArthur to Culver).
SNA-06 (04) Upgrade the Bristol/I-405 interchange (add 1 lane to all on and off-ramps)
SNA-07 (04) Add 1 lane in each direction on SR-55 (from SR-73 IC to I-405 IC);
SNA-08 (04) Add S/B auxiliary lane (from MacArthur on-ramp to Jamboree Bl. interchange to Culver Dr. off-ramp.
SNA-09 (04) Add 1 lane in each direction on SR-73 (from Jamboree to SR-55); Add auxiliary N/B auxiliary lane to SR-73 (from Birch to SR-55).
SNA-10 (04) Upgrade the Sand Canyon/I-405 interchange (add 1 lane to each on and off-ramp).
SNA-11 (04) Add 1 lane to the southbound off-ramp and the north-bound on-ramp at Irvine Center Dr./I-405 interchange.
SNA-12 (04) Add 1 N/B ramp and W/B right-turn lane on Paularino at SR-55.
SNA-14 (04) Add HOV lanes in each direction near SR-55 interchange (98 STIP).
SNA-15 (04) I-405/SR-55 interchange south Transitway existing 4 MF 1 HOV on SR-55 and I-405 existing 5 MF and 1 HOV, add HOV direct Transitway from SR-55 to I-405.
SNA-16 (04) SJHC, 15 mile Toll Road I-5 (in San Juan Capistrano and SR-73 in Irvine, existing 3 MF each direction, add 1 MF in each direction, plus auxiliary and PCE traffic climbing lanes (reference: SCAG/TCA MOU 4/5/01).
SNA-17 (12) Campus & Bristol North. Add 3rd Southbound Right-Turn Lane.
SNA-18 (12) 1-405 at MacArthur NB On-Ramp. Add 2nd Lane to On-Ramp (including Mainline Auxiliary Lane).
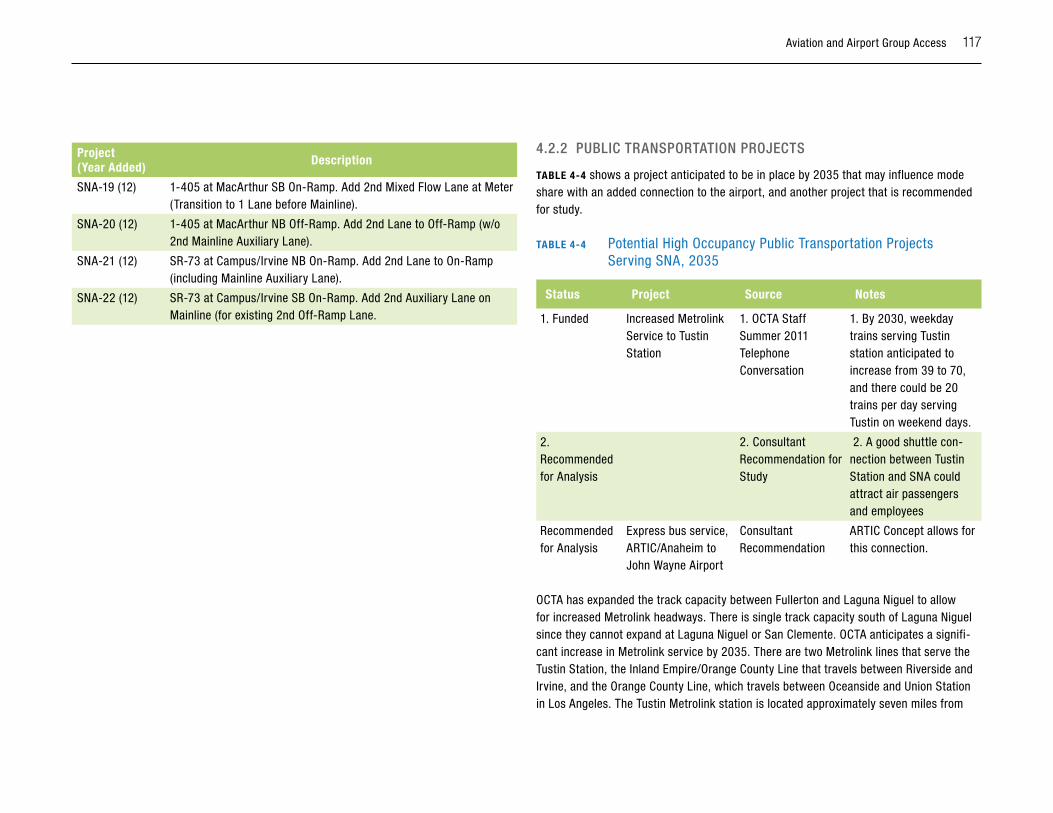
Aviation and Airport Group Access 117
Project (Year Added) Description
SNA-19 (12) 1-405 at MacArthur SB On-Ramp. Add 2nd Mixed Flow Lane at Meter (Transition to 1 Lane before Mainline).
SNA-20 (12) 1-405 at MacArthur NB Off-Ramp. Add 2nd Lane to Off-Ramp (w/o 2nd Mainline Auxiliary Lane).
SNA-21 (12) SR-73 at Campus/Irvine NB On-Ramp. Add 2nd Lane to On-Ramp (including Mainline Auxiliary Lane).
SNA-22 (12) SR-73 at Campus/Irvine SB On-Ramp. Add 2nd Auxiliary Lane on Mainline (for existing 2nd Off-Ramp Lane.
4.2.2 puBliC TRAnspoRTATion pRojECTs
TABlE 4-4 shows a project anticipated to be in place by 2035 that may influence mode share with an added connection to the airport, and another project that is recommended for study.
TABlE 4-4 Potential High Occupancy Public Transportation Projects Serving SNA, 2035
Status Project Source Notes
1. Funded Increased Metrolink Service to Tustin Station
1. OCTA Staff Summer 2011 Telephone Conversation
1. By 2030, weekday trains serving Tustin station anticipated to increase from 39 to 70, and there could be 20 trains per day serving Tustin on weekend days.
2. Recommended for Analysis
2. Consultant Recommendation for Study
2. A good shuttle con-nection between Tustin Station and SNA could attract air passengers and employees
Recommended for Analysis
Express bus service, ARTIC/Anaheim to John Wayne Airport
Consultant Recommendation
ARTIC Concept allows for this connection.
OCTA has expanded the track capacity between Fullerton and Laguna Niguel to allow for increased Metrolink headways. There is single track capacity south of Laguna Niguel since they cannot expand at Laguna Niguel or San Clemente. OCTA anticipates a signifi-cant increase in Metrolink service by 2035. There are two Metrolink lines that serve the Tustin Station, the Inland Empire/Orange County Line that travels between Riverside and Irvine, and the Orange County Line, which travels between Oceanside and Union Station in Los Angeles. The Tustin Metrolink station is located approximately seven miles from
118 Aviation and Airport Ground Access
John Wayne Airport, and the Irvine Transportation Center is located approximately nine miles away.
The City of Irvine operates two shuttle routes called The i Shuttle. The i Shuttle has been in operation for approximately three years. It operates from Monday through Friday, and travels between the Tustin Metrolink station and major employment sites. Route A travels between the Tustin Station and John Wayne Airport. The trips are timed to Metrolink train service during peak commuting hours. The trip to the airport takes approximately a half hour, and the shuttle route was not designed to meet airport needs.
Since The i Shuttle is not a connection that is attractive to airport customers, it is recom-mended that an analysis should be conducted to determine the potential for operating a non-stop shuttle between either the Tustin or the Irvine Transportation Center, to estimate the level of ridership that might be attracted, and to determine which station makes the most sense for provision of a shuttle. Amtrak serves the Irvine Transportation Center, but not the Tustin Station, however the Tustin station is slightly closer to the airport.
A study is recommended to determine the potential for a frequent bus link between John Wayne and ARTIC with no stops or limited stops. ARTIC will accommodate regional and local bus and rail connections, and will include parking for autos. It has a projected open-ing date of 2014. ARTIC will include space for a bus connection to SNA in anticipation of a service being provided in the future, although no agency or company has made a commit-ment to do so. Since it is also anticipated that there will be a fixed guideway connection by 2018, called the Anaheim Rapid Connection, between ARTIC, Disneyland, the hotels in the Disneyland area, and the Anaheim Convention center, it is a logical boarding point for non-resident air travelers who are destined for Anaheim. Residents and airport employees can access ARTIC to make the airport trip by driving and parking or using the various transportation connections that will be offered at ARTIC.
At the time this study was conducted, neither the County of Orange, which operates the airport, nor OCTA had plans to provide the type of high occupancy public transporta-tion service to John Wayne Airport that has the potential to influence air passenger or employee mode choice to the airport. OCTA has included the Bristol Street/State College Blvd. BRT line in their 2010 LRTP. It is described as a 28 mile fixed route BRT which will travel between the Brea Mall and the Irvine Transportation Center, but it is unclear what level of service will be provided, and if it will travel into the airport terminal area
4.3 long Beach Airport (lGB)
LGB offers direct flights throughout the U.S. with convenient domestic and international connections. LGB offers easy access to the surrounding business centers and massive consumer markets. LGB is one of the world’s busiest general aviation airports that serve privately-owned aircraft. With substantial general aviation activity LGB is an important reliever airport for LAX. Very strict noise regulations on commercial air operations have been put into place at LGB to protect the surrounding residential land uses. Boeing Co. builds C-17 military airlifter aircraft at LGB and Gulfstream has a completion/service center at LGB.
Passenger and Cargo Trends and Constraints: Commercial passenger service is currently provided by Jet Blue, US Airways, Delta and Alaska Airlines with almost 50 departures per day to 14 cities. The airport served about 2.8 MAP in 2009 and 3.0 MAP in 2010. According to the LGB Terminal Improvement EIR, terminal area improvements are being designed to accommodate 41 airline flights and 25 commuter flights per day. This flight level is anticipated to result in approximately 4.2 million annual passengers (MAP) being served at the Airport. There are provisions in the Airport Noise Compatibility Ordinance allowing the number of flights to be increased if the air carrier flights and commuter flights operate below their respective Community Noise Equivalent Level (“CNEL”) limits, however, the 4.2 MAP limit has been used in the growth forecasts.
Air cargo forecasts show an increase from 40,000 tons in 2009 to a still modest level of 109,000 tons in 2035. This level is not expected to have a significant impact on ground access needs.
Studies and Major Planned Projects: Long Beach Airport Terminal Area Improvement Project Draft Environmental Impact Report No. 37-03, November 2005. The proposed proj-ects provides improvements to the existing Airport Terminal Building and related facilities at the Airport in order to accommodate recent increases in flight activity at the Airport consistent with operational limitations of the Airport Noise Compatibility Ordinance and the 1995 Settlement Agreement. The Proposed Project includes construction of, or alteration to, the terminal building, vehicular parking and traffic and pedestrian circula-tion at the airport as shown on FIGuRE 4-3. The Terminal Area Improvement Projects are included for reference only and are not part of the RTP.
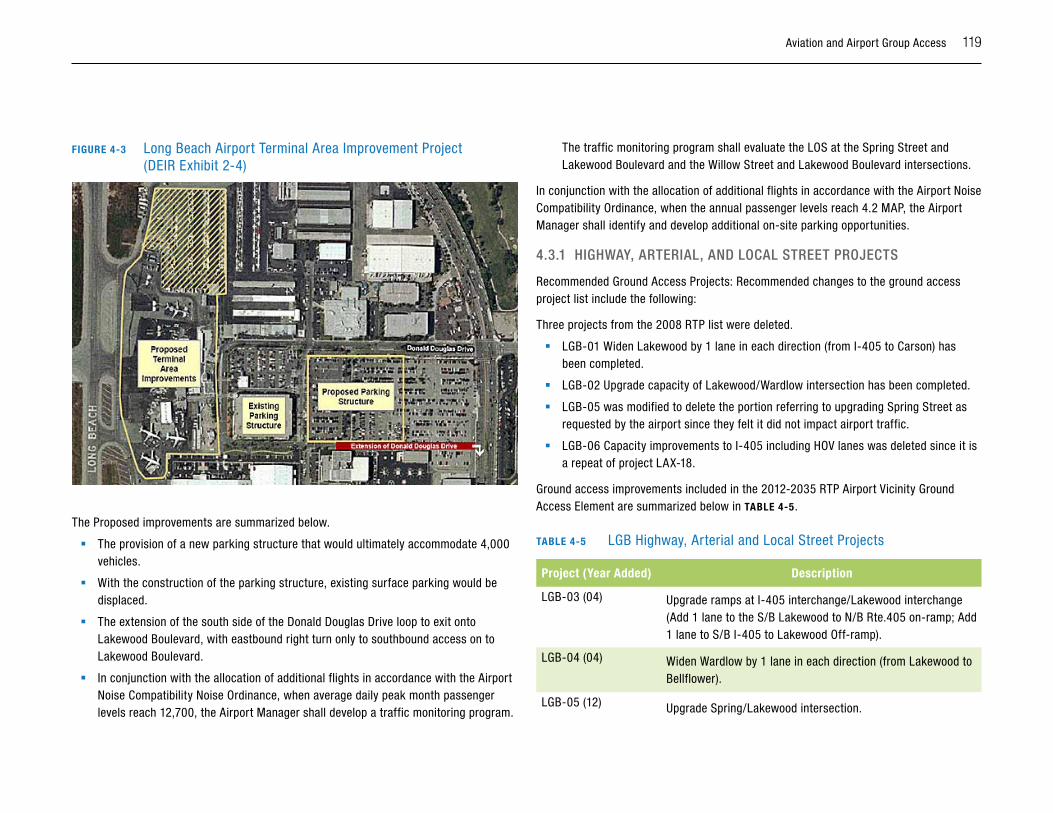
Aviation and Airport Group Access 119
FIGuRE 4-3 Long Beach Airport Terminal Area Improvement Project (DEIR Exhibit 2-4)
The Proposed improvements are summarized below.
� The provision of a new parking structure that would ultimately accommodate 4,000 vehicles.
� With the construction of the parking structure, existing surface parking would be displaced.
� The extension of the south side of the Donald Douglas Drive loop to exit onto Lakewood Boulevard, with eastbound right turn only to southbound access on to Lakewood Boulevard.
� In conjunction with the allocation of additional flights in accordance with the Airport Noise Compatibility Noise Ordinance, when average daily peak month passenger levels reach 12,700, the Airport Manager shall develop a traffic monitoring program.
The traffic monitoring program shall evaluate the LOS at the Spring Street and Lakewood Boulevard and the Willow Street and Lakewood Boulevard intersections.
In conjunction with the allocation of additional flights in accordance with the Airport Noise Compatibility Ordinance, when the annual passenger levels reach 4.2 MAP, the Airport Manager shall identify and develop additional on-site parking opportunities.
4.3.1 hiGhwAy, ARTERiAl, AnD loCAl sTREET pRojECTs
Recommended Ground Access Projects: Recommended changes to the ground access project list include the following:
Three projects from the 2008 RTP list were deleted.
� LGB-01 Widen Lakewood by 1 lane in each direction (from I-405 to Carson) has been completed.
� LGB-02 Upgrade capacity of Lakewood/Wardlow intersection has been completed.
� LGB-05 was modified to delete the portion referring to upgrading Spring Street as requested by the airport since they felt it did not impact airport traffic.
� LGB-06 Capacity improvements to I-405 including HOV lanes was deleted since it is a repeat of project LAX-18.
Ground access improvements included in the 2012-2035 RTP Airport Vicinity Ground Access Element are summarized below in TABlE 4-5.
TABlE 4-5 LGB Highway, Arterial and Local Street Projects
Project (Year Added) Description
LGB-03 (04) Upgrade ramps at I-405 interchange/Lakewood interchange (Add 1 lane to the S/B Lakewood to N/B Rte.405 on-ramp; Add 1 lane to S/B I-405 to Lakewood Off-ramp).
LGB-04 (04) Widen Wardlow by 1 lane in each direction (from Lakewood to Bellflower).
LGB-05 (12) Upgrade Spring/Lakewood intersection.
120 Aviation and Airport Ground Access
4.3.2 puBliC TRAnspoRTATion pRojECTs
The City of Long Beach is served by the Metro Rail Blue Line, with service between the Long Beach Transit Mall in downtown Long Beach, and 7th Street/Metro Center in downtown Los Angeles. Blue Line customers may transfer at the Long Beach Transit Mall to Long Beach Transit Line 111, and make the 30 to 40 minute trip to Long Beach Airport between 5 a.m. and 12:30 a.m., 7 days per week. The bus runs at 40 minute intervals for most of the schedule, with some service also provided in 30 minute and 60 minute inter-vals. The Long Beach Transit mall is served by additional bus routes provided by Long Beach Transit and other public transportation providers.
The Blue Line Willow station is served by Long Beach Transit routes 102/104, which allows customers to make the 20 minute trip to Long Beach Airport from Monday through Friday between 6 a.m. and 8 p.m. at 30 minute intervals. Willow station is served by additional bus routes provided by Long Beach Transit and Metro.
In the future, depending on the distribution of air passenger origins in the vicinity of the Blue Line, consideration should be given to offering higher frequencies on routes 102/104 and 111, and providing Saturday and Sunday service on routes 102/104.
4.4 los Angeles international Airport (lAX)
LAX is the sixth busiest airport worldwide in terms of passengers and 13th worldwide in air cargo tonnage, and is served by approximately 80 passenger airlines and 20 cargo airlines. LAX handles 70 percent of the passengers, 75 percent of the air cargo, and 95 percent of the international passengers and cargo traffic in the surrounding five counties. According to recent economic impact studies prepared for the Los Angeles World Airports (LAWA), LAX contributes more than $60 billion annually to the Southern California economy and approximately 408,000 jobs, or one in twenty jobs in Southern California, are attributed to LAX operations.
Passenger and Cargo Trends and Constraints: In 2010, 59.1 million passengers traveled through LAX. A passenger limit of 78.9 MAP was established as the “practical capacity” of LAX in a Settlement Agreement between Los Angeles World Airports and surrounding communities and other parties arising from lawsuits over the latest update of the LAX Master Plan, and is used for planning purposes in related studies. The passenger demand at LAX is expected to grow to the 78.9 MAP planning limit prior to 2035.
Once the 78.9 MAP limit is reached, a significant portion of additional growth in regional demand is projected to spill over to other airports in the region. LAX has the highest rate of connecting passengers of all airports in the region, so on a per passenger basis, its impact on ground traffic is reduced. However, as noted in section 3.1, the projected growth of around 19 MAP will create significant demands on the ground access system and will likely require a greater emphasis on high-occupancy modes (e.g. transit) for airport access and egress travel.
LAX is also a major cargo center with 1,000 daily cargo flights linking Los Angeles with the world. Its cargo handling facilities include the 98-acre Century Cargo complex, the 57.4-acre Imperial Cargo complex, the Imperial Cargo Center and a number of termi-nals on the south side of the airport. In 2009, the airport handled 1.66 million tons of air cargo, down from a peak of 2.14 million tons in 2005. However, long term growth is forecast to pick up with around 2.8 million tons in the 2035 projection. A large portion of the air cargo at LAX is “pass through”, being shifted from one airplane to another, thus the “per ton” impact of air cargo in terms of truck traffic on the adjacent street network is lower than at the other airports in the region.
Studies and Major Planned Projects: Several major studies have been completed over the past 10 years focusing on terminal expansion and the related ground access improve-ments needed to support this expansion. On-Airport improvement projects/plans are included for reference only and are not considered part of the RTP.
Initial plans for a new “West Terminal” would have included a new major access point to the airport from the west side, off Pershing Drive. Many of the highway and street improvements associated with this plan were included in the 2008 RTP. However, the 2005 LAX Master Plan EIS/EIR added “Alternative D”, which would maintain terminal access from the east, supplemented by a variety of ground access improvements. This became the preferred alternative of LAWA. Subsequent studies have focused on varia-tions of this general concept, including the 2009 Bradley West Project Draft EIR (DEIR) and the on-going Specific Plan Amendment Study (SPAS).
Final Environmental Impact Statement, Los Angeles International Airport Proposed Master Plan Improvements, January, 2005: According to the EIS, the purpose of the LAX Master Plan is to help provide a level of airport passenger and freight improvements that will support the future economic growth and vitality of the five-county Los Angeles region. Master Plan project objectives are to:

Aviation and Airport Group Access 121
� Respond to local and regional demand for air transportation during the period 2000-2015, taking into consideration the amount, type, location, and timing of such demand.
� Ensure that new investments in airport capacity are efficient and cost-effective, maximizing the return on existing infrastructure capital.
� Sustain and advance the international trade component of the regional economy and the international commercial gateway role of the City of Los Angeles.
As noted above, this study included three alternatives with primary ground access from a new entrance on Pershing Blvd. on the west side of the airport. The fourth, and preferred, alternative maintained access to the terminals from the east side, but eliminated all pri-vate vehicle access from the main terminal area, and instead included new major trans-portation facilities between the airport and I-405 including a multimodal transportation center with bus and rail access, a consolidated car rental facility, and parking garages. All access to the terminals would be via a people mover.
Draft Environmental Impact Report (DEIR), Los Angeles Airport Bradley West Project, May 2009. As one of the airfield improvements included in the LAX Master Plan, the “Bradley West Project,” provides for the addition of aircraft gates along the west side of the Tom Bradley International Terminal, which will reduce the existing need for, and use of, remote aircraft gates located at the west end of the airport. New gates include several gates specifically designed to accommodate new generation aircraft such as the Airbus A380, Boeing 747-8, and Boeing 787. The central core of the terminal would also be modified to provide additional floor area and improvements to better serve existing and future pas-sengers at terminal.
As a result of lawsuits challenging the Master Plan, a settlement was reached that requires LAWA to proceed with a Specific Plan Amendment Study (SPAS) to identify potential alternative designs, technologies, and configurations for the Master Plan that would provide solutions to the problems that certain controversial projects (designated as “Yellow Light Projects”) were designed to address. Yellow Light Projects included many of the ground access elements in the Master Plan such as a Ground Transportation Center and an automated people mover to link ground transportation facilities to the passen-ger terminals. While the SPAS is being undertaken, LAWA may continue to process and develop projects that are not Yellow Light Projects, such as the Bradley West Project.
The traffic analysis for the Bradley West DEIS used the year 2013 for future planning. It assumed that traffic generation would be essentially the same for both the build and no build conditions, only the peaking conditions would change. The study looked at on-airport traffic circulation and operations as well as at 71 off-site intersections. The study assumed a number of planned improvements in the area would also be completed by others as listed on TABlE 4-6 below. Many of these projects were included in the 2008 Airport RTP and many have been completed.
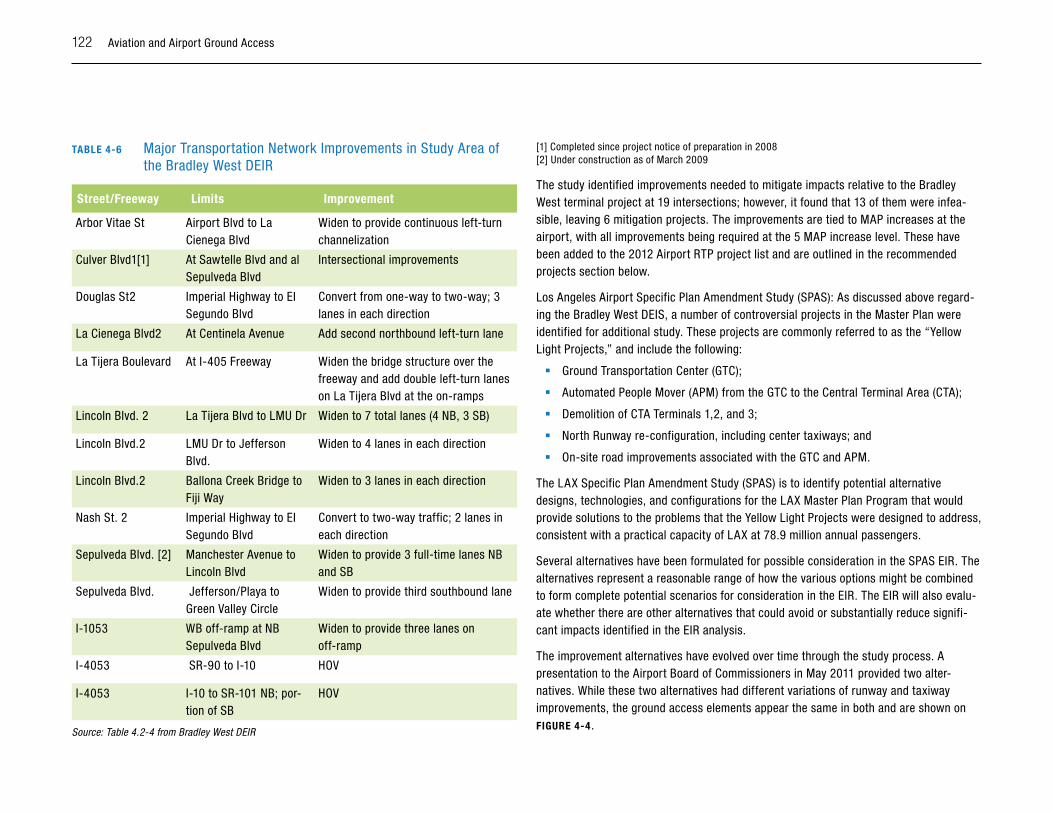
122 Aviation and Airport Ground Access
TABlE 4-6 Major Transportation Network Improvements in Study Area of the Bradley West DEIR
Street/Freeway limits Improvement
Arbor Vitae St Airport Blvd to La Cienega Blvd
Widen to provide continuous left-turn channelization
Culver Blvd1[1] At Sawtelle Blvd and al Sepulveda Blvd
Intersectional improvements
Douglas St2 Imperial Highway to EI Segundo Blvd
Convert from one-way to two-way; 3 lanes in each direction
La Cienega Blvd2 At Centinela Avenue Add second northbound left-turn lane
La Tijera Boulevard At I-405 Freeway Widen the bridge structure over the freeway and add double left-turn lanes on La Tijera Blvd at the on-ramps
Lincoln Blvd. 2 La Tijera Blvd to LMU Dr Widen to 7 total lanes (4 NB, 3 SB)
Lincoln Blvd.2 LMU Dr to Jefferson Blvd.
Widen to 4 lanes in each direction
Lincoln Blvd.2 Ballona Creek Bridge to Fiji Way
Widen to 3 lanes in each direction
Nash St. 2 Imperial Highway to EI Segundo Blvd
Convert to two-way traffic; 2 lanes in each direction
Sepulveda Blvd. [2] Manchester Avenue to Lincoln Blvd
Widen to provide 3 full-time lanes NB and SB
Sepulveda Blvd. Jefferson/Playa to Green Valley Circle
Widen to provide third southbound lane
I-1053 WB off-ramp at NB Sepulveda Blvd
Widen to provide three lanes on off-ramp
I-4053 SR-90 to I-10 HOV
I-4053 I-10 to SR-101 NB; por-tion of SB
HOV
Source: Table 4.2-4 from Bradley West DEIR
[1] Completed since project notice of preparation in 2008[2] Under construction as of March 2009
The study identified improvements needed to mitigate impacts relative to the Bradley West terminal project at 19 intersections; however, it found that 13 of them were infea-sible, leaving 6 mitigation projects. The improvements are tied to MAP increases at the airport, with all improvements being required at the 5 MAP increase level. These have been added to the 2012 Airport RTP project list and are outlined in the recommended projects section below.
Los Angeles Airport Specific Plan Amendment Study (SPAS): As discussed above regard-ing the Bradley West DEIS, a number of controversial projects in the Master Plan were identified for additional study. These projects are commonly referred to as the “Yellow Light Projects,” and include the following:
� Ground Transportation Center (GTC);
� Automated People Mover (APM) from the GTC to the Central Terminal Area (CTA);
� Demolition of CTA Terminals 1,2, and 3;
� North Runway re-configuration, including center taxiways; and
� On-site road improvements associated with the GTC and APM.
The LAX Specific Plan Amendment Study (SPAS) is to identify potential alternative designs, technologies, and configurations for the LAX Master Plan Program that would provide solutions to the problems that the Yellow Light Projects were designed to address, consistent with a practical capacity of LAX at 78.9 million annual passengers.
Several alternatives have been formulated for possible consideration in the SPAS EIR. The alternatives represent a reasonable range of how the various options might be combined to form complete potential scenarios for consideration in the EIR. The EIR will also evalu-ate whether there are other alternatives that could avoid or substantially reduce signifi-cant impacts identified in the EIR analysis.
The improvement alternatives have evolved over time through the study process. A presentation to the Airport Board of Commissioners in May 2011 provided two alter-natives. While these two alternatives had different variations of runway and taxiway improvements, the ground access elements appear the same in both and are shown on FIGuRE 4-4.
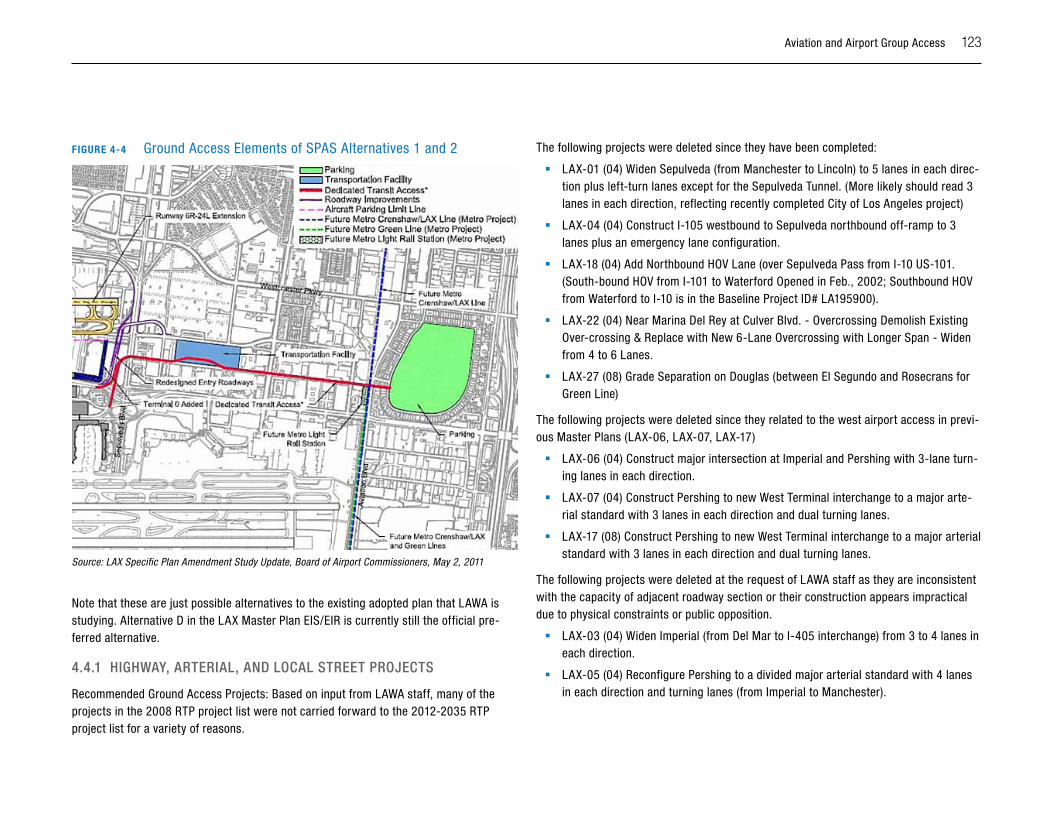
Aviation and Airport Group Access 123
FIGuRE 4-4 Ground Access Elements of SPAS Alternatives 1 and 2
Source: LAX Specific Plan Amendment Study Update, Board of Airport Commissioners, May 2, 2011
Note that these are just possible alternatives to the existing adopted plan that LAWA is studying. Alternative D in the LAX Master Plan EIS/EIR is currently still the official pre-ferred alternative.
4.4.1 hiGhwAy, ARTERiAl, AnD loCAl sTREET pRojECTs
Recommended Ground Access Projects: Based on input from LAWA staff, many of the projects in the 2008 RTP project list were not carried forward to the 2012-2035 RTP project list for a variety of reasons.
The following projects were deleted since they have been completed:
� LAX-01 (04) Widen Sepulveda (from Manchester to Lincoln) to 5 lanes in each direc-tion plus left-turn lanes except for the Sepulveda Tunnel. (More likely should read 3 lanes in each direction, reflecting recently completed City of Los Angeles project)
� LAX-04 (04) Construct I-105 westbound to Sepulveda northbound off-ramp to 3 lanes plus an emergency lane configuration.
� LAX-18 (04) Add Northbound HOV Lane (over Sepulveda Pass from I-10 US-101. (South-bound HOV from I-101 to Waterford Opened in Feb., 2002; Southbound HOV from Waterford to I-10 is in the Baseline Project ID# LA195900).
� LAX-22 (04) Near Marina Del Rey at Culver Blvd. - Overcrossing Demolish Existing Over-crossing & Replace with New 6-Lane Overcrossing with Longer Span - Widen from 4 to 6 Lanes.
� LAX-27 (08) Grade Separation on Douglas (between El Segundo and Rosecrans for Green Line)
The following projects were deleted since they related to the west airport access in previ-ous Master Plans (LAX-06, LAX-07, LAX-17)
� LAX-06 (04) Construct major intersection at Imperial and Pershing with 3-lane turn-ing lanes in each direction.
� LAX-07 (04) Construct Pershing to new West Terminal interchange to a major arte-rial standard with 3 lanes in each direction and dual turning lanes.
� LAX-17 (08) Construct Pershing to new West Terminal interchange to a major arterial standard with 3 lanes in each direction and dual turning lanes.
The following projects were deleted at the request of LAWA staff as they are inconsistent with the capacity of adjacent roadway section or their construction appears impractical due to physical constraints or public opposition.
� LAX-03 (04) Widen Imperial (from Del Mar to I-405 interchange) from 3 to 4 lanes in each direction.
� LAX-05 (04) Reconfigure Pershing to a divided major arterial standard with 4 lanes in each direction and turning lanes (from Imperial to Manchester).
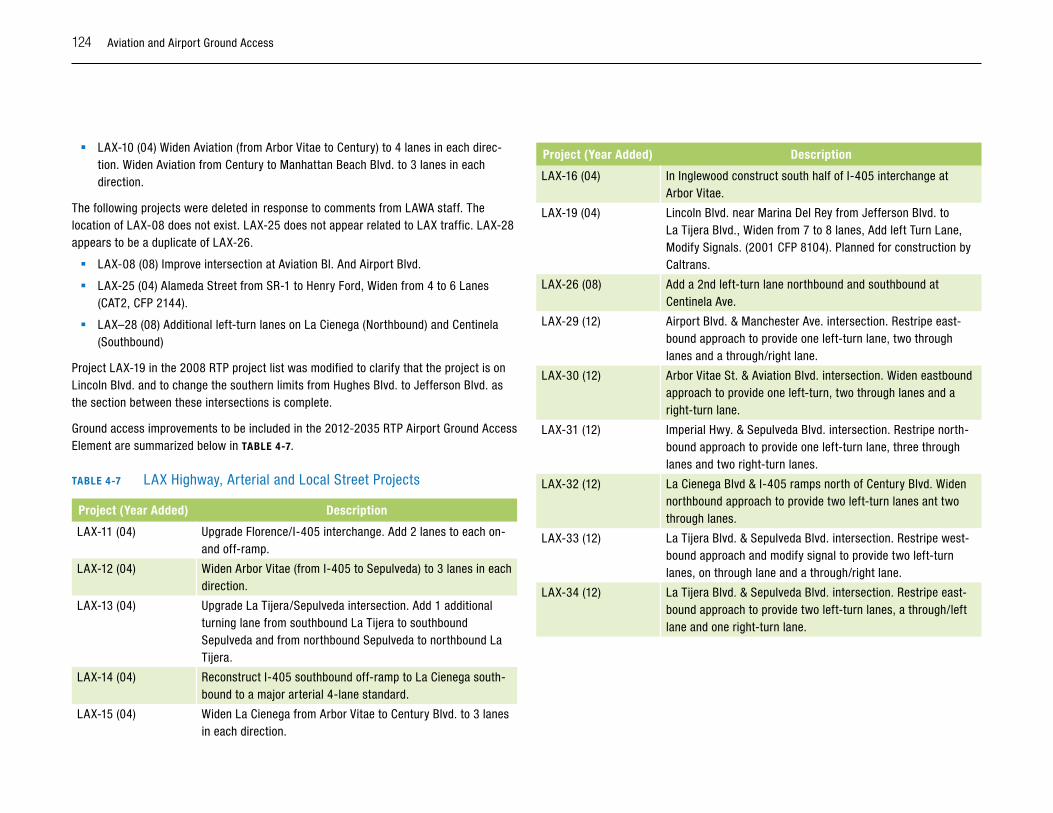
124 Aviation and Airport Ground Access
� LAX-10 (04) Widen Aviation (from Arbor Vitae to Century) to 4 lanes in each direc-tion. Widen Aviation from Century to Manhattan Beach Blvd. to 3 lanes in each direction.
The following projects were deleted in response to comments from LAWA staff. The location of LAX-08 does not exist. LAX-25 does not appear related to LAX traffic. LAX-28 appears to be a duplicate of LAX-26.
� LAX-08 (08) Improve intersection at Aviation Bl. And Airport Blvd.
� LAX-25 (04) Alameda Street from SR-1 to Henry Ford, Widen from 4 to 6 Lanes (CAT2, CFP 2144).
� LAX–28 (08) Additional left-turn lanes on La Cienega (Northbound) and Centinela (Southbound)
Project LAX-19 in the 2008 RTP project list was modified to clarify that the project is on Lincoln Blvd. and to change the southern limits from Hughes Blvd. to Jefferson Blvd. as the section between these intersections is complete.
Ground access improvements to be included in the 2012-2035 RTP Airport Ground Access Element are summarized below in TABlE 4-7.
TABlE 4-7 LAX Highway, Arterial and Local Street Projects
Project (Year Added) Description
LAX-11 (04) Upgrade Florence/I-405 interchange. Add 2 lanes to each on- and off-ramp.
LAX-12 (04) Widen Arbor Vitae (from I-405 to Sepulveda) to 3 lanes in each direction.
LAX-13 (04) Upgrade La Tijera/Sepulveda intersection. Add 1 additional turning lane from southbound La Tijera to southbound Sepulveda and from northbound Sepulveda to northbound La Tijera.
LAX-14 (04) Reconstruct I-405 southbound off-ramp to La Cienega south-bound to a major arterial 4-lane standard.
LAX-15 (04) Widen La Cienega from Arbor Vitae to Century Blvd. to 3 lanes in each direction.
Project (Year Added) Description
LAX-16 (04) In Inglewood construct south half of I-405 interchange at Arbor Vitae.
LAX-19 (04) Lincoln Blvd. near Marina Del Rey from Jefferson Blvd. to La Tijera Blvd., Widen from 7 to 8 lanes, Add left Turn Lane, Modify Signals. (2001 CFP 8104). Planned for construction by Caltrans.
LAX-26 (08) Add a 2nd left-turn lane northbound and southbound at Centinela Ave.
LAX-29 (12) Airport Blvd. & Manchester Ave. intersection. Restripe east-bound approach to provide one left-turn lane, two through lanes and a through/right lane.
LAX-30 (12) Arbor Vitae St. & Aviation Blvd. intersection. Widen eastbound approach to provide one left-turn, two through lanes and a right-turn lane.
LAX-31 (12) Imperial Hwy. & Sepulveda Blvd. intersection. Restripe north-bound approach to provide one left-turn lane, three through lanes and two right-turn lanes.
LAX-32 (12) La Cienega Blvd & I-405 ramps north of Century Blvd. Widen northbound approach to provide two left-turn lanes ant two through lanes.
LAX-33 (12) La Tijera Blvd. & Sepulveda Blvd. intersection. Restripe west-bound approach and modify signal to provide two left-turn lanes, on through lane and a through/right lane.
LAX-34 (12) La Tijera Blvd. & Sepulveda Blvd. intersection. Restripe east-bound approach to provide two left-turn lanes, a through/left lane and one right-turn lane.
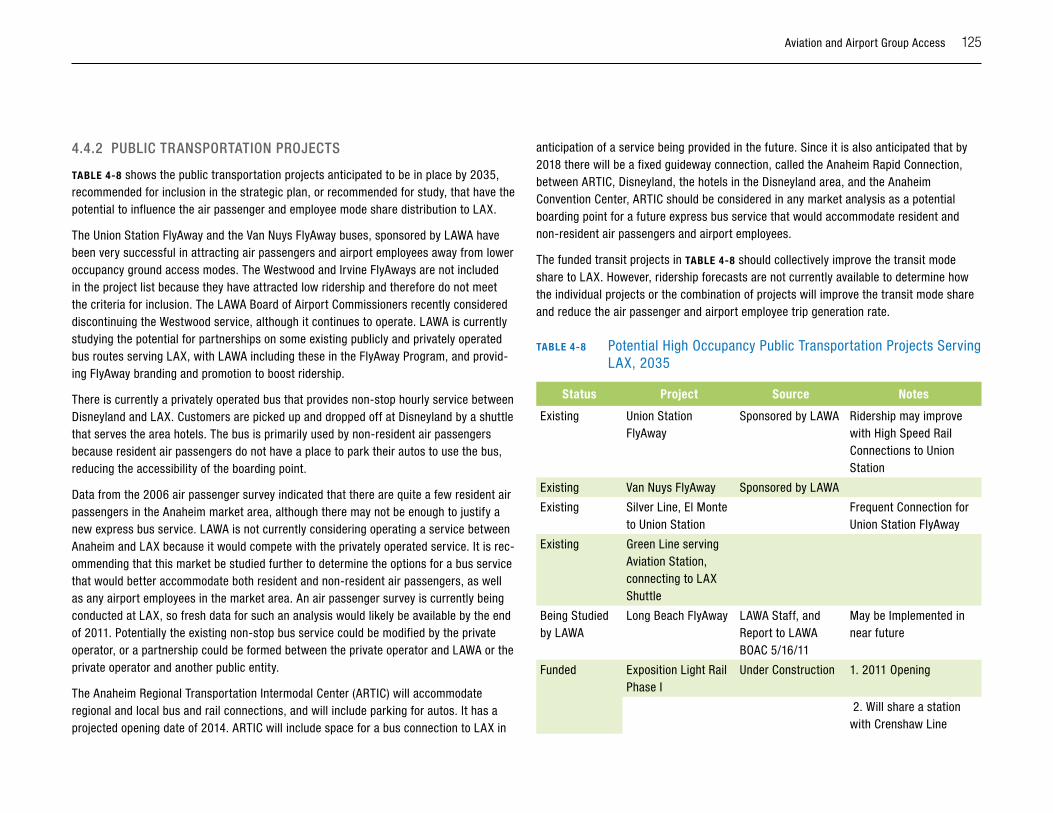
Aviation and Airport Group Access 125
4.4.2 puBliC TRAnspoRTATion pRojECTs
TABlE 4-8 shows the public transportation projects anticipated to be in place by 2035, recommended for inclusion in the strategic plan, or recommended for study, that have the potential to influence the air passenger and employee mode share distribution to LAX.
The Union Station FlyAway and the Van Nuys FlyAway buses, sponsored by LAWA have been very successful in attracting air passengers and airport employees away from lower occupancy ground access modes. The Westwood and Irvine FlyAways are not included in the project list because they have attracted low ridership and therefore do not meet the criteria for inclusion. The LAWA Board of Airport Commissioners recently considered discontinuing the Westwood service, although it continues to operate. LAWA is currently studying the potential for partnerships on some existing publicly and privately operated bus routes serving LAX, with LAWA including these in the FlyAway Program, and provid-ing FlyAway branding and promotion to boost ridership.
There is currently a privately operated bus that provides non-stop hourly service between Disneyland and LAX. Customers are picked up and dropped off at Disneyland by a shuttle that serves the area hotels. The bus is primarily used by non-resident air passengers because resident air passengers do not have a place to park their autos to use the bus, reducing the accessibility of the boarding point.
Data from the 2006 air passenger survey indicated that there are quite a few resident air passengers in the Anaheim market area, although there may not be enough to justify a new express bus service. LAWA is not currently considering operating a service between Anaheim and LAX because it would compete with the privately operated service. It is rec-ommending that this market be studied further to determine the options for a bus service that would better accommodate both resident and non-resident air passengers, as well as any airport employees in the market area. An air passenger survey is currently being conducted at LAX, so fresh data for such an analysis would likely be available by the end of 2011. Potentially the existing non-stop bus service could be modified by the private operator, or a partnership could be formed between the private operator and LAWA or the private operator and another public entity.
The Anaheim Regional Transportation Intermodal Center (ARTIC) will accommodate regional and local bus and rail connections, and will include parking for autos. It has a projected opening date of 2014. ARTIC will include space for a bus connection to LAX in
anticipation of a service being provided in the future. Since it is also anticipated that by 2018 there will be a fixed guideway connection, called the Anaheim Rapid Connection, between ARTIC, Disneyland, the hotels in the Disneyland area, and the Anaheim Convention Center, ARTIC should be considered in any market analysis as a potential boarding point for a future express bus service that would accommodate resident and non-resident air passengers and airport employees.
The funded transit projects in TABlE 4-8 should collectively improve the transit mode share to LAX. However, ridership forecasts are not currently available to determine how the individual projects or the combination of projects will improve the transit mode share and reduce the air passenger and airport employee trip generation rate.
TABlE 4-8 Potential High Occupancy Public Transportation Projects Serving LAX, 2035
Status Project Source Notes
Existing Union Station FlyAway
Sponsored by LAWA Ridership may improve with High Speed Rail Connections to Union Station
Existing Van Nuys FlyAway Sponsored by LAWA
Existing Silver Line, El Monte to Union Station
Frequent Connection for Union Station FlyAway
Existing Green Line serving Aviation Station, connecting to LAX Shuttle
Being Studied by LAWA
Long Beach FlyAway LAWA Staff, and Report to LAWA BOAC 5/16/11
May be Implemented in near future
Funded Exposition Light Rail Phase I
Under Construction 1. 2011 Opening
2. Will share a station with Crenshaw Line
126 Aviation and Airport Ground Access
Status Project Source Notes
Funded Exposition Light Rail Phase II
2008 RTP, 2008 RTIP, 2009 Metro LRTP, Measure R Project
1. Planned for 2015
2. Will connect to Exposition Light Rail Phase I
Funded Crenshaw/LAX Transit Corridor
2009 Metro LRTP, Measure R Project
Planned for 2018
Funded Regional Connector 2009 Metro LRTP, Measure R Project
Will reduce number of light rail transfers in downtown Los Angeles. Planned for 2019.
Partially Funded
Green Line Extension to LAX
2009 Metro LRTP, Measure R Project
Metro study underway in Spring 2011. Anticipated 2028 opening depending on LAWA contribution.
Funded South Bay Metro Green Line Extension
2009 Metro LRTP, Measure R Project
1. Redondo Beach Blvd. to South Bay Corridor
2. Planned for 2035
Partially Funded
Metro Green Line Extension between Norwalk and Metrolink Station
2009 Metro LRTP - Strategic Unfunded
Strategic Plan Green Line from LAX to Santa Monica
2009 Metro LRTP - Strategic Unfunded; 2008 SCAG RTP - LA County Strategic Plan Projects
Status Project Source Notes
Recommended for Analysis
Express Bus Service, ARTIC/ Anaheim Arctic to LAX
Consultant recommendation
1. Potentially from ARTIC
2. Potential enhancement of an existing privately operated service
4.5 March Air Force Base/March inland port (Mip)
MARB currently accommodates military operations by the Air Force, Air Force Reserve, Air National Guard and other governmental-related entities. MIP currently operates limited civilian operations on a prior approval basis including domestic and international air cargo services. Upon announcement in 1993 by BRAC of realignment of March AFB to an air reserve base, the adjoining jurisdictions formed the March Joint Powers Authority (JPA) to address base reuse at March AFB. The March JPA, in addition to being designated as the federally recognized reuse authority for the former active duty base, has also assumed other responsibilities. These responsibilities are carried out by governing bodies under the governance umbrella of the March JPA and include:
� The March Joint Powers Redevelopment Agency – responsible for the redevelopment of 6,500 acres of the former active base and approximately 450 acres adjacent to the base in the industrial area of the City of Moreno Valley.
� A streamlined development process with the transferred of land use authority to March JPA from the County of Riverside.
� The establishment of building codes and standards by the March JPA.
� Management of airport development and operation through March Inland Port Airport Authority (MIPAA).
Passenger and Cargo Trends and Constraints: The Joint Use Agreement between the U.S. Air Force and the March JPA, signed in May, 1997, limits the joint use airport to 21,000 annual civil operations and 51,426 annual military operations. In 2008, cargo users accounted for approximately 5,000 of the 21,000 allowable annual civilian operations.
Aviation and Airport Group Access 127
March Inland Port has over 600,000 square footage of future ramp area planned for construction. All planned facilities will be engineered to meet or exceed load requirements and to be fully stressed to accommodate aircraft up to 900,000 pounds. The airport is currently not accommodating commercial passenger operations. However, general aviation (GA) support facilities are planned for 2013. In 2008, the joint use agreement was amended and restrictions on GA operations were removed. Environment studies are expected to be complete in 2012 and if the GA project is approved, construction could begin in late 2012. The 2035 forecast for this RTP forecasts a small amount of passenger traffic for MIP-- 0.6 MAP.
DHL is a major cargo carrier that began operations at MIP in 2005. However, they discon-tinued service out of MIP in 2009. MIP is positioning itself as a diversified airport, with cargo, maintenance, charter service and general aviation activities. The 2012-2035 RTP cargo forecast for 2035 is 244,000 tons. At this level, MIP might become the third largest cargo airport in the region behind LAX (2.8m tons) and ONT (1.4m tons) in 2035.
Studies and Major Planned Projects: The General Plan of the March Joint Powers Authority is a long range comprehensive plan, completed in 1999, designed to outline and delineate use and development of a Planning Area known formerly as March AFB, prior to the base realignment in April 1996 to March ARB. The General Plan defines reuse and development opportunities of the Planning Area, while preserving the environmental qual-ity. The General Plan contains goals, policies, and programs to guide future development and change in the Planning Area. The goals and policies of the General Plan serve as the constitutional framework for March JPA, provide planning direction for JPA operations and programs and function as guidelines for all decision-making concerning use and development of the area.
The plan includes a transportation element that includes goals and specific recommenda-tions to accommodate traffic growth generated by the former Air Force base site through the year 2030. Projects identified to support background traffic growth around the base (excluding traffic generated by the base development) included:
� Widening Alessandro Blvd. to six lanes west of l-215 (complete)
� Widening Van Buren Blvd. to six lanes from Barton Street westerly.
� Reconstructing the Van Buren Boulevard interchange with 1-215.
� Widening Barton Street south of Van Buren Blvd.
� Widening the intersection of Barton Street with Van Buren Blvd.
� Widening Nandina Ave. and extending it easterly to connect with the Oleander inter-change on l-215.
� Widening Harley Knox Blvd. to four lanes east of l-215 and extending it easterly.
� Widening existing ramps at the 1-215 interchanges with Alessandro Blvd. and Cactus Ave.
In addition to these needed improvements in the vicinity of the March JPA Planning Area, I-215/SR-60 was projected to be significantly over capacity between Riverside and Moreno Valley even with the HOV and truck climbing lane improvements implemented as part of Measure A.
The traffic forecasting model was subsequently used to identify additional roadway improvements needed to accommodate the planned development of the March JPA Planning Area. The analysis determined that the following improvements would be needed in addition to those identified above:
� Widening Cactus Ave. to, six lanes from 1-215 to Graham St. (consistent with the Moreno Valley General Plan).
� Widening Van Buren to six lanes from 1-215 to Banon St.
� Additional widening of the Van Buren bridge over 1-215.
� Construction or widening of internal March JPA Planning Area roads.
� Widening of several key intersections to provide additional turn lanes.
Note that many of these improvements are related to the overall redevelopment of the Base and are not specific to airport operations.
Vision 2030: March JPA General Plan, March 2010 Draft: Per the plan, “Changing economic, social, and natural environment factors have made it apparent that it is time to update the current General Plan and EIR, to fine-tune the direction of development within its jurisdiction, and in short, to implement the Vision that has been set forth by the public and the March JPA decision-makers.” The vision of the 2030 plan includes creating 38,000 jobs through development of the Planning Area, and reducing inter-regional traffic through utilizing the planned Metrolink station and land use decisions that promote the development of a multi-modal passenger facility.
128 Aviation and Airport Ground Access
While Vision 2030 provides mostly general goals related to improving traffic circulation, there are some specific transportation related needs identified:
� Support development of limited-access roadway facilities and other regional traffic improvements such as the Mid-County Parkway or the Cajalco/Ramona Corridor.
� Work with the County of Riverside to identify and develop a north-south arte-rial roadway linking Van Buren Blvd. and Cajalco Corridor on the west side of the Planning Area.
� The March JPA shall support and participate in the creation of adequate regional transportation systems and linkages and promote mass transit and alternative transportation modes.
� Work with the City of Perris to plan for an arterial roadway on the east frontage of I-215 between Van Buren Blvd. and Harley Knox Blvd., tying in with existing street improvements at Western Way, in order to preserve future options for developing aviation facilities on the west side of the runway.
� Incorporate a traffic circle/round-about near the convergence of the Van Buren extension and Western Way to control traffic, encourage safe street speeds and provide a safe transition.
� Work closely with Caltrans to implement the freeway ramp/arterial roadway inter-change improvements at Van Buren Blvd., Cactus Ave. and Harley Knox Blvd. while minimizing the short-term impacts associated with construction.
� Work with RCTC to expedite the development of the proposed Metrolink line and sta-tion that will serve as an intra- and inter-county public transportation system.
As with the original General Plan, many of these improvements are related to the overall redevelopment of the Base and are not specific to airport operations.
Meridian Specific Plan Amendment (SP-5), July 2010 – This plan amendment relates to the industrial park development on a portion of the base west of I-215 and in the north-east corner of the base and not the airport itself, although due to the size of the develop-ment (up to 15 million square feet of industrial and commercial development), it impacts many of the same roadways and interchanges that will be utilized by airport traffic. These include improvements to the I-215 interchanges at Alessandro Blvd., Cactus Ave. and Van Buren Blvd.
4.5.1 hiGhwAy, ARTERiAl, AnD loCAl sTREET pRojECTs
Recommended Ground Access Projects: Recommended changes to the ground access project list include the following:
Five projects from the 2008 RTP list were deleted at the request of the airport. Projects MIP-06 and MIP-07 were mistakenly included in the 2008 RTP for MIP, and are therefore being deleted from this section. MIP-02 is essentially the same as MIP-01 so it has been deleted. Other deleted projects include:
� MIP-08 (04) Upgrade I-215/Cactus interchange (additional turning lane from W/B Cactus to S/B Rte. 215)
� MIP-12 (04) Improve Cactus (add 1 lane in each direction from I-215/Cactus IC to Perris Bl.)
MIP-08 has been completed. MIP-12, Cactus Ave., is identified as needing widening to 3 lanes in each direction in the Meridian SPA traffic study. However, this is related to indus-trial and commercial development and not airport-related traffic.
The Airport also requested the following changes:
� The description of MIP-01 was revised to change the name of the development and to specify 2 lanes in each direction, plus turning lanes. This project will begin construction in 2013.
� The description of MIP-04 was modified to remove references to numbers of lanes on the freeway ramps. This project has been designed and is scheduled to be con-structed in 2012.
Ground access improvements included in the 2012-2035 RTP Airport Vicinity Ground Access Element are summarized below in TABlE 4-9.
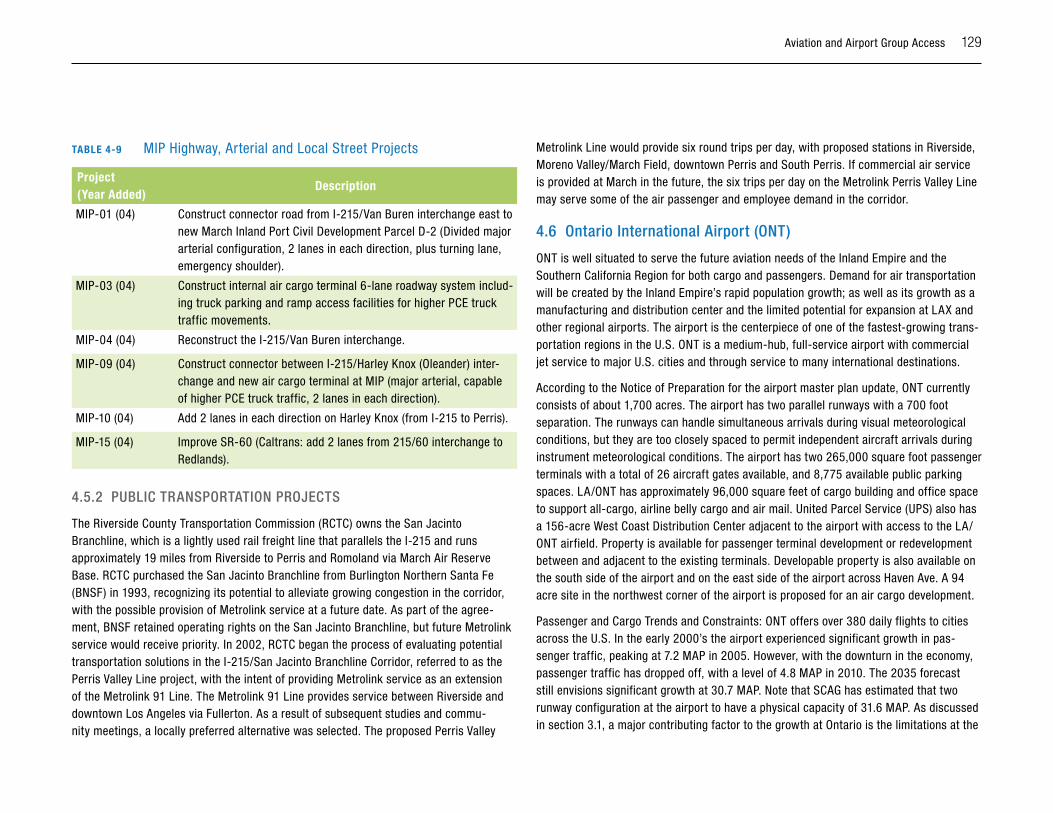
Aviation and Airport Group Access 129
TABlE 4-9 MIP Highway, Arterial and Local Street Projects
Project (Year Added)
Description
MIP-01 (04) Construct connector road from I-215/Van Buren interchange east to new March Inland Port Civil Development Parcel D-2 (Divided major arterial configuration, 2 lanes in each direction, plus turning lane, emergency shoulder).
MIP-03 (04) Construct internal air cargo terminal 6-lane roadway system includ-ing truck parking and ramp access facilities for higher PCE truck traffic movements.
MIP-04 (04) Reconstruct the I-215/Van Buren interchange.
MIP-09 (04) Construct connector between I-215/Harley Knox (Oleander) inter-change and new air cargo terminal at MIP (major arterial, capable of higher PCE truck traffic, 2 lanes in each direction).
MIP-10 (04) Add 2 lanes in each direction on Harley Knox (from I-215 to Perris).
MIP-15 (04) Improve SR-60 (Caltrans: add 2 lanes from 215/60 interchange to Redlands).
4.5.2 puBliC TRAnspoRTATion pRojECTs
The Riverside County Transportation Commission (RCTC) owns the San Jacinto Branchline, which is a lightly used rail freight line that parallels the I-215 and runs approximately 19 miles from Riverside to Perris and Romoland via March Air Reserve Base. RCTC purchased the San Jacinto Branchline from Burlington Northern Santa Fe (BNSF) in 1993, recognizing its potential to alleviate growing congestion in the corridor, with the possible provision of Metrolink service at a future date. As part of the agree-ment, BNSF retained operating rights on the San Jacinto Branchline, but future Metrolink service would receive priority. In 2002, RCTC began the process of evaluating potential transportation solutions in the I-215/San Jacinto Branchline Corridor, referred to as the Perris Valley Line project, with the intent of providing Metrolink service as an extension of the Metrolink 91 Line. The Metrolink 91 Line provides service between Riverside and downtown Los Angeles via Fullerton. As a result of subsequent studies and commu-nity meetings, a locally preferred alternative was selected. The proposed Perris Valley
Metrolink Line would provide six round trips per day, with proposed stations in Riverside, Moreno Valley/March Field, downtown Perris and South Perris. If commercial air service is provided at March in the future, the six trips per day on the Metrolink Perris Valley Line may serve some of the air passenger and employee demand in the corridor.
4.6 ontario international Airport (onT)
ONT is well situated to serve the future aviation needs of the Inland Empire and the Southern California Region for both cargo and passengers. Demand for air transportation will be created by the Inland Empire’s rapid population growth; as well as its growth as a manufacturing and distribution center and the limited potential for expansion at LAX and other regional airports. The airport is the centerpiece of one of the fastest-growing trans-portation regions in the U.S. ONT is a medium-hub, full-service airport with commercial jet service to major U.S. cities and through service to many international destinations.
According to the Notice of Preparation for the airport master plan update, ONT currently consists of about 1,700 acres. The airport has two parallel runways with a 700 foot separation. The runways can handle simultaneous arrivals during visual meteorological conditions, but they are too closely spaced to permit independent aircraft arrivals during instrument meteorological conditions. The airport has two 265,000 square foot passenger terminals with a total of 26 aircraft gates available, and 8,775 available public parking spaces. LA/ONT has approximately 96,000 square feet of cargo building and office space to support all-cargo, airline belly cargo and air mail. United Parcel Service (UPS) also has a 156-acre West Coast Distribution Center adjacent to the airport with access to the LA/ONT airfield. Property is available for passenger terminal development or redevelopment between and adjacent to the existing terminals. Developable property is also available on the south side of the airport and on the east side of the airport across Haven Ave. A 94 acre site in the northwest corner of the airport is proposed for an air cargo development.
Passenger and Cargo Trends and Constraints: ONT offers over 380 daily flights to cities across the U.S. In the early 2000’s the airport experienced significant growth in pas-senger traffic, peaking at 7.2 MAP in 2005. However, with the downturn in the economy, passenger traffic has dropped off, with a level of 4.8 MAP in 2010. The 2035 forecast still envisions significant growth at 30.7 MAP. Note that SCAG has estimated that two runway configuration at the airport to have a physical capacity of 31.6 MAP. As discussed in section 3.1, a major contributing factor to the growth at Ontario is the limitations at the
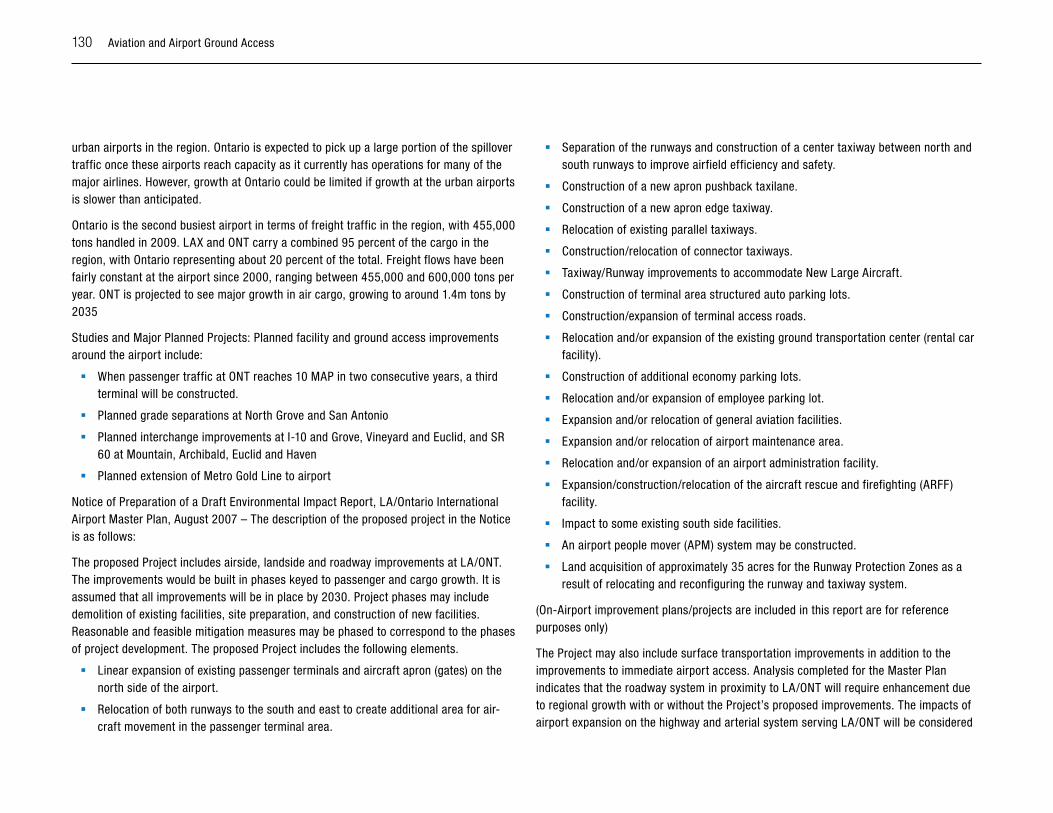
130 Aviation and Airport Ground Access
urban airports in the region. Ontario is expected to pick up a large portion of the spillover traffic once these airports reach capacity as it currently has operations for many of the major airlines. However, growth at Ontario could be limited if growth at the urban airports is slower than anticipated.
Ontario is the second busiest airport in terms of freight traffic in the region, with 455,000 tons handled in 2009. LAX and ONT carry a combined 95 percent of the cargo in the region, with Ontario representing about 20 percent of the total. Freight flows have been fairly constant at the airport since 2000, ranging between 455,000 and 600,000 tons per year. ONT is projected to see major growth in air cargo, growing to around 1.4m tons by 2035
Studies and Major Planned Projects: Planned facility and ground access improvements around the airport include:
� When passenger traffic at ONT reaches 10 MAP in two consecutive years, a third terminal will be constructed.
� Planned grade separations at North Grove and San Antonio
� Planned interchange improvements at I-10 and Grove, Vineyard and Euclid, and SR 60 at Mountain, Archibald, Euclid and Haven
� Planned extension of Metro Gold Line to airport
Notice of Preparation of a Draft Environmental Impact Report, LA/Ontario International Airport Master Plan, August 2007 – The description of the proposed project in the Notice is as follows:
The proposed Project includes airside, landside and roadway improvements at LA/ONT. The improvements would be built in phases keyed to passenger and cargo growth. It is assumed that all improvements will be in place by 2030. Project phases may include demolition of existing facilities, site preparation, and construction of new facilities. Reasonable and feasible mitigation measures may be phased to correspond to the phases of project development. The proposed Project includes the following elements.
� Linear expansion of existing passenger terminals and aircraft apron (gates) on the north side of the airport.
� Relocation of both runways to the south and east to create additional area for air-craft movement in the passenger terminal area.
� Separation of the runways and construction of a center taxiway between north and south runways to improve airfield efficiency and safety.
� Construction of a new apron pushback taxilane.
� Construction of a new apron edge taxiway.
� Relocation of existing parallel taxiways.
� Construction/relocation of connector taxiways.
� Taxiway/Runway improvements to accommodate New Large Aircraft.
� Construction of terminal area structured auto parking lots.
� Construction/expansion of terminal access roads.
� Relocation and/or expansion of the existing ground transportation center (rental car facility).
� Construction of additional economy parking lots.
� Relocation and/or expansion of employee parking lot.
� Expansion and/or relocation of general aviation facilities.
� Expansion and/or relocation of airport maintenance area.
� Relocation and/or expansion of an airport administration facility.
� Expansion/construction/relocation of the aircraft rescue and firefighting (ARFF) facility.
� Impact to some existing south side facilities.
� An airport people mover (APM) system may be constructed.
� Land acquisition of approximately 35 acres for the Runway Protection Zones as a result of relocating and reconfiguring the runway and taxiway system.
(On-Airport improvement plans/projects are included in this report are for reference purposes only)
The Project may also include surface transportation improvements in addition to the improvements to immediate airport access. Analysis completed for the Master Plan indicates that the roadway system in proximity to LA/ONT will require enhancement due to regional growth with or without the Project’s proposed improvements. The impacts of airport expansion on the highway and arterial system serving LA/ONT will be considered
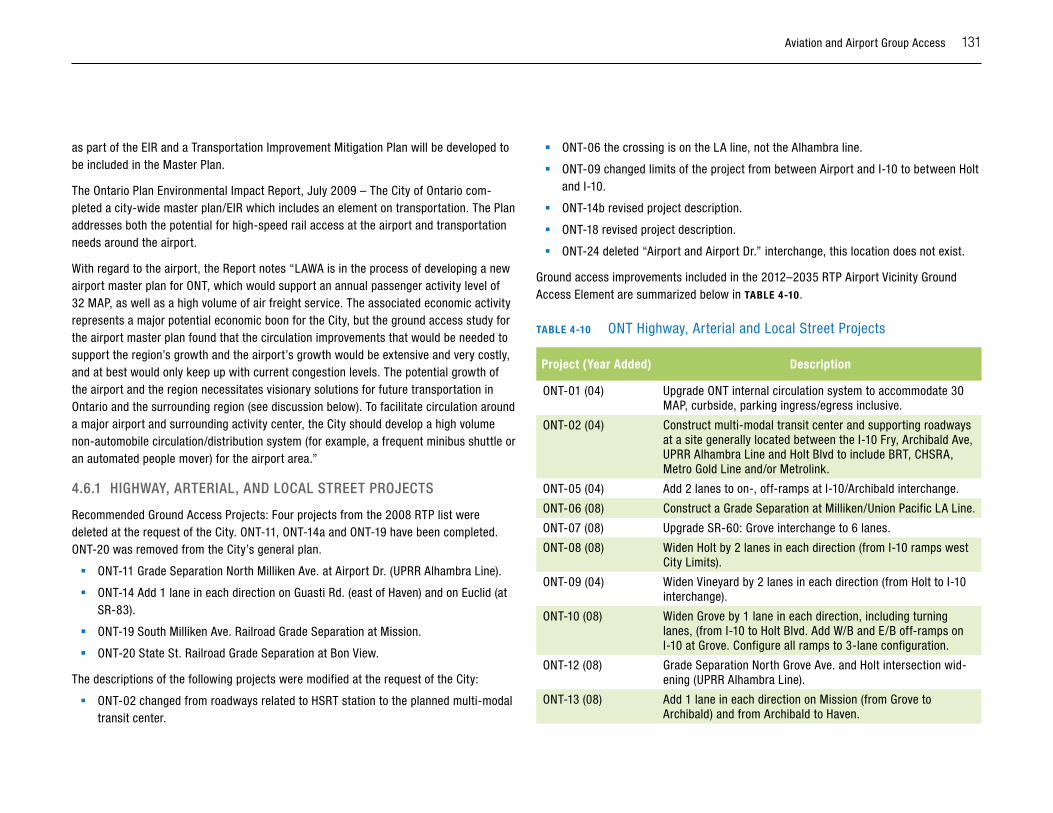
Aviation and Airport Group Access 131
as part of the EIR and a Transportation Improvement Mitigation Plan will be developed to be included in the Master Plan.
The Ontario Plan Environmental Impact Report, July 2009 – The City of Ontario com-pleted a city-wide master plan/EIR which includes an element on transportation. The Plan addresses both the potential for high-speed rail access at the airport and transportation needs around the airport.
With regard to the airport, the Report notes “LAWA is in the process of developing a new airport master plan for ONT, which would support an annual passenger activity level of 32 MAP, as well as a high volume of air freight service. The associated economic activity represents a major potential economic boon for the City, but the ground access study for the airport master plan found that the circulation improvements that would be needed to support the region’s growth and the airport’s growth would be extensive and very costly, and at best would only keep up with current congestion levels. The potential growth of the airport and the region necessitates visionary solutions for future transportation in Ontario and the surrounding region (see discussion below). To facilitate circulation around a major airport and surrounding activity center, the City should develop a high volume non-automobile circulation/distribution system (for example, a frequent minibus shuttle or an automated people mover) for the airport area.”
4.6.1 hiGhwAy, ARTERiAl, AnD loCAl sTREET pRojECTs
Recommended Ground Access Projects: Four projects from the 2008 RTP list were deleted at the request of the City. ONT-11, ONT-14a and ONT-19 have been completed. ONT-20 was removed from the City’s general plan.
� ONT-11 Grade Separation North Milliken Ave. at Airport Dr. (UPRR Alhambra Line).
� ONT-14 Add 1 lane in each direction on Guasti Rd. (east of Haven) and on Euclid (at SR-83).
� ONT-19 South Milliken Ave. Railroad Grade Separation at Mission.
� ONT-20 State St. Railroad Grade Separation at Bon View.
The descriptions of the following projects were modified at the request of the City:
� ONT-02 changed from roadways related to HSRT station to the planned multi-modal transit center.
� ONT-06 the crossing is on the LA line, not the Alhambra line.
� ONT-09 changed limits of the project from between Airport and I-10 to between Holt and I-10.
� ONT-14b revised project description.
� ONT-18 revised project description.
� ONT-24 deleted “Airport and Airport Dr.” interchange, this location does not exist.
Ground access improvements included in the 2012–2035 RTP Airport Vicinity Ground Access Element are summarized below in TABlE 4-10.
TABlE 4-10 ONT Highway, Arterial and Local Street Projects
Project (Year Added) Description
ONT-01 (04) Upgrade ONT internal circulation system to accommodate 30 MAP, curbside, parking ingress/egress inclusive.
ONT-02 (04) Construct multi-modal transit center and supporting roadways at a site generally located between the I-10 Fry, Archibald Ave, UPRR Alhambra Line and Holt Blvd to include BRT, CHSRA, Metro Gold Line and/or Metrolink.
ONT-05 (04) Add 2 lanes to on-, off-ramps at I-10/Archibald interchange.
ONT-06 (08) Construct a Grade Separation at Milliken/Union Pacific LA Line.
ONT-07 (08) Upgrade SR-60: Grove interchange to 6 lanes.
ONT-08 (08) Widen Holt by 2 lanes in each direction (from I-10 ramps west City Limits).
ONT-09 (04) Widen Vineyard by 2 lanes in each direction (from Holt to I-10 interchange).
ONT-10 (08) Widen Grove by 1 lane in each direction, including turning lanes, (from I-10 to Holt Blvd. Add W/B and E/B off-ramps on I-10 at Grove. Configure all ramps to 3-lane configuration.
ONT-12 (08) Grade Separation North Grove Ave. and Holt intersection wid-ening (UPRR Alhambra Line).
ONT-13 (08) Add 1 lane in each direction on Mission (from Grove to Archibald) and from Archibald to Haven.
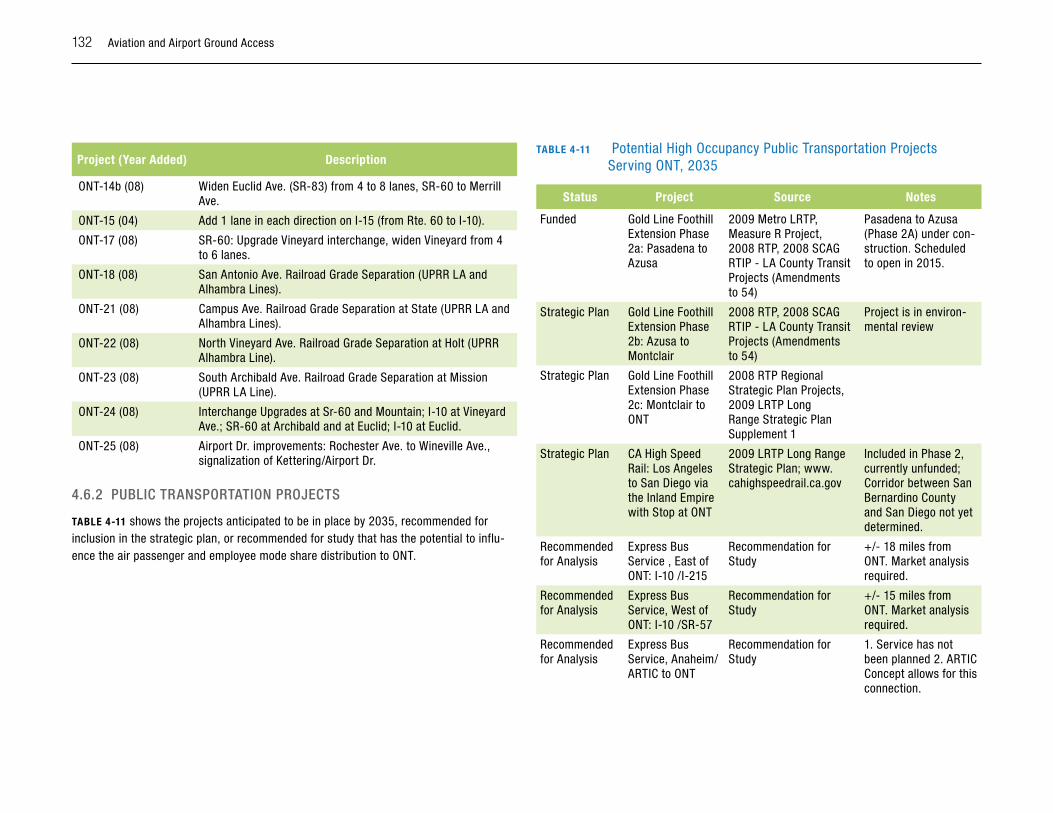
132 Aviation and Airport Ground Access
Project (Year Added) Description
ONT-14b (08) Widen Euclid Ave. (SR-83) from 4 to 8 lanes, SR-60 to Merrill Ave.
ONT-15 (04) Add 1 lane in each direction on I-15 (from Rte. 60 to I-10).
ONT-17 (08) SR-60: Upgrade Vineyard interchange, widen Vineyard from 4 to 6 lanes.
ONT-18 (08) San Antonio Ave. Railroad Grade Separation (UPRR LA and Alhambra Lines).
ONT-21 (08) Campus Ave. Railroad Grade Separation at State (UPRR LA and Alhambra Lines).
ONT-22 (08) North Vineyard Ave. Railroad Grade Separation at Holt (UPRR Alhambra Line).
ONT-23 (08) South Archibald Ave. Railroad Grade Separation at Mission (UPRR LA Line).
ONT-24 (08) Interchange Upgrades at Sr-60 and Mountain; I-10 at Vineyard Ave.; SR-60 at Archibald and at Euclid; I-10 at Euclid.
ONT-25 (08) Airport Dr. improvements: Rochester Ave. to Wineville Ave., signalization of Kettering/Airport Dr.
4.6.2 puBliC TRAnspoRTATion pRojECTs
TABlE 4-11 shows the projects anticipated to be in place by 2035, recommended for inclusion in the strategic plan, or recommended for study that has the potential to influ-ence the air passenger and employee mode share distribution to ONT.
TABlE 4-11 Potential High Occupancy Public Transportation Projects Serving ONT, 2035
Status Project Source Notes
Funded Gold Line Foothill Extension Phase 2a: Pasadena to Azusa
2009 Metro LRTP, Measure R Project, 2008 RTP, 2008 SCAG RTIP - LA County Transit Projects (Amendments to 54)
Pasadena to Azusa (Phase 2A) under con-struction. Scheduled to open in 2015.
Strategic Plan Gold Line Foothill Extension Phase 2b: Azusa to Montclair
2008 RTP, 2008 SCAG RTIP - LA County Transit Projects (Amendments to 54)
Project is in environ-mental review
Strategic Plan Gold Line Foothill Extension Phase 2c: Montclair to ONT
2008 RTP Regional Strategic Plan Projects, 2009 LRTP Long Range Strategic Plan Supplement 1
Strategic Plan CA High Speed Rail: Los Angeles to San Diego via the Inland Empire with Stop at ONT
2009 LRTP Long Range Strategic Plan; www.cahighspeedrail.ca.gov
Included in Phase 2, currently unfunded; Corridor between San Bernardino County and San Diego not yet determined.
Recommended for Analysis
Express Bus Service , East of ONT: I-10 /I-215
Recommendation for Study
+/- 18 miles from ONT. Market analysis required.
Recommended for Analysis
Express Bus Service, West of ONT: I-10 /SR-57
Recommendation for Study
+/- 15 miles from ONT. Market analysis required.
Recommended for Analysis
Express Bus Service, Anaheim/ARTIC to ONT
Recommendation for Study
1. Service has not been planned 2. ARTIC Concept allows for this connection.
Aviation and Airport Group Access 133
It is unclear if and when the Gold Line Foothill Extension will be extended to ONT. Depending on when it is extended to Montclair in relation to air passenger growth at ONT, an analyses should be conducted to determine the potential for a non-stop or limited stop bus service that travels between the Gold Line and ONT, to accommodate the demand for airport travel until the Gold Line serves ONT, or to accommodate the demand for airport travel in place of the Gold Line connection to ONT.
The consultant recommends that analyses is conducted to determine the potential for non-stop express bus service between ONT and the general locations along the I-10 listed in TABlE 5.5, and to ARTIC. This will require information on the distribution of air pas-senger origins by resident status at the demand levels assumed in this study. In general, for a non-stop frequent airport bus service to be economically viable, the airport should serve a minimum of 20 million origin and destination air passengers. Details are provided in Appendix III, Characteristics of Successful Airport Express Buses.
4.7 palm springs Airport (psp)
Palm Springs Airport is expected to continue growing in relation to the forecasted growth in the Coachella Valley. The PSP market is somewhat isolated geographically and unique because of its seasonality during the winter months. As the Coachella Valley population continues to grow, it is anticipated that PSP will play an integral part in the local and regional aviation demands.
Passenger and Cargo Trends and Constraints: Palm Springs Airport carried 1.5 MAP in 2009 and is projected to grow to 4.1 MAP by 2035, although, as with the other smaller airports in the region, this is tied in some part to spillover from the major airports when they reach capacity in addition to handling growth in its own subregion.
Airlines serving the airport include Virgin America (seasonal) Allegiant Air, Alaska, U.S. Airways, American, Delta/Delta Connection, Horizon Air, Sun Country (seasonal), United/United Express, WestJet, Continental (seasonal) and Frontier (seasonal) with a total of about 50 flights per day.
Cargo traffic is modest at the airport, with 27,000 tons in 2006. The 2035 projection is less than 100,000 tons.
Studies and Major Planned Projects: Planned facility and ground access improvements include:
� New FAA control tower, construction underway, expected completion 2013
� New consolidated rental car facility expected to be completed in the next three years
� Terminal expansion of the baggage claim and ticketing areas as supported by the new 2012 Master Plan Update
� Landside public parking and rental car ready lot expansion
(On-Airport improvement plans/projects are included in this report are for reference purposes only
The Master Plan Update is complete and is not yet in the environmental analysis phase. The final document is due sometime in mid-2012.
City of Palm Springs General Plan, 2007: Specifically referring to airport transportation, the plan states “Currently, SunLine Route 24 provides public transportation service to the airport. In addition, several resorts and hotels offer courtesy shuttle service to the airport. Additional transportation services including limousine, taxi, shuttle, and disabled and senior services are available at the airport. As the airport expands to satisfy air passenger demands, additional public transportation services should be considered to serve resident and visitor air passengers. Additional courtesy shuttles could be considered or integrated to provide efficient service to popular destinations, such as the Downtown area.” One of the planning goals related to aviation is to “Establish multimodal circulation linkages (busses, trams, bicycle infrastructure, etc.) to and from the airport to relieve parking and traffic loads at the airport.”
4.7.1 hiGhwAy, ARTERiAl, AnD loCAl sTREET pRojECTs
Recommended Ground Access Projects: Recommended changes to the ground access project list include the following:
� PSP-04 (04) Add 1 lane in each direction on Farrell (from Ramon Rd. to Vista Chino).
� PSP-05 (04) Upgrade intersection of Indian Canyon and Tahquitz Canyon Rd.
� PSP-07 (04) Add 1 additional left and right turning lanes from Tahquitz to Palm Canyon.
� PSP-08 (04) Upgrade 1-10/Gene Autry Trail interchange ramps to a 2-lane configu-ration. Modify Gene Autry Trail from 2 to 6 lanes (from 1-10 interchange to Salvia Rd.).
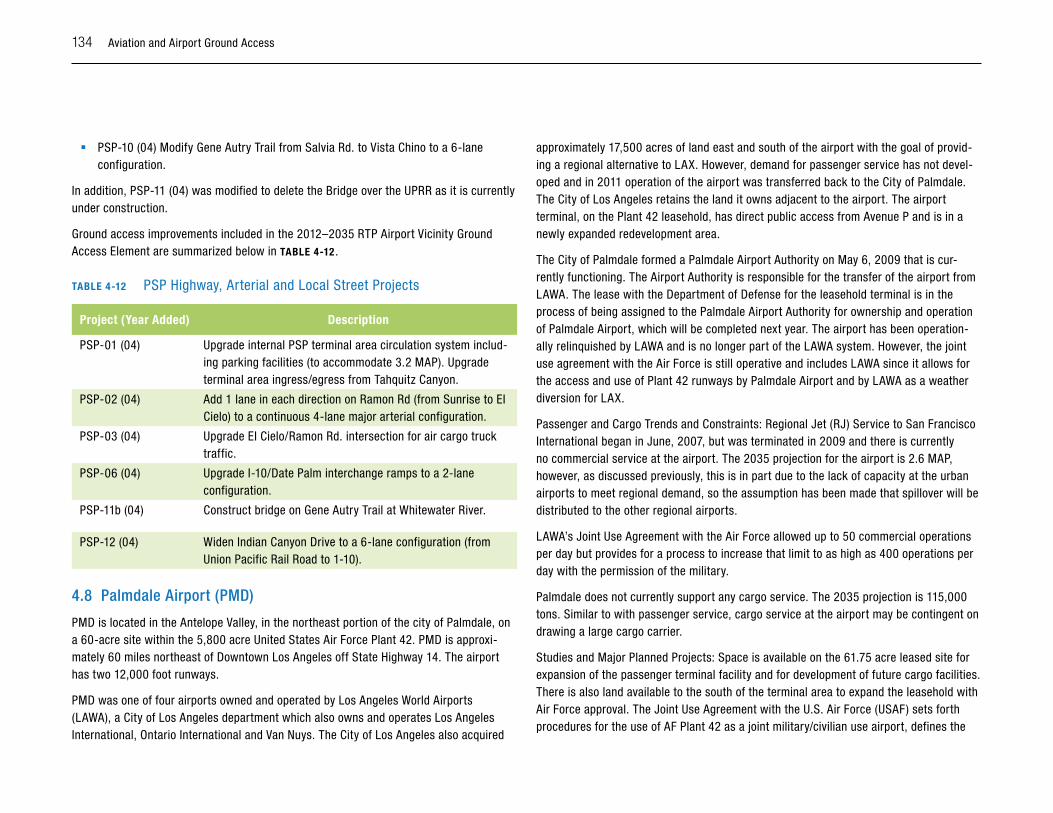
134 Aviation and Airport Ground Access
� PSP-10 (04) Modify Gene Autry Trail from Salvia Rd. to Vista Chino to a 6-lane configuration.
In addition, PSP-11 (04) was modified to delete the Bridge over the UPRR as it is currently under construction.
Ground access improvements included in the 2012–2035 RTP Airport Vicinity Ground Access Element are summarized below in TABlE 4-12 .
TABlE 4-12 PSP Highway, Arterial and Local Street Projects
Project (Year Added) Description
PSP-01 (04) Upgrade internal PSP terminal area circulation system includ-ing parking facilities (to accommodate 3.2 MAP). Upgrade terminal area ingress/egress from Tahquitz Canyon.
PSP-02 (04) Add 1 lane in each direction on Ramon Rd (from Sunrise to EI Cielo) to a continuous 4-lane major arterial configuration.
PSP-03 (04) Upgrade EI Cielo/Ramon Rd. intersection for air cargo truck traffic.
PSP-06 (04) Upgrade I-10/Date Palm interchange ramps to a 2-lane configuration.
PSP-11b (04) Construct bridge on Gene Autry Trail at Whitewater River.
PSP-12 (04) Widen Indian Canyon Drive to a 6-lane configuration (from Union Pacific Rail Road to 1-10).
4.8 palmdale Airport (pMD)
PMD is located in the Antelope Valley, in the northeast portion of the city of Palmdale, on a 60-acre site within the 5,800 acre United States Air Force Plant 42. PMD is approxi-mately 60 miles northeast of Downtown Los Angeles off State Highway 14. The airport has two 12,000 foot runways.
PMD was one of four airports owned and operated by Los Angeles World Airports (LAWA), a City of Los Angeles department which also owns and operates Los Angeles International, Ontario International and Van Nuys. The City of Los Angeles also acquired
approximately 17,500 acres of land east and south of the airport with the goal of provid-ing a regional alternative to LAX. However, demand for passenger service has not devel-oped and in 2011 operation of the airport was transferred back to the City of Palmdale. The City of Los Angeles retains the land it owns adjacent to the airport. The airport terminal, on the Plant 42 leasehold, has direct public access from Avenue P and is in a newly expanded redevelopment area.
The City of Palmdale formed a Palmdale Airport Authority on May 6, 2009 that is cur-rently functioning. The Airport Authority is responsible for the transfer of the airport from LAWA. The lease with the Department of Defense for the leasehold terminal is in the process of being assigned to the Palmdale Airport Authority for ownership and operation of Palmdale Airport, which will be completed next year. The airport has been operation-ally relinquished by LAWA and is no longer part of the LAWA system. However, the joint use agreement with the Air Force is still operative and includes LAWA since it allows for the access and use of Plant 42 runways by Palmdale Airport and by LAWA as a weather diversion for LAX.
Passenger and Cargo Trends and Constraints: Regional Jet (RJ) Service to San Francisco International began in June, 2007, but was terminated in 2009 and there is currently no commercial service at the airport. The 2035 projection for the airport is 2.6 MAP, however, as discussed previously, this is in part due to the lack of capacity at the urban airports to meet regional demand, so the assumption has been made that spillover will be distributed to the other regional airports.
LAWA’s Joint Use Agreement with the Air Force allowed up to 50 commercial operations per day but provides for a process to increase that limit to as high as 400 operations per day with the permission of the military.
Palmdale does not currently support any cargo service. The 2035 projection is 115,000 tons. Similar to with passenger service, cargo service at the airport may be contingent on drawing a large cargo carrier.
Studies and Major Planned Projects: Space is available on the 61.75 acre leased site for expansion of the passenger terminal facility and for development of future cargo facilities. There is also land available to the south of the terminal area to expand the leasehold with Air Force approval. The Joint Use Agreement with the U.S. Air Force (USAF) sets forth procedures for the use of AF Plant 42 as a joint military/civilian use airport, defines the
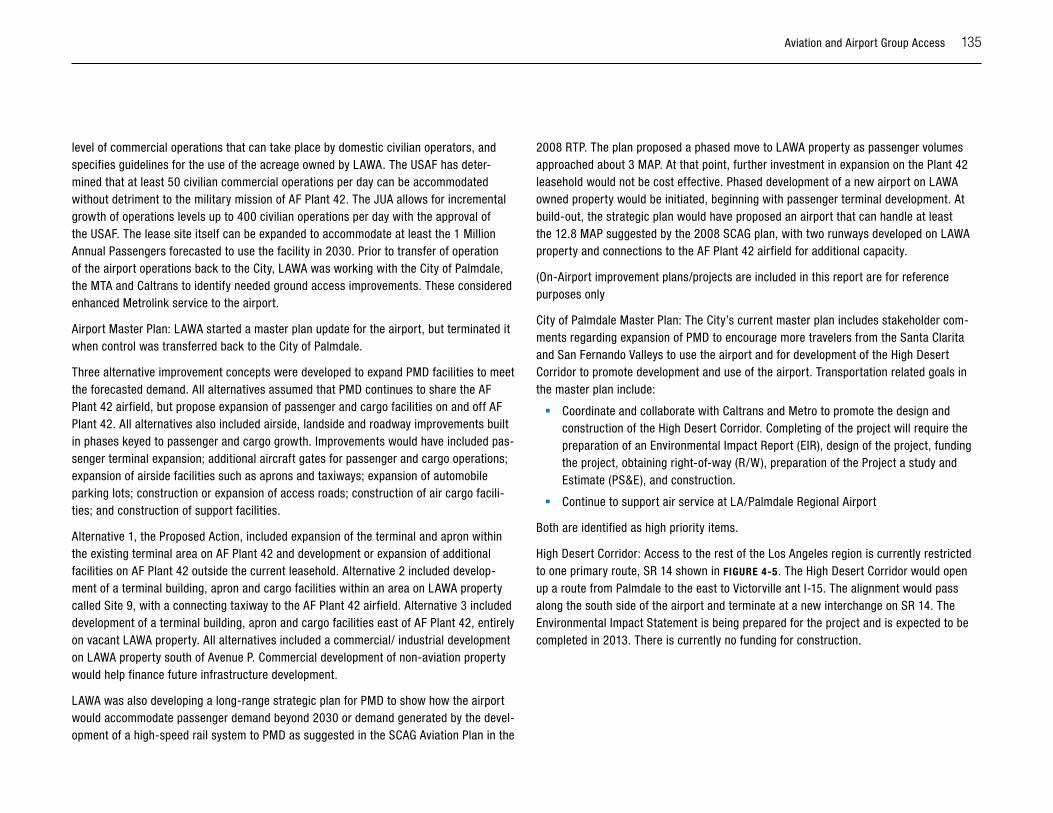
Aviation and Airport Group Access 135
level of commercial operations that can take place by domestic civilian operators, and specifies guidelines for the use of the acreage owned by LAWA. The USAF has deter-mined that at least 50 civilian commercial operations per day can be accommodated without detriment to the military mission of AF Plant 42. The JUA allows for incremental growth of operations levels up to 400 civilian operations per day with the approval of the USAF. The lease site itself can be expanded to accommodate at least the 1 Million Annual Passengers forecasted to use the facility in 2030. Prior to transfer of operation of the airport operations back to the City, LAWA was working with the City of Palmdale, the MTA and Caltrans to identify needed ground access improvements. These considered enhanced Metrolink service to the airport.
Airport Master Plan: LAWA started a master plan update for the airport, but terminated it when control was transferred back to the City of Palmdale.
Three alternative improvement concepts were developed to expand PMD facilities to meet the forecasted demand. All alternatives assumed that PMD continues to share the AF Plant 42 airfield, but propose expansion of passenger and cargo facilities on and off AF Plant 42. All alternatives also included airside, landside and roadway improvements built in phases keyed to passenger and cargo growth. Improvements would have included pas-senger terminal expansion; additional aircraft gates for passenger and cargo operations; expansion of airside facilities such as aprons and taxiways; expansion of automobile parking lots; construction or expansion of access roads; construction of air cargo facili-ties; and construction of support facilities.
Alternative 1, the Proposed Action, included expansion of the terminal and apron within the existing terminal area on AF Plant 42 and development or expansion of additional facilities on AF Plant 42 outside the current leasehold. Alternative 2 included develop-ment of a terminal building, apron and cargo facilities within an area on LAWA property called Site 9, with a connecting taxiway to the AF Plant 42 airfield. Alternative 3 included development of a terminal building, apron and cargo facilities east of AF Plant 42, entirely on vacant LAWA property. All alternatives included a commercial/ industrial development on LAWA property south of Avenue P. Commercial development of non-aviation property would help finance future infrastructure development.
LAWA was also developing a long-range strategic plan for PMD to show how the airport would accommodate passenger demand beyond 2030 or demand generated by the devel-opment of a high-speed rail system to PMD as suggested in the SCAG Aviation Plan in the
2008 RTP. The plan proposed a phased move to LAWA property as passenger volumes approached about 3 MAP. At that point, further investment in expansion on the Plant 42 leasehold would not be cost effective. Phased development of a new airport on LAWA owned property would be initiated, beginning with passenger terminal development. At build-out, the strategic plan would have proposed an airport that can handle at least the 12.8 MAP suggested by the 2008 SCAG plan, with two runways developed on LAWA property and connections to the AF Plant 42 airfield for additional capacity.
(On-Airport improvement plans/projects are included in this report are for reference purposes only
City of Palmdale Master Plan: The City’s current master plan includes stakeholder com-ments regarding expansion of PMD to encourage more travelers from the Santa Clarita and San Fernando Valleys to use the airport and for development of the High Desert Corridor to promote development and use of the airport. Transportation related goals in the master plan include:
� Coordinate and collaborate with Caltrans and Metro to promote the design and construction of the High Desert Corridor. Completing of the project will require the preparation of an Environmental Impact Report (EIR), design of the project, funding the project, obtaining right-of-way (R/W), preparation of the Project a study and Estimate (PS&E), and construction.
� Continue to support air service at LA/Palmdale Regional Airport
Both are identified as high priority items.
High Desert Corridor: Access to the rest of the Los Angeles region is currently restricted to one primary route, SR 14 shown in FIGuRE 4-5. The High Desert Corridor would open up a route from Palmdale to the east to Victorville ant I-15. The alignment would pass along the south side of the airport and terminate at a new interchange on SR 14. The Environmental Impact Statement is being prepared for the project and is expected to be completed in 2013. There is currently no funding for construction.
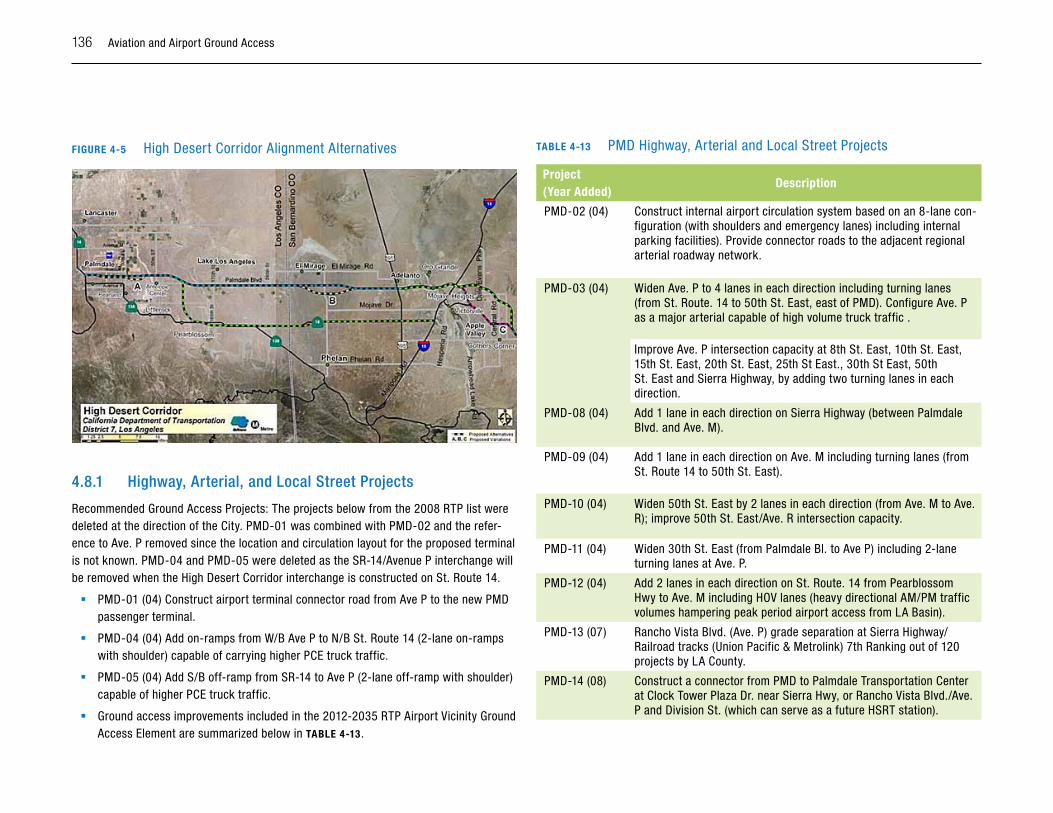
136 Aviation and Airport Ground Access
FIGuRE 4-5 High Desert Corridor Alignment Alternatives
4.8.1 highway, Arterial, and local street projects
Recommended Ground Access Projects: The projects below from the 2008 RTP list were deleted at the direction of the City. PMD-01 was combined with PMD-02 and the refer-ence to Ave. P removed since the location and circulation layout for the proposed terminal is not known. PMD-04 and PMD-05 were deleted as the SR-14/Avenue P interchange will be removed when the High Desert Corridor interchange is constructed on St. Route 14.
� PMD-01 (04) Construct airport terminal connector road from Ave P to the new PMD passenger terminal.
� PMD-04 (04) Add on-ramps from W/B Ave P to N/B St. Route 14 (2-lane on-ramps with shoulder) capable of carrying higher PCE truck traffic.
� PMD-05 (04) Add S/B off-ramp from SR-14 to Ave P (2-lane off-ramp with shoulder) capable of higher PCE truck traffic.
� Ground access improvements included in the 2012-2035 RTP Airport Vicinity Ground Access Element are summarized below in TABlE 4-13.
TABlE 4-13 PMD Highway, Arterial and Local Street Projects
Project (Year Added)
Description
PMD-02 (04) Construct internal airport circulation system based on an 8-lane con-figuration (with shoulders and emergency lanes) including internal parking facilities). Provide connector roads to the adjacent regional arterial roadway network.
PMD-03 (04) Widen Ave. P to 4 lanes in each direction including turning lanes (from St. Route. 14 to 50th St. East, east of PMD). Configure Ave. P as a major arterial capable of high volume truck traffic .
Improve Ave. P intersection capacity at 8th St. East, 10th St. East, 15th St. East, 20th St. East, 25th St East., 30th St East, 50th St. East and Sierra Highway, by adding two turning lanes in each direction.
PMD-08 (04) Add 1 lane in each direction on Sierra Highway (between Palmdale Blvd. and Ave. M).
PMD-09 (04) Add 1 lane in each direction on Ave. M including turning lanes (from St. Route 14 to 50th St. East).
PMD-10 (04) Widen 50th St. East by 2 lanes in each direction (from Ave. M to Ave. R); improve 50th St. East/Ave. R intersection capacity.
PMD-11 (04) Widen 30th St. East (from Palmdale Bl. to Ave P) including 2-lane turning lanes at Ave. P.
PMD-12 (04) Add 2 lanes in each direction on St. Route. 14 from Pearblossom Hwy to Ave. M including HOV lanes (heavy directional AM/PM traffic volumes hampering peak period airport access from LA Basin).
PMD-13 (07) Rancho Vista Blvd. (Ave. P) grade separation at Sierra Highway/Railroad tracks (Union Pacific & Metrolink) 7th Ranking out of 120 projects by LA County.
PMD-14 (08) Construct a connector from PMD to Palmdale Transportation Center at Clock Tower Plaza Dr. near Sierra Hwy, or Rancho Vista Blvd./Ave. P and Division St. (which can serve as a future HSRT station).
Aviation and Airport Group Access 137
4.9 san Bernardino international Airport (sBD)
SBD provides an optimal location for air cargo and logistics management for companies conducting businesses in Los Angeles, Southern California, Mexico and the US inter-mountain regions of Denver, Salt Lake City, Las Vegas and Phoenix. Centrally located just 60 miles east of the Los Angeles International Airport (LAX), SBD is surrounded by major interstate freeways (I-10, I-215 and SR-330/SR-210), enjoys an excellent local surface transportation access, is in a congestion-free air corridor and is located within two miles of a major intermodal BNSF Railway facility. SBD is well positioned as a consolidation/distribution center for both air cargo and ground shipments.
The San Bernardino International Airport Authority (SBIAA) is a joint powers authority comprised of the County of San Bernardino and the Cities of San Bernardino, Colton, Loma Linda and Highland. Formed in 1992, the SBIAA Commission oversees the aviation portion of the former Norton Air Force Base of approximately 1300 acres.
The Inland Valley Development Agency (IVDA) is a joint powers authority comprised of the County of San Bernardino and the Cities of San Bernardino, Colton and Loma Linda. Formed in 1990, the IVDA is responsible for the redevelopment of the non-aviation portion of the former Norton Air Force Base. In addition to the approximately 600 acres on the former base, the IVDA also has a redevelopment project area of approximately 13,000 acres of surrounding properties. The land use designations within the project area include: light and heavy industrial, office, commercial and residential.
Passenger and Cargo Trends and Constraints: SBD does not currently provide commercial passenger service; however, the airport has an existing passenger terminal that can be utilized if air carriers can be attracted to the airport. The 2035 projection for the airport is 2.8 MAP, however, as discussed previously, this is in part due to the lack of capacity at the constrained urban airports to meet regional demand, so the assumption has been made that spillover will be distributed to the other regional airports including SBD.
Although the airport does not currently handle a significant amount of cargo, SBD is aggressively marketing itself as a cargo facility and can offer expedited Customs clear-ance, abundant aircraft ramp space, ample room for new development opportunities and expansion potential in a secure and modern business environment, including Foreign Trade Zone and LAMBRA tax incentives. With a newly reconstructed 10,000’ x 200’ run-way and available hangar facilities, SBD claims the region’s lowest airport user fees and
has the ability to accommodate Stage 2 aircraft. The 2035 projection is 166,000 tons of cargo, which would be 4th highest in the region.
Studies and Major Planned Projects: Planned facility and ground access improvements include: (On-Airport improvement plans/projects are included in this report are for refer-ence purposes only
� There is no near term plan by the San Bernardino Airport Authority for constructing a passenger terminal on the north end of the airfield--the existing terminal is being expanded and refurbished. The cargo terminal construction is listed on the Airport Capital Improvement Plan, but funding has not been programmed.
� 40 new small hangars and several large hangars on the runway’s east side are to be constructed.
4.9.1 hiGhwAy, ARTERiAl, AnD loCAl sTREET pRojECTs
Recommended Ground Access Projects: Three projects from the 2008 RTP list were deleted since the Airport indicated they are complete.
� SBI-01 (04) Upgrade internal circulation system to the SBI passenger terminal at Leland Norton Way and Rialto. Construct 6-lane major arterial configuration with double turning lanes and emergency lanes.
� SBI-08 (04) Upgrade Harry Sheppard Blvd. (from Leland Norton Way to Tippecanoe).
� SBI-09 (04) Upgrade the I-215/Mill interchange (add 1 lane to each on-, and off-ramp designed for higher PCE truck traffic).
The descriptions of three projects were revised based on input from the Airport.
� SBI-03, SBI-06 and SBI-07 were changed to reflect a different number of lanes for widening.
� SBI-07 was also modified to change the project limits
In addition, three projects (SBI-11 – SBI-13) were added at the request of the Airport.
Ground access improvements included in the 2012-2035 RTP Airport Vicinity Ground Access Element are summarized below in TABlE 4-14.
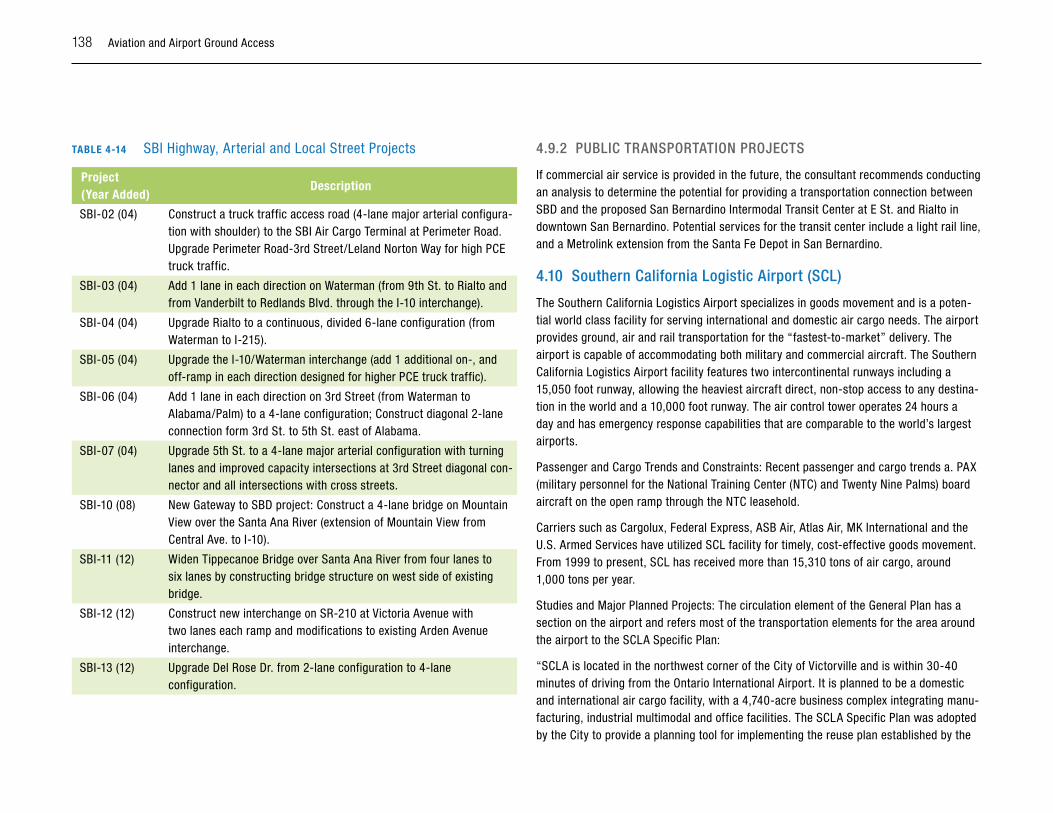
138 Aviation and Airport Ground Access
TABlE 4-14 SBI Highway, Arterial and Local Street Projects
Project (Year Added)
Description
SBI-02 (04) Construct a truck traffic access road (4-lane major arterial configura-tion with shoulder) to the SBI Air Cargo Terminal at Perimeter Road. Upgrade Perimeter Road-3rd Street/Leland Norton Way for high PCE truck traffic.
SBI-03 (04) Add 1 lane in each direction on Waterman (from 9th St. to Rialto and from Vanderbilt to Redlands Blvd. through the I-10 interchange).
SBI-04 (04) Upgrade Rialto to a continuous, divided 6-lane configuration (from Waterman to I-215).
SBI-05 (04) Upgrade the I-10/Waterman interchange (add 1 additional on-, and off-ramp in each direction designed for higher PCE truck traffic).
SBI-06 (04) Add 1 lane in each direction on 3rd Street (from Waterman to Alabama/Palm) to a 4-lane configuration; Construct diagonal 2-lane connection form 3rd St. to 5th St. east of Alabama.
SBI-07 (04) Upgrade 5th St. to a 4-lane major arterial configuration with turning lanes and improved capacity intersections at 3rd Street diagonal con-nector and all intersections with cross streets.
SBI-10 (08) New Gateway to SBD project: Construct a 4-lane bridge on Mountain View over the Santa Ana River (extension of Mountain View from Central Ave. to I-10).
SBI-11 (12) Widen Tippecanoe Bridge over Santa Ana River from four lanes to six lanes by constructing bridge structure on west side of existing bridge.
SBI-12 (12) Construct new interchange on SR-210 at Victoria Avenue with two lanes each ramp and modifications to existing Arden Avenue interchange.
SBI-13 (12) Upgrade Del Rose Dr. from 2-lane configuration to 4-lane configuration.
4.9.2 puBliC TRAnspoRTATion pRojECTs
If commercial air service is provided in the future, the consultant recommends conducting an analysis to determine the potential for providing a transportation connection between SBD and the proposed San Bernardino Intermodal Transit Center at E St. and Rialto in downtown San Bernardino. Potential services for the transit center include a light rail line, and a Metrolink extension from the Santa Fe Depot in San Bernardino.
4.10 southern California logistic Airport (sCl)
The Southern California Logistics Airport specializes in goods movement and is a poten-tial world class facility for serving international and domestic air cargo needs. The airport provides ground, air and rail transportation for the “fastest-to-market” delivery. The airport is capable of accommodating both military and commercial aircraft. The Southern California Logistics Airport facility features two intercontinental runways including a 15,050 foot runway, allowing the heaviest aircraft direct, non-stop access to any destina-tion in the world and a 10,000 foot runway. The air control tower operates 24 hours a day and has emergency response capabilities that are comparable to the world’s largest airports.
Passenger and Cargo Trends and Constraints: Recent passenger and cargo trends a. PAX (military personnel for the National Training Center (NTC) and Twenty Nine Palms) board aircraft on the open ramp through the NTC leasehold.
Carriers such as Cargolux, Federal Express, ASB Air, Atlas Air, MK International and the U.S. Armed Services have utilized SCL facility for timely, cost-effective goods movement. From 1999 to present, SCL has received more than 15,310 tons of air cargo, around 1,000 tons per year.
Studies and Major Planned Projects: The circulation element of the General Plan has a section on the airport and refers most of the transportation elements for the area around the airport to the SCLA Specific Plan:
“SCLA is located in the northwest corner of the City of Victorville and is within 30-40 minutes of driving from the Ontario International Airport. It is planned to be a domestic and international air cargo facility, with a 4,740-acre business complex integrating manu-facturing, industrial multimodal and office facilities. The SCLA Specific Plan was adopted by the City to provide a planning tool for implementing the reuse plan established by the
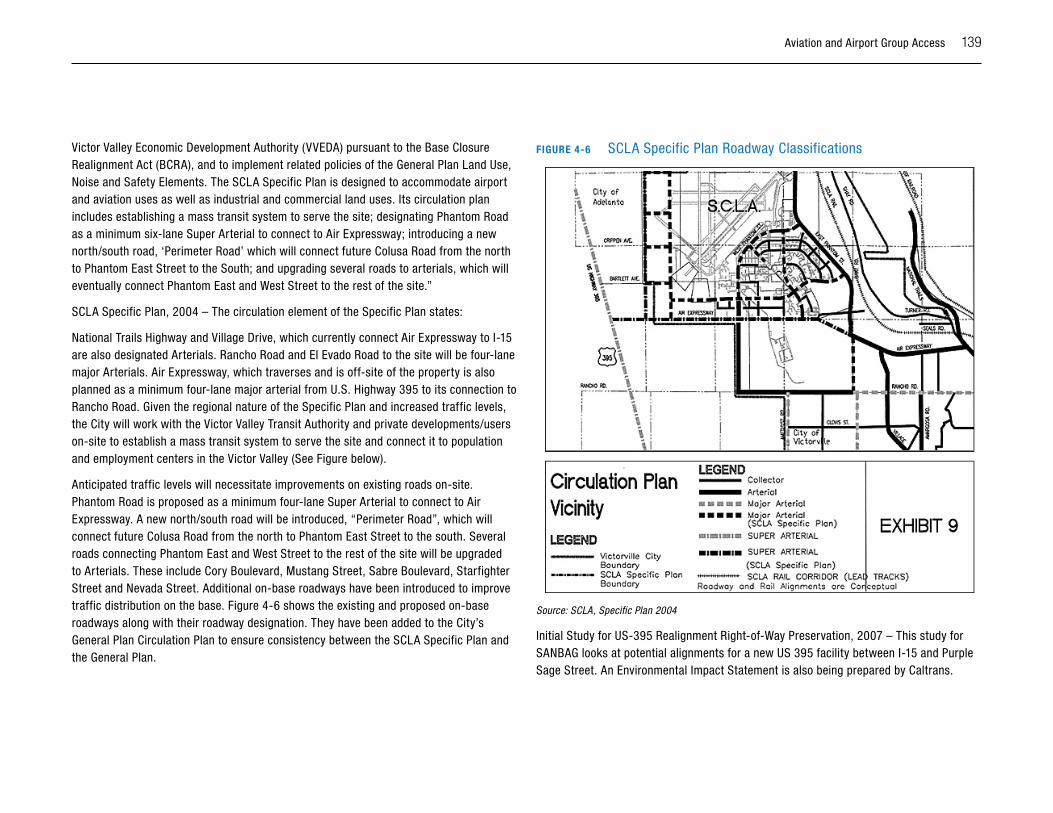
Aviation and Airport Group Access 139
Victor Valley Economic Development Authority (VVEDA) pursuant to the Base Closure Realignment Act (BCRA), and to implement related policies of the General Plan Land Use, Noise and Safety Elements. The SCLA Specific Plan is designed to accommodate airport and aviation uses as well as industrial and commercial land uses. Its circulation plan includes establishing a mass transit system to serve the site; designating Phantom Road as a minimum six-lane Super Arterial to connect to Air Expressway; introducing a new north/south road, ‘Perimeter Road’ which will connect future Colusa Road from the north to Phantom East Street to the South; and upgrading several roads to arterials, which will eventually connect Phantom East and West Street to the rest of the site.”
SCLA Specific Plan, 2004 – The circulation element of the Specific Plan states:
National Trails Highway and Village Drive, which currently connect Air Expressway to I-15 are also designated Arterials. Rancho Road and El Evado Road to the site will be four-lane major Arterials. Air Expressway, which traverses and is off-site of the property is also planned as a minimum four-lane major arterial from U.S. Highway 395 to its connection to Rancho Road. Given the regional nature of the Specific Plan and increased traffic levels, the City will work with the Victor Valley Transit Authority and private developments/users on-site to establish a mass transit system to serve the site and connect it to population and employment centers in the Victor Valley (See Figure below).
Anticipated traffic levels will necessitate improvements on existing roads on-site. Phantom Road is proposed as a minimum four-lane Super Arterial to connect to Air Expressway. A new north/south road will be introduced, “Perimeter Road”, which will connect future Colusa Road from the north to Phantom East Street to the south. Several roads connecting Phantom East and West Street to the rest of the site will be upgraded to Arterials. These include Cory Boulevard, Mustang Street, Sabre Boulevard, Starfighter Street and Nevada Street. Additional on-base roadways have been introduced to improve traffic distribution on the base. Figure 4-6 shows the existing and proposed on-base roadways along with their roadway designation. They have been added to the City’s General Plan Circulation Plan to ensure consistency between the SCLA Specific Plan and the General Plan.
FIGuRE 4-6 SCLA Specific Plan Roadway Classifications
Source: SCLA, Specific Plan 2004
Initial Study for US-395 Realignment Right-of-Way Preservation, 2007 – This study for SANBAG looks at potential alignments for a new US 395 facility between I-15 and Purple Sage Street. An Environmental Impact Statement is also being prepared by Caltrans.
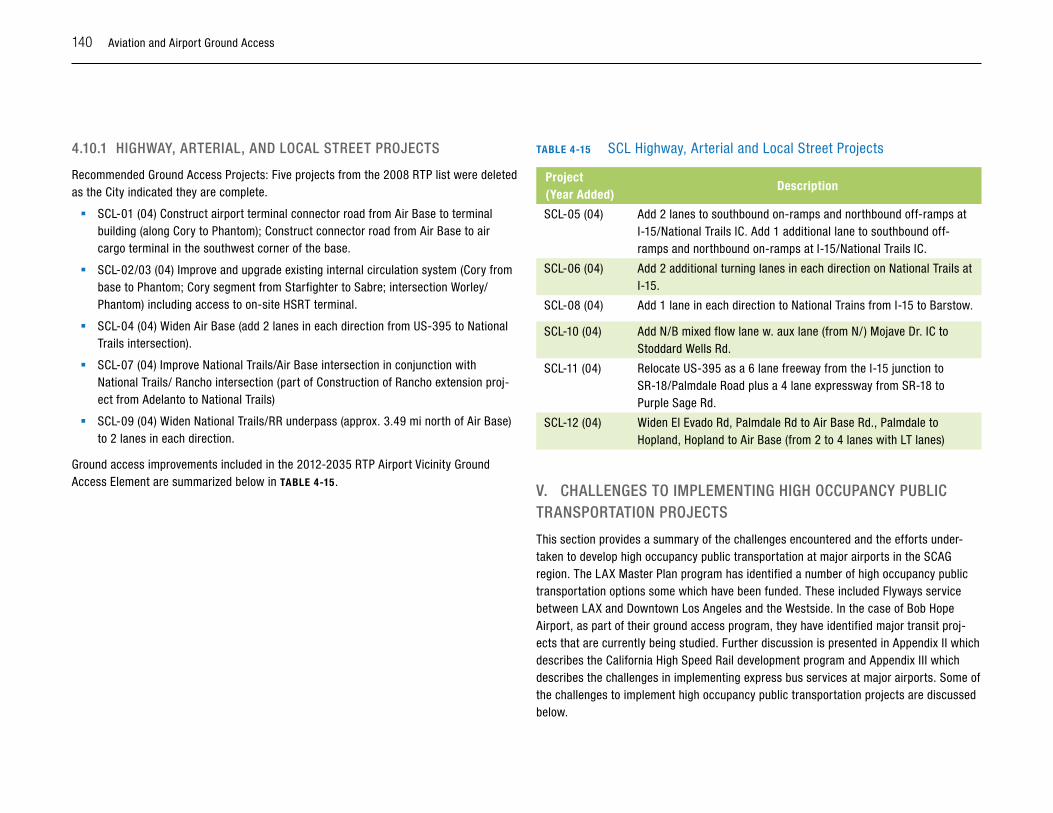
140 Aviation and Airport Ground Access
4.10.1 hiGhwAy, ARTERiAl, AnD loCAl sTREET pRojECTs
Recommended Ground Access Projects: Five projects from the 2008 RTP list were deleted as the City indicated they are complete.
� SCL-01 (04) Construct airport terminal connector road from Air Base to terminal building (along Cory to Phantom); Construct connector road from Air Base to air cargo terminal in the southwest corner of the base.
� SCL-02/03 (04) Improve and upgrade existing internal circulation system (Cory from base to Phantom; Cory segment from Starfighter to Sabre; intersection Worley/Phantom) including access to on-site HSRT terminal.
� SCL-04 (04) Widen Air Base (add 2 lanes in each direction from US-395 to National Trails intersection).
� SCL-07 (04) Improve National Trails/Air Base intersection in conjunction with National Trails/ Rancho intersection (part of Construction of Rancho extension proj-ect from Adelanto to National Trails)
� SCL-09 (04) Widen National Trails/RR underpass (approx. 3.49 mi north of Air Base) to 2 lanes in each direction.
Ground access improvements included in the 2012-2035 RTP Airport Vicinity Ground Access Element are summarized below in TABlE 4-15.
TABlE 4-15 SCL Highway, Arterial and Local Street Projects
Project (Year Added)
Description
SCL-05 (04) Add 2 lanes to southbound on-ramps and northbound off-ramps at I-15/National Trails IC. Add 1 additional lane to southbound off-ramps and northbound on-ramps at I-15/National Trails IC.
SCL-06 (04) Add 2 additional turning lanes in each direction on National Trails at I-15.
SCL-08 (04) Add 1 lane in each direction to National Trains from I-15 to Barstow.
SCL-10 (04) Add N/B mixed flow lane w. aux lane (from N/) Mojave Dr. IC to Stoddard Wells Rd.
SCL-11 (04) Relocate US-395 as a 6 lane freeway from the I-15 junction to SR-18/Palmdale Road plus a 4 lane expressway from SR-18 to Purple Sage Rd.
SCL-12 (04) Widen El Evado Rd, Palmdale Rd to Air Base Rd., Palmdale to Hopland, Hopland to Air Base (from 2 to 4 lanes with LT lanes)
v. ChAllEnGEs To iMplEMEnTinG hiGh oCCupAnCy puBliC TRAnspoRTATion pRojECTs
This section provides a summary of the challenges encountered and the efforts under-taken to develop high occupancy public transportation at major airports in the SCAG region. The LAX Master Plan program has identified a number of high occupancy public transportation options some which have been funded. These included Flyways service between LAX and Downtown Los Angeles and the Westside. In the case of Bob Hope Airport, as part of their ground access program, they have identified major transit proj-ects that are currently being studied. Further discussion is presented in Appendix II which describes the California High Speed Rail development program and Appendix III which describes the challenges in implementing express bus services at major airports. Some of the challenges to implement high occupancy public transportation projects are discussed below.
Aviation and Airport Group Access 141
5.1 sponsorship and Funding of Express Buses
If the analyses recommended in this study are undertaken and show there will be a need for airport express buses from ARTIC to serve Southern California airports, or from vari-ous areas in the ONT market area, sponsorship and funding of the services are issues that will need to be addressed.
It is not typical for an airport operator to sponsor an airport express bus or system of express buses to accommodate the ground access trip of the airport user, since the airport operator is primarily concerned with operating the airport safely and efficiently, and the airport operator is not a public transportation operator. The airport operator is concerned with maintaining and improving the airport, and keeping fees reasonable for the airlines, compared to fees being assessed at comparable airports. The two airport express bus systems sponsored by airport operators in the United States are the FlyAway network serving LAX, sponsored by Los Angeles World Airports, and the Logan Express, a system of non-stop buses sponsored by the Massachusetts Port Authority, serving Boston Logan International Airport.
Transit operators are currently struggling with maintaining existing levels of service due to funding cuts. In addition, the transit operator is concerned with serving the entire population and may have difficulty justifying the provision of service that the airport cus-tomer needs at the exclusion of the rest of the population. The transit operator often feels the airport operator should provide such service and the airport operator believes it is the responsibility of the transit operator.
In addition to airport operators and transit agencies not having funds available for high occupancy public transportation modes serving the airport customer, or not considering it a priority compared to other projects, there are funding regulations for airport operators and transit operators that can make it difficult to justify operating such a service. Airport operators are concerned with complying with the revenue diversion regulation, as well adhering to the allowable uses of various sources of revenue, such as Passenger Facility Charges (PFCs) and Airport Improvement Program (AIP) funds. Transit operators are concerned with complying with the federal charter regulations. In certain circumstances, a bus service tailored to the airport customer could be construed as a charter service, and the FTA prohibits transit agencies that accept federal funds from operating charter service because it is considered to be in competition with the private sector .
5.2 insufficient Data
Ridership forecasts of airport customers were generally not available for the high occu-pancy public transportation services identified in this study. Up to date air passenger origin destination survey data was also not available for BUR, LAX, ONT and SNA. A 2011 air passenger origin destination survey is currently being conducted at LAX by LAWA, and the data should be available toward the end of 2011.
5.3 Community Resistance
In some instances, the community surrounding an airport may be opposed to new high occupancy public transportation services to the airport, because they are concerned the services will attract more customers to the airport. This seems to be the case at John Wayne Airport.
vi. RECoMMEnDATions To AssisT FuTuRE RTp upDATEs
The review of proposed and potential airport ground access projects and analysis of airport ground access needs undertaken as part of the current update of Airport Ground Access Element of the Regional Transportation Plan has identified a number of areas where additional information or analysis capabilities would be helpful for future updates of the RTP. The following recommendations address future work or studies that SCAG could undertake or encourage airports or other agencies to undertake.
6.1 perform Airport specific Ground Access studies
While the existing regional modeling approach to identifying needed ground access proj-ects or services provides critical information about the impact of vehicle traffic generated by the airports in the region on traffic flows around the airports, it is not always “fine grained” enough to fully identify either the need for or the potential contribution of spe-cific ground access projects at some airports. In particular, for those where major growth is forecast, it is recommended that supplemental ground access studies be performed that provide more detail on the needs around the airports.
While existing environmental studies and airport master plans can provide some of the information needed for the RTP, in many cases they either don’t fully address ground
142 Aviation and Airport Ground Access
access needs at the level of detail needed for the RTP or were performed long enough ago that the information they contain is now out of date. In particular:
� Many airport master plans focus only on needs within the airport property. Typically many of the ground access needs are on the surrounding roadways outside of airport property.
� Environmental impact studies and reports have a lot of detailed information and analysis but focus only on the impacts of the specific project being evaluated, so may not consider all of the transportation needs and issues around the airport. In addition, the horizon of these studies tends to be at the completion of the project, often 5 to 10 years out. This is not sufficient to do long-term ground access planning for the airports.
� General Plans prepared for the surrounding municipalities can also provide valu-able information on identifying ground access needs. However, for most airports, particularly those not operated by the surrounding city, airport ground access is not the focus of the study and analysis of the transportation needs and priorities around the airports is limited.
Therefore, it would greatly aid the process of updating the ground access element of the RTP if detailed ground access studies were prepared for high growth airports such as LAX and ONT.. These studies would include the following:
� Evaluation of all modes of transportation to and from the airports.
� A study area including major roadways into and out of the airport. At a minimum this would include roadways around the airports extending out to major highways/inter-states that feed the airport.
� A horizon year of 20 to 30 years
� Intersection and peak hour specific traffic data collection and analysis.
� Identification of projects needed to facilitate all areas of ground access, including terminal roadways and circulation, parking facilities, entrance gates and facilities, transit and shuttle access, pedestrian linkages between transit and parking facilities and terminal areas, air cargo access, etc.
� Prioritization of project needs.
Because such studies extend beyond the boundaries of the airports, this effort may need to be a combined pursuit of the airport, surrounding communities and other relevant agencies, such as transit providers.
These studies would not be a replacement for the regional planning and analysis that has been done for past airport ground access elements of the RTP. Regional aviation modeling built on robust airport origin-destination data must also continue.
6.2 Develop Region-wide Air passenger survey
There is a critical need to develop and conduct a regionwide air passenger survey to cover users of all commercial service airports in the region on a consistent and compa-rable basis that would provide SCAG and the airports with information on the area from which their passenger traffic originates.. This is something that the airports may be will-ing to contribute toward, if they could add questions of interest to them (perhaps on an airport-specific basis). Where airports are planning to perform their own surveys anyway (as LAWA does from time to time at LAX), SCAG could work with those airports to make sure that questions of interest to SCAG are included and get asked in a way that allows the results to be compared with data from other airports.
6.3 perform a Region-wide study of Airport Employee Trips
Analysis of airport employee trips is generally included as part of airport master planning studies and airport ground access planning studies, although the level of detail of those studies varies widely and the results from different airports are difficult to compare due to differences in the timing of the studies. The volume, timing, and mode use of airport employee trips are usually of great interest to the airports and local transportation agen-cies to determine the impact of employee trips on local streets in the airport environs. Aside from their use for the airport ground access planning, SCAG needs to better understand airport employee travel in order to address this in the regional transportation model. In order to integrate the available data from individual airports and provide a basis for projecting future airport employee travel resulting from projected future changes in airport activity, it would be helpful for SCAG to undertake a region-wide study of airport employee trips.
Aviation and Airport Group Access 143
6.4 Develop new Regional Airport Ground Access Model
There is a need for the development of an airport ground access modeling capability that can be integrated with SCAG’s regional transportation model. While the regional aviation demand allocation model used in previous RTP updates models airport ground access trips, exactly how it does so is unclear and anyway SCAG does not have access to the model unless it retains the model developers to run the model for it. Therefore SCAG needs to develop its own in-house modeling capability. Exactly what this modeling capa-bility would involve needs further thought, as does the level of resolution that would be practical. For example, a model that can produce peak-period volume/capacity ratios at the intersection level will require a very different level of data and model resolution than one that simply estimates mode splits on an average day basis.
6.5 Analysis of potential for Airport Express Bus services
The airport ground access project list for the current update of the RTP has identified a number of potential airport express bus services which could benefit from a more detailed analysis of likely ridership, financial feasibility and implementation issues. One such analysis would examine the potential for non-stop airport express buses to serve ONT air passengers, including service between ONT and 1) a station on the Metro Goldline Foothill Extension, 2) a location along the I-10 at least 15 miles east of the airport, 3) a location along the I-10 at least 15 miles west of the airport, and 4) the Anaheim Regional Transportation Intermodal Center (ARTIC). A second study would analyze the potential for a non-stop airport express bus service between ARTIC and LAX. Alternatives for consideration would include exploring how the existing privately operated express bus service between LAX and Anaheim, which primarily serves non-resident air travelers, could be enhanced to serve resident air passengers. A third study would undertake a market analysis of the potential for high occupancy public transportation options to serve SNA customers, including the exploration of bus links between SNA and 1) the Irvine Transportation Center or Tustin Metrolink Station to serve as a connection between Metrolink service, Amtrak service and the airport, and 2) a bus service between SNA and ARTIC. The foregoing studies will require origin destination air passenger survey data for ONT and SNA, or a comprehensive survey of air passenger travel patterns in the region.
6.6 Airport Choice Analysis
There is a need to better understand how passengers in Southern California make airport choices and how these choices might change with capacity constraints at the smaller airports or availability of additional high occupancy public transportation services for the airport user. Furthermore, to understand the relationship and overlap between the market areas of the commercial airports serving Southern California, ideally comparable survey data for air passengers with trip origins or destinations in the region would be collected for all of the airports during the same time frame. SCAG would be the most appropriate agency for sponsoring a study of air passenger airport choice behavior, since each airport operator is generally only concerned with the characteristics and travel patterns of its own customers.
6.7 Analysis of Funding opportunities and Constraints
There is a need for further study of the funding constraints and regulatory barriers that limit the provision of high occupancy public transportation services designed to accom-modate the airport customer, and how these constraints can be overcome in the Southern California region through different sponsorship models, such as public-private partner-ships, partnerships among public agencies, or a regional body.
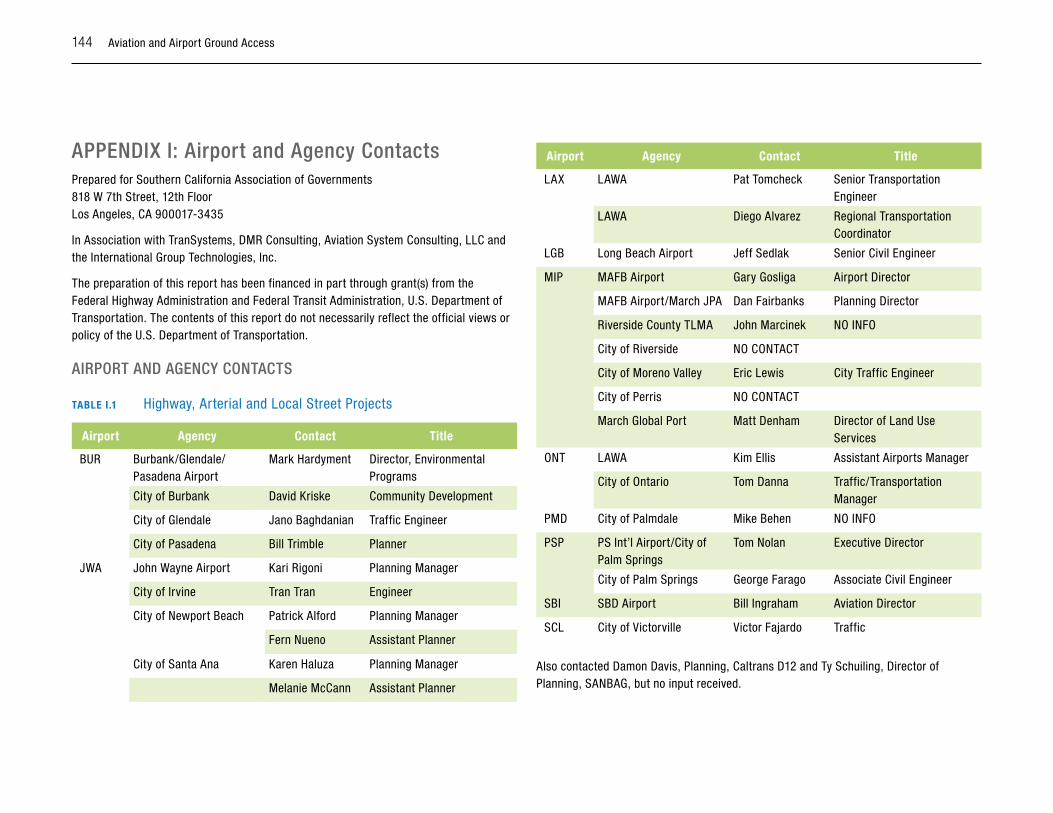
144 Aviation and Airport Ground Access
AppEnDiX i: Airport and Agency ContactsPrepared for Southern California Association of Governments 818 W 7th Street, 12th Floor Los Angeles, CA 900017-3435
In Association with TranSystems, DMR Consulting, Aviation System Consulting, LLC and the International Group Technologies, Inc.
The preparation of this report has been financed in part through grant(s) from the Federal Highway Administration and Federal Transit Administration, U.S. Department of Transportation. The contents of this report do not necessarily reflect the official views or policy of the U.S. Department of Transportation.
AiRpoRT AnD AGEnCy ConTACTs
TABlE I.1 Highway, Arterial and Local Street Projects
Airport Agency Contact Title
BUR Burbank/Glendale/Pasadena Airport
Mark Hardyment Director, Environmental Programs
City of Burbank David Kriske Community Development
City of Glendale Jano Baghdanian Traffic Engineer
City of Pasadena Bill Trimble Planner
JWA John Wayne Airport Kari Rigoni Planning Manager
City of Irvine Tran Tran Engineer
City of Newport Beach Patrick Alford Planning Manager
Fern Nueno Assistant Planner
City of Santa Ana Karen Haluza Planning Manager
Melanie McCann Assistant Planner
Airport Agency Contact Title
LAX LAWA Pat Tomcheck Senior Transportation Engineer
LAWA Diego Alvarez Regional Transportation Coordinator
LGB Long Beach Airport Jeff Sedlak Senior Civil Engineer
MIP MAFB Airport Gary Gosliga Airport Director
MAFB Airport/March JPA Dan Fairbanks Planning Director
Riverside County TLMA John Marcinek NO INFO
City of Riverside NO CONTACT
City of Moreno Valley Eric Lewis City Traffic Engineer
City of Perris NO CONTACT
March Global Port Matt Denham Director of Land Use Services
ONT LAWA Kim Ellis Assistant Airports Manager
City of Ontario Tom Danna Traffic/Transportation Manager
PMD City of Palmdale Mike Behen NO INFO
PSP PS Int’l Airport/City of Palm Springs
Tom Nolan Executive Director
City of Palm Springs George Farago Associate Civil Engineer
SBI SBD Airport Bill Ingraham Aviation Director
SCL City of Victorville Victor Fajardo Traffic
Also contacted Damon Davis, Planning, Caltrans D12 and Ty Schuiling, Director of Planning, SANBAG, but no input received.
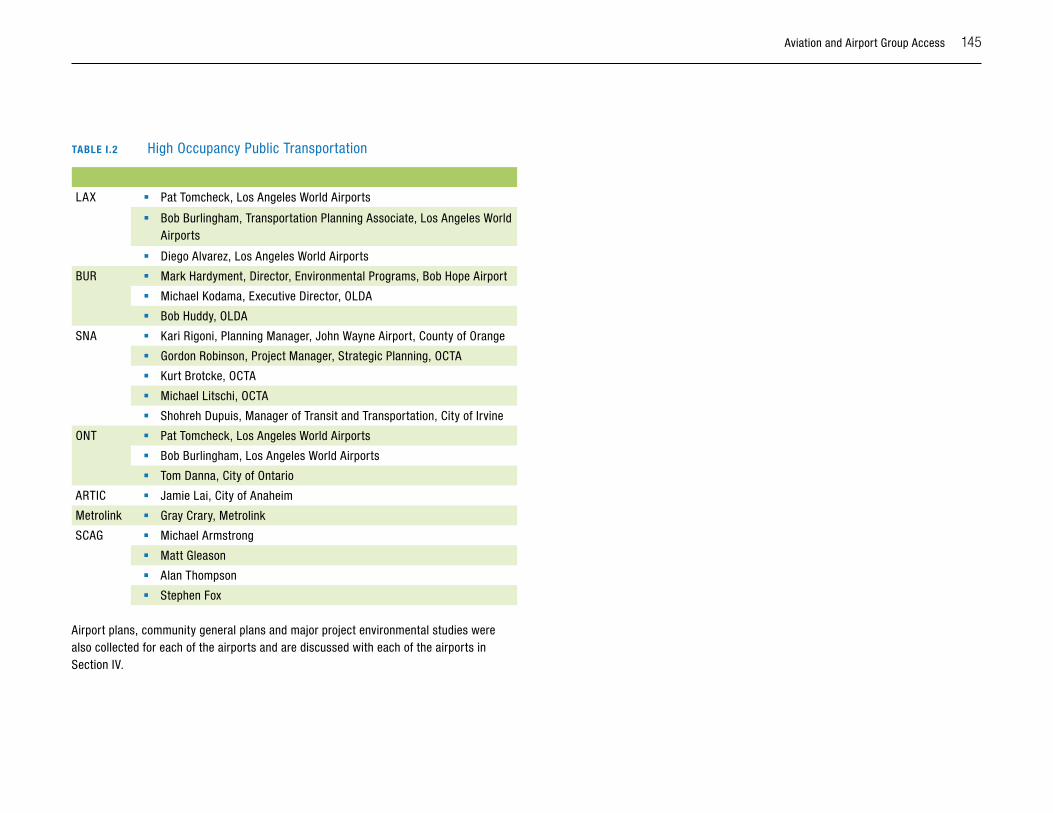
Aviation and Airport Group Access 145
TABlE I.2 High Occupancy Public Transportation
LAX � Pat Tomcheck, Los Angeles World Airports
� Bob Burlingham, Transportation Planning Associate, Los Angeles World Airports
� Diego Alvarez, Los Angeles World Airports
BUR � Mark Hardyment, Director, Environmental Programs, Bob Hope Airport
� Michael Kodama, Executive Director, OLDA
� Bob Huddy, OLDA
SNA � Kari Rigoni, Planning Manager, John Wayne Airport, County of Orange
� Gordon Robinson, Project Manager, Strategic Planning, OCTA
� Kurt Brotcke, OCTA
� Michael Litschi, OCTA
� Shohreh Dupuis, Manager of Transit and Transportation, City of Irvine
ONT � Pat Tomcheck, Los Angeles World Airports
� Bob Burlingham, Los Angeles World Airports
� Tom Danna, City of Ontario
ARTIC � Jamie Lai, City of Anaheim
Metrolink � Gray Crary, Metrolink
SCAG � Michael Armstrong
� Matt Gleason
� Alan Thompson
� Stephen Fox
Airport plans, community general plans and major project environmental studies were also collected for each of the airports and are discussed with each of the airports in Section IV.
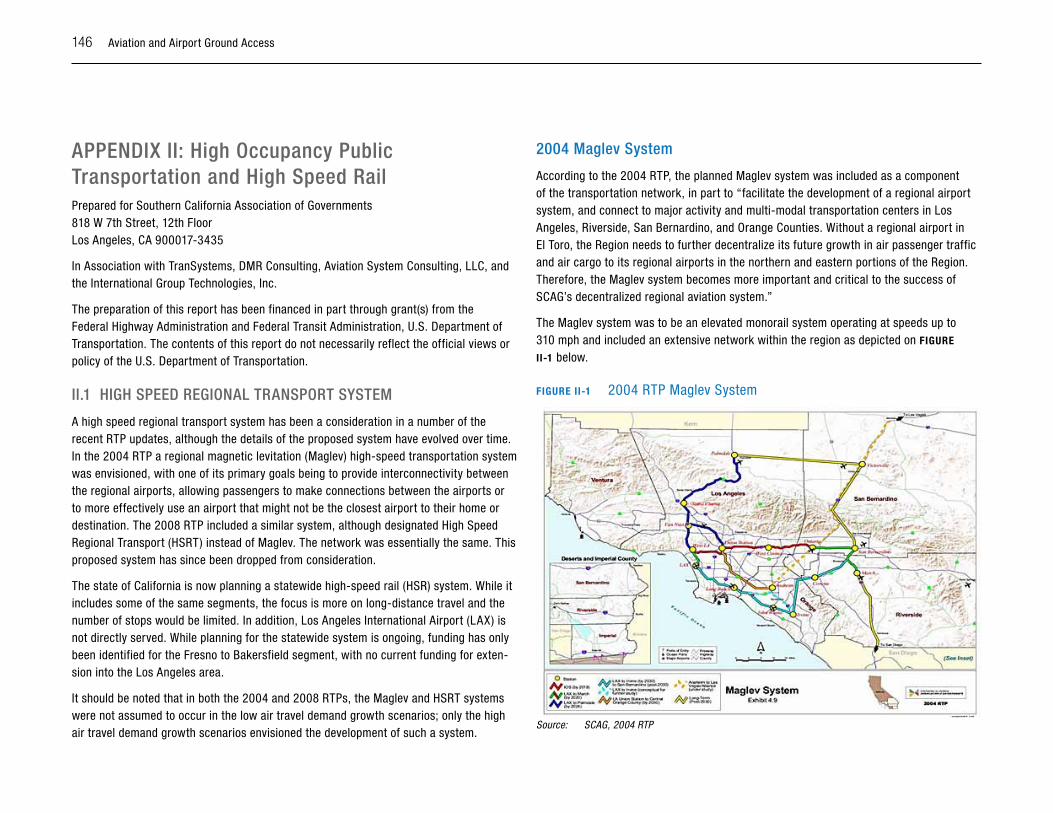
146 Aviation and Airport Ground Access
AppEnDiX ii: high occupancy public Transportation and high speed RailPrepared for Southern California Association of Governments 818 W 7th Street, 12th Floor Los Angeles, CA 900017-3435
In Association with TranSystems, DMR Consulting, Aviation System Consulting, LLC, and the International Group Technologies, Inc.
The preparation of this report has been financed in part through grant(s) from the Federal Highway Administration and Federal Transit Administration, U.S. Department of Transportation. The contents of this report do not necessarily reflect the official views or policy of the U.S. Department of Transportation.
ii.1 hiGh spEED REGionAl TRAnspoRT sysTEM
A high speed regional transport system has been a consideration in a number of the recent RTP updates, although the details of the proposed system have evolved over time. In the 2004 RTP a regional magnetic levitation (Maglev) high-speed transportation system was envisioned, with one of its primary goals being to provide interconnectivity between the regional airports, allowing passengers to make connections between the airports or to more effectively use an airport that might not be the closest airport to their home or destination. The 2008 RTP included a similar system, although designated High Speed Regional Transport (HSRT) instead of Maglev. The network was essentially the same. This proposed system has since been dropped from consideration.
The state of California is now planning a statewide high-speed rail (HSR) system. While it includes some of the same segments, the focus is more on long-distance travel and the number of stops would be limited. In addition, Los Angeles International Airport (LAX) is not directly served. While planning for the statewide system is ongoing, funding has only been identified for the Fresno to Bakersfield segment, with no current funding for exten-sion into the Los Angeles area.
It should be noted that in both the 2004 and 2008 RTPs, the Maglev and HSRT systems were not assumed to occur in the low air travel demand growth scenarios; only the high air travel demand growth scenarios envisioned the development of such a system.
2004 Maglev system
According to the 2004 RTP, the planned Maglev system was included as a component of the transportation network, in part to “facilitate the development of a regional airport system, and connect to major activity and multi-modal transportation centers in Los Angeles, Riverside, San Bernardino, and Orange Counties. Without a regional airport in El Toro, the Region needs to further decentralize its future growth in air passenger traffic and air cargo to its regional airports in the northern and eastern portions of the Region. Therefore, the Maglev system becomes more important and critical to the success of SCAG’s decentralized regional aviation system.”
The Maglev system was to be an elevated monorail system operating at speeds up to 310 mph and included an extensive network within the region as depicted on FIGuRE
II-1 below.
FIGuRE II-1 2004 RTP Maglev System
Source: SCAG, 2004 RTP
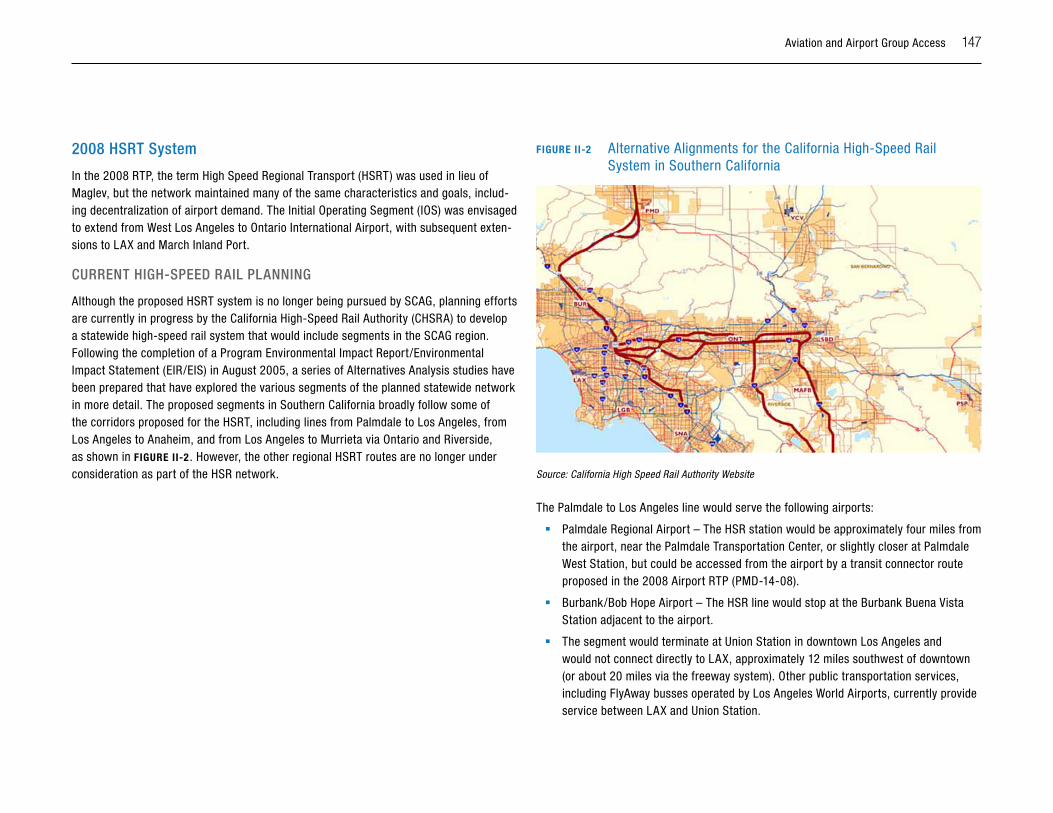
Aviation and Airport Group Access 147
2008 hsRT system
In the 2008 RTP, the term High Speed Regional Transport (HSRT) was used in lieu of Maglev, but the network maintained many of the same characteristics and goals, includ-ing decentralization of airport demand. The Initial Operating Segment (IOS) was envisaged to extend from West Los Angeles to Ontario International Airport, with subsequent exten-sions to LAX and March Inland Port.
CuRREnT hiGh-spEED RAil plAnninG
Although the proposed HSRT system is no longer being pursued by SCAG, planning efforts are currently in progress by the California High-Speed Rail Authority (CHSRA) to develop a statewide high-speed rail system that would include segments in the SCAG region. Following the completion of a Program Environmental Impact Report/Environmental Impact Statement (EIR/EIS) in August 2005, a series of Alternatives Analysis studies have been prepared that have explored the various segments of the planned statewide network in more detail. The proposed segments in Southern California broadly follow some of the corridors proposed for the HSRT, including lines from Palmdale to Los Angeles, from Los Angeles to Anaheim, and from Los Angeles to Murrieta via Ontario and Riverside, as shown in FIGuRE II-2 . However, the other regional HSRT routes are no longer under consideration as part of the HSR network.
FIGuRE II-2 Alternative Alignments for the California High-Speed Rail System in Southern California
Source: California High Speed Rail Authority Website
The Palmdale to Los Angeles line would serve the following airports:
� Palmdale Regional Airport – The HSR station would be approximately four miles from the airport, near the Palmdale Transportation Center, or slightly closer at Palmdale West Station, but could be accessed from the airport by a transit connector route proposed in the 2008 Airport RTP (PMD-14-08).
� Burbank/Bob Hope Airport – The HSR line would stop at the Burbank Buena Vista Station adjacent to the airport.
� The segment would terminate at Union Station in downtown Los Angeles and would not connect directly to LAX, approximately 12 miles southwest of downtown (or about 20 miles via the freeway system). Other public transportation services, including FlyAway busses operated by Los Angeles World Airports, currently provide service between LAX and Union Station.
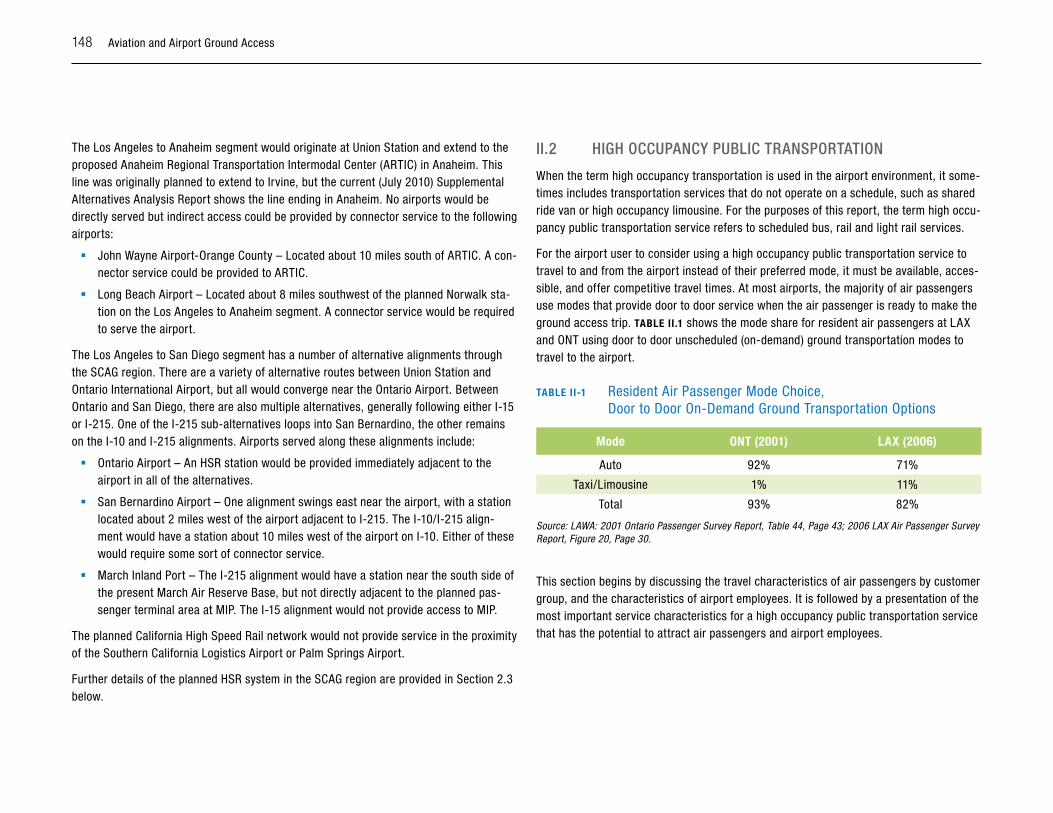
148 Aviation and Airport Ground Access
The Los Angeles to Anaheim segment would originate at Union Station and extend to the proposed Anaheim Regional Transportation Intermodal Center (ARTIC) in Anaheim. This line was originally planned to extend to Irvine, but the current (July 2010) Supplemental Alternatives Analysis Report shows the line ending in Anaheim. No airports would be directly served but indirect access could be provided by connector service to the following airports:
� John Wayne Airport-Orange County – Located about 10 miles south of ARTIC. A con-nector service could be provided to ARTIC.
� Long Beach Airport – Located about 8 miles southwest of the planned Norwalk sta-tion on the Los Angeles to Anaheim segment. A connector service would be required to serve the airport.
The Los Angeles to San Diego segment has a number of alternative alignments through the SCAG region. There are a variety of alternative routes between Union Station and Ontario International Airport, but all would converge near the Ontario Airport. Between Ontario and San Diego, there are also multiple alternatives, generally following either I-15 or I-215. One of the I-215 sub-alternatives loops into San Bernardino, the other remains on the I-10 and I-215 alignments. Airports served along these alignments include:
� Ontario Airport – An HSR station would be provided immediately adjacent to the airport in all of the alternatives.
� San Bernardino Airport – One alignment swings east near the airport, with a station located about 2 miles west of the airport adjacent to I-215. The I-10/I-215 align-ment would have a station about 10 miles west of the airport on I-10. Either of these would require some sort of connector service.
� March Inland Port – The I-215 alignment would have a station near the south side of the present March Air Reserve Base, but not directly adjacent to the planned pas-senger terminal area at MIP. The I-15 alignment would not provide access to MIP.
The planned California High Speed Rail network would not provide service in the proximity of the Southern California Logistics Airport or Palm Springs Airport.
Further details of the planned HSR system in the SCAG region are provided in Section 2.3 below.
ii.2 hiGh oCCupAnCy puBliC TRAnspoRTATion
When the term high occupancy transportation is used in the airport environment, it some-times includes transportation services that do not operate on a schedule, such as shared ride van or high occupancy limousine. For the purposes of this report, the term high occu-pancy public transportation service refers to scheduled bus, rail and light rail services.
For the airport user to consider using a high occupancy public transportation service to travel to and from the airport instead of their preferred mode, it must be available, acces-sible, and offer competitive travel times. At most airports, the majority of air passengers use modes that provide door to door service when the air passenger is ready to make the ground access trip. TABlE II.1 shows the mode share for resident air passengers at LAX and ONT using door to door unscheduled (on-demand) ground transportation modes to travel to the airport.
TABlE II-1 Resident Air Passenger Mode Choice, Door to Door On-Demand Ground Transportation Options
Mode ONT (2001) lAX (2006)
Auto 92% 71%
Taxi/Limousine 1% 11%
Total 93% 82%
Source: LAWA: 2001 Ontario Passenger Survey Report, Table 44, Page 43; 2006 LAX Air Passenger Survey Report, Figure 20, Page 30.
This section begins by discussing the travel characteristics of air passengers by customer group, and the characteristics of airport employees. It is followed by a presentation of the most important service characteristics for a high occupancy public transportation service that has the potential to attract air passengers and airport employees.
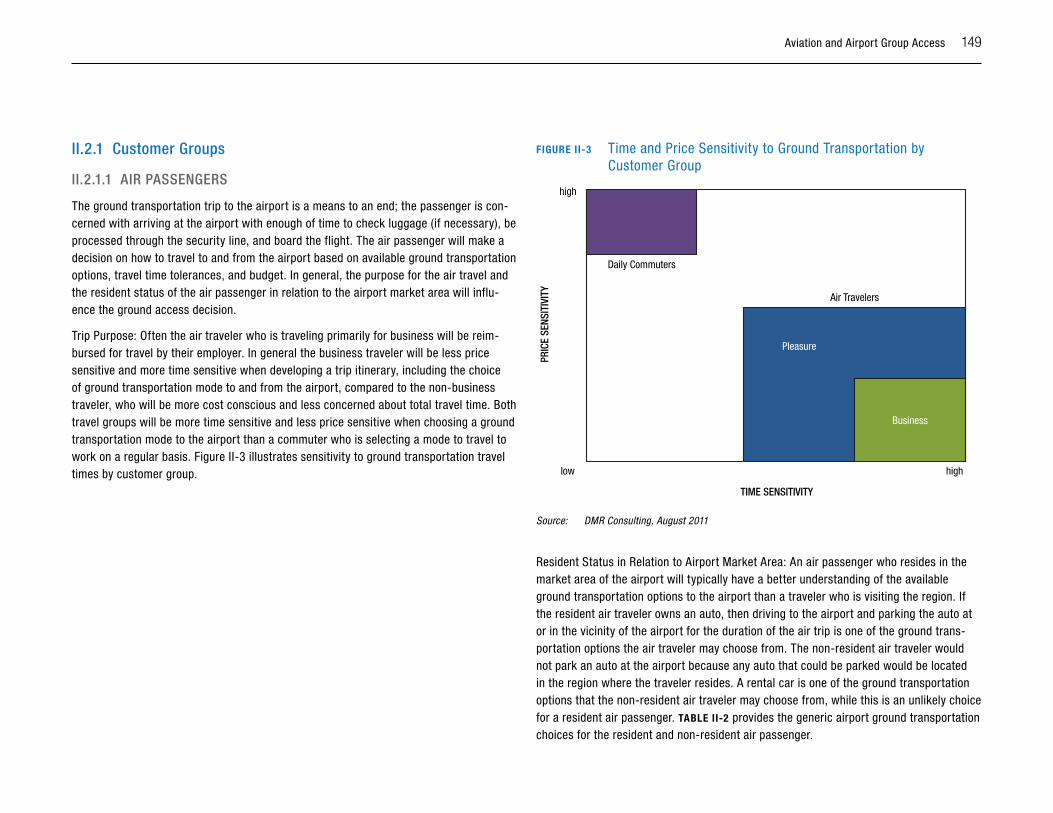
Aviation and Airport Group Access 149
ii.2.1 Customer Groups
ii.2.1.1 AiR pAssEnGERs
The ground transportation trip to the airport is a means to an end; the passenger is con-cerned with arriving at the airport with enough of time to check luggage (if necessary), be processed through the security line, and board the flight. The air passenger will make a decision on how to travel to and from the airport based on available ground transportation options, travel time tolerances, and budget. In general, the purpose for the air travel and the resident status of the air passenger in relation to the airport market area will influ-ence the ground access decision.
Trip Purpose: Often the air traveler who is traveling primarily for business will be reim-bursed for travel by their employer. In general the business traveler will be less price sensitive and more time sensitive when developing a trip itinerary, including the choice of ground transportation mode to and from the airport, compared to the non-business traveler, who will be more cost conscious and less concerned about total travel time. Both travel groups will be more time sensitive and less price sensitive when choosing a ground transportation mode to the airport than a commuter who is selecting a mode to travel to work on a regular basis. Figure II-3 illustrates sensitivity to ground transportation travel times by customer group.
FIGuRE II-3 Time and Price Sensitivity to Ground Transportation by Customer Group
PRIC
E SE
NSIT
IVIT
Y
TIME SENSITIVITY
high
Air Travelers
Pleasure
Business
Daily Commuters
low high
Source: DMR Consulting, August 2011
Resident Status in Relation to Airport Market Area: An air passenger who resides in the market area of the airport will typically have a better understanding of the available ground transportation options to the airport than a traveler who is visiting the region. If the resident air traveler owns an auto, then driving to the airport and parking the auto at or in the vicinity of the airport for the duration of the air trip is one of the ground trans-portation options the air traveler may choose from. The non-resident air traveler would not park an auto at the airport because any auto that could be parked would be located in the region where the traveler resides. A rental car is one of the ground transportation options that the non-resident air traveler may choose from, while this is an unlikely choice for a resident air passenger. TABlE II-2 provides the generic airport ground transportation choices for the resident and non-resident air passenger.
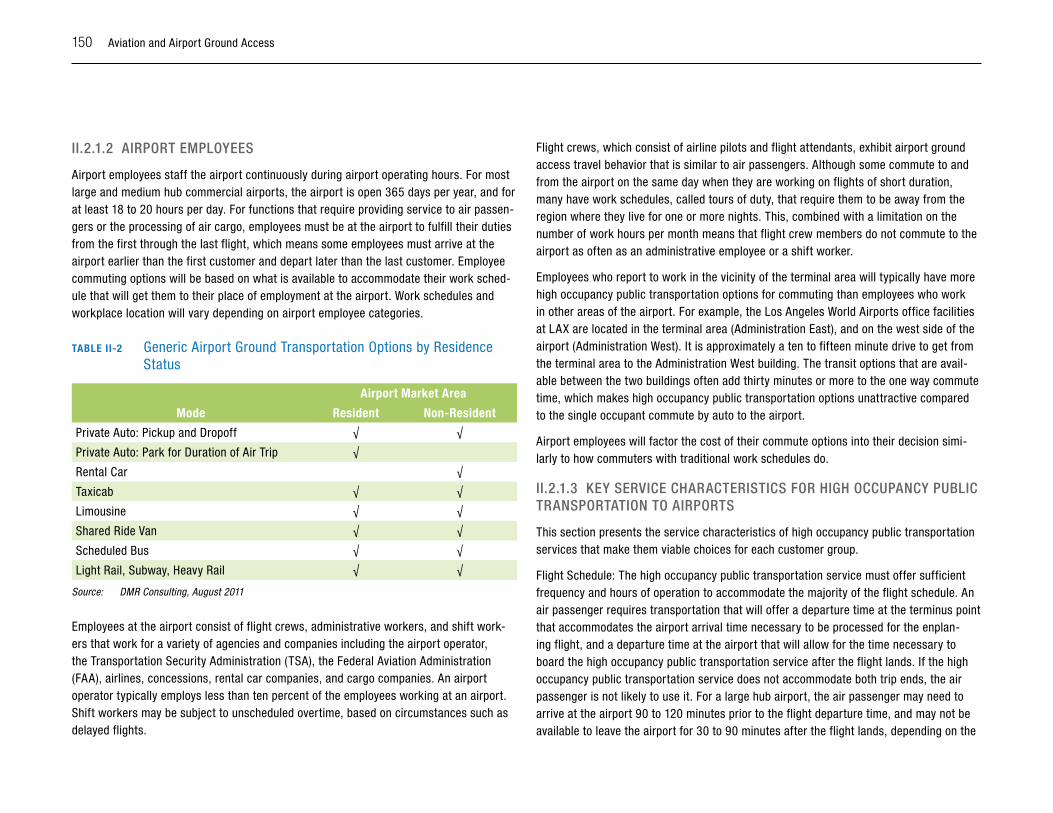
150 Aviation and Airport Ground Access
ii.2.1.2 AiRpoRT EMployEEs
Airport employees staff the airport continuously during airport operating hours. For most large and medium hub commercial airports, the airport is open 365 days per year, and for at least 18 to 20 hours per day. For functions that require providing service to air passen-gers or the processing of air cargo, employees must be at the airport to fulfill their duties from the first through the last flight, which means some employees must arrive at the airport earlier than the first customer and depart later than the last customer. Employee commuting options will be based on what is available to accommodate their work sched-ule that will get them to their place of employment at the airport. Work schedules and workplace location will vary depending on airport employee categories.
TABlE II-2 Generic Airport Ground Transportation Options by Residence Status
Airport Market Area
Mode Resident Non-Resident
Private Auto: Pickup and Dropoff √ √
Private Auto: Park for Duration of Air Trip √
Rental Car √
Taxicab √ √
Limousine √ √
Shared Ride Van √ √
Scheduled Bus √ √
Light Rail, Subway, Heavy Rail √ √
Source: DMR Consulting, August 2011
Employees at the airport consist of flight crews, administrative workers, and shift work-ers that work for a variety of agencies and companies including the airport operator, the Transportation Security Administration (TSA), the Federal Aviation Administration (FAA), airlines, concessions, rental car companies, and cargo companies. An airport operator typically employs less than ten percent of the employees working at an airport. Shift workers may be subject to unscheduled overtime, based on circumstances such as delayed flights.
Flight crews, which consist of airline pilots and flight attendants, exhibit airport ground access travel behavior that is similar to air passengers. Although some commute to and from the airport on the same day when they are working on flights of short duration, many have work schedules, called tours of duty, that require them to be away from the region where they live for one or more nights. This, combined with a limitation on the number of work hours per month means that flight crew members do not commute to the airport as often as an administrative employee or a shift worker.
Employees who report to work in the vicinity of the terminal area will typically have more high occupancy public transportation options for commuting than employees who work in other areas of the airport. For example, the Los Angeles World Airports office facilities at LAX are located in the terminal area (Administration East), and on the west side of the airport (Administration West). It is approximately a ten to fifteen minute drive to get from the terminal area to the Administration West building. The transit options that are avail-able between the two buildings often add thirty minutes or more to the one way commute time, which makes high occupancy public transportation options unattractive compared to the single occupant commute by auto to the airport.
Airport employees will factor the cost of their commute options into their decision simi-larly to how commuters with traditional work schedules do.
ii.2.1.3 KEy sERviCE ChARACTERisTiCs FoR hiGh oCCupAnCy puBliC TRAnspoRTATion To AiRpoRTs
This section presents the service characteristics of high occupancy public transportation services that make them viable choices for each customer group.
Flight Schedule: The high occupancy public transportation service must offer sufficient frequency and hours of operation to accommodate the majority of the flight schedule. An air passenger requires transportation that will offer a departure time at the terminus point that accommodates the airport arrival time necessary to be processed for the enplan-ing flight, and a departure time at the airport that will allow for the time necessary to board the high occupancy public transportation service after the flight lands. If the high occupancy public transportation service does not accommodate both trip ends, the air passenger is not likely to use it. For a large hub airport, the air passenger may need to arrive at the airport 90 to 120 minutes prior to the flight departure time, and may not be available to leave the airport for 30 to 90 minutes after the flight lands, depending on the
Aviation and Airport Group Access 151
level of activity in the terminal, if the passenger has checked luggage, and whether the flight is domestic or international.
In general, a service that will be attractive to airport users will operate seven days per week, and offer early morning and late evening service, with frequencies that consider the time sensitivity of both air passengers and airport employees. Some airport employ-ees must be at the airport earlier than the first group of departing air passengers and later than the last group of arriving air passengers, and this must be considered if the high occupancy public transportation service is also meant to accommodate airport employees.
An example of a high occupancy public transportation service that does not accommo-date the flight schedule is the Metrolink Riverside line that operates between downtown Los Angeles and Riverside. For a passenger that needs to travel between Riverside and Ontario International Airport, the service only operates between Riverside and East Ontario from Monday through Friday, and offers five trips departing Riverside between 4:42 a.m. and 8:15 a.m., and a sixth and final trip at 3:07 p.m. Even if a shuttle service was provided between the East Ontario Metrolink Station and the airline terminals at Ontario International Airport, the rail service on the Riverside Metrolink Line does not accommodate the flight schedule.
An example of a high occupancy public transportation service that does accommodate the flight schedule, and has been very successful in serving both air passengers and airport employees is the Union Station FlyAway that travels non-stop between Union Station in downtown Los Angeles and all of the terminals at LAX. It operates 365 days per year and 24 hours per day. It offers hourly service from 1 a.m. to 5 a.m. and half hourly service for the rest of the 24 hour period.
Competitive Travel Times: The high occupancy public transportation service must offer competitive travel times compared to the more commonly used modes, when considering the departure time from the point of origin and the arrival time at the airport. Service fre-quency, number of transfers and number of stops along the route all impact total ground access travel time. The travel route taken by the public transportation service will also impact travel time. A service traveling along a fixed guideway or a high occupancy vehicle lane will generally be quicker, or be perceived to be quicker, than a service that is sharing the road with the more commonly used modes.
An example of a high occupancy public transportation service that does not offer com-petitive travel times compared to commonly used modes is Metrorail service between Union Station in downtown Los Angeles and LAX. It requires two transfers between light rail lines and a transfer to a shuttle bus for a total of three transfers, and also makes multiple stops along the route.
An example of a high occupancy public transportation service that offers competitive travel times compared to more commonly used modes is the Union Station FlyAway that travels non-stop between Union Station in downtown Los Angeles and all of the terminals at LAX, with 24 hour service, at hourly intervals from 1 a.m. to 5 a.m. and half hourly intervals for the rest of the 24 hour period.
Location of Boarding Point: The location of the boarding point for the high occupancy public transportation service should be along a traditional travel route to the airport. Air Passengers in the market area of the high occupancy public transportation service are more likely to use their preferred mode to the airport along the travel route they are accustomed to taking, rather than divert to a different route or travel away from the airport (backtrack) along their traditional route if it adds more than a few minutes to their travel time.
Figure II-4 shows a map of the primary air passenger market area for the Van Nuys FlyAway serving LAX. This is the geographic area from which the majority of LAX air passengers using the Van Nuys FlyAway begin or end their ground access trip. A small proportion of Van Nuys FlyAway passengers originate in areas that require them to travel in the opposite direction from LAX to begin the FlyAway trip.
Airport employees may be willing to backtrack a little farther than air passengers if there are other reasons for doing so such as reduced fares on the high occupancy public trans-portation service that are attractive compared to the price of fuel and parking, or being dropped off and picked up closer to the place of employment compared to the location of the employee parking supply at the airport.
Access to Boarding Point: Air passengers and airport employees must be able to get to and from the boarding point of the high occupancy public transportation service to utilize it. A sufficient supply of overnight parking should be provided for air passengers that wish to park their auto for the duration of their trip, with parking rates that are perceived to be attractive compared to parking rates in the vicinity of the airport. Airport employee
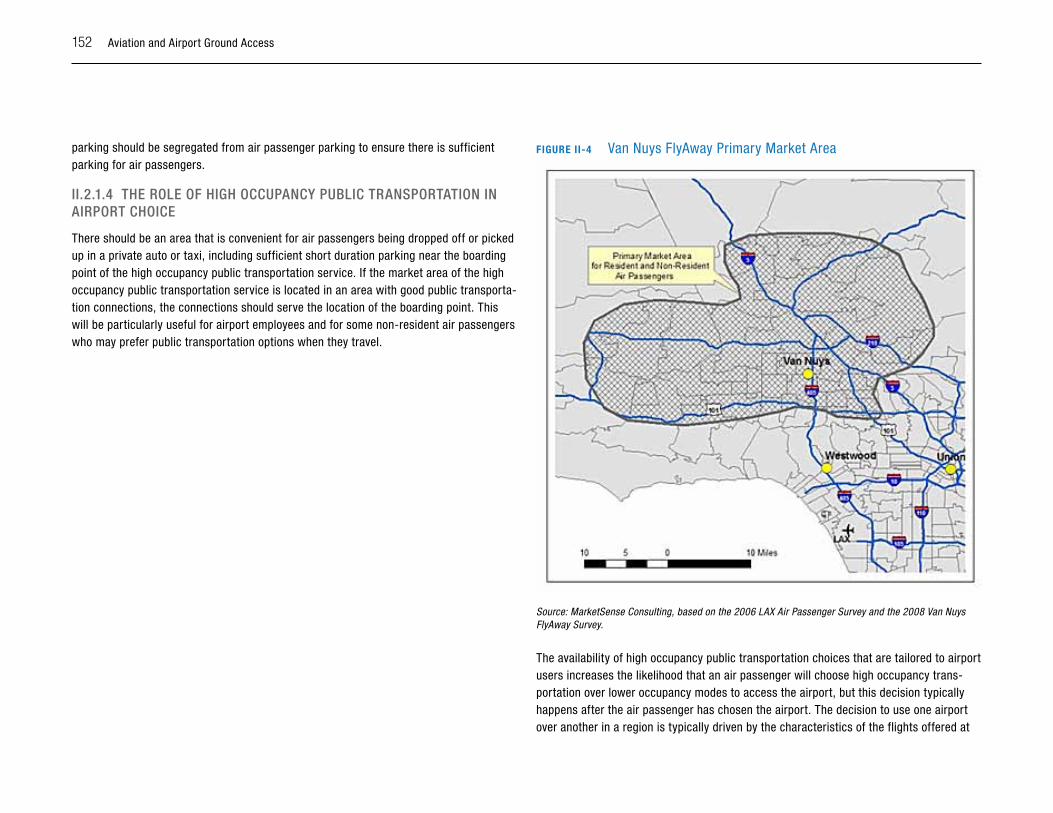
152 Aviation and Airport Ground Access
parking should be segregated from air passenger parking to ensure there is sufficient parking for air passengers.
ii.2.1.4 ThE RolE oF hiGh oCCupAnCy puBliC TRAnspoRTATion in AiRpoRT ChoiCE
There should be an area that is convenient for air passengers being dropped off or picked up in a private auto or taxi, including sufficient short duration parking near the boarding point of the high occupancy public transportation service. If the market area of the high occupancy public transportation service is located in an area with good public transporta-tion connections, the connections should serve the location of the boarding point. This will be particularly useful for airport employees and for some non-resident air passengers who may prefer public transportation options when they travel.
FIGuRE II-4 Van Nuys FlyAway Primary Market Area
Source: MarketSense Consulting, based on the 2006 LAX Air Passenger Survey and the 2008 Van Nuys FlyAway Survey.
The availability of high occupancy public transportation choices that are tailored to airport users increases the likelihood that an air passenger will choose high occupancy trans-portation over lower occupancy modes to access the airport, but this decision typically happens after the air passenger has chosen the airport. The decision to use one airport over another in a region is typically driven by the characteristics of the flights offered at
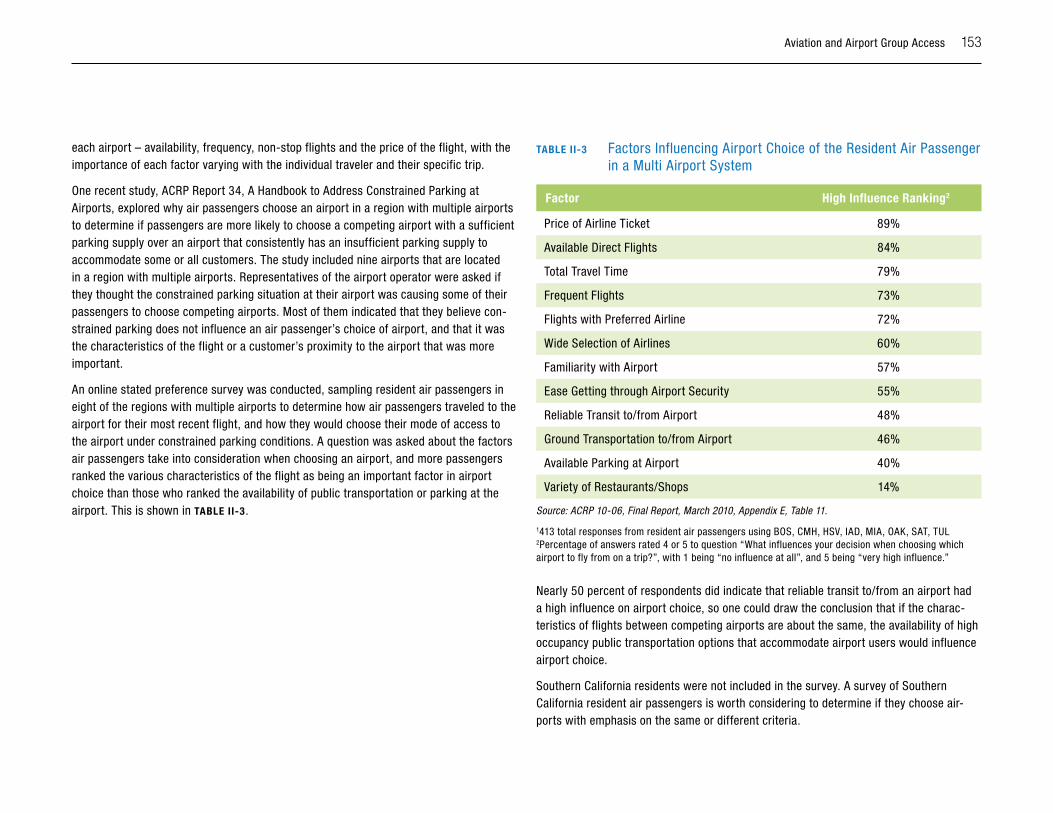
Aviation and Airport Group Access 153
each airport – availability, frequency, non-stop flights and the price of the flight, with the importance of each factor varying with the individual traveler and their specific trip.
One recent study, ACRP Report 34, A Handbook to Address Constrained Parking at Airports, explored why air passengers choose an airport in a region with multiple airports to determine if passengers are more likely to choose a competing airport with a sufficient parking supply over an airport that consistently has an insufficient parking supply to accommodate some or all customers. The study included nine airports that are located in a region with multiple airports. Representatives of the airport operator were asked if they thought the constrained parking situation at their airport was causing some of their passengers to choose competing airports. Most of them indicated that they believe con-strained parking does not influence an air passenger’s choice of airport, and that it was the characteristics of the flight or a customer’s proximity to the airport that was more important.
An online stated preference survey was conducted, sampling resident air passengers in eight of the regions with multiple airports to determine how air passengers traveled to the airport for their most recent flight, and how they would choose their mode of access to the airport under constrained parking conditions. A question was asked about the factors air passengers take into consideration when choosing an airport, and more passengers ranked the various characteristics of the flight as being an important factor in airport choice than those who ranked the availability of public transportation or parking at the airport. This is shown in TABlE II-3.
TABlE II-3 Factors Influencing Airport Choice of the Resident Air Passenger in a Multi Airport System
Factor High Influence Ranking2
Price of Airline Ticket 89%
Available Direct Flights 84%
Total Travel Time 79%
Frequent Flights 73%
Flights with Preferred Airline 72%
Wide Selection of Airlines 60%
Familiarity with Airport 57%
Ease Getting through Airport Security 55%
Reliable Transit to/from Airport 48%
Ground Transportation to/from Airport 46%
Available Parking at Airport 40%
Variety of Restaurants/Shops 14%
Source: ACRP 10-06, Final Report, March 2010, Appendix E, Table 11.
1413 total responses from resident air passengers using BOS, CMH, HSV, IAD, MIA, OAK, SAT, TUL 2Percentage of answers rated 4 or 5 to question “What influences your decision when choosing which airport to fly from on a trip?”, with 1 being “no influence at all”, and 5 being “very high influence.”
Nearly 50 percent of respondents did indicate that reliable transit to/from an airport had a high influence on airport choice, so one could draw the conclusion that if the charac-teristics of flights between competing airports are about the same, the availability of high occupancy public transportation options that accommodate airport users would influence airport choice.
Southern California residents were not included in the survey. A survey of Southern California resident air passengers is worth considering to determine if they choose air-ports with emphasis on the same or different criteria.
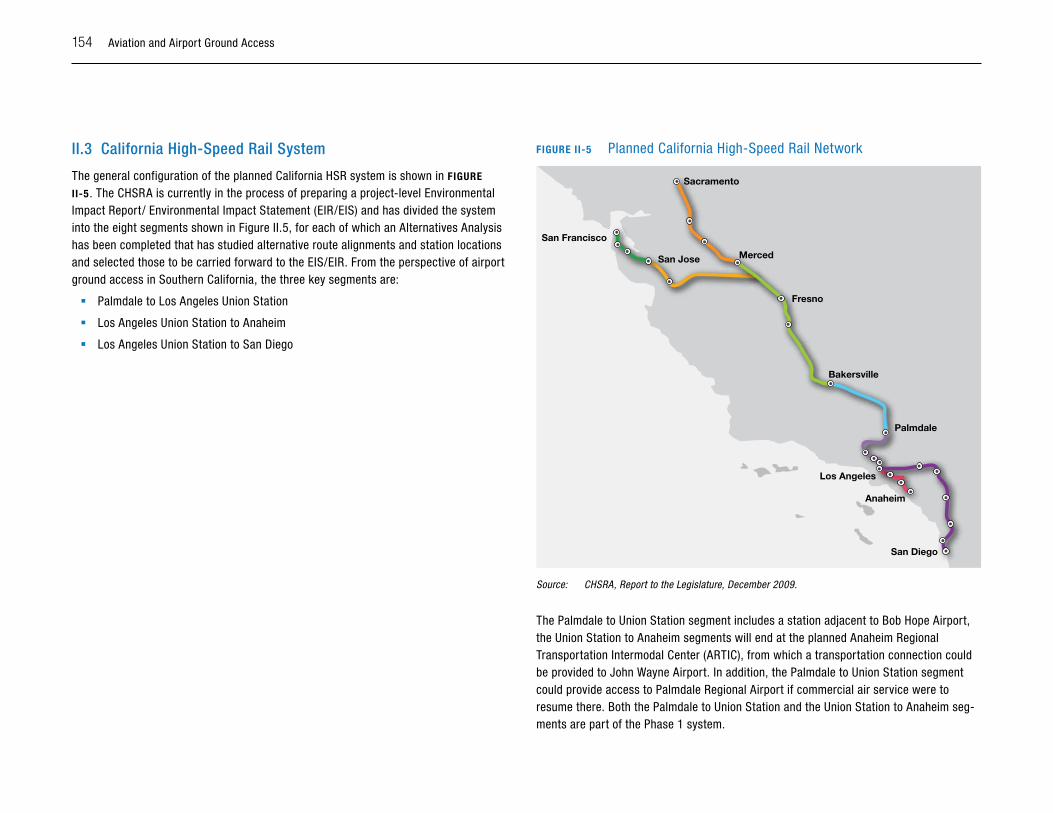
154 Aviation and Airport Ground Access
ii.3 California high-speed Rail system
The general configuration of the planned California HSR system is shown in FIGuRE
II-5. The CHSRA is currently in the process of preparing a project-level Environmental Impact Report/ Environmental Impact Statement (EIR/EIS) and has divided the system into the eight segments shown in Figure II.5, for each of which an Alternatives Analysis has been completed that has studied alternative route alignments and station locations and selected those to be carried forward to the EIS/EIR. From the perspective of airport ground access in Southern California, the three key segments are:
� Palmdale to Los Angeles Union Station
� Los Angeles Union Station to Anaheim
� Los Angeles Union Station to San Diego
FIGuRE II-5 Planned California High-Speed Rail Network
Sacramento
Merced
Fresno
Bakersville
Palmdale
Los Angeles
San Diego
Anaheim
San Jose
San Francisco
Source: CHSRA, Report to the Legislature, December 2009.
The Palmdale to Union Station segment includes a station adjacent to Bob Hope Airport, the Union Station to Anaheim segments will end at the planned Anaheim Regional Transportation Intermodal Center (ARTIC), from which a transportation connection could be provided to John Wayne Airport. In addition, the Palmdale to Union Station segment could provide access to Palmdale Regional Airport if commercial air service were to resume there. Both the Palmdale to Union Station and the Union Station to Anaheim seg-ments are part of the Phase 1 system.
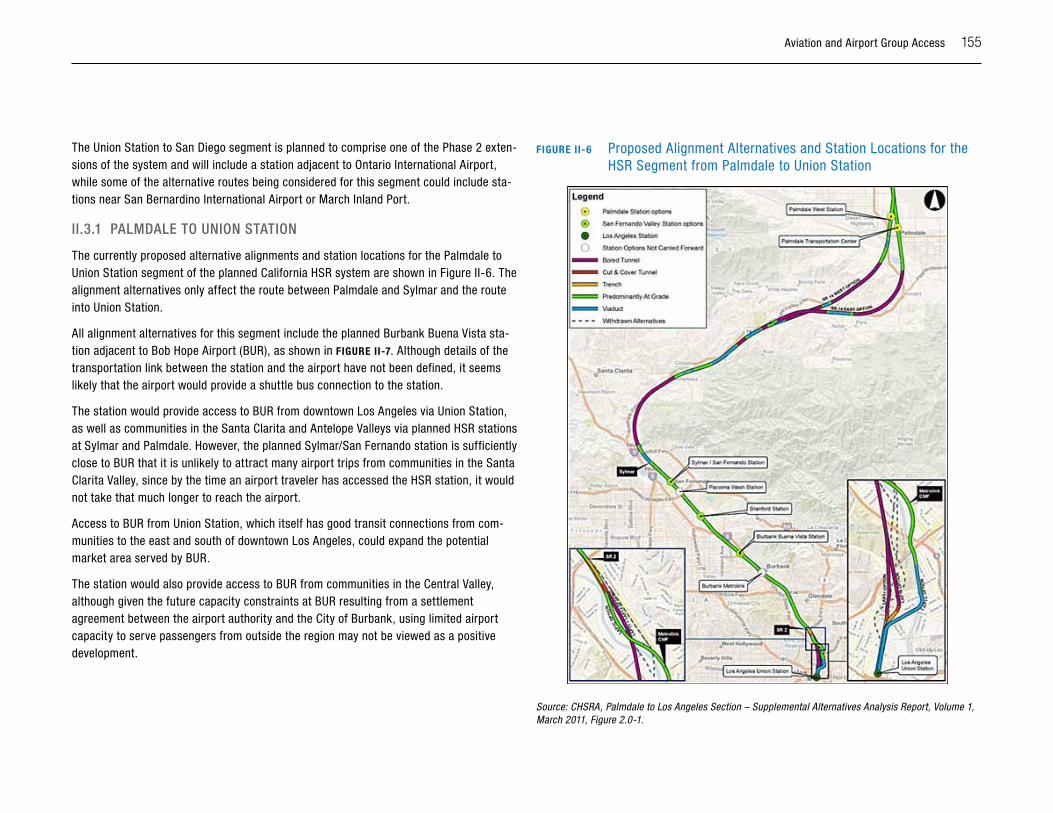
Aviation and Airport Group Access 155
The Union Station to San Diego segment is planned to comprise one of the Phase 2 exten-sions of the system and will include a station adjacent to Ontario International Airport, while some of the alternative routes being considered for this segment could include sta-tions near San Bernardino International Airport or March Inland Port.
ii.3.1 pAlMDAlE To union sTATion
The currently proposed alternative alignments and station locations for the Palmdale to Union Station segment of the planned California HSR system are shown in Figure II-6. The alignment alternatives only affect the route between Palmdale and Sylmar and the route into Union Station.
All alignment alternatives for this segment include the planned Burbank Buena Vista sta-tion adjacent to Bob Hope Airport (BUR), as shown in FIGuRE II-7. Although details of the transportation link between the station and the airport have not been defined, it seems likely that the airport would provide a shuttle bus connection to the station.
The station would provide access to BUR from downtown Los Angeles via Union Station, as well as communities in the Santa Clarita and Antelope Valleys via planned HSR stations at Sylmar and Palmdale. However, the planned Sylmar/San Fernando station is sufficiently close to BUR that it is unlikely to attract many airport trips from communities in the Santa Clarita Valley, since by the time an airport traveler has accessed the HSR station, it would not take that much longer to reach the airport.
Access to BUR from Union Station, which itself has good transit connections from com-munities to the east and south of downtown Los Angeles, could expand the potential market area served by BUR.
The station would also provide access to BUR from communities in the Central Valley, although given the future capacity constraints at BUR resulting from a settlement agreement between the airport authority and the City of Burbank, using limited airport capacity to serve passengers from outside the region may not be viewed as a positive development.
FIGuRE II-6 Proposed Alignment Alternatives and Station Locations for the HSR Segment from Palmdale to Union Station
Source: CHSRA, Palmdale to Los Angeles Section – Supplemental Alternatives Analysis Report, Volume 1, March 2011, Figure 2.0-1.
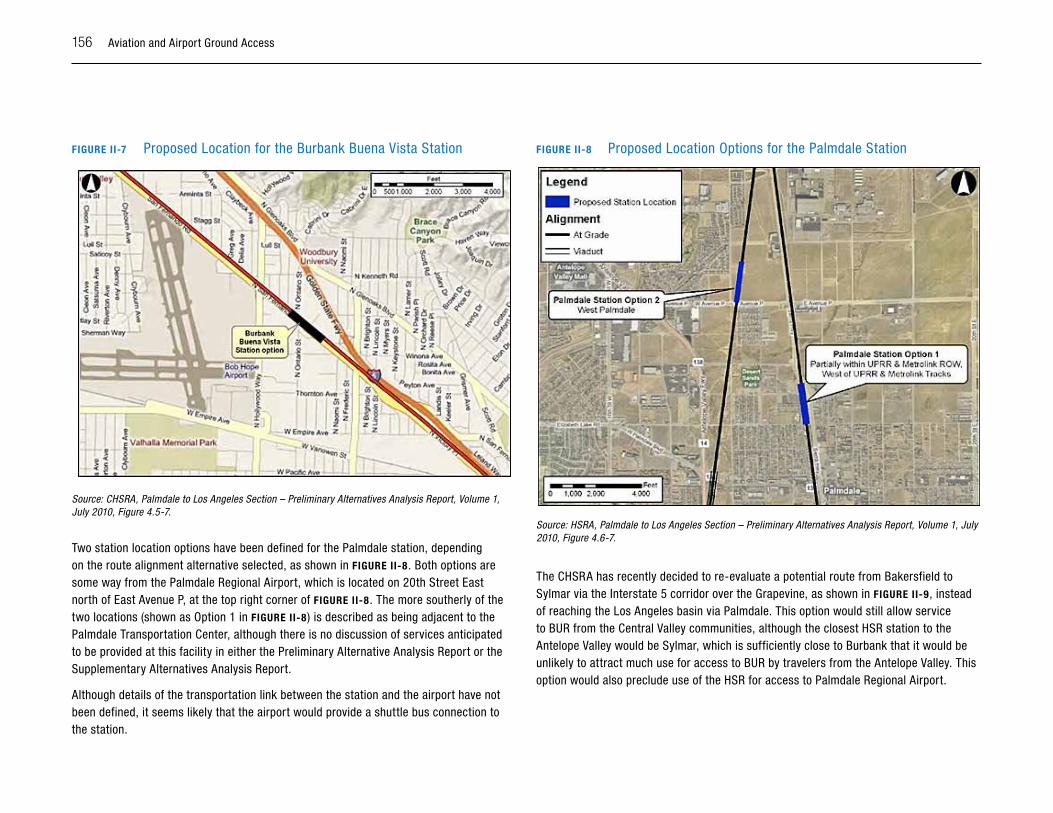
156 Aviation and Airport Ground Access
FIGuRE II-7 Proposed Location for the Burbank Buena Vista Station
Source: CHSRA, Palmdale to Los Angeles Section – Preliminary Alternatives Analysis Report, Volume 1, July 2010, Figure 4.5-7.
Two station location options have been defined for the Palmdale station, depending on the route alignment alternative selected, as shown in FIGuRE II-8. Both options are some way from the Palmdale Regional Airport, which is located on 20th Street East north of East Avenue P, at the top right corner of FIGuRE II-8. The more southerly of the two locations (shown as Option 1 in FIGuRE II-8) is described as being adjacent to the Palmdale Transportation Center, although there is no discussion of services anticipated to be provided at this facility in either the Preliminary Alternative Analysis Report or the Supplementary Alternatives Analysis Report.
Although details of the transportation link between the station and the airport have not been defined, it seems likely that the airport would provide a shuttle bus connection to the station.
FIGuRE II-8 Proposed Location Options for the Palmdale Station
Source: HSRA, Palmdale to Los Angeles Section – Preliminary Alternatives Analysis Report, Volume 1, July 2010, Figure 4.6-7.
The CHSRA has recently decided to re-evaluate a potential route from Bakersfield to Sylmar via the Interstate 5 corridor over the Grapevine, as shown in FIGuRE II-9, instead of reaching the Los Angeles basin via Palmdale. This option would still allow service to BUR from the Central Valley communities, although the closest HSR station to the Antelope Valley would be Sylmar, which is sufficiently close to Burbank that it would be unlikely to attract much use for access to BUR by travelers from the Antelope Valley. This option would also preclude use of the HSR for access to Palmdale Regional Airport.
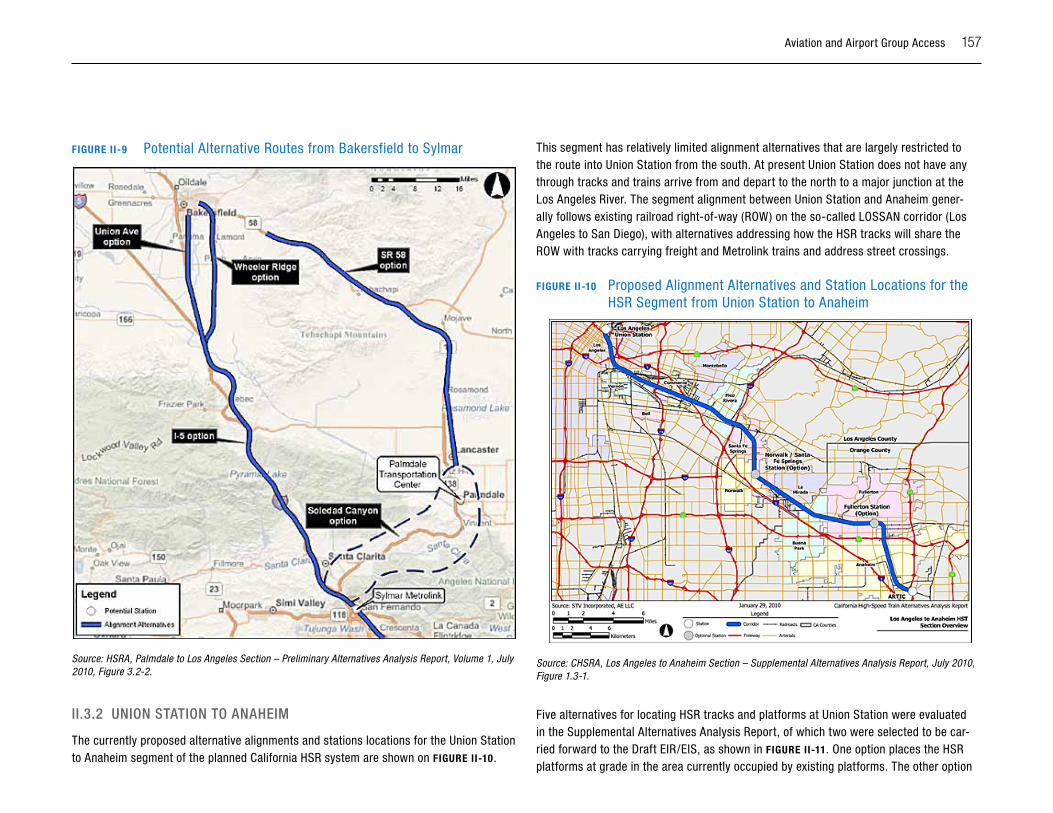
Aviation and Airport Group Access 157
FIGuRE II-9 Potential Alternative Routes from Bakersfield to Sylmar
Source: HSRA, Palmdale to Los Angeles Section – Preliminary Alternatives Analysis Report, Volume 1, July 2010, Figure 3.2-2.
ii.3.2 union sTATion To AnAhEiM
The currently proposed alternative alignments and stations locations for the Union Station to Anaheim segment of the planned California HSR system are shown on FIGuRE II-10.
This segment has relatively limited alignment alternatives that are largely restricted to the route into Union Station from the south. At present Union Station does not have any through tracks and trains arrive from and depart to the north to a major junction at the Los Angeles River. The segment alignment between Union Station and Anaheim gener-ally follows existing railroad right-of-way (ROW) on the so-called LOSSAN corridor (Los Angeles to San Diego), with alternatives addressing how the HSR tracks will share the ROW with tracks carrying freight and Metrolink trains and address street crossings.
FIGuRE II-10 Proposed Alignment Alternatives and Station Locations for the HSR Segment from Union Station to Anaheim
Source: CHSRA, Los Angeles to Anaheim Section – Supplemental Alternatives Analysis Report, July 2010, Figure 1.3-1.
Five alternatives for locating HSR tracks and platforms at Union Station were evaluated in the Supplemental Alternatives Analysis Report, of which two were selected to be car-ried forward to the Draft EIR/EIS, as shown in FIGuRE II-11. One option places the HSR platforms at grade in the area currently occupied by existing platforms. The other option
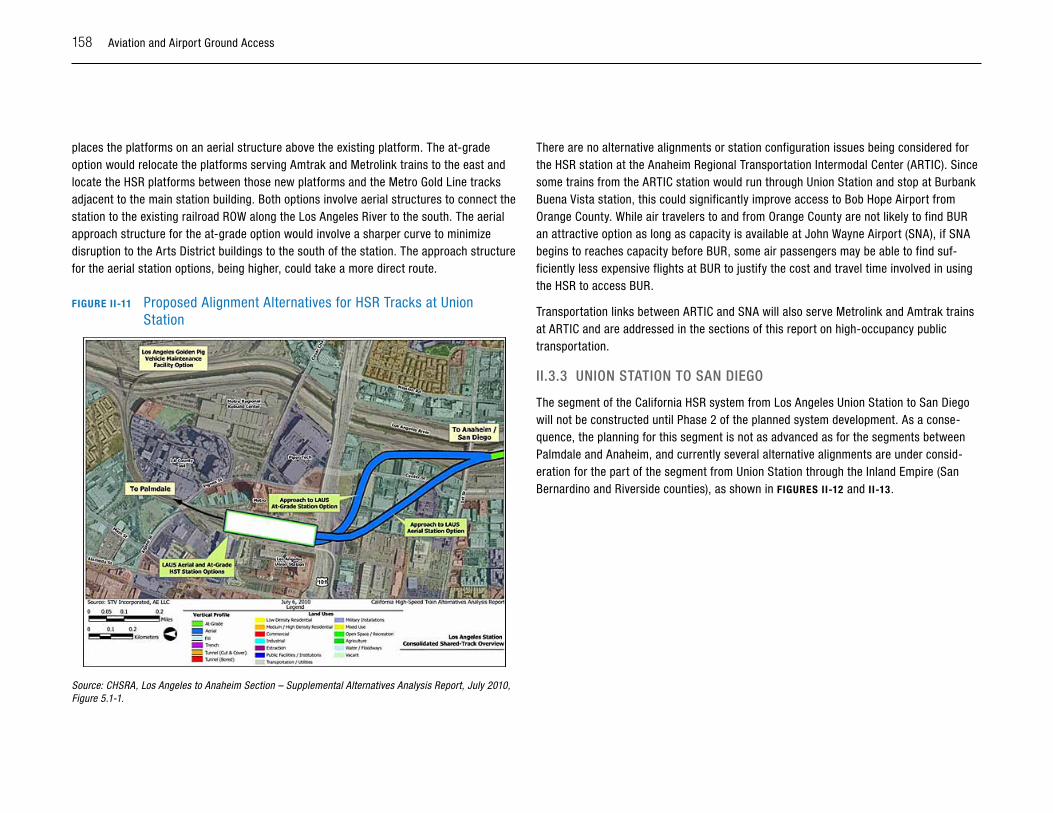
158 Aviation and Airport Ground Access
places the platforms on an aerial structure above the existing platform. The at-grade option would relocate the platforms serving Amtrak and Metrolink trains to the east and locate the HSR platforms between those new platforms and the Metro Gold Line tracks adjacent to the main station building. Both options involve aerial structures to connect the station to the existing railroad ROW along the Los Angeles River to the south. The aerial approach structure for the at-grade option would involve a sharper curve to minimize disruption to the Arts District buildings to the south of the station. The approach structure for the aerial station options, being higher, could take a more direct route.
FIGuRE II-11 Proposed Alignment Alternatives for HSR Tracks at Union Station
Source: CHSRA, Los Angeles to Anaheim Section – Supplemental Alternatives Analysis Report, July 2010, Figure 5.1-1.
There are no alternative alignments or station configuration issues being considered for the HSR station at the Anaheim Regional Transportation Intermodal Center (ARTIC). Since some trains from the ARTIC station would run through Union Station and stop at Burbank Buena Vista station, this could significantly improve access to Bob Hope Airport from Orange County. While air travelers to and from Orange County are not likely to find BUR an attractive option as long as capacity is available at John Wayne Airport (SNA), if SNA begins to reaches capacity before BUR, some air passengers may be able to find suf-ficiently less expensive flights at BUR to justify the cost and travel time involved in using the HSR to access BUR.
Transportation links between ARTIC and SNA will also serve Metrolink and Amtrak trains at ARTIC and are addressed in the sections of this report on high-occupancy public transportation.
ii.3.3 union sTATion To sAn DiEGo
The segment of the California HSR system from Los Angeles Union Station to San Diego will not be constructed until Phase 2 of the planned system development. As a conse-quence, the planning for this segment is not as advanced as for the segments between Palmdale and Anaheim, and currently several alternative alignments are under consid-eration for the part of the segment from Union Station through the Inland Empire (San Bernardino and Riverside counties), as shown in FIGuRES II-12 and II-13.
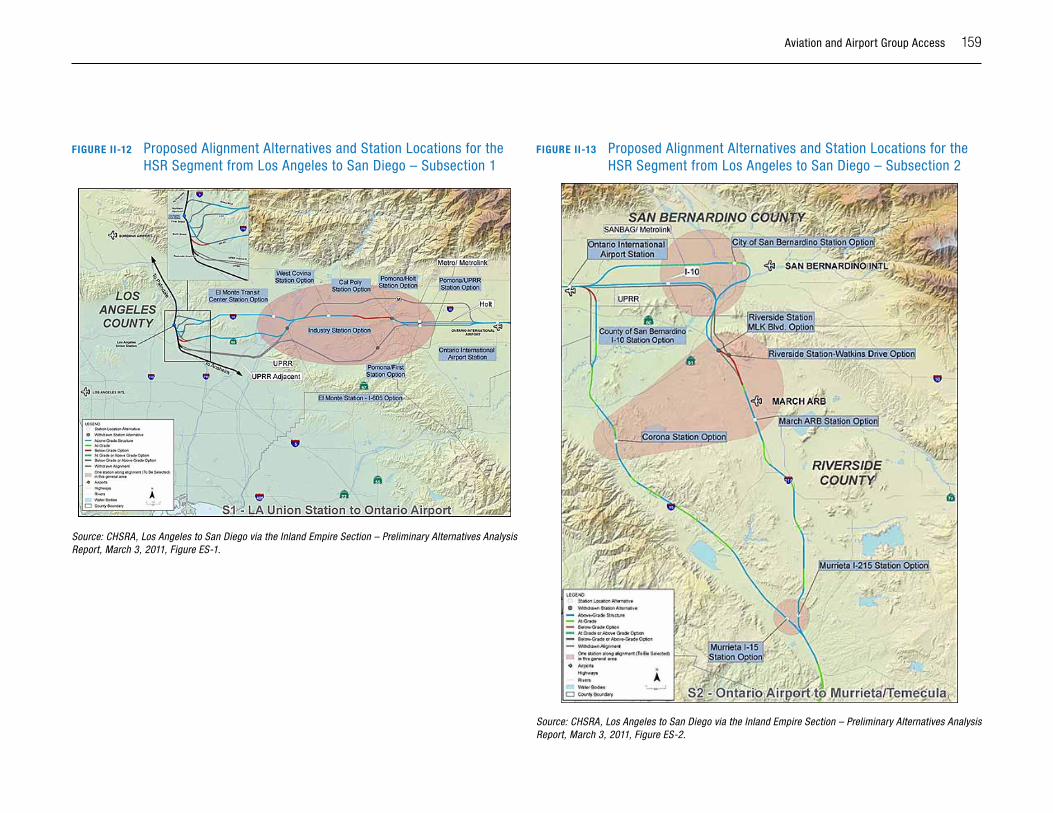
Aviation and Airport Group Access 159
FIGuRE II-12 Proposed Alignment Alternatives and Station Locations for the HSR Segment from Los Angeles to San Diego – Subsection 1
Source: CHSRA, Los Angeles to San Diego via the Inland Empire Section – Preliminary Alternatives Analysis Report, March 3, 2011, Figure ES-1.
FIGuRE II-13 Proposed Alignment Alternatives and Station Locations for the HSR Segment from Los Angeles to San Diego – Subsection 2
Source: CHSRA, Los Angeles to San Diego via the Inland Empire Section – Preliminary Alternatives Analysis Report, March 3, 2011, Figure ES-2.
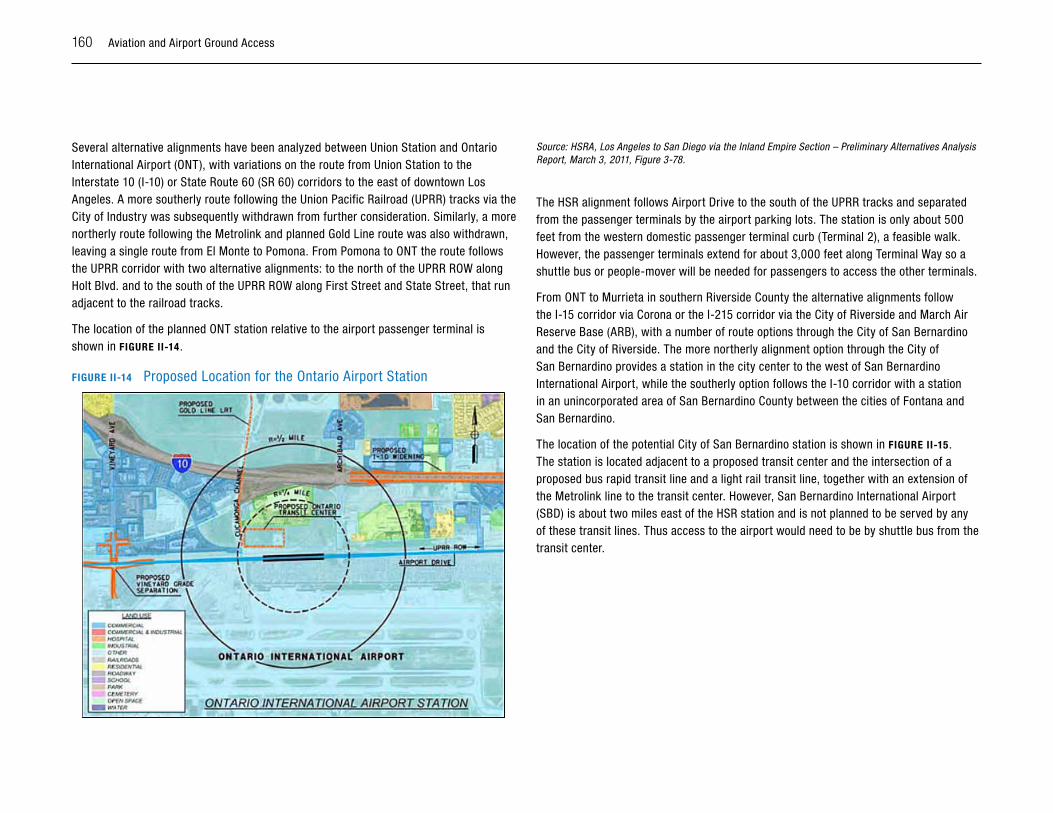
160 Aviation and Airport Ground Access
Several alternative alignments have been analyzed between Union Station and Ontario International Airport (ONT), with variations on the route from Union Station to the Interstate 10 (I-10) or State Route 60 (SR 60) corridors to the east of downtown Los Angeles. A more southerly route following the Union Pacific Railroad (UPRR) tracks via the City of Industry was subsequently withdrawn from further consideration. Similarly, a more northerly route following the Metrolink and planned Gold Line route was also withdrawn, leaving a single route from El Monte to Pomona. From Pomona to ONT the route follows the UPRR corridor with two alternative alignments: to the north of the UPRR ROW along Holt Blvd. and to the south of the UPRR ROW along First Street and State Street, that run adjacent to the railroad tracks.
The location of the planned ONT station relative to the airport passenger terminal is shown in FIGuRE II-14.
FIGuRE II-14 Proposed Location for the Ontario Airport Station
Source: HSRA, Los Angeles to San Diego via the Inland Empire Section – Preliminary Alternatives Analysis Report, March 3, 2011, Figure 3-78.
The HSR alignment follows Airport Drive to the south of the UPRR tracks and separated from the passenger terminals by the airport parking lots. The station is only about 500 feet from the western domestic passenger terminal curb (Terminal 2), a feasible walk. However, the passenger terminals extend for about 3,000 feet along Terminal Way so a shuttle bus or people-mover will be needed for passengers to access the other terminals.
From ONT to Murrieta in southern Riverside County the alternative alignments follow the I-15 corridor via Corona or the I-215 corridor via the City of Riverside and March Air Reserve Base (ARB), with a number of route options through the City of San Bernardino and the City of Riverside. The more northerly alignment option through the City of San Bernardino provides a station in the city center to the west of San Bernardino International Airport, while the southerly option follows the I-10 corridor with a station in an unincorporated area of San Bernardino County between the cities of Fontana and San Bernardino.
The location of the potential City of San Bernardino station is shown in FIGuRE II-15. The station is located adjacent to a proposed transit center and the intersection of a proposed bus rapid transit line and a light rail transit line, together with an extension of the Metrolink line to the transit center. However, San Bernardino International Airport (SBD) is about two miles east of the HSR station and is not planned to be served by any of these transit lines. Thus access to the airport would need to be by shuttle bus from the transit center.
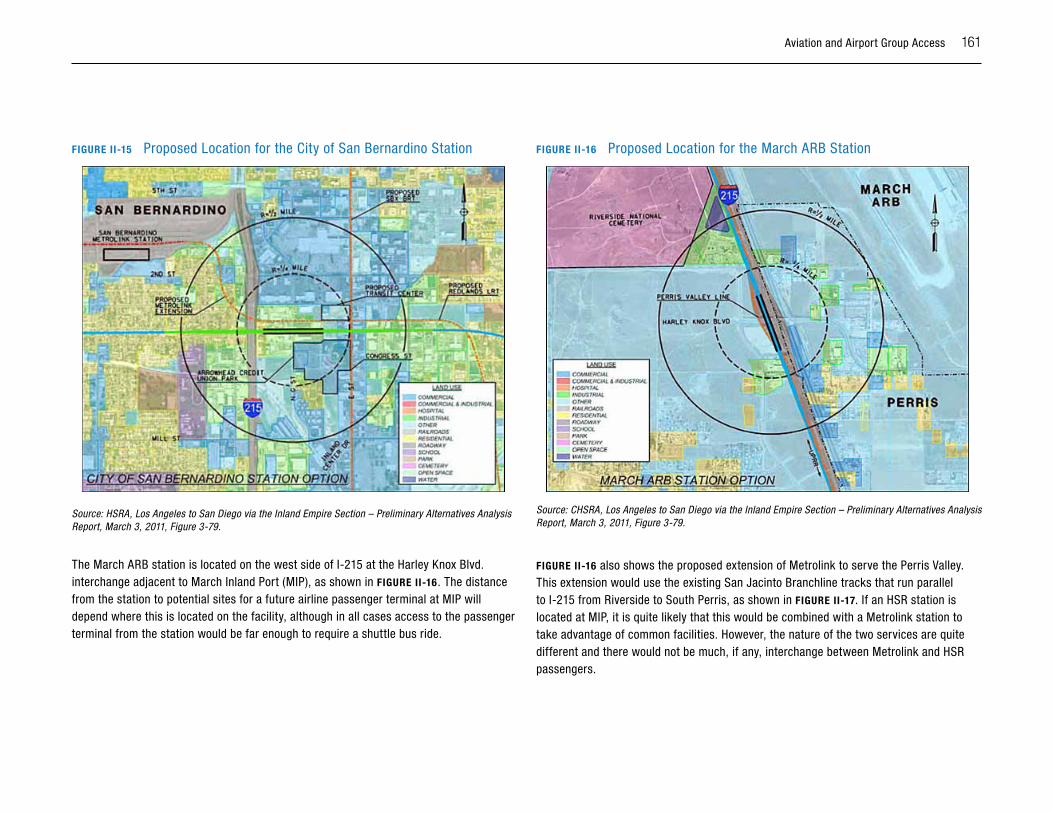
Aviation and Airport Group Access 161
FIGuRE II-15 Proposed Location for the City of San Bernardino Station
Source: HSRA, Los Angeles to San Diego via the Inland Empire Section – Preliminary Alternatives Analysis Report, March 3, 2011, Figure 3-79.
The March ARB station is located on the west side of I-215 at the Harley Knox Blvd. interchange adjacent to March Inland Port (MIP), as shown in FIGuRE II-16. The distance from the station to potential sites for a future airline passenger terminal at MIP will depend where this is located on the facility, although in all cases access to the passenger terminal from the station would be far enough to require a shuttle bus ride.
FIGuRE II-16 Proposed Location for the March ARB Station
Source: CHSRA, Los Angeles to San Diego via the Inland Empire Section – Preliminary Alternatives Analysis Report, March 3, 2011, Figure 3-79.
FIGuRE II-16 also shows the proposed extension of Metrolink to serve the Perris Valley. This extension would use the existing San Jacinto Branchline tracks that run parallel to I-215 from Riverside to South Perris, as shown in FIGuRE II-17. If an HSR station is located at MIP, it is quite likely that this would be combined with a Metrolink station to take advantage of common facilities. However, the nature of the two services are quite different and there would not be much, if any, interchange between Metrolink and HSR passengers.
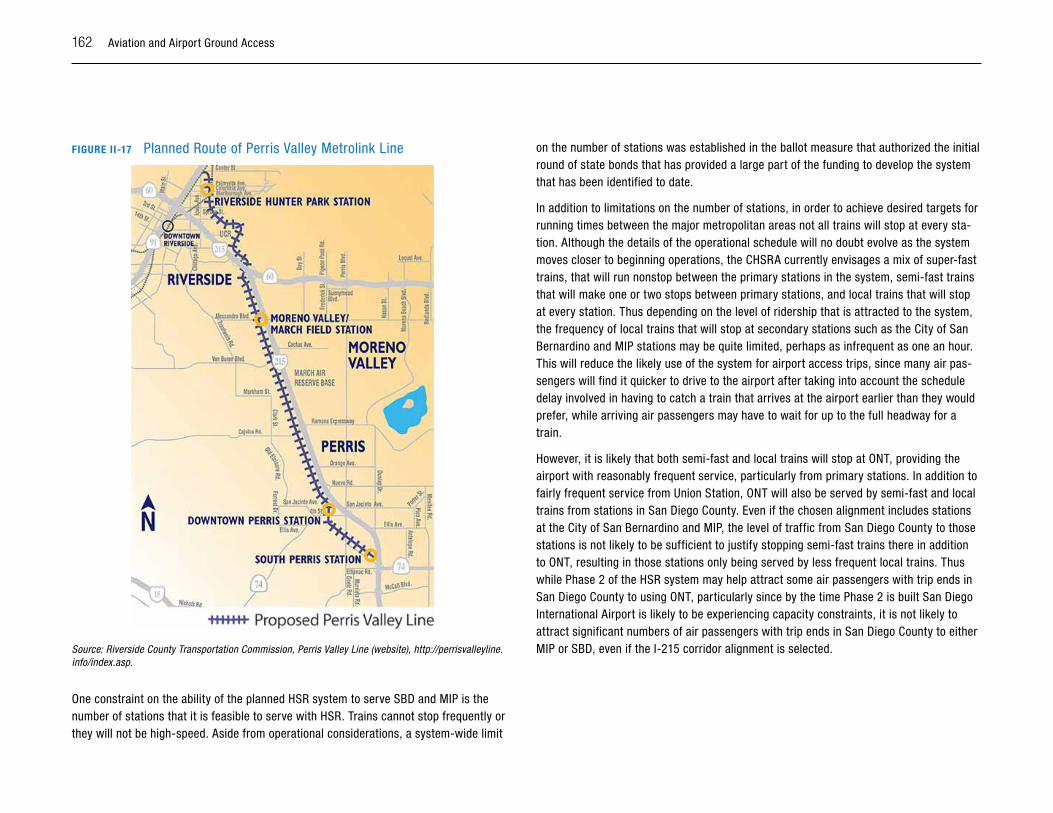
162 Aviation and Airport Ground Access
FIGuRE II-17 Planned Route of Perris Valley Metrolink Line
Source: Riverside County Transportation Commission, Perris Valley Line (website), http://perrisvalleyline.info/index.asp.
One constraint on the ability of the planned HSR system to serve SBD and MIP is the number of stations that it is feasible to serve with HSR. Trains cannot stop frequently or they will not be high-speed. Aside from operational considerations, a system-wide limit
on the number of stations was established in the ballot measure that authorized the initial round of state bonds that has provided a large part of the funding to develop the system that has been identified to date.
In addition to limitations on the number of stations, in order to achieve desired targets for running times between the major metropolitan areas not all trains will stop at every sta-tion. Although the details of the operational schedule will no doubt evolve as the system moves closer to beginning operations, the CHSRA currently envisages a mix of super-fast trains, that will run nonstop between the primary stations in the system, semi-fast trains that will make one or two stops between primary stations, and local trains that will stop at every station. Thus depending on the level of ridership that is attracted to the system, the frequency of local trains that will stop at secondary stations such as the City of San Bernardino and MIP stations may be quite limited, perhaps as infrequent as one an hour. This will reduce the likely use of the system for airport access trips, since many air pas-sengers will find it quicker to drive to the airport after taking into account the schedule delay involved in having to catch a train that arrives at the airport earlier than they would prefer, while arriving air passengers may have to wait for up to the full headway for a train.
However, it is likely that both semi-fast and local trains will stop at ONT, providing the airport with reasonably frequent service, particularly from primary stations. In addition to fairly frequent service from Union Station, ONT will also be served by semi-fast and local trains from stations in San Diego County. Even if the chosen alignment includes stations at the City of San Bernardino and MIP, the level of traffic from San Diego County to those stations is not likely to be sufficient to justify stopping semi-fast trains there in addition to ONT, resulting in those stations only being served by less frequent local trains. Thus while Phase 2 of the HSR system may help attract some air passengers with trip ends in San Diego County to using ONT, particularly since by the time Phase 2 is built San Diego International Airport is likely to be experiencing capacity constraints, it is not likely to attract significant numbers of air passengers with trip ends in San Diego County to either MIP or SBD, even if the I-215 corridor alignment is selected.

Aviation and Airport Group Access 163
ReferencesCalifornia High-Speed Rail Authority, Report to the Legislature, Sacramento, Calif., December 2009.
California High-Speed Rail Authority, California High-Speed Train: Palmdale to Los Angeles Project EIR/EIS – Preliminary Alternatives Analysis Report, Volume 1, Sacramento, Calif., July 2010.
California High-Speed Rail Authority, California High-Speed Train: Los Angeles to Anaheim Project EIR/EIS -- Supplemental Alternatives Analysis Report, prepared by STV Incorporated, Sacramento, Calif., July 2010.
California High-Speed Rail Authority, California High-Speed Train: Los Angeles to San Diego via the Inland Empire Section Project EIR/EIS – Preliminary Alternatives Analysis Report, Sacramento, Calif., March 3, 2011.
California High-Speed Rail Authority, California High-Speed Train: Palmdale to Los Angeles Project EIR/EIS – Supplemental Alternatives Analysis Report, Volume 1, Sacramento, Calif., March 2011.
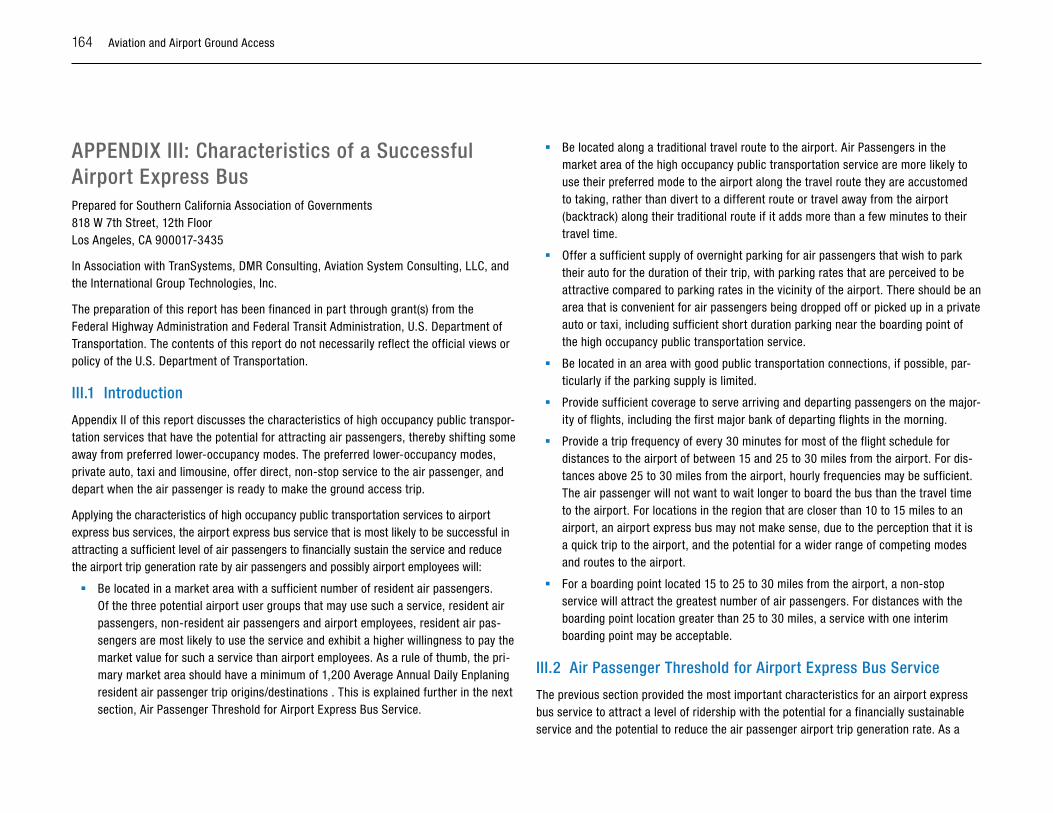
164 Aviation and Airport Ground Access
AppEnDiX iii: Characteristics of a successful Airport Express BusPrepared for Southern California Association of Governments 818 W 7th Street, 12th Floor Los Angeles, CA 900017-3435
In Association with TranSystems, DMR Consulting, Aviation System Consulting, LLC, and the International Group Technologies, Inc.
The preparation of this report has been financed in part through grant(s) from the Federal Highway Administration and Federal Transit Administration, U.S. Department of Transportation. The contents of this report do not necessarily reflect the official views or policy of the U.S. Department of Transportation.
iii.1 introduction
Appendix II of this report discusses the characteristics of high occupancy public transpor-tation services that have the potential for attracting air passengers, thereby shifting some away from preferred lower-occupancy modes. The preferred lower-occupancy modes, private auto, taxi and limousine, offer direct, non-stop service to the air passenger, and depart when the air passenger is ready to make the ground access trip.
Applying the characteristics of high occupancy public transportation services to airport express bus services, the airport express bus service that is most likely to be successful in attracting a sufficient level of air passengers to financially sustain the service and reduce the airport trip generation rate by air passengers and possibly airport employees will:
� Be located in a market area with a sufficient number of resident air passengers. Of the three potential airport user groups that may use such a service, resident air passengers, non-resident air passengers and airport employees, resident air pas-sengers are most likely to use the service and exhibit a higher willingness to pay the market value for such a service than airport employees. As a rule of thumb, the pri-mary market area should have a minimum of 1,200 Average Annual Daily Enplaning resident air passenger trip origins/destinations . This is explained further in the next section, Air Passenger Threshold for Airport Express Bus Service.
� Be located along a traditional travel route to the airport. Air Passengers in the market area of the high occupancy public transportation service are more likely to use their preferred mode to the airport along the travel route they are accustomed to taking, rather than divert to a different route or travel away from the airport (backtrack) along their traditional route if it adds more than a few minutes to their travel time.
� Offer a sufficient supply of overnight parking for air passengers that wish to park their auto for the duration of their trip, with parking rates that are perceived to be attractive compared to parking rates in the vicinity of the airport. There should be an area that is convenient for air passengers being dropped off or picked up in a private auto or taxi, including sufficient short duration parking near the boarding point of the high occupancy public transportation service.
� Be located in an area with good public transportation connections, if possible, par-ticularly if the parking supply is limited.
� Provide sufficient coverage to serve arriving and departing passengers on the major-ity of flights, including the first major bank of departing flights in the morning.
� Provide a trip frequency of every 30 minutes for most of the flight schedule for distances to the airport of between 15 and 25 to 30 miles from the airport. For dis-tances above 25 to 30 miles from the airport, hourly frequencies may be sufficient. The air passenger will not want to wait longer to board the bus than the travel time to the airport. For locations in the region that are closer than 10 to 15 miles to an airport, an airport express bus may not make sense, due to the perception that it is a quick trip to the airport, and the potential for a wider range of competing modes and routes to the airport.
� For a boarding point located 15 to 25 to 30 miles from the airport, a non-stop service will attract the greatest number of air passengers. For distances with the boarding point location greater than 25 to 30 miles, a service with one interim boarding point may be acceptable.
iii.2 Air passenger Threshold for Airport Express Bus service
The previous section provided the most important characteristics for an airport express bus service to attract a level of ridership with the potential for a financially sustainable service and the potential to reduce the air passenger airport trip generation rate. As a
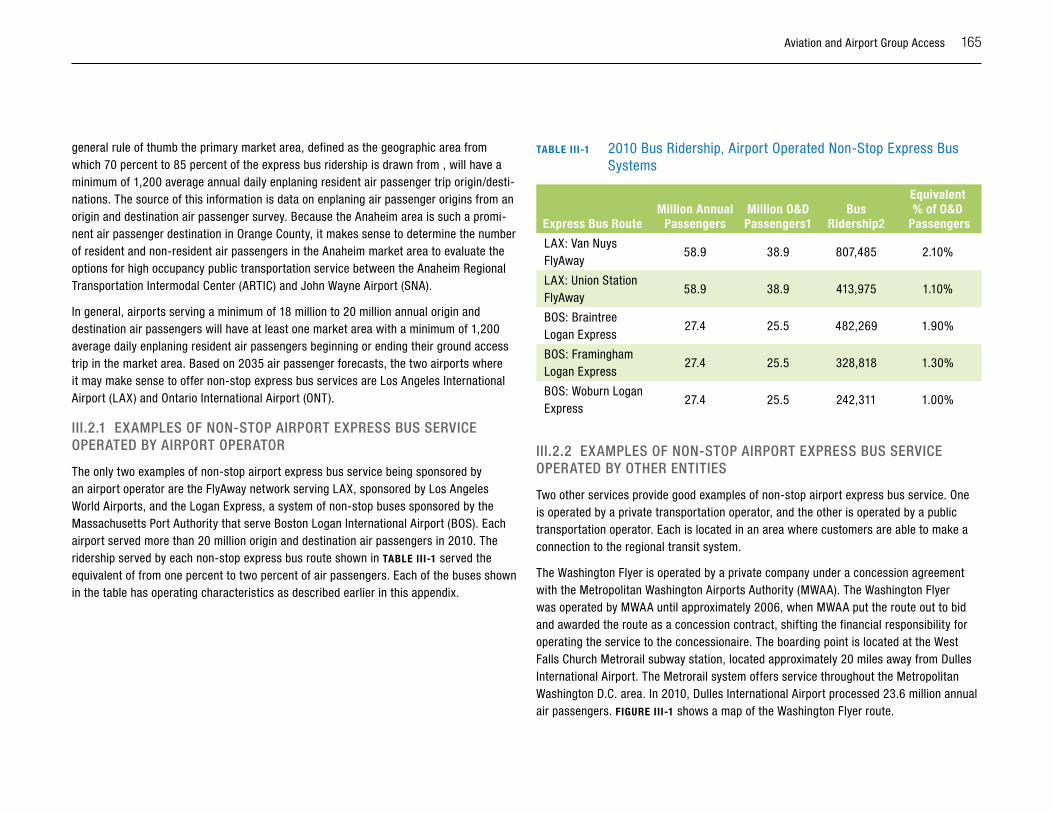
Aviation and Airport Group Access 165
general rule of thumb the primary market area, defined as the geographic area from which 70 percent to 85 percent of the express bus ridership is drawn from , will have a minimum of 1,200 average annual daily enplaning resident air passenger trip origin/desti-nations. The source of this information is data on enplaning air passenger origins from an origin and destination air passenger survey. Because the Anaheim area is such a promi-nent air passenger destination in Orange County, it makes sense to determine the number of resident and non-resident air passengers in the Anaheim market area to evaluate the options for high occupancy public transportation service between the Anaheim Regional Transportation Intermodal Center (ARTIC) and John Wayne Airport (SNA).
In general, airports serving a minimum of 18 million to 20 million annual origin and destination air passengers will have at least one market area with a minimum of 1,200 average daily enplaning resident air passengers beginning or ending their ground access trip in the market area. Based on 2035 air passenger forecasts, the two airports where it may make sense to offer non-stop express bus services are Los Angeles International Airport (LAX) and Ontario International Airport (ONT).
iii.2.1 EXAMplEs oF non-sTop AiRpoRT EXpREss Bus sERviCE opERATED By AiRpoRT opERAToR
The only two examples of non-stop airport express bus service being sponsored by an airport operator are the FlyAway network serving LAX, sponsored by Los Angeles World Airports, and the Logan Express, a system of non-stop buses sponsored by the Massachusetts Port Authority that serve Boston Logan International Airport (BOS). Each airport served more than 20 million origin and destination air passengers in 2010. The ridership served by each non-stop express bus route shown in TABlE III-1 served the equivalent of from one percent to two percent of air passengers. Each of the buses shown in the table has operating characteristics as described earlier in this appendix.
TABlE III-1 2010 Bus Ridership, Airport Operated Non-Stop Express Bus Systems
Express Bus RouteMillion Annual
PassengersMillion O&D Passengers1
Bus Ridership2
Equivalent % of O&D
Passengers
LAX: Van Nuys FlyAway
58.9 38.9 807,485 2.10%
LAX: Union Station FlyAway
58.9 38.9 413,975 1.10%
BOS: Braintree Logan Express
27.4 25.5 482,269 1.90%
BOS: Framingham Logan Express
27.4 25.5 328,818 1.30%
BOS: Woburn Logan Express
27.4 25.5 242,311 1.00%
iii.2.2 EXAMplEs oF non-sTop AiRpoRT EXpREss Bus sERviCE opERATED By oThER EnTiTiEs
Two other services provide good examples of non-stop airport express bus service. One is operated by a private transportation operator, and the other is operated by a public transportation operator. Each is located in an area where customers are able to make a connection to the regional transit system.
The Washington Flyer is operated by a private company under a concession agreement with the Metropolitan Washington Airports Authority (MWAA). The Washington Flyer was operated by MWAA until approximately 2006, when MWAA put the route out to bid and awarded the route as a concession contract, shifting the financial responsibility for operating the service to the concessionaire. The boarding point is located at the West Falls Church Metrorail subway station, located approximately 20 miles away from Dulles International Airport. The Metrorail system offers service throughout the Metropolitan Washington D.C. area. In 2010, Dulles International Airport processed 23.6 million annual air passengers. FIGuRE III-1 shows a map of the Washington Flyer route.
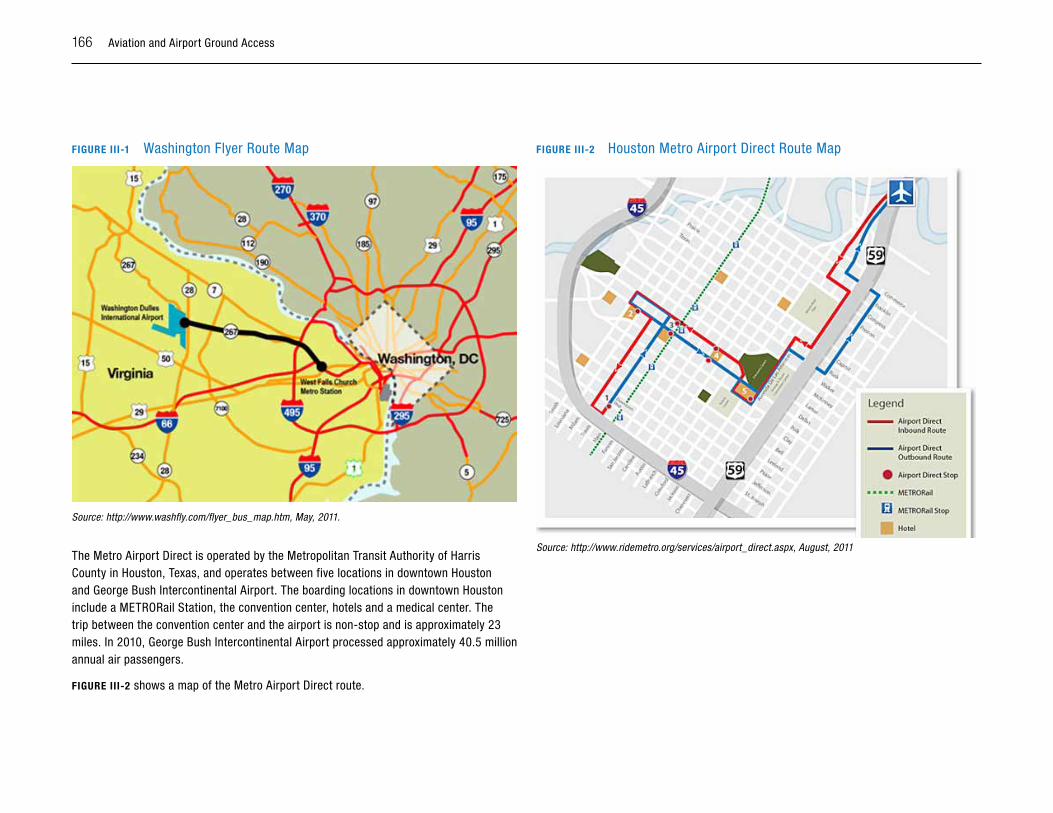
166 Aviation and Airport Ground Access
FIGuRE III-1 Washington Flyer Route Map
Source: http://www.washfly.com/flyer_bus_map.htm, May, 2011.
The Metro Airport Direct is operated by the Metropolitan Transit Authority of Harris County in Houston, Texas, and operates between five locations in downtown Houston and George Bush Intercontinental Airport. The boarding locations in downtown Houston include a METRORail Station, the convention center, hotels and a medical center. The trip between the convention center and the airport is non-stop and is approximately 23 miles. In 2010, George Bush Intercontinental Airport processed approximately 40.5 million annual air passengers.
FIGuRE III-2 shows a map of the Metro Airport Direct route.
FIGuRE III-2 Houston Metro Airport Direct Route Map
Source: http://www.ridemetro.org/services/airport_direct.aspx, August, 2011


Regional officesImperial County1405 North Imperial AvenueSuite 1 El Centro, CA 92243 Phone: (760) 353-7800 Fax: (760) 353-1877
Orange CountyOCTA Building 600 South Main Street9th Floor Orange, CA 92863 Phone: (714) 542-3687 Fax: (714) 560-5089
Riverside County3403 10th StreetSuite 805 Riverside, CA 92501 Phone: (951) 784-1513 Fax: (951) 784-3925
San Bernardino CountySanta Fe Depot 1170 West 3rd StreetSuite 140 San Bernardino, CA 92418 Phone: (909) 806-3556 Fax: (909) 806-3572
Ventura County950 County Square DriveSuite 101 Ventura, CA 93003 Phone: (805) 642-2800 Fax: (805) 642-2260
818 West 7th Street, 12th Floor Los Angeles, CA 90017 Phone: (213) 236-1800 Fax: (213) 236-1825www.scag.ca.gov
please recycle 2347 12.20.2011