
AVIAN & SENSITIVE SPECIES BASELINE STUDY FINAL REPORT EURUS COMBINE HILLS...
75
AVIAN & SENSITIVE SPECIES BASELINE STUDY FINAL REPORT EURUS COMBINE HILLS TURBINE RANCH UMATILLA COUNTY, OREGON Prepared for: Eurus Energy America Corp. San Diego, California - and - Aeropower Services, Inc. Portland, Oregon March 2003 Prepared by: Western EcoSystems Technology, Inc. Cheyenne, Wyoming & Walla Walla, Washington
Transcript of AVIAN & SENSITIVE SPECIES BASELINE STUDY FINAL REPORT EURUS COMBINE HILLS...

AVIAN & SENSITIVE SPECIES BASELINE STUDY FINAL REPORT
EURUS COMBINE HILLS TURBINE RANCH
UMATILLA COUNTY, OREGON Prepared for:
Eurus Energy America Corp. San Diego, California - and -
Aeropower Services, Inc. Portland, Oregon March 2003
Prepared by:
Western EcoSystems Technology, Inc. Cheyenne, Wyoming & Walla Walla, Washington

Avian and Sensitive Species Baseline Study Plan
& Final Report
Eurus Combine Hills Turbine Ranch
Umatilla County, Oregon
Prepared for:
Eurus Energy America Corporation 402 West Broadway, Suite 1750
San Diego, California 92101
&
Aeropower Services, Inc. 6935 SW 45th Ave.
Portland, Oregon 97219
Prepared by:
David P. Young, Jr. Wallace P. Erickson
Jay D. Jeffrey Kimberly J. Bay Rhett E. Good Beth G. Lack
Western EcoSystems Technology, Inc.
2003 Central Avenue Cheyenne, Wyoming 82001
March 10, 2003

Avian Study Protocol and Final Report EURUS Combine Hills Turbine Ranch
WEST, Inc. i
EXECUTIVE SUMMARY
Eurus Energy America Corporation (Eurus) is evaluating the feasibility of wind power development in Umatilla County, Oregon. The proposed Eurus Combine Hills Turbine Ranch (Project) is located in the rolling hills north and east of Vansycle Ridge west of the town of Milton-Freewater, Oregon. The proposed development could be up to 104 MW, depending on turbine model selected, electricity markets, transmission constraints, and results of site surveys. In support of the environmental impact evaluation for the project, a detailed baseline biological resources study plan was developed and implemented at the site to assist in project design and for use in detecting impacts to priority resources. The following study plan was developed in cooperation with the Oregon Department of Fish and Wildlife (ODFW) through meetings and review of draft documents. The plan describes the survey methodology and schedule for collecting data on natural resources on and near the proposed Project. Studies conducted at the Project include surveys for sensitive and listed species, rare plant surveys, raptor nest surveys, raptor and other bird use surveys (year-round and migration periods), habitat and vegetation mapping, and general wildlife observations. The principal goals of the baseline studies were to: (1) quantitatively describe the temporal and spatial use by birds and sensitive wildlife species of the study area; and (2) provide baseline information on these species and their habitat sufficient to use in evaluating the probable impact of wind power development in the area. Methodology of the surveys for each study component is provided below in the text of the report. Areas that were surveyed included the proposed development corridors, associated roads, and other improvement areas (e.g., substation location) which Eurus designated in its Conditional Use Permit application to Umatilla County. For the avian use surveys (paired-plot and fixed-point surveys), use estimates of the study area by species and groups were calculated as the number of detections per survey (either 10 or 30 minutes) standardize to a fixed plot size (either 100 m or 800 m depending on the survey type). Two measures of species diversity in the study area were also calculated. Frequency of occurrence was calculated as the percent of surveys in which a particular species was observed. Species composition was represented by the mean use for a species divided by the total use for all species and multiplied by 100 to provide percent composition. Detailed analyses of the data and additional results are provided below in the text and tables of the report. Based on the spring migration use surveys, the three most abundant species observed were horned lark (2.008 detections/10-minute survey), western meadowlark (0.408), and grasshopper sparrow (0.088). Together these species comprised more than 79% of the total bird use during the spring paired-plot surveys. For the breeding surveys the three most abundant species were horned lark (2.531), western meadowlark (0.322), and American goldfinch (0.109) which comprised 81% of the total bird use. During the fall migration surveys the three most abundant species observed, based on use, were horned lark (2.459), Brewer’s blackbird (0.301), and dark-eyed junco (0.275). Together these species comprised more than 63% of the total bird use during the fall paired-plot surveys. Overall, for the paired-plot surveys, the four most abundant species

Avian Study Protocol and Final Report EURUS Combine Hills Turbine Ranch
WEST, Inc. ii
were horned lark (2.297), western meadowlark (0.272), and American goldfinch and Brewer’s blackbird (0.140), comprising over 71% of the total use. Based on the fixed-point (raptor use surveys), passerines comprised 49.5% of all groups observed and 48.2% of the total number of birds observed. Raptors comprised 36.8% of all groups and 18.0% of all birds observed. Corvids (magpies, crows, and ravens) comprised 7.0% of all groups and 6.5% of all birds observed. Doves comprised 2.8% of all groups and 6.7% of all birds observed. Upland game birds comprised approximately 1.8% of all groups and 1.0% of all birds observed. Waterfowl comprised only 1.2% of all groups but 18.2% of all birds observed primarily due to one large flock of tundra swans observed flying over the study area. Other birds (waterbirds, shorebirds, nighthawks) comprised 0.8% of all groups observed and 1.5% of all birds observed during the fixed-point surveys. Avian use varied across seasons. For summer, based on the fixed-point surveys, the four most abundant species in the study area were horned lark (2.976 detections/30-minute survey), rock dove (0.667), red-tailed hawk (0.405), and western meadowlark (0.393). Together these species comprised over 79% of the total bird use during the summer. During the fall, the four most abundant species were horned lark (1.089), rock dove (0.511), red-tailed hawk (0.289), and barn swallow (0.267). These species comprised more than 59% of the total bird use during the fall. In the winter, the four most abundant species were horned lark (1.926), European starling (1.352), snow goose (0.315), and red-tailed hawk (0.278), which comprised approximately 72% of the total winter bird use. In the spring, the four most abundant species were tundra swan (4.167), horned lark (1.720), common raven (0.674), and western meadowlark (0.653). A single flock of tundra swans estimated at 200 was observed flying over the study area, which caused the unusually high use estimate for this species. These species comprised approximately 75% of the total bird use for the spring. Overall, the four most abundant species based on use were horned lark (2.006), tundra swan (1.042), rock dove (0.366), and red-tailed hawk (0.363), comprising approximately 62% of total use. Use by tundra swans was highly seasonal and due to a single large flock. Based on overall use, fifth most common species was western meadowlark (0.361). Two aerial surveys for raptor nests were completed (April 27-28 and June 28, 2001) within the raptor nest study area (the Project plus five-mile radius buffer). The total area surveyed was approximately 545 km2 (210 square miles). A total of 95 raptor or large stick nests were located, 50 of which were classified as active nests during the first survey. Nest density for buteos (ferruginous hawk, red-tailed hawk, Swainson’s hawk) was approximately 0.07 nest/km2 (0.18 nest/mi2). Nest density for all raptors located (buteos, falcons, owls) was approximately 0.09 nest/km2 (0.24 nest/mi2). All native grass or shrub steppe habitat within 300 m of the proposed turbine strings, access roads, and substation was surveyed for sensitive species twice between May 1 and June 8, 2001. Approximately, 3,863 acres were surveyed. During the surveys, one Washington ground squirrel colony, three white-tailed jackrabbits, two burrowing owl nests, and 34 grasshopper sparrows were located. An additional seven white-tailed jackrabbits were detected during the nocturnal spotlight surveys of the same area. No sagebrush lizards were located during the surveys. Both of the burrowing owl nests were found outside the proposed development area but within the raptor

Avian Study Protocol and Final Report EURUS Combine Hills Turbine Ranch
WEST, Inc. iii
nest survey area. The Washington ground squirrel colony was located outside the development area but within the 300m buffer of a proposed turbine string. The colony was monitored for ground squirrel activity periodically until June 4, 2001 to determine the effectiveness of continued ground squirrel surveys throughout the development area. The current disposition of the colony is unknown; however, it will not be affected by the proposed project. The rare plant field surveys did not locate any federal or state endangered, threatened, proposed, or candidate plant species. Habitat was unsuitable for the threatened Ute ladies’-tresses orchid. The surveys located five populations of one Oregon Natural Heritage Program List 2 rare plant species, rosy balsamroot. All five populations were restricted to shallow soiled lithosol (scab) habitats, occurring on ridgetops and upper west facing slopes. An estimated total of 13,375 plants were found with a total population area of approximately 84 acres. Two basic habitat types, agriculture and steppe, occur in the study area defined as the area within 300 m of the proposed turbine strings. There is also some riparian habitat and CRP land in the area but outside the 300 m buffer. The agriculture habitat type is comprised of two vegetation types, cropland and CRP land. The steppe habitat is comprised of three types, grassland steppe, shrub steppe, and lithosol or scab. In some areas, the steppe habitat was a mosaic of the different types and mapped as shrub/grassland steppe. Also, the shrub steppe type was further broken down in to sagebrush stands and sagebrush steppe which was rare in the study area. The agriculture types were the most abundant type with approximately 1,722 acres in the study area. Lithosol or scab was the second most common type with approximately 1,210 acres, followed by shrub steppe, 420 acres, and shortgrass, 321 acres. Shrub steppe/grassland steppe mosaic areas were approximately 105 acres and areas dominated by sagebrush were approximately 85 acres. Several avian species of interest were observed on-site outside of the scheduled surveys (fixed-point or paired-plot), including great-horned owl, red-tailed hawk, and golden eagle. A golden eagle was seen periodically during the winter and spring and could have been a transient or resident, however, no eagle nests were located in the raptor nest survey area. Six species of mammals; mule deer, Ord’s kangaroo rat, deer mouse, long-tailed weasel, badger, northern pocket gopher; and two species of reptiles, gopher snake and yellow-bellied racer were recorded in the study area during the studies. No federally listed threatened or endangered species were observed in the study area. Several Oregon state species of concern were observed incidentally (as well as during scheduled surveys) in the study area including common nighthawk, western meadowlark, grasshopper sparrow, golden eagle, and bank swallow. The estimates of avian use from the Project area are similar to other sites studied for wind development. The species diversity was relatively low with few species comprising the majority of observations. Raptor use was similar to higher than that estimated for other wind sites and is probably due to a slightly higher density of raptor nests within five miles of the Project. Raptor nest density was high due primarily to the Walla Walla River valley running through the northern part of the raptor nest study area. Few state sensitive species were located during the surveys. The Washington ground squirrel colony located is outside the Project area (i.e., the area that will be developed). One state listed rare plant was found in the study area but should not be

Avian Study Protocol and Final Report EURUS Combine Hills Turbine Ranch
WEST, Inc. iv
substantially affected due to the large area in which it is found and the large number of plants in the area. Additional discussion topics are addressed in the text below.

Avian Study Protocol and Final Report EURUS Combine Hills Turbine Ranch
WEST, Inc. v
TABLE OF CONTENTS
1.0 INTRODUCTION AND BACKGROUND..........................................................................................................1 2.0 STUDY PLAN........................................................................................................................................................3
2.1 Study Area ...........................................................................................................................................................3 3.0 STUDY COMPONENTS ......................................................................................................................................4
3.1 Spring Migration and Breeding Bird Use Surveys ..............................................................................................4 3.2 Raptor Use Surveys .............................................................................................................................................5 3.3 Aerial Raptor Nest Surveys .................................................................................................................................6 3.4 Fall Migration Avian Use Surveys ......................................................................................................................6 3.5 Sensitive Species Surveys....................................................................................................................................6 3.6 White-tailed Jackrabbit Surveys ..........................................................................................................................7 3.7 Rare Plant Surveys...............................................................................................................................................7 3.8 Habitat Mapping and Classification ....................................................................................................................8 3.9 General Wildlife Observations ............................................................................................................................8
4.0 DATA COMPILATION AND REPORT PREPARATION ..............................................................................9 4.1 Data Compilation and Storage.............................................................................................................................9 4.2 Quality Assurance/Quality Control (QA/QC) .....................................................................................................9 4.3 Statistical Analysis and Products.........................................................................................................................9 4.4 Reporting and Decision Standards.....................................................................................................................10
5.0 RESULTS.............................................................................................................................................................11 5.1 Breeding and Spring and Fall Migration Avian Use Surveys............................................................................11
5.1.1 Avian Use ...................................................................................................................................................12 5.1.2 Frequency of Occurrence and Species Composition ..................................................................................13
5.2 Raptor Use Surveys ...........................................................................................................................................13 5.2.1 Avian Use ...................................................................................................................................................14 5.2.2 Frequency of Occurrence and Species Composition ..................................................................................15 5.2.3 Flight Height Characteristics ......................................................................................................................16 5.2.4 Exposure index ...........................................................................................................................................16 5.2.5 Spatial Use..................................................................................................................................................16
5.3 Aerial Raptor Nest Surveys ...............................................................................................................................17 5.4 Sensitive Species Surveys..................................................................................................................................17 5.5 White-tailed Jackrabbit Surveys ........................................................................................................................18 5.6 Rare Plant Survey ..............................................................................................................................................18 5.7 Habitat and Vegetation Mapping.......................................................................................................................18 5.8 General Wildlife Observations ..........................................................................................................................19
6.0 DISCUSSION AND SUMMARY.......................................................................................................................20 6.1 Avian Use and Diversity....................................................................................................................................20 6.2 Raptor Nest Density...........................................................................................................................................21 6.3 Risk of Turbine Collision ..................................................................................................................................21
6.3.1 Exposure Index ...........................................................................................................................................21 6.3.2 Raptors........................................................................................................................................................22 6.3.3 Passerines....................................................................................................................................................23 6.3.4 Waterfowl ...................................................................................................................................................23 6.3.5 Other Groups/Species .................................................................................................................................23
7.0 REFERENCES AND LITERATURE CITED..................................................................................................24
Avian Study Protocol and Final Report EURUS Combine Hills Turbine Ranch
WEST, Inc. vi
LIST OF TABLES Table 1. Avian Species observed while conducting paired-point surveys for 2001 and 2002 on the Eurus Combine Hills Turbine Ranch Site. ............................................................................................................................................26 Table 2. Average use, frequency of occurrence, and percent composition for paired-point surveys for each species observed within 100m of the site center for 2001 and 2002. .......................................................................................28 Table 3. Average use by taxonomic group for observations within 100 m of the plot center for turbine and offset points from the paired-plot surveys. ............................................................................................................................36 Table 4 Avian species observed while conducting fixed-point surveys (June 9, 2001 – January 28, 2003) on the Eurus Combine Hills Turbine Ranch Site....................................................................................................................37 Table 5. Estimated mean use (number of observations per 30-minute survey) for each species observed within 800m of the survey point for fixed-point surveys (June 9, 2001 – January 28, 2003)...........................................................39 Table 6. Estimated percent composition (mean use divided by total use for all species) for each species observed within 800 m of the survey point for the fixed-point surveys......................................................................................41 Table 7. Estimated frequency of occurrence (percent of 30-minute surveys species/group is recorded) for each species observed within 800 m of the survey point for the fixed-point surveys ......................................................................43 Table 8. Flight height characteristics of avian species observed during the fixed-point surveys ................................45 Table 9. Flight height characteristics of avian groups observed during the fixed-point surveys. ................................46 Table 10. Exposure indices calculated for species observed during fixed-point surveys ............................................47 Table 11. Raptor and large bird nests located in the raptor nest survey area (WRA area plus area within a five-mile radius buffer). ..............................................................................................................................................................48 Table 12. Oregon State sensitive species located during surveys on the study area. ...................................................49 Table 13. Habitat types in the study area.....................................................................................................................50 Table 14. Number of groups and the total number of individuals of avian species of interest and non-avian species observed incidentally on the study area. ......................................................................................................................51
LIST OF FIGURES
Figure 1. Regional map showing the Project location . ...............................................................................................52 Figure 2. Map of the Project and paired-plot survey points.........................................................................................53 Figure 3. Map of the Project and raptor survey (fixed-point) points. ..........................................................................54 Figure 4. Map of the raptor nest survey area and locations of raptor and large bird nests found during the surveys..55 Figure 5. Map of the Project and sensitive species survey corridors and locations of sensitive species found. ..........56

Avian Study Protocol and Final Report EURUS Combine Hills Turbine Ranch
WEST, Inc. vii
Figure 6. Mean use (number detections/30-minute survey) and frequency of occurrence for passerines by survey period (June 2001-Januray 2003). ...............................................................................................................................57 Figure 7. Mean use (number detections/30-minute survey) and frequency of occurrence for raptors by survey period (June 2001- January 2003)...........................................................................................................................................58 Figure 8. Mean use (number detections/30-minute survey + 1 standard error) and frequency of occurrence for passerines by survey station (June 2001-January 2003). .............................................................................................59 Figure 9. Mean use (number detections/30-minute survey + 1 standard error) and frequency of occurrence for raptors by survey station (June 2001-January 2003). ..............................................................................................................60 Figure 10. Mean number of species per survey (June 2001-January 2003).................................................................61 Figure 11. Buteo flight paths and perch locations recorded during the fixed-point surveys and incidentally in the study area.....................................................................................................................................................................62 Figure 12. Other raptor flight paths and perch locations recorded during the fixed-point surveys and incidentally in the study area...............................................................................................................................................................63 Figure 13. Other large bird flight paths and perch locations recorded during the fixed-point surveys and incidentally in the study area...........................................................................................................................................................64 Figure 14. Map of the Project and habitat types within 300 m of proposed project facilities. ....................................65

Avian Study Protocol and Final Report EURUS Combine Hills Turbine Ranch
WEST, Inc. 1
1.0 INTRODUCTION AND BACKGROUND Eurus Energy America Corporation (Eurus) is evaluating the feasibility of wind power development in Umatilla County, Oregon. The proposed Eurus Combine Hills Turbine Ranch (Project) is located in the rolling hills north and east of Vansycle Ridge west of the town of Milton-Freewater, Oregon. The proposed development could be up to 104 MW, depending on factors such as turbine model, electricity markets, transmission constraints, and results of site surveys. Because of public sensitivity to the potential conflicts between natural resources and the proposed development, the following study plan was developed in cooperation with the Oregon Department of Fish and Wildlife (ODFW). The study plan was designed to collect baseline natural resource data to assist in project design and for use in detecting impacts to priority resources as the wind plant is developed. Western EcoSystems Technology, Inc. (WEST) met with representatives from ODFW on three different occasions during the early stages of the study to discuss the design and implementation of the study plan. Meetings were held in Pendleton, Oregon and/or at field locations on March 26 & 27, April 10 & 11, May 17 & 18, 2001. Drafts of the plan were also reviewed by ODFW. In addition, WEST discussed the plan with members of the Blue Mountain Audubon Society and other interested individuals in Walla Walla, Washington on December 18, 2001. Since the on-set of the field studies in April 2001, new property was been added to the Project, primarily along the eastern border of the initial development area. This property was included in the current permit application for the Project to Umatilla County. Specifically, the new area was included in the permit application but was not surveyed in 2001 for avian use, sensitive species, rare plants or habitat. Beginning in the winter of 2002, this area was incorporated into the on-going study using the same baseline methodology and timing identified in this protocol and the interim report. Including this area in the field studies during 2002 was discussed with and agreed to by the Oregon Department of Fish and Wildlife in a meeting on December 17, 2001. The following plan describes the survey methodology and schedule for collecting data on natural resources on and near the proposed Project. These data were collected for the following specific reasons in support of the proposed development: (1) Currently, ODFW and counties are requiring evaluation of natural resources at proposed wind plants prior to development in order to predict environmental impacts from the proposed development, to estimate post construction impacts following project implementation, and for permitting purposes. Studies conducted include surveys for sensitive and listed species, rare plant surveys, raptor nest surveys, and raptor and other bird use surveys. (2) The proposed Eurus site has been considered for wind development in the past. All data available for this site that is in the public domain will be used in the evaluation of the Project. However, most baseline data collected during earlier studies in support of these projects are in private ownership and unavailable for use in satisfying ODFW requirements.

Avian Study Protocol and Final Report EURUS Combine Hills Turbine Ranch
WEST, Inc. 2
(3) In addition, the historical data was collected from 1994-1995. Based on the inherent variability of natural resources and in particular wildlife resources these data are not likely to represent the current status of species of interest and their habitat. New data is needed to assess potential impacts from the current proposed development. (4) Additional development of wind power is being planned in the area by other companies, and similar studies are being conducted by these developers. However, data from these concurrent studies in adjacent areas (additional proposed and permitted wind plants) is also in private ownership and unavailable for use except data that has been made part of the public record pursuant to a permitting process, which is in the public domain. (5) The proposed study plan and methodology was designed to address the specific characteristics of the proposed development and research objectives agreed to by ODFW and Eurus. Previous data collection on and near the site was conducted to study different developments and objectives. (6) There was concern expressed by the ODFW regarding the importance of the area for migrating birds, particularly passerines. It was decided that the diurnal avian use studies described below would provide an indication of migrant use of the area and indicate the need for further nocturnal studies (i.e., radar).
Avian Study Protocol and Final Report EURUS Combine Hills Turbine Ranch
WEST, Inc. 3
2.0 STUDY PLAN The following protocol contains a description of the baseline avian use studies, sensitive species studies, and vegetation and habitat studies for the proposed Project. Information and results from the baseline studies were used in the overall environmental impact assessment and permitting for the Project. The principal goals of the baseline studies are to:
1. Quantitatively describe the temporal and spatial use by birds and sensitive wildlife species of the study area; and
2. Provide baseline information on these species and their habitat sufficient to use in evaluating the probable impact of wind power development in the area.
2.1 Study Area The Project area is within the Columbia Basin Physiographic Province. The Project area is approximately 6 miles west of Milton Freewater, Oregon and is north and east of Vansycle Ridge and Vansycle Canyon and the existing Vansycle Wind plant (Figure 1). The Project falls within Sections 30-34, Township 6 N, Range 34 E; Sections 1-6 and 8-14, Township 5 N, Range 34 E; and Section 23-26, 35-36, Township 6 N, Range 33 E. The vegetation of the Project area is a mix of grassland/shrub-steppe, Conservation Reserve Program (CRP) pastures, and dryland agriculture. The grassland/shrub steppe community is predominantly rabbitbrush (Chrysothamnus spp.) and cheatgrass (Bromus tectorum), with stands of native bunch grass on some sites and deciduous shrubs and trees in the bottom of some drainages. Agriculture and livestock grazing have converted the overall area to a mosaic of cultivated wheat fields, CRP pastures, and grazed native rangeland. The primary study area or wind resource area (WRA) includes the proposed development area or the location of the wind turbines and associated facilities such as meteorological (met) towers, substations, new roads, operations and maintenance facilities, underground and overhead powerlines, and construction permit areas for gravel/borrow pits, plant sites, equipment storage or lay-down areas, temporary parking areas and the area within a small buffer [approximately 1 mile (1.6 km)] from these Project facilities. All avian use surveys, sensitive species surveys, general wildlife observations, vegetation surveys, and habitat classification occurred within the WRA. The raptor nest study area included the WRA and the surrounding area within five miles. The helicopter surveys for raptor and other large bird nests occurred within this area.

Avian Study Protocol and Final Report EURUS Combine Hills Turbine Ranch
WEST, Inc. 4
3.0 STUDY COMPONENTS The baseline studies consisted of ten components:
1. Spring migration avian use surveys - point count surveys of increased frequency and distribution which target small birds;
2. Breeding bird surveys - point count surveys during the breeding season; 3. Raptor use surveys - point count surveys which target raptors and other large birds; 4. Aerial raptor nest surveys - aerial surveys to locate raptor nests on and within five
miles of the site; 5. Fall migration avian use surveys - point count surveys of increased frequency and
distribution which target all birds; 6. Sensitive species surveys - corridor surveys within a 300 m (1000 ft) buffer of
proposed Project features; 7. White-tailed jackrabbit spotlight surveys within a 300 m (1000 ft) buffer of proposed
Project features; 8. Rare plant surveys - corridor surveys within a 30 m (100 ft) buffer of Project features; 9. Habitat mapping and classification; and 10. General wildlife observations.
3.1 Spring Migration and Breeding Bird Use Surveys The objective of the spring migration avian use surveys was to identify species and estimate the spatial and temporal use of the site by spring migrant bird species. The spring migration surveys were conducted in April and May 2001 and 2002. Point counts (variable circular plots) were conducted on the Project site using methods described by Reynolds et al. (1980). Twenty-three paired-plots were initially established to survey an even distribution across the proposed development (Figure 2). When the additional area was added to the Project (see Section 1.0 Introduction and Background), five additional paired-plots were established in the new area and surveyed in 2002. A paired-plot design was utilized to count birds at proposed turbine locations and at points in an area with similar species and habitats but where no construction will occur. Paired points were established approximately 300 m apart and oriented approximately perpendicular to proposed turbine strings. Surveys at each point were conducted for 10 minutes and each point was visited three times during April and May. All birds seen during the point counts were recorded, however, an emphasis was placed on identifying birds within a 100 m radius of the point. In addition to 10-minute counts at each point, birds seen while traveling (walking) between the two points were recorded by 50-meter increments of the 300 m distance. An additional survey of the initial 22 paired-plots established for the spring bird use studies was conducted in June 2001. The five paired-plots established in the new area were surveyed in June 2002. The objective of the June surveys was identifying species and estimating the spatial and temporal use of the site by breeding resident bird species. The survey methodology was the same as the spring surveys with 10-minute counts and birds seen between the paired points also recorded.

Avian Study Protocol and Final Report EURUS Combine Hills Turbine Ranch
WEST, Inc. 5
3.2 Raptor Use Surveys The objective of the raptor use surveys was to estimate spatial and temporal use of the Project area by raptor species. Raptor use surveys were conducted weekly from June 2001 through May 2002 at eight fixed-points established across the Project area (Figure 3). When the additional area was added to the Project (see Section 1.0 Introduction and Background), one additional fixed-point was established in the new area and surveyed from February 2002 to January 2003. Each survey plot was located at a proposed turbine location and was a variable circular plot centered on an observation point marked in the field. Point counts were conducted from each point using methods described by Reynolds et al. (1980). The points were selected to survey as much of the Project area as possible and so that 800 m radius circles around each point did not overlap (Figure 3). All birds seen during the point counts were recorded, however, the emphasis of the study was locating and counting raptors and other large birds (waterfowl, shorebirds, waterbirds, corvids, and upland game birds). All raptors and large birds observed were recorded, however, the survey effort was concentrated within an approximate 800 m (0.5 mi) radius circle centered on the observation point. Observations of birds beyond the 800 m radius were recorded, but were not included in the analysis so that results would be standardized for comparisons between points and between other wind resource areas studied with similar methods. Survey periods at each point were for 30 minutes. Surveys were conducted on a weekly basis, however, only one-half of the points were visited each week. All raptors and other large birds observed during the survey were assigned a unique observation number and plotted on a map of the survey plot. The date, start and end time of observation period, plot number, species or best possible identification, number of individuals, sex and age class (if possible), distance from plot center when first observed, closest distance, height above ground, activity (behavior), and habitat(s) were recorded. Flight or movement paths were mapped and given the corresponding unique observation number. Weather information at the time of the survey was also recorded. The behavior of each raptor/large bird observed and the habitat in which or over which the bird occurred was recorded. Behavior categories recognized include perched, soaring, flapping, flushed, circle soaring, hunting, gliding, and other. Habitats were recorded as fallow, CRP/grassland, stubble, wheat, plowed, tree, riparian, shrub-steppe, and other. The initial flight patterns and habitats (first observation) was uniquely identified on the data sheet and subsequent patterns and habitats (if any) also recorded. The flight direction of observed birds was recorded on the data sheet map. Approximate flight height at first observation was recorded to the nearest meter and the approximate lowest flight height and highest flight height observed were also recorded. Any comments or unusual observations were noted. Surveys took place during daylight and survey periods were scheduled to approximately cover all daylight hours. Sampling intensity for the Project areas was designed to document avian use and behavior by habitat within the Project. Depending on the season, at least one observer was at the site one day per week. Observations of raptor species were also made along roads while observers were traveling between points. These observations were also plotted on field maps.

Avian Study Protocol and Final Report EURUS Combine Hills Turbine Ranch
WEST, Inc. 6
3.3 Aerial Raptor Nest Surveys The objective of the raptor nest survey was to gather information on nesting raptor and large bird species in the area including nest locations, nesting season (timing), and nest success. The nest survey area included the Project area and the area within an approximate 5-mile buffer of the Project (Figure 4). The focal species for the nesting surveys was ferruginous hawk (Buteo regalis), a state sensitive species and federal species of concern. Richardson (1996) reports the average home range for ferruginous hawks in Washington at 79 km2 (30 mi2). The 5-mile buffer was deemed sufficient to identify nesting raptors potentially impacted by the Project. Two aerial surveys via helicopter were conducted in the survey area. The first was conducted in late April 2001 when ferruginous hawks in the study area would be actively incubating, brooding, or attending young (Richardson 1996). All nests located of all raptor species or other large birds were recorded by GPS coordinates and mapped utilizing ArcView Geographic Information System (GIS) database. Locations of inactive nests were also recorded as they may be occupied in subsequent years. The second survey was conducted in early June to visit located nests and look for evidence of nest success (e.g., fledged young nearby, full grown chicks in the nest). All nests, whether active or inactive, were given a unique identification number. 3.4 Fall Migration Avian Use Surveys The objective of the fall migration avian use surveys was to identify species and estimate the spatial and temporal use of the site by fall migrant bird species. The fall migration surveys were conducted in September and October 2001. The fall migration surveys utilized the same 28 pair plots established for the spring bird use studies (Figure 2). Each point was surveyed three times during the period September 1 to October 31, 2001. The five new points established in 2002 were surveyed in September and October 2002. The survey methodology was the same as the spring surveys with 10-minute counts and birds seen between the paired points also recorded. 3.5 Sensitive Species Surveys The objective of the sensitive species surveys was to confirm presence/absence and document spatial use of the proposed development area by species of concern in the State of Oregon. The sensitive species surveys were conducted between April and June 2001 and 2002. The focal species for the sensitive species surveys included Washington ground squirrel (Spermophilus washingtoni), white-tailed jackrabbit (Lepus townsendii), grasshopper sparrow (Ammodramus savannarum), burrowing owl (Athene cunicularia), and sagebrush lizard (Sceloporus graciosus). Nocturnal spotlight surveys for white-tailed jackrabbits were also conducted (see below). Methods for surveying for sensitive species followed guidelines and recommendations of the ODFW. The area surveyed included the proposed development areas (e.g., access roads, turbine strings, substations, etc.) and a buffer of 300 m (1000 ft) in all directions (Figure 5). Only native habitats (shrub steppe, grasslands) within the buffer area were surveyed. Two surveys of all

Avian Study Protocol and Final Report EURUS Combine Hills Turbine Ranch
WEST, Inc. 7
suitable habitat within the study area were conducted. Surveys were not conducted in wheat fields, plowed areas, or gravel roads. Surveys were conducted by walking meandering transects approximately 50 m (150 ft) apart (roughly parallel) through the survey corridor while scanning the ground for evidence of species and listening for calls. All small mammal burrows found were inspected for the presence of ground squirrel scat. 3.6 White-tailed Jackrabbit Surveys The objective of the white-tailed jackrabbit surveys was to confirm presence/absence and document spatial use of the proposed development area by white-tailed jackrabbits. Methods for surveying for white-tailed jackrabbits followed guidelines and recommendations of the ODFW. The area surveyed included the proposed development areas (e.g., access roads, turbine strings, substations, etc.) and a buffer of 300 m (1000 ft) in all directions (Figure 5). Only native habitat (shrub steppe, grasslands) within the buffer area was surveyed. Surveys were conducted from a vehicle by two observers using the vehicle headlights and hand held spotlights to cover the area directly in front and to the sides of the vehicle. Surveys were conducted during the first three hours immediately following sunset. Areas that could not be covered from the vehicle were covered on foot with portable hand held spotlights. All native habitat within the initial development area was surveyed twice during August and September, 2001. The expansion area was surveyed in September 2002. 3.7 Rare Plant Surveys The objective of the rare plant survey was to identify listed, sensitive, or otherwise rare plants which occur in the development area and which may be impacted by construction or operation of the Project. In 2001, three field surveys for rare plants were conducted. The first occurred in June and covered the entire study area. The second survey occurred in July and targeted riparian areas. The third survey occurred in August and targeted the federally threatened Ute ladies tresses orchid (Spiranthes diluvialis), a wetland species. The expansion area was surveyed in June 2002. There was no riparian or wetland habitat within the study area in the expansion area, so no follow up July or August surveys were needed. The species of concern for the surveys included all federal and Oregon state endangered, threatened, proposed, candidate and species on lists 1 and 2 of the Oregon Natural Heritage Program’s rare plant lists. A prefield review identified nine species of concern with potential occurrence in the study area (Eagle Cap Consulting, Inc. 2001). Methods for surveying for rare plants followed guidelines and recommendations of the ODFW and the Oregon Natural Heritage Program. Specific methodology is outlined in the technical report prepared for the surveys (Eagle Cap Consulting, Inc. 2001). The area surveyed included the proposed development areas (e.g., access roads, turbine strings, substations, etc.) and a buffer of 50 m (.150 ft) in all directions (100 m corridor). Only native habitat (shrub steppe, grasslands) within the buffer area was surveyed. Surveys were not conducted in wheat fields, plowed areas, planted CRP, or gravel roads. Surveys were conducted by qualified botanists walking meandering transects approximately 5 m (15 ft) apart (roughly parallel) while scanning
Avian Study Protocol and Final Report EURUS Combine Hills Turbine Ranch
WEST, Inc. 8
the ground for evidence of species. UTM coordinates for all sensitive species located were recorded and the locations plotted utilizing ArcView GIS. 3.8 Habitat Mapping and Classification The objective of the vegetation mapping was to identify and describe all habitats within the development area and classify these by habitat category as described by ODFW. Habitat mapping of the primary development area was conducted during the fall 2001 (August - November). The expansion area was mapped in June 2002. Habitat of the Project area was mapped on 1:24000 scale USGS topo maps based on aerial photos and ground observations. During ground surveys the habitat types were characterized based on the dominant and co-dominant vegetation species present. Habitat polygons were then digitized using ArcView for final mapping and acreage calculations. 3.9 General Wildlife Observations The objective of conducting general wildlife observations on the proposed development area was to record wildlife, other than avian species, that may be affected by the proposed development. General wildlife observations were made year round while observers were on site conducting other study activities. All raptors, unusual or unique avian sightings, mammals, reptiles, and amphibians sighted while field observers were on site or traveling between plots were recorded on data sheets for incidental observations. The data recorded was similar to those recorded during the plot surveys. The observation number, date, time, species, number, sex/age class, height above ground (for birds), and habitat were recorded. Observations of uncommon species and species of concern were recorded in additional detail, and mapped on a topographic map by observation number.

Avian Study Protocol and Final Report EURUS Combine Hills Turbine Ranch
WEST, Inc. 9
4.0 DATA COMPILATION AND REPORT PREPARATION 4.1 Data Compilation and Storage A database was established to store, retrieve and organize field observations. Data from field forms was keyed into the electronic data files using a pre-defined format that made subsequent data analysis straightforward. All field data forms, field notebooks, and electronic data files will be retained for future reference. 4.2 Quality Assurance/Quality Control (QA/QC) QA/QC measures were implemented at all stages of the study, including in the field, during data entry, and during data analysis, and report writing. At the end of each survey, each observer was responsible for inspecting his or her data forms for completeness, accuracy, and legibility. The study team leader periodically reviewed data forms to insure completeness and legibility; any problems detected were corrected. Any changes made to the data forms were initialed and dated by the person making the change. A sample of records from the electronic files was compared to the raw data forms and any errors found were corrected. Any irregular codes detected, or any data suspected as questionable, were discussed with the observer and study team leader. All changes made to the raw data were documented for future reference. Any errors or suspect data identified in later stages of analysis were traced back to the raw data forms, and appropriate changes in all steps made. 4.3 Statistical Analysis and Products Statistics/data generated for the Project area included the following:
• Vegetation/habitat mapping; • Raptor nest locations by species; • Raptor nest occupancy and success; • Species lists and observations by survey (season); • Relative use by species, species groups, and season; • Mean frequency of occurrence and species composition; • Spring/Summer/Fall use, frequency of occurrence and species composition; • Exposure indices by species and species group; • Mean flight characteristics by species and species group; • Wildlife observed in the study area
The number of raptors and other species seen during each point count survey was standardized to a unit area and unit time searched. For example, if 4 raptors are seen during the 30 minutes at a point with a viewing area of 2.01 km2, these data may be standardized to 4/2.01 = 1.98 raptors/km2 in a 30-minute survey.

Avian Study Protocol and Final Report EURUS Combine Hills Turbine Ranch
WEST, Inc. 10
The frequency of occurrence by species was calculated as the percent of surveys in which a particular species was observed. Species composition was represented by the mean use for a species divided by the total use for all species and multiplied by 100 to provide percent composition. Frequency of occurrence and percent composition provide relative estimates of the avian diversity of the study area. A particular species may have high use estimates of the site based on just a few observations of large flocks, however, the frequency of occurrence will indicate that it occurs during very few of the surveys and therefore, may be less likely affected by the project. A relative index to collision exposure (R) was calculated for bird species observed during the fixed-point surveys using the following formula:
R = A*Pf*Pt
Where A = mean relative use for species i (observations within 800 m of observer) averaged across all surveys, Pf = proportion of all observations of species i where activity was recorded as flying (an index to the approximate percentage of time species i spends flying during the daylight period), and Pt = proportion of all flight height observations of species i within the rotor-swept area (RSA). This index does not account for differences in behavior other than flight characteristics (i.e., flight heights and percent of birds observed flying). Data were plotted (means and standard deviation) to illustrate differences in raptor and other bird use between survey period and stations. Seasons were defined as follows: spring, March 16 - May 15; summer, May 16 - August 15; fall, August 16 - October 31; and winter, November - March 15. Maps of bird use intensity by observation point and within the 800 m boundary of each point were developed to look at spatial use of the study area by species of interest. Further information potentially useful for aiding turbine placement may be derived from analysis of the habitat and topographic data (e.g., habitat types, distance to water, etc.) if deemed necessary. Habitats or other topographic variables that are related to use by birds were identified where possible. 4.4 Reporting and Decision Standards This baseline study provides data for describing the temporal and spatial use by birds of the study area and in evaluating the probable impact of wind power development in the area. These data are summarized in two written reports: an interim report of results through approximately the first year of study (Young et al. 2002) and a final report incorporating results of all years (this report). Information from these baseline studies and reports has been incorporated into the permitting documents being prepared for the Project. The avian effects analysis for the Project is based primarily on the results of these baseline studies. These data also provide a baseline against which comparisons can be made with data collected by the same protocol following Project construction and operation if appropriate and necessary.

Avian Study Protocol and Final Report EURUS Combine Hills Turbine Ranch
WEST, Inc. 11
5.0 RESULTS The baseline studies as described above were initiated in late April 2001 with the commencement of spring migration avian use surveys, sensitive species surveys, and raptor nest aerial survey. The avian point count (raptor and large bird) surveys were initiated in June 2001 and the fall migration avian use surveys in September 2001. Because of the addition of new property not included in the original Project area, the different study components have been conducted along different time frames depending on location. For example, the five pair-points and one fixed-point in the expansion area were surveyed primarily in the year 2002. Completion of one year of surveys for the expansion area fixed-point was in January 2003. This final report incorporates data from all surveys for all years. Interim results varied slightly based on the number of surveys included in the analysis and can be found in Young et al. 2002. 5.1 Breeding and Spring and Fall Migration Avian Use Surveys Between May 1 and May 22, 2001 three spring migration surveys were conducted for each turbine and offset point for the initial 23 paired points and two full surveys were completed in the transit area between the turbine and offset points. (Note: surveys of the transit area were initiated after the start of turbine and offset point surveys. All of the transit areas were surveyed two times and a few were surveyed three times). Between April 16 and May 24, 2002, two spring surveys were completed of all 28 paired-plot stations and transit areas between points. One breeding survey was completed for 2001, between June 9 and June 30, and one in 2002, between June 24 and July 10, for the same points as the spring. Between September 11 and October 11, 2001 three fall migration surveys were conducted on the 23 initial points and three more were conducted between October 1 and October 30, 2002 on the five additional points. The number of flocks, the total number of individuals observed, and the mean density were used to calculate avian use of the turbine and offset points. 2786 total observations in 1607 different groups (flocks) were observed during the paired-plot surveys in 2001 and 2002 (Table 1). These are simply raw counts of observations, that were not standardized by the number of hours of observation or distance from observer, but do provide an overall list of species and numbers observed. Because individual birds were not marked, these counts do not distinguish between individuals; rather, they provide an estimate of use. A total of 65 avian species and an additional 8 unidentified bird types (best possible identifications, e.g. unidentified buteo) were observed during the paired-plot surveys (Table 1). Horned lark and western meadowlark were the most numerous species observed, comprising 44.7% and 21.3% of all groups and 43.9% and 14.5% of all birds observed respectively. Passerines were the most common group observed comprising 82.6% of all groups and 84.9% of all birds observed. Raptors comprised 9.0% of all groups and 5.7% of all birds observed. Waterfowl, waterbirds, and shorebirds only comprised 0.4% of all groups and 2.9% of all birds observed.

Avian Study Protocol and Final Report EURUS Combine Hills Turbine Ranch
WEST, Inc. 12
5.1.1 Avian Use Reference to abundance refers to the use estimates and not absolute density or numbers of individuals. Avian use by species was calculated as the mean number of observations per 10-minute survey within 100 m of the point (Tables 2a-d). Based on use, the three most abundant species observed during the spring paired-plot surveys in 2001 and 2002 were horned lark (2.008 detections/10-minute survey), western meadowlark (0.408), and grasshopper sparrow (0.088). Together these species comprised more than 79% of the total use. As expected, passerines were the most abundant group observed with approximately 3 individuals seen during each 10-minute survey (Table 2a). The most abundant raptors, within 100 m of the plots during the spring paired-plot surveys, were red-tailed hawk (0.019), American kestrel (0.016), and northern harrier (0.011). As a group, raptors were the second most abundant with 0.06 observed/10-minute survey (Table 2a). Based on use, the three most abundant species observed during the June (breeding) paired-plot surveys in 2001 and 2002 were horned lark (2.531 detections/10-minute survey), western meadowlark (0.322), and American goldfinch (0.109). Together these species comprised more than 81% of the total use. As expected, passerines were the most abundant group observed with approximately 3.4 individuals seen during each 10-minute survey (Table 2b). While several raptors were observed during the breed surveys (Table 1) most were seen greater than 100 m from the plot center. American kestrel (0.059), red-tailed hawk (0.05), and northern harrier (0.039) were seen within 100 m of the plots during the breeding surveys. As a group, raptors were the second most abundant with 0.148 observed/10-minute survey (Table 2b). Based on use, the three most abundant species observed during the fall paired-plot surveys in 2001 and 2002 were horned lark (2.459 detections/10-minute survey), Brewer’s blackbird (0.301), and dark-eyed junco (0.275 survey). Together these species comprised approximately 63% of the total use during the fall paired-plot surveys. As expected, passerines were the most abundant group observed with more than 4.5 individuals seen during each 10-minute survey (Table 2c). Again several raptors were observed during the fall paired-plot surveys (Table 1), but most were seen greater than 100 m from the plot center. Northern harrier and red-tailed hawk were the most abundant within 100 m of the plots during the fall paired-plot surveys but in low numbers (0.029 and 0.018 respectively). As a group, raptors were the third most abundant behind passerines and waterfowl/waterbird with 0.062 observed/10-minute survey (Table 2c). The paired-plot survey was set up so that one point of each pair was located at a proposed turbine location (ridge top) and one point off-set approximately perpendicular to the turbine string by 300 m (ridge slope or valley). This design will enable post construction displacement effect monitoring if necessary. Use was calculated separately for the turbine points and the offset points by taxonomic group for possible future use in understanding possible displacement effects (Table 3). The turbine points (4.15) indicated higher overall use compared to the offset points (3.60) for all bird groups.

Avian Study Protocol and Final Report EURUS Combine Hills Turbine Ranch
WEST, Inc. 13
5.1.2 Frequency of Occurrence and Species Composition Frequency of occurrence and percent composition provide relative estimates of the avian diversity of the study area. The frequency of occurrence was calculated as the percent of surveys where a particular species was observed (Tables 2a-d). Species composition is represented by the mean use for a species divided by the total use for all species and multiplied by 100 to provide percent composition (Tables 2a-d). In 2001 and 2002, only two species, horned lark and western meadowlark, were observed in more than one-third (94.2% and 39.9%, respectively) of the spring surveys; and only 4 other species were observed in 5% or more of the surveys, grasshopper sparrow (12.5%), savannah sparrow (7.0%), rock wren (5.8%), and white-crowned sparrow (5.1%). These six species made up over 84% of the avian use during the spring paired-plot surveys. The majority of species were observed in less than 5% of the surveys (Table 2a). In 2001 and 2002, only two species, horned lark and western meadowlark, were observed in more than one-third (97.8% and 41.1%, respectively) of the breeding surveys. Six other species were observed in 5% or more of the surveys, grasshopper sparrow (13.3%), rock wren (6.2%), red-tailed hawk (5.9%), northern harrier (5.6%), bank swallow (5.6%), and common nighthawk (5.6%). These eight species made up nearly 86% of the avian use during the paired-plot surveys. The majority of species were observed in less than 5% of the surveys (Table 2b). In 2001 and 2002, only one species, horned lark, was observed in more than one-third (87.7%) of the fall surveys. Seven other species were observed in 5% or more of the surveys, western meadowlark (13.8%), American goldfinch (13.7%), dark-eyed junco (8.6%), rock wren (6.9%), vesper sparrow (6.2%), black-billed magpie (5.5%), and northern harrier (5.1%). These eight species made up greater than 69% of the avian use during the fall paired-plot surveys. Again, the vast majority of species were observed in less than 5% of the surveys (Table 2c). As a group, due primarily to the abundance of horned larks on the site, passerines comprised approximately 97% of all bird observations in the spring, nearly 94% in the breeding surveys, and over 94% in the fall and were observed in nearly all of the surveys (95%) (Tables 2a-d). Raptor use of the site as a group was relatively low with less than one raptor observed during each 10-minute survey and during approximately 12% of the surveys. Overall, based on the use estimates, raptors, as a group, only comprised approximately 2% of all avian use during the paired-plot surveys (Table 2d). 5.2 Raptor Use Surveys From June 9, 2001 to June 22, 2002, surveys were conducted at fixed-point count stations located within the study area (Figure 3) on a weekly basis. An additional station, in the eastern expansion area, was surveyed between February 8, 2002 and January 28, 2003. Results in this final report are based on all surveys for all stations.

Avian Study Protocol and Final Report EURUS Combine Hills Turbine Ranch
WEST, Inc. 14
A total of 37 avian species and an additional 3 unidentified bird types (best possible identifications, e.g., unidentified buteo) were observed during the fixed-point (raptor use) surveys (Table 4). 1,364 total observations in 598 different groups (flocks) were recorded during the surveys (Table 4). These are simply raw counts of observations, that are not standardized by the number of hours of observation or distance from the observer, but do provide an overall list of what was observed. These counts may contain duplicate sightings of the same birds. Passerines were the most numerous group; horned lark and western meadowlark were the most numerous passerines observed. Passerines comprised 49.5% of all groups observed and 48.2% of alllbirds observed during the fixed-point surveys. Raptors comprised 36.8% of all groups and 18.0% of all birds observed. Corvids (magpies, crows, and ravens) comprised 7.0% of all groups and 6.5% of all birds observed. Doves comprised 2.8% of all groups and 6.7% of all birds observed and upland game birds comprised 1.8% of all groups and 1.0% of all birds observed. Waterfowl comprised only 1.2% of all groups but 18.2% of all birds observed primarily due to a large flock of tundra swans observed flying over the study area. Other birds (waterbirds, shorebirds, nighthawks) comprised 0.8% of all groups observed and 1.4% of all birds observed. Observations varied by season (Table 4) with more species and total observations occurring in the spring and more group observations in the summer. Several species groups and in particular waterfowl, waterbirds, and shorebirds (tundra swan, ring-billed gull, and killdeer) were only observed during the spring and/or fall and were likely migrants through the area (Table 4). 5.2.1 Avian Use To standardize the data and for comparison with other similar studies, avian use, frequency of occurrence, and species composition were calculated only from observations within 800 m of the fixed-point. Avian use by species was calculated as the mean number of observations per 30-minute survey for each season (Table 5). Because individual birds were not marked, counts do not distinguish between individuals; rather, they provide an estimate of avian use of the study area. For example, if one red-tailed hawk was observed during five surveys, it is unknown if this was the same bird seen five times or five different birds seen once. However, this does provide an index of how often or frequent red-tailed hawks occur in the study area, and therefore are at risk of being impacted by the proposed Project. Any reference to abundance refers to the use estimates and not absolute density or numbers of individuals. Avian use varied across seasons (Table 5). For summer, based on use, the four most abundant species in the study area were horned lark (2.976 detections/30-minute survey), rock dove (0.667), red-tailed hawk (0.405), and western meadowlark (0.393). Together these species comprised over 79% of the total bird use during the summer (Table 6). During the fall, the four most abundant species were horned lark (1.089), rock dove (0.511), red-tailed hawk (0.289), and barn swallow (0.267). These species comprised more than 59% of the total bird use during the fall (Table 6). In the winter, the four most abundant species were horned lark (1.926), European starling (1.352), snow goose (0.315), and red-tailed hawk (0.278), which comprised approximately 72% of the total winter bird use (Table 6). In the spring, the four most abundant species were tundra swan (4.167), horned lark (1.720), common raven (0.674), and western

Avian Study Protocol and Final Report EURUS Combine Hills Turbine Ranch
WEST, Inc. 15
meadowlark (0.653). A single flock of tundra swans estimated at 200 was observed flying over the study area (Table 4), which caused the unusually high use estimate for this species. These species comprised approximately 75% of the total bird use for the spring (Table 6). Over all surveys and season, the four most abundant species based on use were horned lark (2.006), tundra swan (1.042), rock dove (0.366), and red-tailed hawk (0.363), comprising approximately 62% of total use. Use by tundra swans was due to one occurrence of a single large flock. If this species is dropped, the next most common species was western meadowlark (0.361). Passerines were the most abundant group observed in all seasons except spring1(Table 6). The most abundant passerines observed was horned lark (401 total individuals counted), European starling (86 individuals) and western meadowlark (75 individuals) (Table 4). Raptors were the second most common group in the summer, fall, and winter and third behind waterfowl, and passerines in the spring (Table 6) with red-tailed hawk (95 individuals) the most common, followed by northern harrier (34 individuals), and American kestrel (32 individuals) (Table 4). Mean use for passerines and raptors, the two most abundant groups based on use (Table 5), was plotted by survey period. Passerine use was highest in the early summer, decreased through the summer and generally followed a steady increase through the fall, winter, and spring (Figure 6). Raptor use fluctuated throughout the study period with the highest use occurring in early spring (Figure 7). Mean use for these two groups was also plotted by survey station. Passerine use varied across stations and was highest at points 16, dominated by agriculture, and 28 a mix of scab (lithosol) and agriculture (Figure 8). Raptor use was fairly constant across plots (Figure 9). 5.2.2 Frequency of Occurrence and Species Composition Frequency of occurrence was calculated as the percent of surveys in which a particular species was observed (Table 7). Species composition was calculated as the mean use for a species divided by the total use for all species and multiplied by 100 to provide percentage (Table 6). Frequency of occurrence and percent composition provide relative estimates of the avian diversity of the study area. For example, overall surveys, only three species were observed in more than or approximately 25% of the surveys, horned lark (48.2%), red-tailed hawk (27.1%), and western meadowlark (24.5%). These species made up more than 44% of all bird use (Table 6). The majority of species were observed in less than 5% of the surveys (Table 6). The most frequently observed raptor was red-tailed hawk (27.11% of surveys) comprising 5.91% of the total avian use, followed by American kestrel (12.0% of all surveys) which comprised 2.41% of the total use and Northern harrier (11.48% of surveys) which comprised 2.47% of the total use. As a group, due primarily to the abundance of horned larks on the site, passerines comprised over half (51.31%) of the avian use (Table 6) and were observed in approximately 57% of all the surveys (Table 7). Raptor use of the site, as a group, was slightly less than one raptor observed during each 30-minute survey (Table 5). Raptors comprised approximately 14.9% of the avian use (Table 6) and were observed in approximately 54% of the surveys (Table 7).
1 The large flock of tundra swans observed in the spring made waterfowl the most abundant spring group based on use.

Avian Study Protocol and Final Report EURUS Combine Hills Turbine Ranch
WEST, Inc. 16
Frequency of occurrence for passerines and raptors, the two most abundant groups based on use (Table 7), was plotted by survey period. Passerine occurrence was highest in late spring and early summer when they were observed in 100% of the surveys; however, it dropped through the summer and fall and was lowest in late fall (Figure 6). Raptor occurrence tended to be steadier through the study period, with the peak in late winter/early spring (Figure 7). Frequency of occurrence for these two groups was also plotted by survey station. Passerine and raptor occurrence was generally steady across the survey stations (Figures 8 - 9). An additional index of species diversity is the mean number of species observed per survey. In general, the mean number of species per survey declined through the summer, fall and early winter and climbed through the late winter and spring periods (Figure 10). The lowest number of species per survey occurred in mid winter. 5.2.3 Flight Height Characteristics The proportion of observations of a species flying within the turbine rotor swept area provides a rough estimate of the propensity of a species to fly within the zone of risk (Table 8). Several potential turbines and tower heights have been identified for possible use in the project. Using the range of tower heights and rotor diameters, we identified the “zone of risk” to include the area from approximately 25 m above ground level (AGL) to 125 m AGL, which is the union of rotor swept area heights for smaller and larger turbines as well as variable tower heights. This range was a conservative estimate that included a small buffer of approximately 2 m on the lower and higher limits. Most of the passerines observed, with the exception of a few groups of swallows, pipits, and goldfinches, were usually observed flying less than 25 meters AGL (Table 8). Larger birds tend to fly higher, and frequently flew greater than 25 meters high, which is within the primary zone of influence identified. For those groups with greater than two observations, corvids were most often observed in the zone of risk (62.3%), followed by raptors (58.6%), and doves (27.9%) (Table 9). Passerines as a group were less likely to be observed within the zone of risk (19.0%) (Table 9). 5.2.4 Exposure index The exposure index is a relative measure of the risk of each species observed on-site during the fixed-point surveys coming in contact with a turbine, based on the use (measure of abundance) of the site by the species and the flight characteristics observed for that species. Red-tailed hawk, horned lark, and common raven had the highest exposure indices (Table 10). The majority of red-tailed hawk and common raven were observed within the zone of risk and observed flying while horned lark was the most common (highest use) species on the site (Table 8). 5.2.5 Spatial Use Point of first observation, approximate flight paths, and perch locations were mapped for raptors and large birds observed in the project area (Figures 11-13). The objective of mapping bird locations was to look for areas of concentrated use by raptors and large birds. Red-tailed hawks were the most common raptor observed. Most red-tailed observations (and other buteos) were

Avian Study Protocol and Final Report EURUS Combine Hills Turbine Ranch
WEST, Inc. 17
fairly evenly distributed across the study area (Figure 11). In some areas a northwest-southeast pattern of flight paths were evident where red-tails were following the prevailing topographic ridgelines (Figure 11). In most cases the actually flight path was along the windward face (west) of the ridge and it was likely the bird was using updrafts to aid in flight while hunting. Northern harrier and American kestrel were other common raptors observed. Both species were fairly evenly distributed across the study area (Figure 12). No strong association of use with topographic features of the site were noted by other raptors or other large birds. 5.3 Aerial Raptor Nest Surveys Two aerial surveys for raptor nests were completed within the raptor nest study area (the WRA plus five-mile radius buffer). The first survey was conducted on April 27 and 28, 2001; the second survey was conducted on June 13, 2001. The total area surveyed was approximately 545 km2 (210 square miles) (Figure 4). A total of 95 raptor or large stick nests were located from the air, 50 of which were classified as active nests during the first survey (Table 13). Nest density for buteos (ferruginous hawk, red-tailed hawk, Swainson’s hawk) was approximately 0.07 nest/km2 (0.18 nest/mi2). Nest density for all raptors located (buteos, falcons, owls) was approximately 0.09 nest/km2 (0.24 nest/mi2). Two burrowing owl nests were located in the study area during other activities. The fate of one of these nests was unknown; the second nest fledged five young. Five great horned owl and four barn owl nests were also found, however, the fate of these nests were unknown since they were unoccupied during the second nest survey. It is likely that many of these fledged young prior to the second survey. Also the fate of several buteo nests could not be determined as there were no birds present at these nests during the second survey. Swainson’s hawks generally nest later than other buteos and many of the Swainson’s hawk nests in the study area had not produced young by the second visit. While these nest success rates are based on relatively small sample sizes, they provide an estimate of approximate nest success (i.e., percent of nests that are successful by species), and a record of successful breeding by several raptor species in the study area. In general, the raptor nest study area contained relatively moderate habitat in terms of nest site availability. A portion of the Walla Walla River riparian corridor fell within the northern part of the survey area (Figure 4). There were also several small to medium cliffs and numerous patches of trees, power poles, and rocky outcrops scattered through the study area. The aerial survey method facilitates/enables locating nests which are easily seen from the air and generally focuses on locating suitable raptor nest structures. Ground nesting species are usually missed with this type of survey. It is likely that additional ground nesting species such as northern harriers, short-eared owls, and burrowing owls nest within the survey area. Therefore the actual raptor nest density for the study area is likely higher. 5.4 Sensitive Species Surveys All native grass or shrub steppe habitat within 300 m of the proposed turbine strings, access roads, and substation was surveyed for sensitive species twice between May 1 and June 8, 2001. Within the new area, all native grassland or shrub steppe was surveyed between April 25 and

Avian Study Protocol and Final Report EURUS Combine Hills Turbine Ranch
WEST, Inc. 18
May 15, 2002. Approximately, 3,863 acres were surveyed (Figure 5). During these surveys one Washington ground squirrel colony, three white-tailed jackrabbits, two burrowing owls, and 34 grasshopper sparrows were located (Table 14, Figure 5). No sagebrush lizards were located during the surveys. Both of the burrowing owls were found outside the proposed development area but within the raptor nest survey area while observers were traveling between survey areas. The Washington ground squirrel colony was located outside the development area but within the 300m buffer of a turbine string. The Washington ground squirrel colony that was located was periodically visited to check for signs of activity. Information about ground squirrel activity at the known colony was used to determine when surveys were likely to be ineffective in locating new colonies. Ground squirrel alarm calls were heard in the colony on May 29 and ground squirrel scat near burrow entrances was located in the colony on June 4, 2001. Based on this information, no additional ground squirrel surveys were conducted in the proposed development area after June 8, 2001. The current disposition of the colony is unknown; however, it will not be affected by the Project 5.5 White-tailed Jackrabbit Surveys Nocturnal spotlight surveys for white-tailed jackrabbits were conducted in August and September 2001; the expansion area was surveyed in September 2002. Approximately 3,863 acres were surveyed, the same area as the sensitive species surveys (see above). During the surveys a total of seven individual white-tailed jackrabbits were detected (Figure 5). The sightings occurred primarily in grassland steppe/shrub steppe habitats although one individual was observed in wheat stubble. 5.6 Rare Plant Survey The rare plant field surveys did not locate any federal or state endangered, threatened, proposed, or candidate plant species (Eagle Cap Consulting, Inc. 2001). Habitat was unsuitable for the threatened Ute ladies’-tresses orchid. The surveys located five populations of one ONHP List 2 rare plant species, rosy balsamroot (Balsamorhiza rosea). All five populations were restricted to shallow soiled lithosol (scab) habitats, occurring on ridgetops and upper west facing slopes. An estimated total of 13,375 plants were found with a total population area of approximately 34 hectares (84 acres). Detailed results of the rare plant survey are presented in Eagle Cap Consulting, Inc. (2001). The rare plant surveys in the expansion area also did not locate any federal or state endangered, threatened, proposed, or candidate plant species. In addition, no rosy balsamroot plants were located in the expansion area, which does not contain suitable habitat for the species (shallow soiled lithosol). Habitat in the expansion area was also unsuitable for Ute ladies’-tresses orchid. 5.7 Habitat and Vegetation Mapping Two basic habitat types occur in the study area (area within 300 m of proposed project features), agriculture and steppe (Table 15). There is also some riparian habitat that occurs in the area but

Avian Study Protocol and Final Report EURUS Combine Hills Turbine Ranch
WEST, Inc. 19
outside the 300 m buffer (Figure 14). The agriculture type is comprised of two vegetation types, cropland and CRP land. The steppe type is comprised of three vegetation types, grassland steppe, shrub steppe, and lithosol or scab. In some areas the steppe habitat is a mosaic of the different types and mapped as shrub/grassland steppe. The shrub steppe type was further broken down in to sagebrush stands and sagebrush steppe which was rare in the study area (Figure 14). Agriculture was the most abundant vegetation type with approximately 1,722 acres in the study area (Table 15). Lithosol or scab shortgrass steppe was the second most common type with approximately 1,210 acres, followed by shrub steppe (420 acres), and shortgrass (321 acres). Shrub steppe/grassland steppe mosaic areas were approximately 105 acres and areas dominated by sagebrush were approximately 85 acres. CRP lands occur near the Project area but not within the 300 m buffer of the proposed project features. Descriptions of the vegetation types are as follows:
Agricultural dry - non-irrigated cropland, mostly wheat Agriculture CRP - Conservation Reserve Program lands Grassland-steppe - shortgrass lacking a substantial shrub component Grassland-steppe/scab - predominantly lithosol with intermittent bunchgrass clumps Shrub-steppe - grassland steppe intermixed with shrubs; rabbitbrush or sagebrush Sagebrush - shrub steppe dominated by sagebrush (Artemisia spp.)
Habitats in the expansion area are similar to those found in the remainder of the project area, however, no active cropland is present and no grassland-steppe/scab is present. A small amount of riparian habitat is present near the devlopement areas, associated with Pine Creek which bisects the north east corner of the Project. Cattle grazing occurs throughout the expansion area. 5.8 General Wildlife Observations Avian species of interest were recorded when observed on-site during periods when observers were traveling to survey points, in-transit between survey points, or on-site for other purposes (Table 16). No federally listed threatened or endangered species were observed in the Project area. Several Oregon state species of concern were observed incidentally (as well as during scheduled surveys) in the Project including common nighthawk, grasshopper sparrow, golden eagle, and bank swallow. Several avian species of interest were observed on-site outside of the scheduled surveys, including great-horned owl, red-tailed hawk, and golden eagle. A golden eagle was seen periodically during the winter and spring and could have been a transient or resident, however, no eagle nests were located in the raptor nest survey area. Six species of mammals, mule deer (Odocoileus hemionus), Ord’s kangaroo rat (Dipodomys ordii), deer mouse (Peromyscus maniculatus), long-tailed weasel (Mustela frenata), badger (Taxidea taxus), northern pocket gopher (Thomomys talpoides), and two species of reptiles, gopher snake (Pituophis melanoleucus), and yellow-bellied racer (Coluber constrictor) were recorded in the Project during the studies (Table 16). The kangaroo rats, deer mice, and long-tailed weasels were seen during nocturnal spotlight surveys for white-tailed jackrabbits. The pocket gopher was found dead near a burrowing owl nest located in the raptor nest survey area.

Avian Study Protocol and Final Report EURUS Combine Hills Turbine Ranch
WEST, Inc. 20
6.0 DISCUSSION AND SUMMARY The baseline studies for avian and sensitive species for the Eurus Combine Hills Turbine Ranch were initiated in the Spring of 2001 and some survey work continued on the site until January 2003. An interim report, which was incorporated into the permit application, presented preliminary results for the avian use surveys and final results for the raptor nest survey, sensitive species surveys, rare plant surveys, and habitat mapping (see Young et al. 2002). Results and discussion in this report reflect a compilation of all surveys for the study area. Future avian and sensitive species surveys for the project area will be on an as needed basis, for example, due to a change in project design plans, or for post construction project monitoring. 6.1 Avian Use and Diversity Based on the fixed-point surveys over all seasons, three common species made up the majority of observations: horned lark, red-tailed hawk, and western meadowlark. These three were the only species observed in greater than 25% of the surveys and comprised approximately 44% of all avian use at the site. Seasonally, bird use varied but only a few other species were seen in more than 5% of the surveys. On average, approximately 2 horned larks, 0.4 western meadowlarks, and 0.4 red-tailed hawks were observed during every 30-minute survey. As a group passerines were the most common with approximately 51% of all bird use at the site being passerines. There was increasing trend in passerine use from late summer through the fall, winter, and spring with a decreasing trend though the middle of the summer (Figure 6). Raptors as a group comprised approximately 15% of all bird use and raptor use fluctuated more than passerine use through the seasons (Figure 7). Over all seasons, the most abundant raptor observed was red-tailed hawk. In general, raptor use was similar to slightly higher than other wind plants studied and is likely due to the number of raptor nests within 5 miles of the proposed development. There were a total of 24 active red-tailed hawk nests found within the raptor nest study area, which may have the most influence on the higher raptor use observed (Table 13). The paired-plot surveys also showed relatively low species diversity on the site with one species, horned lark, making up the majority of the observations (Table 1). Horned lark and western meadowlark were the only species observed in greater than 25% of the paired-plot surveys and comprised well over one-half of all birds observed (64.3%) (Table 2d). Overall, raptors as a group comprised less than 1% of total use. Raptor use tended to be lower because only observations within 100 m of the plot center were used in the paired-plot analyses. Most of the raptors were seen at distances greater than 100 m from the observer. In contrast, due to the abundance of horned larks, passerines comprised nearly 95% of all bird use with approximately 4 passerines observed during each 10-minute survey. More passerines species were identified which led to higher group use. There was some concern over potential effects of the project on migrant birds moving through the area. The paired-plot surveys were designed to target migrant and breeding passerine species that occupied the site. Use estimates from these surveys reflect the fixed-point survey results with horned lark being the most common species observed and low species diversity on the site.

Avian Study Protocol and Final Report EURUS Combine Hills Turbine Ranch
WEST, Inc. 21
While some species observed during the spring and fall paired-plot surveys were obvious migrants (e.g., black-headed grosbeak, common yellowthroat, dark-eyed junco, golden crowned kinglet) based on habitat preferences for these species, the frequency of their occurrence was very low. Also, other post construction mortality studies at existing wind plants do not indicate that migrant birds are at extraordinary risk from wind plants (see Erickson et al. 2001). Based on this information and the site surveys, the proposed wind plant is not expected to pose a large risk to migrant birds. 6.2 Raptor Nest Density The index of raptor nest density for the study area [0.09 nest/km2 (0.24 nest/mi2)] is slightly higher than other wind plants that have been studied. For example, the raptor nest density in a 10-mile buffer surrounding the Foote Creek Rim Wind plant in Wyoming is 0.07 nest/km2 (0.19 nest/mi2) (Johnson et al., 2000b). Raptor nest density within a 2-mile buffer around the Stateline Wind plant in Oregon and Washington is 0.08 nest/km2 (0.20 nest/mi2) (URS and WEST 2001), and raptor nest density within a 5-mile buffer around the proposed Maiden Wind Farm in Benton County, Washington was approximately 0.06 nest/km2 (0.16 nest/mi2) (Young et al. 2001b). The slightly higher raptor nest density appears to be due to the proximity of the Walla Walla river valley and riparian habitat (i.e., trees) within the northern portion of the study area (Figure 4). 6.3 Risk of Turbine Collision 6.3.1 Exposure Index The species with the highest exposure indices for the site were common raven, red-tailed hawk, American goldfinch, and horned lark (Table 10). The majority of red-tailed hawks, common ravens, and American goldfinchs were observed within the zone of risk and observed in flight. Horned lark was by far the most abundant species observed. Mortality studies at other wind plants have commonly found horned-lark and red-tailed hawk casualties but few goldfinches or common ravens (see Erickson et al. 2001). Although ravens are often observed at wind plants within the zone of risk, they appear to be less susceptible to collision with wind turbines than other similar size birds (e.g., raptors, waterfowl). Horned lark is, however, a common casualty observed at other wind plants most likely due to the abundance of this species in habitats commonly found at wind plants.

Avian Study Protocol and Final Report EURUS Combine Hills Turbine Ranch
WEST, Inc. 22
6.3.2 Raptors Raptor use of the site was similar to slightly higher than other wind plants studied. As a group, raptor use of the Project area was approximately 0.901 raptors observed per 30-minute survey or roughly one raptor observed every survey. For comparison, raptor use at four other wind plants studied with the same methods2 varied from slightly lower to much higher. Raptor use at the Vansycle wind plant, Oregon was approximately 0.55 raptors per 30-minute survey; at the proposed Maiden wind plant, Washington raptor use was 0.68 raptors per 30-minute survey, at the Buffalo Ridge wind plant, Minnesota, raptor use was approximately 0.74 raptors per 30-minute survey; and at the Foote Creek Rim wind plant raptor use was approximately 1.10 raptors per 30-minute survey. Based on the relatively moderate use of the Project area by raptors, potential raptor mortality for this Project may be higher than indicated by other wind plant studies. The higher raptor nest density in the area around the proposed Project likely contributes to the relatively high raptor use estimates. The presence of nearby nests may put adult birds of nesting pairs at greater risk while they actively attend young in the nest and may put fledgling juveniles at risk due simply to their inexperience and proximity to turbines. The raptors expected to be most at risk of collision are the species most abundant in the study area, red-tailed hawk and American kestrel. Both of these species have also been casualties at other studied wind plants (see Erickson et al. 2001). However, raptor mortality at other newer-generation wind projects is very low. The estimate of raptor mortality at the Foote Creek Rim wind plant in Wyoming is the highest observed and is 0.036 raptors per turbine per year based on a two-year study of 69 turbines (Erickson et al. 2001). No raptor mortality was observed at the nearby Vansycle wind plant (Oregon) during a one-year study (Erickson et al. 2000), and no raptor fatalities were reported through a less intensive incidental reporting system during 2000 at the Vansycle plant. At the Buffalo Ridge wind plant in Minnesota, 0.001 raptors per turbine per year were found during a four-year study (Erickson et al. 2001). Considering these mortality results as well as raptor use estimates at these projects, it is estimated that potential mortality of raptors at the proposed Project would be less than one-half that of the Foote Creek Rim project (or less than 0.016 raptors per turbine per year); approximately equal to that of the Buffalo Ridge project (or approximately than 0.001 raptor per turbine per year); or slightly greater than that of the Vansycle project (or greater than 0 raptors per turbine per year). Using these raptor mortality rates, a range of 0 to 2 raptor fatalities per year at the proposed Project may occur if 100 turbines are constructed.
2 Fixed-point surveys were conducted following the same methods at all four wind plants but had variable survey duration. The calculated use at these wind plants was standardized to 30-minute duration surveys under the assumption that raptor observations were uniform across time for each survey period.

Avian Study Protocol and Final Report EURUS Combine Hills Turbine Ranch
WEST, Inc. 23
6.3.3 Passerines Passerines (primarily perching birds) have been the most abundant avian fatality at some other Projects studied (see Johnson et al. 2000, Young et al. 2001, Erickson et al. 2000), often comprising more than 80% of the avian fatalities. Both migrant and resident passerine fatalities have been observed. Given that passerines make up the vast majority of the avian observations on-site, passerines would likely make up the largest proportion of fatalities. Common species such as horned larks and western meadowlarks (confirmed casualties at other wind plants) would be most at risk. Nocturnal migrating species may also be at risk, but are not be expected to be found in large numbers based on data collected at other projects (i.e., no large mortality events documented, see Erickson et al. 2001). 6.3.4 Waterfowl Some waterfowl mortality has been documented at other wind plants (Johnson et al. 2000); although studies at Foote Creek Rim, Vansycle, or Buffalo Ridge have not documented mortality of Canada geese, the most frequently observed waterfowl species observed flying over the Project area. Because of the low use of the site by waterfowl, no waterfowl mortality is expected from the Project. 6.3.5 Other Groups/Species Other avian groups occur in relatively low numbers within the Project area and mortality would be expected to be low. Other species only observed during migration may be at risk, however mortality is expected to be low given the low use estimates by other species.

Avian Study Protocol and Final Report EURUS Combine Hills Turbine Ranch
WEST, Inc. 24
7.0 REFERENCES AND LITERATURE CITED Eagle Cap Consulting Inc. 2001. An Investigation of Rare Plant Resources Associated with the Eurus-Vansycle
Wind Power Project – Umatilla County, Oregon. Technical Report prepared by: Eagle Cap Consulting, December 3, 2001.
Erickson, W. P., G. D. Johnson, M. Dale Strickland, and Karen Kronner. 2000. Avian and bat mortality associated
with the Vansycle Wind Project, Umatilla County Oregon. 1999 study year. Technical report submitted to Umatilla County Department of Resource Services and Development, Pendleton, Oregon. 22 pp.
Erickson, W.P., G.D. Johnson, M.D. Strickland, D.P. Young, Jr., K.J. Sernka, R.E. Good. 2001. Avian Collisions
with Wind Turbines: A Summary of Existing Studies and Comparisons to Other Sources of Avian Collision Mortality in the United States. National Wind Coordinating Committee (NWCC) Resource Document. August 2001.
FPL Energy Inc., W.P. Erickson and K. Kronner. 2001. Avian and bat monitoring plan for the Washington portion
of the Stateline Wind Project. Technical Report prepared for Walla Walla Regional Planning Department. May, 2001.
Franklin, J.F. and C.T. Dyrness. 1988. Natural vegetation of Oregon and Washington. Oregon State University
Press, Corvallis, Oregon. 452 pp. Johnson, G.D., W. P. Erickson, M. D. Strickland, M. F. Shepherd and D. A. Shepherd. 2000a. Avian Monitoring
Studies. Buffalo Ridge, Minnesota Wind Resource Area, 1996-1999, Results of a 4-year Study. Technical Report prepared for Northern States Power Co., Minneapolis, MN. 212 pp.
Johnson, G.D., D. P. Young, Jr., W.P. Erickson, C.E. Derby, M.D. Strickland, and R.E. Good. 2000b. Final Report,
Wildlife Monitoring Studies, SeaWest Windpower Project, Carbon County, Wyoming, 1995-1999. Technical report prepared for: SeaWest Energy Corporation, San Diego, California and Bureau of Land Management, Rawlins, Wyoming. August 9, 2000.
Richardson, S.A. 1996. Washington State Recovery Plan for the Ferruginous Hawk, August 1996. Washington
Department of Fish and Wildlife, Olympia, Washington. Reynolds, R.T., J.M. Scott, and R.A. Nussbaum. 1980. A Variable Circular-Plot Method for Estimating Bird
Numbers. Condor 82(3): 309-313. The Nature Conservancy (TNC). 1999. Biodiversity Inventory and Analysis of the Hanford Site. Final Report:
1994-1999. The Nature Conservancy of Washington, The Bullitt Foundation, and The Northwest Fund for the Environment, Seattle Washington.
URS and WEST. 2001. Avian baseline study for the Stateline Project, Vansycle Ridge, Oregon and Washington.
Technical report prepared for ESI Vansycle Partners, L.P. Young, Jr., D.P., W.P. Erickson, G.D. Johnson, M.D. Strickland, and R.E. Good. 2001a. Final Report, Avian and
Bat Mortality Associated with the Initial Phase of the Foote Creek Rim Windpower Project, Carbon County, Wyoming. November 3, 1998 – December 31, 2000. Technical report prepared by WEST, Inc. for SeaWest Windpower, Inc, San Diego, California and Bureau of Land Management, Rawlins, Wyoming. October 1, 2001.
Young, Jr. D.P., W.P. Erickson, K.J. Sernka, K. Bay, R.E. Good and K. Kronner. 2001b. Interim Report Baseline
Avian Studies for the Proposed Maiden Wind Project, Yakima and Benton Counties, Washington. Technical Report prepared for Bonneville Power Administration, Portland, Oregon.

Avian Study Protocol and Final Report EURUS Combine Hills Turbine Ranch
WEST, Inc. 25
Young, Jr., W.P. Erickson, J.D. Jeffrey, K. E. Bay, M. Bourassa. 2002. Avian and Sensitive Species Baseline Study
Plan and Interim Report, TPC Combine Hills Turbine Ranch, Umatilla County, Oregon. Technical report prepared for Tomen Power Corporation, USA, San Diego, California, and Aeropower Services, Inc. , Portland, Oregon. Prepared by Western EcoSystems Technology, Inc., Cheyenne, Wyoming. August 20, 2002.

Avian Study Protocol and Final Report EURUS Combine Hills Turbine Ranch
WEST, Inc. 26
Table 1. Avian species observed while conducting paired-point surveys for 2001 and 2002 on the Eurus Combine Hills Turbine Ranch Site.
Spring1 June2 Fall3 Overall # groups # detects # groups # detects # groups # detects # groups # detects
Waterfowl/Waterbirds 1 1 0 0 3 72 4 73 Canada goose 0 0 0 0 3 72 3 72 great blue heron 1 1 0 0 0 0 1 1 Shorebirds killdeer 0 0 0 0 3 8 3 8 Raptor 62 70 39 45 43 45 144 160 Cooper's hawk 2 2 0 0 0 0 2 2 sharp-shinned hawk 1 1 0 0 2 2 3 3 ferruginous hawk 3 3 2 2 0 0 5 5 red-tailed hawk 32 39 19 20 11 12 62 71 rough-legged hawk 2 2 0 0 1 1 3 3 Swainson's hawk 1 1 0 0 3 3 4 4 unidentified buteo 5 6 2 2 3 3 10 11 golden eagle 3 3 0 0 1 1 4 4 American kestrel 6 6 11 15 10 11 27 32 northern harrier 6 6 5 6 10 10 21 22 osprey 1 1 0 0 2 2 3 3 Corvids 21 33 15 33 32 39 68 105 black-billed magpie 6 6 8 15 23 27 37 48 common raven 15 27 7 18 9 12 31 57 Passerines 640 961 345 465 342 938 1327 2364 American goldfinch 2 6 1 10 14 45 17 61 American pipit 2 9 0 0 2 10 4 19 American robin 3 5 2 7 3 8 8 20 Baltimore oriole 0 0 1 1 0 0 1 1 bank swallow 4 27 4 7 0 0 8 34 barn swallow 3 4 1 2 19 67 23 73 black-headed grosbeak 1 1 0 0 0 0 1 1 Brewer's blackbird 0 0 1 1 7 112 8 113 Brewer's sparrow 1 1 0 0 0 0 1 1 brown-headed cowbird 1 2 0 0 0 0 1 2 Bullock's oriole 2 3 1 1 0 0 3 4 chipping sparrow 1 1 0 0 0 0 1 1 cliff swallow 4 4 0 0 0 0 4 4 common yellowthroat 0 0 0 0 1 1 1 1 dark-eyed junco 0 0 0 0 6 28 6 28 eastern kingbird 0 0 3 4 0 0 3 4 European starling 8 13 1 2 1 40 10 55 golden-crowned kinglet 0 0 0 0 1 7 1 7 grasshopper sparrow 23 23 9 9 0 0 32 32 horned lark 346 549 192 275 181 400 719 1224 house finch 0 0 0 0 1 1 1 1 lark sparrow 0 0 0 0 1 1 1 1 loggerhead shrike 0 0 0 0 1 1 1 1

Avian Study Protocol and Final Report EURUS Combine Hills Turbine Ranch
WEST, Inc. 27
Table 1. Avian species observed while conducting paired-point surveys for 2001 and 2002 on the Eurus Combine Hills Turbine Ranch Site.
Spring1 June2 Fall3 Overall # groups # detects # groups # detects # groups # detects # groups # detects
Passerines (continued) northern rough-winged swallow 6 20 2 2 0 0 8 22 red-winged blackbird 2 3 5 6 1 1 8 10 rock wren 14 16 10 11 5 5 29 32 ruby-crowned kinglet 0 0 0 0 1 3 1 3 sage thrasher 0 0 0 0 1 2 1 2 savannah sparrow 8 13 3 3 0 0 11 16 Say's phoebe 0 0 2 4 1 1 3 5 song sparrow 0 0 1 1 1 1 2 2 spotted towhee 0 0 0 0 2 2 2 2 tree swallow 0 0 1 3 0 0 1 3 unidentified blackbird 1 1 0 0 2 57 3 58 unidentified finch 1 3 0 0 0 0 1 3 unidentified flycatcher 1 1 0 0 0 0 1 1 unidentified passerine 0 0 0 0 7 20 7 20 unidentified sparrow 1 1 0 0 0 0 1 1 unidentified swallow 2 4 0 0 0 0 2 4 unidentified warbler 0 0 0 0 1 3 1 3 vesper sparrow 7 8 10 11 5 11 22 30 violet-green swallow 2 5 1 1 0 0 3 6 western flycatcher 3 5 0 0 0 0 3 5 western kingbird 2 2 4 4 0 0 6 6 western meadowlark 181 214 89 99 72 90 342 403 western wood-pewee 0 0 1 1 0 0 1 1 white-crowned sparrow 6 15 0 0 4 16 10 31 Wilson's warbler 1 1 0 0 0 0 1 1 yellow-rumped warbler 1 1 0 0 1 5 2 6 Upland gamebird 21 24 15 16 8 13 44 53 California quail 0 0 0 0 1 1 1 1 chukar 4 5 1 2 5 10 10 17 gray partridge 2 3 0 0 0 0 2 3 ring-necked pheasant 15 16 14 14 2 2 31 32 Doves 1 2 7 35 7 27 15 64 mourning dove 1 2 4 5 1 2 6 9 rock dove 0 0 3 30 6 25 9 55 other birds 0 0 10 13 1 1 11 14 common nighthawk 0 0 10 13 0 0 10 13 northern flicker 0 0 0 0 1 1 1 1 Total 746 1091 428 577 433 1118 1607 2786
1 5/1-22/01 and 4/16-5/24/02 2 6/9-30/01 and 6/24-7/10/02 3 9/11-10/11/01 and 10/1-30/02

Avian Study Protocol and Final Report EURUS Combine Hills Turbine Ranch
WEST, Inc. 28
Table 2a. Average use, frequency of occurrence, and percent composition for paired-point surveys for each species observed within 100m of the site center for 2001 and 2002.
SPRING1
Use Group / Species mean Std dev
Frequency of Occurrence
Percent Composition
Waterfowl/Waterbirds 0.000 0.000 0.0 0.0 Canada goose 0.000 0.000 0.0 0.0 great blue heron 0.000 0.000 0.0 0.0 Shorebirds killdeer 0.000 0.000 0.0 0.0 Raptors 0.059 0.068 10.4 1.9 Cooper's hawk 0.004 0.010 0.9 0.1 sharp-shinned hawk 0.000 0.000 0.0 0.0 ferruginous hawk 0.005 0.010 0.9 0.1 rough-legged hawk 0.005 0.010 0.9 0.1 red-tailed hawk 0.019 0.031 2.3 0.6 Swainson's hawk 0.000 0.000 0.0 0.0 unidentified buteo 0.000 0.000 0.0 0.0 northern harrier 0.011 0.024 2.1 0.3 golden eagle 0.000 0.000 0.0 0.0 American kestrel 0.016 0.016 3.2 0.5 osprey 0.000 0.000 0.0 0.0 Corvids 0.004 0.008 0.7 0.1 black-billed magpie 0.000 0.000 0.0 0.0 common raven 0.004 0.008 0.7 0.1 Passerines 3.057 0.915 95.1 96.5 American goldfinch 0.026 0.058 1.7 0.8 American pipit 0.039 0.087 1.7 1.2 American robin 0.009 0.020 0.9 0.3 Baltimore oriole 0.000 0.000 0.0 0.0 barn swallow 0.008 0.011 1.6 0.2 brown-headed cowbird 0.009 0.019 0.9 0.3 black-headed grosbeak 0.000 0.000 0.0 0.0 bank swallow 0.073 0.154 1.6 2.3 Brewer's blackbird 0.000 0.000 0.0 0.0 Brewer's sparrow 0.004 0.010 0.9 0.1 chipping sparrow 0.004 0.010 0.9 0.1 cliff swallow 0.008 0.011 1.6 0.2 common yellowthroat 0.000 0.000 0.0 0.0 dark-eyed junco 0.000 0.000 0.0 0.0 eastern kingbird 0.000 0.000 0.0 0.0 European starling 0.038 0.025 3.4 1.2 golden-crowned kinglet 0.000 0.000 0.0 0.0 grasshopper sparrow 0.088 0.026 12.5 2.8 house finch 0.000 0.000 0.0 0.0 horned lark 2.008 0.691 94.2 63.4 lark sparrow 0.000 0.000 0.0 0.0 loggerhead shrike 0.000 0.000 0.0 0.0 Bullock's oriole 0.000 0.000 0.0 0.0 northern rough-winged swallow 0.087 0.147 4.3 2.7

Avian Study Protocol and Final Report EURUS Combine Hills Turbine Ranch
WEST, Inc. 29
Table 2a. Average use, frequency of occurrence, and percent composition for paired-point surveys for each species observed within 100m of the site center for 2001 and 2002.
SPRING1
Use Group / Species mean Std dev
Frequency of Occurrence
Percent Composition
Passerines (continued) ruby-crowned kinglet 0.000 0.000 0.0 0.0 rock wren 0.038 0.028 5.8 1.2 red-winged blackbird 0.009 0.020 0.9 0.3 Say's phoebe 0.000 0.000 0.0 0.0 sage thrasher 0.000 0.000 0.0 0.0 savannah sparrow 0.058 0.041 7.0 1.8 song sparrow 0.000 0.000 0.0 0.0 spotted towhee 0.000 0.000 0.0 0.0 tree swallow 0.000 0.000 0.0 0.0 unidentified blackbird 0.000 0.000 0.0 0.0 unidentified finch 0.011 0.024 0.7 0.3 unidentified flycatcher 0.004 0.010 0.9 0.1 unidentified passerine 0.000 0.000 0.0 0.0 unidentified sparrow 0.000 0.000 0.0 0.0 unidentified swallow 0.014 0.032 1.4 0.5 unidentified warbler 0.000 0.000 0.0 0.0 vesper sparrow 0.032 0.027 3.4 1.0 violet-green swallow 0.004 0.010 0.9 0.1 white-crowned sparrow 0.065 0.111 5.1 2.0 western flycatcher 0.000 0.000 0.0 0.0 western kingbird 0.004 0.008 0.7 0.1 western meadowlark 0.408 0.333 39.9 12.9 western wood-pewee 0.000 0.000 0.0 0.0 Wilson's warbler 0.004 0.010 0.9 0.1 yellow-rumped warbler 0.004 0.010 0.9 0.1 Upland Gamebirds 0.039 0.048 5.2 1.2 California quail 0.000 0.000 0.0 0.0 chukar 0.018 0.028 1.8 0.6 gray partridge 0.009 0.019 0.9 0.3 ring-necked pheasant 0.013 0.020 2.5 0.4 Doves/Pigeons 0.009 0.020 0.9 0.3 mourning dove 0.009 0.020 0.9 0.3 rock dove 0.000 0.000 0.0 0.0 Other Birds 0.000 0.000 0.0 0.0 common nighthawk 0.000 0.000 0.0 0.0 northern flicker 0.000 0.000 0.0 0.0
1 5/1-22/01 and 4/16-5/24/02

Avian Study Protocol and Final Report EURUS Combine Hills Turbine Ranch
WEST, Inc. 30
Table 2b. Average use, frequency of occurrence, and percent composition for paired-point surveys for each species observed within 100m of the site center for 2001 and 2002.
June (Breeding)1
Use Group / Species mean Std dev
Frequency of Occurrence
Percent Composition
Waterfowl/Waterbirds 0.000 0.000 0.0 0.0 Canada goose 0.000 0.000 0.0 0.0 great blue heron 0.000 0.000 0.0 0.0 Shorebirds killdeer 0.000 0.000 0.0 0.0 Raptors 0.147 0.054 21.7 4.0 Cooper's hawk 0.000 0.000 0.0 0.0 sharp-shinned hawk 0.000 0.000 0.0 0.0 ferruginous hawk 0.000 0.000 0.0 0.0 rough-legged hawk 0.000 0.000 0.0 0.0 red-tailed hawk 0.050 0.009 7.7 1.4 Swainson's hawk 0.000 0.000 0.0 0.0 unidentified buteo 0.000 0.000 0.0 0.0 northern harrier 0.039 0.024 5.9 1.1 golden eagle 0.000 0.000 0.0 0.0 American kestrel 0.059 0.022 9.9 1.6 osprey 0.000 0.000 0.0 0.0 Corvids 0.000 0.000 0.0 0.0 black-billed magpie 0.000 0.000 0.0 0.0 common raven 0.000 0.000 0.0 0.0 Passerines 3.429 0.022 97.8 93.7 American goldfinch 0.109 0.154 2.2 3.0 American pipit 0.000 0.000 0.0 0.0 American robin 0.000 0.000 0.0 0.0 Baltimore oriole 0.011 0.015 2.2 0.3 barn swallow 0.019 0.026 1.9 0.5 brown-headed cowbird 0.000 0.000 0.0 0.0 black-headed grosbeak 0.000 0.000 0.0 0.0 bank swallow 0.046 0.065 5.6 1.3 Brewer's blackbird 0.009 0.013 1.9 0.3 Brewer's sparrow 0.000 0.000 0.0 0.0 chipping sparrow 0.000 0.000 0.0 0.0 cliff swallow 0.000 0.000 0.0 0.0 common yellowthroat 0.000 0.000 0.0 0.0 dark-eyed junco 0.000 0.000 0.0 0.0 eastern kingbird 0.033 0.046 2.2 0.9 European starling 0.000 0.000 0.0 0.0 golden-crowned kinglet 0.000 0.000 0.0 0.0 grasshopper sparrow 0.066 0.063 13.3 1.8 house finch 0.000 0.000 0.0 0.0 horned lark 2.531 0.018 97.8 69.2 lark sparrow 0.000 0.000 0.0 0.0 loggerhead shrike 0.000 0.000 0.0 0.0 Bullock's oriole 0.009 0.013 1.9 0.3 northern rough-winged swallow 0.020 0.002 4.0 0.6

Avian Study Protocol and Final Report EURUS Combine Hills Turbine Ranch
WEST, Inc. 31
Table 2b. Average use, frequency of occurrence, and percent composition for paired-point surveys for each species observed within 100m of the site center for 2001 and 2002.
June (Breeding)1
Use Group / Species mean Std dev
Frequency of Occurrence
Percent Composition
Passerines (continued) ruby-crowned kinglet 0.000 0.000 0.0 0.0 rock wren 0.031 0.018 6.2 0.8 red-winged blackbird 0.028 0.039 3.7 0.8 Say's phoebe 0.040 0.005 4.0 1.1 sage thrasher 0.000 0.000 0.0 0.0 savannah sparrow 0.033 0.046 2.2 0.9 song sparrow 0.000 0.000 0.0 0.0 spotted towhee 0.000 0.000 0.0 0.0 tree swallow 0.033 0.046 2.2 0.9 unidentified blackbird 0.000 0.000 0.0 0.0 unidentified finch 0.000 0.000 0.0 0.0 unidentified flycatcher 0.000 0.000 0.0 0.0 unidentified passerine 0.000 0.000 0.0 0.0 unidentified sparrow 0.000 0.000 0.0 0.0 unidentified swallow 0.000 0.000 0.0 0.0 unidentified warbler 0.000 0.000 0.0 0.0 vesper sparrow 0.062 0.035 4.0 1.7 violet-green swallow 0.009 0.013 1.9 0.3 white-crowned sparrow 0.000 0.000 0.0 0.0 western flycatcher 0.000 0.000 0.0 0.0 western kingbird 0.009 0.013 1.9 0.3 western meadowlark 0.322 0.147 41.1 8.8 western wood-pewee 0.009 0.013 1.9 0.3 Wilson's warbler 0.000 0.000 0.0 0.0 yellow-rumped warbler 0.000 0.000 0.0 0.0 Upland Gamebirds 0.009 0.013 1.9 0.3 California quail 0.000 0.000 0.0 0.0 chukar 0.000 0.000 0.0 0.0 gray partridge 0.000 0.000 0.0 0.0 ring-necked pheasant 0.009 0.013 1.9 0.3 Doves/Pigeons 0.019 0.026 1.9 0.5 mourning dove 0.019 0.026 1.9 0.5 rock dove 0.000 0.000 0.0 0.0 Other Birds 0.056 0.079 5.6 1.5 common nighthawk 0.056 0.079 5.6 1.5 northern flicker 0.000 0.000 0.0 0.0
2 6/9-30/01 and 6/24-7/10/02

Avian Study Protocol and Final Report EURUS Combine Hills Turbine Ranch
WEST, Inc. 32
Table 2c. Average use, frequency of occurrence, and percent composition for paired-point surveys for each species observed within 100m of the site center for 2001 and 2002.
FALL3
Use Group / Species mean Std dev
Frequency of Occurrence
Percent Composition
Waterfowl/Waterbirds 0.127 0.311 0.7 2.6 Canada goose 0.127 0.311 0.7 2.6 great blue heron 0.000 0.000 0.0 0.0 Shorebirds killdeer 0.007 0.011 1.4 0.2 Raptors 0.062 0.075 9.4 1.3 Cooper's hawk 0.000 0.000 0.0 0.0 sharp-shinned hawk 0.000 0.000 0.0 0.0 ferruginous hawk 0.000 0.000 0.0 0.0 rough-legged hawk 0.004 0.009 0.7 0.1 red-tailed hawk 0.018 0.029 2.2 0.4 Swainson's hawk 0.000 0.000 0.0 0.0 unidentified buteo 0.000 0.000 0.0 0.0 northern harrier 0.029 0.033 5.1 0.6 golden eagle 0.000 0.000 0.0 0.0 American kestrel 0.007 0.018 1.4 0.2 osprey 0.004 0.009 0.7 0.1 Corvids 0.050 0.055 6.9 1.0 black-billed magpie 0.043 0.057 5.5 0.9 common raven 0.007 0.011 1.4 0.2 Passerines 4.517 1.660 94.9 94.1 American goldfinch 0.244 0.311 13.7 5.1 American pipit 0.102 0.230 3.1 2.1 American robin 0.062 0.115 3.8 1.3 Baltimore oriole 0.000 0.000 0.0 0.0 barn swallow 0.199 0.263 8.7 4.2 brown-headed cowbird 0.000 0.000 0.0 0.0 black-headed grosbeak 0.000 0.000 0.0 0.0 bank swallow 0.000 0.000 0.0 0.0 Brewer's blackbird 0.301 0.665 2.9 6.3 Brewer's sparrow 0.000 0.000 0.0 0.0 chipping sparrow 0.000 0.000 0.0 0.0 cliff swallow 0.000 0.000 0.0 0.0 common yellowthroat 0.000 0.000 0.0 0.0 dark-eyed junco 0.275 0.422 8.6 5.7 eastern kingbird 0.000 0.000 0.0 0.0 European starling 0.145 0.355 0.7 3.0 golden-crowned kinglet 0.025 0.062 0.7 0.5 grasshopper sparrow 0.000 0.000 0.0 0.0 house finch 0.004 0.009 0.7 0.1 horned lark 2.459 1.208 87.7 51.2 lark sparrow 0.004 0.009 0.7 0.1 loggerhead shrike 0.000 0.000 0.0 0.0 Bullock's oriole 0.000 0.000 0.0 0.0 northern rough-winged swallow 0.000 0.000 0.0 0.0

Avian Study Protocol and Final Report EURUS Combine Hills Turbine Ranch
WEST, Inc. 33
Table 2c. Average use, frequency of occurrence, and percent composition for paired-point surveys for each species observed within 100m of the site center for 2001 and 2002.
FALL3
Use Group / Species mean Std dev
Frequency of Occurrence
Percent Composition
Passerines (continued) ruby-crowned kinglet 0.011 0.027 0.7 0.2 rock wren 0.035 0.056 6.9 0.7 red-winged blackbird 0.004 0.009 0.7 0.1 Say's phoebe 0.004 0.009 0.7 0.1 sage thrasher 0.024 0.058 2.4 0.5 savannah sparrow 0.000 0.000 0.0 0.0 song sparrow 0.004 0.009 0.7 0.1 spotted towhee 0.007 0.011 1.4 0.2 tree swallow 0.000 0.000 0.0 0.0 unidentified blackbird 0.000 0.000 0.0 0.0 unidentified finch 0.000 0.000 0.0 0.0 unidentified flycatc 0.000 0.000 0.0 0.0 unidentified passerine 0.138 0.209 8.6 2.9 unidentified sparrow 0.000 0.000 0.0 0.0 unidentified swallow 0.000 0.000 0.0 0.0 unidentified warbler 0.036 0.087 2.4 0.7 vesper sparrow 0.114 0.259 6.2 2.4 violet-green swallow 0.000 0.000 0.0 0.0 white-crowned sparrow 0.119 0.184 7.1 2.5 western flycatcher 0.000 0.000 0.0 0.0 western kingbird 0.000 0.000 0.0 0.0 western meadowlark 0.141 0.166 13.8 2.9 western wood-pewee 0.000 0.000 0.0 0.0 Wilson's warbler 0.000 0.000 0.0 0.0 yellow-rumped warbler 0.060 0.146 2.4 1.2 Gamebirds 0.007 0.011 1.4 0.2 California quail 0.000 0.000 0.0 0.0 chukar 0.007 0.011 1.4 0.2 gray partridge 0.000 0.000 0.0 0.0 ring-necked pheasant 0.000 0.000 0.0 0.0 Doves/Pigeons 0.025 0.062 0.7 0.5 mourning dove 0.000 0.000 0.0 0.0 rock dove 0.025 0.062 0.7 0.5 Other Birds 0.004 0.009 0.7 0.1 common nighthawk 0.000 0.000 0.0 0.0 northern flicker 0.004 0.009 0.7 0.1
3 9/11-10/11/01 and 10/1-30/02

Avian Study Protocol and Final Report EURUS Combine Hills Turbine Ranch
WEST, Inc. 34
Table 2d. Average use, frequency of occurrence, and percent composition for paired-point surveys for each species observed within 100m of the site center for 2001 and 2002.
Overall Use Group / Species
mean Std dev Frequency of Occurrence
Percent Composition
Waterfowl/Waterbirds 0.059 0.211 0.3 1.5 Canada goose 0.059 0.211 0.3 1.5 great blue heron 0.000 0.000 0.0 0.0 Shorebirds killdeer 0.003 0.008 0.7 0.1 Raptors 0.074 0.072 11.7 1.8 Cooper's hawk 0.002 0.006 0.3 0.0 sharp-shinned hawk 0.000 0.000 0.0 0.0 ferruginous hawk 0.002 0.006 0.3 0.0 rough-legged hawk 0.003 0.008 0.7 0.1 red-tailed hawk 0.023 0.028 3.1 0.6 Swainson's hawk 0.000 0.000 0.0 0.0 unidentified buteo 0.000 0.000 0.0 0.0 northern harrier 0.023 0.028 4.1 0.6 golden eagle 0.000 0.000 0.0 0.0 American kestrel 0.019 0.024 3.4 0.5 osprey 0.002 0.006 0.3 0.0 Corvids 0.025 0.044 3.5 0.6 black-billed magpie 0.020 0.043 2.5 0.5 common raven 0.005 0.009 0.9 0.1 Passerines 3.788 1.392 95.4 94.8 American goldfinch 0.140 0.233 7.3 3.5 American pipit 0.062 0.162 2.1 1.6 American robin 0.032 0.081 2.1 0.8 Baltimore oriole 0.002 0.006 0.3 0.0 barn swallow 0.098 0.196 4.9 2.4 brown-headed cowbird 0.003 0.012 0.3 0.1 black-headed grosbeak 0.000 0.000 0.0 0.0 bank swallow 0.035 0.097 1.5 0.9 Brewer's blackbird 0.140 0.456 1.6 3.5 Brewer's sparrow 0.002 0.006 0.3 0.0 chipping sparrow 0.002 0.006 0.3 0.0 cliff swallow 0.003 0.007 0.6 0.1 common yellowthroat 0.000 0.000 0.0 0.0 dark-eyed junco 0.127 0.307 4.0 3.2 eastern kingbird 0.005 0.018 0.3 0.1 European starling 0.082 0.238 1.6 2.0 golden-crowned kinglet 0.012 0.042 0.3 0.3 grasshopper sparrow 0.044 0.049 6.9 1.1 house finch 0.002 0.006 0.3 0.0 horned lark 2.297 0.908 91.7 57.5 lark sparrow 0.002 0.006 0.3 0.0 loggerhead shrike 0.000 0.000 0.0 0.0 Bullock's oriole 0.001 0.005 0.3 0.0 northern rough-winged swallow 0.037 0.095 2.3 0.9

Avian Study Protocol and Final Report EURUS Combine Hills Turbine Ranch
WEST, Inc. 35
Table 2d. Average use, frequency of occurrence, and percent composition for paired-point surveys for each species observed within 100m of the site center for 2001 and 2002.
Overall Use Group / Species
mean Std dev Frequency of Occurrence
Percent Composition
Passerines (continued) ruby-crowned kinglet 0.005 0.018 0.3 0.1 rock wren 0.035 0.040 6.4 0.9 red-winged blackbird 0.009 0.019 1.3 0.2 Say's phoebe 0.008 0.016 1.0 0.2 sage thrasher 0.011 0.040 1.1 0.3 savannah sparrow 0.027 0.039 3.0 0.7 song sparrow 0.002 0.006 0.3 0.0 spotted towhee 0.003 0.008 0.7 0.1 tree swallow 0.005 0.018 0.3 0.1 unidentified blackbird 0.000 0.000 0.0 0.0 unidentified finch 0.004 0.015 0.3 0.1 unidentified flycatcher 0.002 0.006 0.3 0.0 unidentified passerine 0.064 0.153 4.0 1.6 unidentified sparrow 0.000 0.000 0.0 0.0 unidentified swallow 0.005 0.020 0.5 0.1 unidentified warbler 0.016 0.059 1.1 0.4 vesper sparrow 0.075 0.173 4.8 1.9 violet-green swallow 0.003 0.008 0.6 0.1 white-crowned sparrow 0.080 0.142 5.3 2.0 western flycatcher 0.000 0.000 0.0 0.0 western kingbird 0.003 0.007 0.6 0.1 western meadowlark 0.272 0.259 28.0 6.8 western wood-pewee 0.001 0.005 0.3 0.0 Wilson's warbler 0.002 0.006 0.3 0.0 yellow-rumped warbler 0.029 0.099 1.4 0.7 Gamebirds 0.007 0.011 1.4 0.2 California quail 0.000 0.000 0.0 0.0 chukar 0.007 0.011 1.4 0.2 gray partridge 0.000 0.000 0.0 0.0 ring-necked pheasant 0.000 0.000 0.0 0.0 Doves/Pigeons 0.025 0.062 0.7 0.5 mourning dove 0.000 0.000 0.0 0.0 rock dove 0.025 0.062 0.7 0.5 Other Birds 0.004 0.009 0.7 0.1 common nighthawk 0.000 0.000 0.0 0.0 northern flicker 0.004 0.009 0.7 0.1

Avian Study Protocol and Final Report EURUS Combine Hills Turbine Ranch
WEST, Inc. 36
Table 3. Average use by taxonomic group for observations within 100m of the plot center for turbine and offset points from the paired-plot surveys.
TURBINE OFFSET Group mean Std dev mean Std dev
Spring1
Waterfowls/Waterbirds 0.000 0.000 0.000 0.000 Shorebirds 0.000 0.000 0.000 0.000 Raptors 0.062 0.074 0.056 0.077 Corvids 0.007 0.016 0.000 0.000 Passerines 3.436 0.805 2.678 1.252 Upland Gamebirds 0.036 0.059 0.042 0.075 Doves 0.000 0.000 0.018 0.041 Other Birds 0.000 0.000 0.000 0.000 Breeding2
Waterfowls/Waterbirds 0.000 0.000 0.000 0.000 Shorebirds 0.000 0.000 0.000 0.000 Raptors 0.195 0.091 0.099 0.017 Corvids 0.000 0.000 0.000 0.000 Passerines 3.950 0.175 2.907 0.131 Upland Gamebirds 0.019 0.026 0.000 0.000 Doves 0.037 0.052 0.000 0.000 Other Birds 0.056 0.079 0.056 0.079 Fall3
Waterfowls/Waterbirds 0.000 0.000 0.254 0.621 Shorebirds 0.007 0.018 0.007 0.018 Raptors 0.043 0.087 0.080 0.118 Corvids 0.007 0.018 0.093 0.116 Passerines 4.584 1.768 4.449 1.848 Upland Gamebirds 0.014 0.022 0.000 0.000 Doves 0.000 0.000 0.051 0.124 Other Birds 0.000 0.000 0.007 0.018 Overall
Waterfowls/Waterbirds 0.000 0.000 0.085 0.146 Shorebirds 0.002 0.004 0.002 0.004 Raptors 0.100 0.083 0.078 0.022 Corvids 0.005 0.004 0.031 0.054 Passerines 3.990 0.575 3.345 0.963 Upland Gamebirds 0.023 0.011 0.014 0.024 Doves 0.012 0.021 0.023 0.026 Other Birds 0.019 0.032 0.021 0.030 1 5/1-22/01 and 4/16-5/24/02 2 6/9-30/01 and 6/24-7/10/02 3 9/11-10/11/01 and 10/1-30/02

Avian Study Protocol and Final Report EURUS Combine Hills Turbine Ranch
WEST, Inc. 37
Table 4. Avian species observed while conducting fixed-point surveys (June 9, 2001 - January 28, 2003) on the Eurus Combine Hills Turbine Ranch site. Summer Fall Winter Spring Total Species/Group # groups # detects # groups # detects # groups # detects # groups # detects # groups # detects Waterfowl 0 0 1 7 4 32 2 210 7 249 Canada goose 0 0 1 7 3 15 1 10 5 32 snow goose 0 0 0 0 1 17 0 0 1 17 tundra swan 0 0 0 0 0 0 1 200 1 200 Waterbirds ring-billed gull 0 0 0 0 0 0 1 11 1 11
Shorebirds killdeer 0 0 1 6 0 0 0 0 1 6 Raptor 54 59 38 42 72 81 56 63 220 245 Swainson's hawk 4 4 1 1 0 0 3 4 8 9 ferruginous hawk 0 0 2 2 0 0 1 1 3 3 red-tailed hawk 28 32 14 14 20 21 24 28 86 95 rough-legged hawk 0 0 1 1 15 16 9 10 25 27 unidentified buteo 0 0 6 7 9 13 3 3 18 23 northern harrier 6 6 6 6 12 13 8 9 32 34 golden eagle 0 0 0 0 7 7 5 5 12 12 American kestrel 16 17 7 10 4 4 1 1 28 32 prairie falcon 0 0 1 1 4 5 1 1 6 7 great-horned owl 0 0 0 0 1 2 1 1 2 3 Corvids 5 18 8 14 14 29 15 28 42 89 black-billed magpie 2 2 5 6 5 9 2 2 14 19 common raven 3 16 3 8 9 20 13 26 28 70 Passerines 119 203 31 86 63 210 83 158 296 657 American goldfinch 0 0 3 8 2 2 0 0 5 10 American pipit 0 0 1 6 0 0 0 0 1 6 American robin 0 0 0 0 1 1 0 0 1 1 European starling 0 0 0 0 4 86 0 0 4 86 bank swallow 2 10 0 0 0 0 3 15 5 25 barn swallow 0 0 3 12 0 0 0 0 3 12 cliff swallow 0 0 0 0 0 0 1 8 1 8 eastern kingbird 1 5 0 0 0 0 0 0 1 5 grasshopper sparrow 1 1 0 0 0 0 5 6 6 7 horned lark 91 159 19 49 42 104 41 89 193 401 mountain bluebird 0 0 0 0 1 3 0 0 1 3 red-winged blackbird 0 0 0 0 1 2 1 1 2 3 rock wren 0 0 0 0 0 0 3 3 3 3 unidentified passerine 0 0 1 5 0 0 0 0 1 5 unidentified swallow 4 5 0 0 0 0 0 0 4 5 vesper sparrow 0 0 0 0 0 0 1 1 1 1 western kingbird 1 1 0 0 0 0 0 0 1 1 western meadowlark 19 22 4 6 12 12 28 35 63 75

Avian Study Protocol and Final Report EURUS Combine Hills Turbine Ranch
WEST, Inc. 38
Table 4. Avian species observed while conducting fixed-point surveys (June 9, 2001 - January 28, 2003) on the Eurus Combine Hills Turbine Ranch site. Summer Fall Winter Spring Total Species/Group # groups # detects # groups # detects # groups # detects # groups # detects # groups # detects Upland Gamebirds 2 2 1 1 3 4 5 6 11 13 chukar 0 0 0 0 1 1 1 2 2 3 ring-necked pheasant 2 2 1 1 2 3 4 4 9 10 Doves 9 45 2 23 3 19 3 4 17 91 mourning dove 2 3 0 0 0 0 2 2 4 5 rock dove 7 42 2 23 3 19 1 2 13 86 Other Birds common nighthawk 3 3 0 0 0 0 0 0 3 3 Total 192 330 82 179 159 375 165 480 598 1364

Avian Study Protocol and Final Report EURUS Combine Hills Turbine Ranch
WEST, Inc. 39
Table 5. Estimated mean use (number of observations per 30-minute survey) for each species observed within 800m of the survey point for fixed-point surveys (June 9, 2001 - January 28, 2003). Summer Use Fall Use Winter Use Spring Use Overall Use
Species/Group mean st dev mean st dev mean st dev mean st dev mean st dev
Waterfowl 0.000 0.000 0.156 0.348 0.315 0.771 4.375 10.717 1.205 5.350 Canada goose 0.000 0.000 0.156 0.348 0.000 0.000 0.208 0.510 0.084 0.295 snow goose 0.000 0.000 0.000 0.000 0.315 0.771 0.000 0.000 0.079 0.386 tundra swan 0.000 0.000 0.000 0.000 0.000 0.000 4.167 10.206 1.042 5.103 Waterbirds ring-billed gull 0.000 0.000 0.000 0.000 0.000 0.000 0.229 0.561 0.057 0.281 Shorebirds killdeer 0.000 0.000 0.133 0.298 0.000 0.000 0.000 0.000 0.028 0.136 Raptors 0.834 0.463 0.756 0.145 0.944 0.465 1.117 0.340 0.916 0.387 Swainson's hawk 0.065 0.061 0.022 0.050 0.000 0.000 0.074 0.135 0.042 0.080 ferruginous hawk 0.000 0.000 0.022 0.050 0.000 0.000 0.021 0.051 0.010 0.033 red-tailed hawk 0.405 0.334 0.289 0.127 0.278 0.241 0.461 0.165 0.363 0.238 rough-legged hawk 0.000 0.000 0.022 0.050 0.167 0.136 0.192 0.225 0.094 0.152 unidentified buteo 0.000 0.000 0.022 0.050 0.000 0.000 0.037 0.091 0.014 0.050 northern harrier 0.095 0.135 0.133 0.122 0.204 0.130 0.181 0.259 0.152 0.166 golden eagle 0.000 0.000 0.000 0.000 0.093 0.130 0.093 0.148 0.046 0.103 American kestrel 0.269 0.140 0.222 0.111 0.074 0.057 0.019 0.045 0.148 0.141 prairie falcon 0.000 0.000 0.022 0.050 0.093 0.130 0.021 0.051 0.033 0.077 great-horned owl 0.000 0.000 0.000 0.000 0.037 0.091 0.019 0.045 0.014 0.050 Corvids 0.222 0.406 0.156 0.169 0.204 0.347 0.726 1.053 0.330 0.608 black-billed magpie 0.032 0.084 0.133 0.145 0.074 0.910 0.052 0.085 0.069 0.101 common raven 0.190 0.414 0.022 0.050 0.130 0.318 0.674 0.976 0.261 0.581 Passerines 3.723 2.074 1.911 0.529 3.648 3.654 3.018 3.437 3.150 2.673 American goldfinch 0.000 0.000 0.178 0.290 0.037 0.057 0.000 0.000 0.046 0.143 American pipit 0.000 0.000 0.133 0.298 0.000 0.000 0.000 0.000 0.028 0.136 American robin 0.000 0.000 0.000 0.000 0.019 0.045 0.000 0.000 0.005 0.023 European starling 0.000 0.000 0.000 0.000 1.352 3.311 0.000 0.000 0.338 1.656 bank swallow 0.159 0.279 0.000 0.000 0.000 0.000 0.278 0.443 0.116 0.277 barn swallow 0.000 0.000 0.267 0.596 0.000 0.000 0.000 0.000 0.056 0.272 cliff swallow 0.000 0.000 0.000 0.000 0.000 0.000 0.148 0.363 0.037 0.181 eastern kingbird 0.079 0.210 0.000 0.000 0.000 0.000 0.000 0.000 0.023 0.113 grasshopper sparrow 0.016 0.042 0.000 0.000 0.000 0.000 0.126 0.145 0.036 0.089 horned lark 2.976 1.899 1.089 0.664 1.926 2.413 1.720 1.758 2.006 1.857 mountain bluebird 0.000 0.000 0.000 0.000 0.056 0.136 0.000 0.000 0.014 0.068 red-winged blackbird 0.000 0.000 0.000 0.000 0.037 0.091 0.019 0.045 0.014 0.050 rock wren 0.000 0.000 0.000 0.000 0.000 0.000 0.056 0.093 0.014 0.050 unidentified passerine 0.000 0.000 0.111 0.248 0.000 0.000 0.000 0.000 0.023 0.113 unidentified swallow 0.083 0.144 0.000 0.000 0.000 0.000 0.000 0.000 0.024 0.083 vesper sparrow 0.000 0.000 0.000 0.000 0.000 0.000 0.019 0.045 0.005 0.023 western kingbird 0.016 0.042 0.000 0.000 0.000 0.000 0.000 0.000 0.005 0.023 western meadowlark 0.393 0.282 0.133 0.199 0.222 0.281 0.653 0.845 0.361 0.506

Avian Study Protocol and Final Report EURUS Combine Hills Turbine Ranch
WEST, Inc. 40
Table 5. Estimated mean use (number of observations per 30-minute survey) for each species observed within 800m of the survey point for fixed-point surveys (June 9, 2001 - January 28, 2003). Summer Use Fall Use Winter Use Spring Use Overall Use
Species/Group mean st dev mean st dev mean st dev mean st dev mean st dev Gamebirds 0.032 0.084 0.022 0.050 0.056 0.093 0.093 0.178 0.051 0.109 chukar 0.000 0.000 0.000 0.000 0.000 0.000 0.037 0.091 0.009 0.045 ring-necked pheasant 0.032 0.084 0.022 0.050 0.056 0.093 0.056 0.093 0.042 0.079 Doves/Pigeons 0.714 1.088 0.511 0.866 0.222 0.351 0.074 0.091 0.389 0.733 mourning dove 0.048 0.087 0.000 0.000 0.000 0.000 0.037 0.057 0.023 0.057 rock dove 0.667 1.096 0.511 0.866 0.222 0.351 0.037 0.091 0.366 0.734 Other Birds common nighthawk 0.048 0.087 0.000 0.000 0.000 0.000 0.000 0.000 0.014 0.050

Avian Study Protocol and Final Report EURUS Combine Hills Turbine Ranch
WEST, Inc. 41
Table 6. Estimated percent composition (mean use divided by total use for all species) for each species observed within 800 m of the survey point for the fixed-point surveys. Summer Fall Winter Spring Overall
Species/Group % Comp % Comp % Comp % Comp % Comp Waterfowl 0.00 4.27 5.84 45.42 19.62 Canada goose 0.00 4.27 0.00 2.16 1.38 snow goose 0.00 0.00 5.84 0.00 1.28 tundra swan 0.00 0.00 0.00 43.26 16.97 Waterbirds ring-billed gull 0.00 0.00 0.00 2.38 0.93 Shorebirds killdeer 0.00 3.66 0.00 0.00 0.45 Raptors 14.97 20.73 17.53 11.60 14.92 Swainson's hawk 1.17 0.61 0.00 0.77 0.69 ferruginous hawk 0.00 0.61 0.00 0.22 0.16 red-tailed hawk 7.26 7.93 5.15 4.79 5.91 rough-legged hawk 0.00 0.61 3.09 1.99 1.54 unidentified buteo 0.00 0.61 0.00 0.38 0.23 northern harrier 1.71 3.66 3.78 1.88 2.47 golden eagle 0.00 0.00 1.72 0.96 0.75 American kestrel 4.82 6.10 1.37 0.19 2.41 prairie falcon 0.00 0.61 1.72 0.22 0.54 great-horned owl 0.00 0.00 0.69 0.19 0.23 Corvids 3.99 4.27 3.78 7.54 5.37 black-billed magpie 0.57 3.66 1.37 0.54 1.12 common raven 3.42 0.61 2.41 7.00 4.25 Passerines 66.80 52.44 67.70 31.33 51.31 American goldfinch 0.00 4.88 0.69 0.00 0.75 American pipit 0.00 3.66 0.00 0.00 0.45 American robin 0.00 0.00 0.34 0.00 0.08 barn swallow 0.00 7.32 0.00 0.00 0.90 bank swallow 2.85 0.00 0.00 2.88 1.89 cliff swallow 0.00 0.00 0.00 1.54 0.60 eastern kingbird 1.42 0.00 0.00 0.00 0.38 European starling 0.00 0.00 25.09 0.00 5.50 grasshopper sparrow 0.28 0.00 0.00 1.31 0.59 horned lark 53.41 29.88 35.74 17.86 32.68 mountain bluebird 0.00 0.00 1.03 0.00 0.23 rock wren 0.00 0.00 0.00 0.58 0.23 red-winged blackbird 0.00 0.00 0.69 0.19 0.23 unidentified passerine 0.00 3.05 0.00 0.00 0.38 unidentified swallow 1.50 0.00 0.00 0.00 0.40 vesper sparrow 0.00 0.00 0.00 0.19 0.08 western kingbird 0.28 0.00 0.00 0.00 0.08 western meadowlark 7.06 3.66 4.12 6.78 5.88

Avian Study Protocol and Final Report EURUS Combine Hills Turbine Ranch
WEST, Inc. 42
Table 6. Estimated percent composition (mean use divided by total use for all species) for each species observed within 800 m of the survey point for the fixed-point surveys. Summer Fall Winter Spring Overall
Species/Group % Comp % Comp % Comp % Comp % Comp Upland Gamebirds 0.57 0.619 1.03 0.96 0.83 chukar 0.00 0.00 0.00 0.38 0.15 ring-necked pheasant 0.57 0.61 1.03 0.58 0.68 Doves/Pigeons 12.82 14.02 4.12 0.77 6.33 mourning dove 0.85 0.00 0.00 0.38 0.38 rock dove 11.96 14.02 4.12 0.38 5.96 Other Birds common nighthawk 0.85 0.00 0.00 0.00 0.23

Avian Study Protocol and Final Report EURUS Combine Hills Turbine Ranch
WEST, Inc. 43
Table 7. Estimated frequency of occurrence (percent of 30-minute surveys species/group is recorded) for each species observed within 800 m of the survey point for the fixed-point surveys Summer Fall Winter Spring Overall
Species/Group % Freq % Freq % Freq % Freq % Freq Waterfowl 0.00 2.22 1.85 2.08 1.45 Canada goose 0.00 2.22 0.00 2.08 0.98 snow goose 0.00 0.00 1.85 0.00 0.46 tundra swan 0.00 0.00 0.00 2.08 0.52 Waterbirds ring-billed gull 0.00 0.00 0.00 2.08 0.52 Shorebirds killdeer 0.00 2.22 0.00 0.00 0.46 Raptors 49.68 48.89 61.11 56.44 54.06 Swainson's hawk 6.55 2.22 0.00 3.70 3.30 ferruginous hawk 0.00 2.22 0.00 2.08 0.98 red-tailed hawk 27.58 26.67 22.22 31.81 27.11 rough-legged hawk 0.00 2.22 12.96 15.51 7.58 unidentified buteo 0.00 2.22 0.00 1.85 0.93 northern harrier 7.94 13.33 14.81 10.74 11.48 golden eagle 0.00 0.00 9.26 7.41 4.17 American kestrel 23.69 13.33 7.41 1.85 12.00 prairie falcon 0.00 2.22 7.41 2.08 2.84 great-horned owl 0.00 0.00 1.85 1.85 0.93 Corvids 4.76 13.33 11.11 22.96 12.69 black-billed magpie 1.59 11.11 7.41 5.19 5.93 common raven 3.17 2.22 3.70 21.11 7.59 Passerines 74.60 48.89 50.00 48.70 56.62 American goldfinch 0.00 6.67 3.70 0.00 2.31 American pipit 0.00 2.22 0.00 0.00 0.46 American robin 0.00 0.00 1.85 0.00 0.46 barn swallow 0.00 6.67 0.00 0.00 1.39 bank swallow 3.17 0.00 0.00 5.56 2.31 cliff swallow 0.00 0.00 0.00 1.85 0.46 eastern kingbird 1.59 0.00 0.00 0.00 0.46 European starling 0.00 0.00 3.70 0.00 0.93 grasshopper sparrow 1.59 0.00 0.00 8.89 2.69 horned lark 68.25 33.33 42.59 42.92 48.23 mountain bluebird 0.00 0.00 1.85 0.00 0.46 rock wren 0.00 0.00 0.00 5.56 1.39 red-winged blackbird 0.00 0.00 1.85 1.85 0.93 unidentified passerine 0.00 2.22 0.00 0.00 0.46 unidentified swallow 6.55 0.00 0.00 0.00 1.91 vesper sparrow 0.00 0.00 0.00 1.85 0.46 western kingbird 1.59 0.00 0.00 0.00 0.46 western meadowlark 31.39 8.89 16.67 37.50 24.55
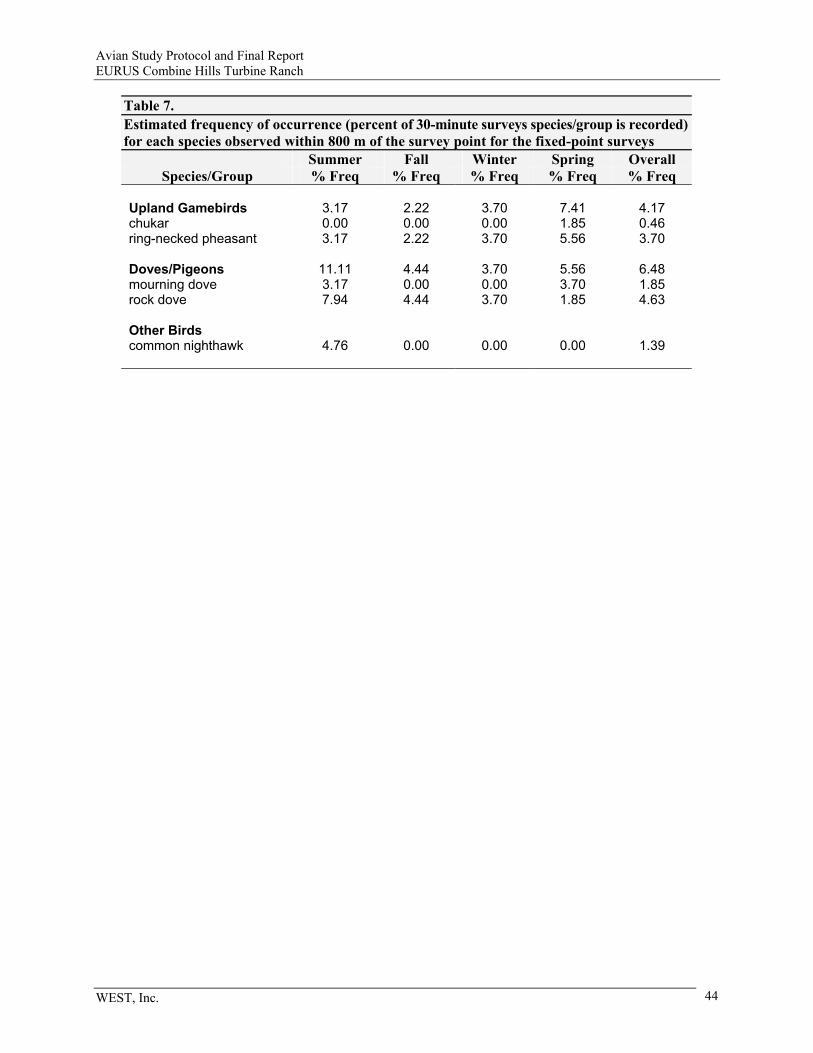
Avian Study Protocol and Final Report EURUS Combine Hills Turbine Ranch
WEST, Inc. 44
Table 7. Estimated frequency of occurrence (percent of 30-minute surveys species/group is recorded) for each species observed within 800 m of the survey point for the fixed-point surveys Summer Fall Winter Spring Overall
Species/Group % Freq % Freq % Freq % Freq % Freq Upland Gamebirds 3.17 2.22 3.70 7.41 4.17 chukar 0.00 0.00 0.00 1.85 0.46 ring-necked pheasant 3.17 2.22 3.70 5.56 3.70 Doves/Pigeons 11.11 4.44 3.70 5.56 6.48 mourning dove 3.17 0.00 0.00 3.70 1.85 rock dove 7.94 4.44 3.70 1.85 4.63 Other Birds common nighthawk 4.76 0.00 0.00 0.00 1.39

Avian Study Protocol and Final Report EURUS Combine Hills Turbine Ranch
WEST, Inc. 45
Table 8. Flight height characteristics of avian species observed during the fixed-point surveys. Species/Group
Number groups flying
Number birds flying
Percent of birds flying
<25 m 25-125 m > 125 m
cliff swallow 1 8 100.0 0.0 100.0 0.0 American pipit 1 6 100.0 0.0 100.0 0.0 killdeer 1 6 100.0 0.0 100.0 0.0 unidentified passerine 1 5 100.0 0.0 100.0 0.0 ferruginous hawk 3 3 100.0 0.0 100.0 0.0 common nighthawk 2 2 66.7 0.0 100.0 0.0 American goldfinch 2 7 70.0 14.3 85.7 0.0 prairie falcon 5 6 85.7 16.7 83.3 0.0 common raven 23 56 80.0 12.5 76.8 10.7 rough-legged hawk 24 26 96.3 19.2 76.9 3.8 red-tailed hawk 80 89 93.7 12.4 69.7 18.0 Swainson's hawk 5 6 66.7 0.0 66.7 33.3 unidentified buteo 14 16 69.6 6.3 56.3 37.5 northern harrier 31 33 97.1 51.5 45.5 3.0 rock dove 11 63 73.3 69.8 30.2 0.0 golden eagle 10 10 83.3 60.0 30.0 10.0 Canada goose 3 27 84.4 0.0 25.9 74.1 European starling 4 86 100.0 76.7 23.3 0.0 American kestrel 22 26 81.3 80.8 19.2 0.0 horned lark 110 255 63.6 86.7 13.3 0.0 tundra swan 1 200 100.0 0.0 0.0 100.0 snow goose 1 17 100.0 0.0 0.0 100.0 barn swallow 3 12 100.0 100.0 0.0 0.0 ring-billed gull 1 11 100.0 0.0 0.0 100.0 eastern kingbird 1 5 100.0 100.0 0.0 0.0 mourning dove 4 5 100.0 100.0 0.0 0.0 unidentified swallow 4 5 100.0 100.0 0.0 0.0 bank swallow 4 19 76.0 100.0 0.0 0.0 black-billed magpie 8 13 68.4 100.0 0.0 0.0 western meadowlark 7 8 10.7 100.0 0.0 0.0 American robin 0 0 0.0 N/A N/A N/A chukar 0 0 0.0 N/A N/A N/A grasshopper sparrow 0 0 0.0 N/A N/A N/A great-horned owl 0 0 0.0 N/A N/A N/A mountain bluebird 0 0 0.0 N/A N/A N/A red-winged blackbird 0 0 0.0 N/A N/A N/A ring-necked pheasant 0 0 0.0 N/A N/A N/A rock wren 0 0 0.0 N/A N/A N/A vesper sparrow 0 0 0.0 N/A N/A N/A western kingbird 0 0 0.0 N/A N/A N/A Subtotal/Average 387 1031 75.6 45.4 27.4 27.3
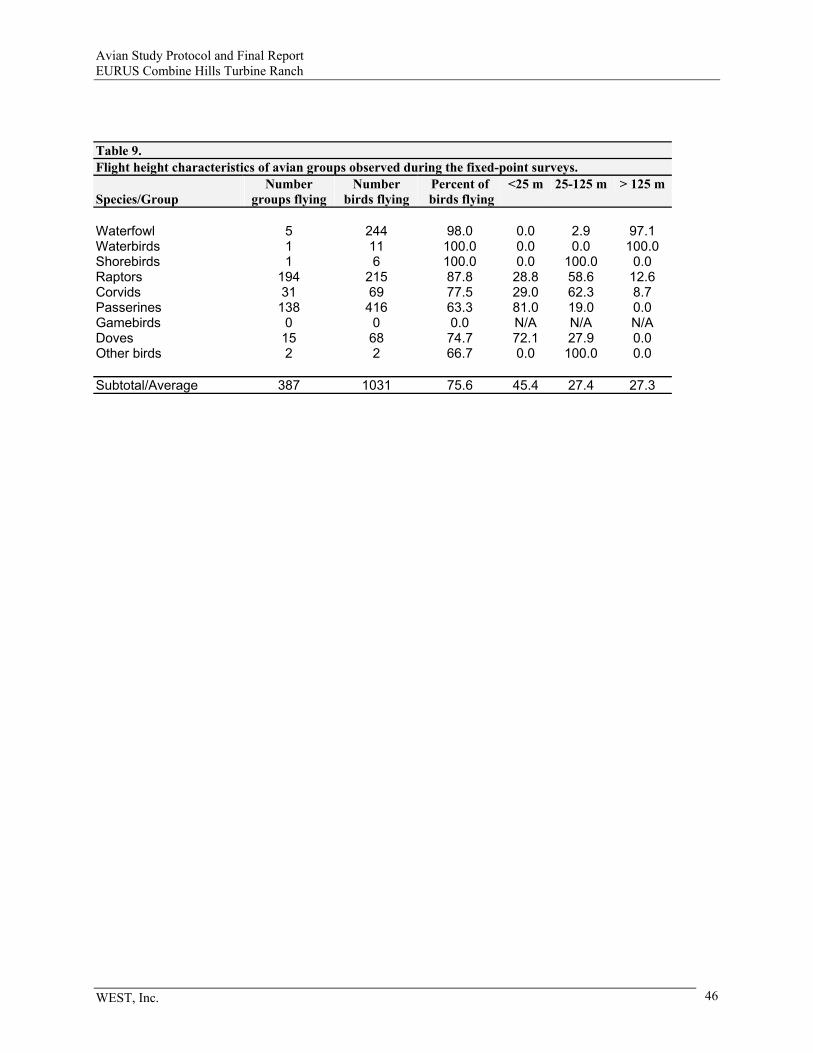
Avian Study Protocol and Final Report EURUS Combine Hills Turbine Ranch
WEST, Inc. 46
Table 9. Flight height characteristics of avian groups observed during the fixed-point surveys. Species/Group
Number groups flying
Number birds flying
Percent of birds flying
<25 m 25-125 m > 125 m
Waterfowl 5 244 98.0 0.0 2.9 97.1 Waterbirds 1 11 100.0 0.0 0.0 100.0 Shorebirds 1 6 100.0 0.0 100.0 0.0 Raptors 194 215 87.8 28.8 58.6 12.6 Corvids 31 69 77.5 29.0 62.3 8.7 Passerines 138 416 63.3 81.0 19.0 0.0 Gamebirds 0 0 0.0 N/A N/A N/A Doves 15 68 74.7 72.1 27.9 0.0 Other birds 2 2 66.7 0.0 100.0 0.0 Subtotal/Average 387 1031 75.6 45.4 27.4 27.3

Avian Study Protocol and Final Report EURUS Combine Hills Turbine Ranch
WEST, Inc. 47
Table 10. Exposure indices calculated for species observed during fixed-point surveys. Species/Group
Meanuse
Percent flying
Percent flying within RSA
Exposure Index
red-tailed hawk 0.363 93.7 69.7 0.237 horned lark 2.006 63.6 13.3 0.170 common raven 0.261 80.0 76.8 0.160 rock dove 0.366 73.3 30.2 0.081 European starling 0.338 100.0 23.3 0.079 rough-legged hawk 0.094 96.3 76.9 0.070 northern harrier 0.152 97.1 45.5 0.067 cliff swallow 0.037 100.0 100.0 0.037 American goldfinch 0.046 70.0 85.7 0.028 American pipit 0.028 100.0 100.0 0.028 killdeer 0.028 100.0 100.0 0.028 prairie falcon 0.033 85.7 83.3 0.024 unidentified passerine 0.023 100.0 100.0 0.023 American kestrel 0.148 81.3 19.2 0.023 Swainson's hawk 0.042 66.7 66.7 0.019 Canada goose 0.084 84.4 25.9 0.018 golden eagle 0.046 83.3 30.0 0.012 ferruginous hawk 0.010 100.0 100.0 0.010 common nighthawk 0.014 66.7 100.0 0.009 unidentified buteo 0.014 69.6 56.3 0.005 tundra swan 1.042 100.0 0.0 0.000 western meadowlark 0.361 10.7 0.0 0.000 bank swallow 0.116 76.0 0.0 0.000 snow goose 0.079 100.0 0.0 0.000 black-billed magpie 0.069 68.4 0.0 0.000 ring-billed gull 0.057 100.0 0.0 0.000 barn swallow 0.056 100.0 0.0 0.000 unidentified swallow 0.024 100.0 0.0 0.000 eastern kingbird 0.023 100.0 0.0 0.000 mourning dove 0.023 100.0 0.0 0.000 ring-necked pheasant 0.042 0.0 N/A N/A grasshopper sparrow 0.036 0.0 N/A N/A great-horned owl 0.014 0.0 N/A N/A mountain bluebird 0.014 0.0 N/A N/A red-winged blackbird 0.014 0.0 N/A N/A rock wren 0.014 0.0 N/A N/A chukar 0.009 0.0 N/A N/A American robin 0.005 0.0 N/A N/A vesper sparrow 0.005 0.0 N/A N/A western kingbird 0.005 0.0 N/A N/A

Avian Study Protocol and Final Report EURUS Combine Hills Turbine Ranch
WEST, Inc. 48
Table 11. Raptor and large bird nests located in the Raptor nest survey area (WRA area plus area within a five-mile radius buffer).
Species Number Active Nestsa
Number of Nests producing youngb
Total young observed (young per
successful nest) Notes
Ferruginous hawk 3 2 5 (1.67) One nest failed Red-tailed hawk 24 11 30 (1.5) 5 nests with no birds
present Swainson’s hawk 12 Unknown Unknown 3 nests with no birds
present American kestrel 1 Unknown Unknown Great-horned owl 5 Unknown Unknown Barn owl 4 Unknown Unknown Burrowing owl 2 1 5 Fate of one nest unknown Common raven 1 Unknown Unknown Inactive nests 45 N/A N/A a based on April 27-28 survey
b based on June 13 survey
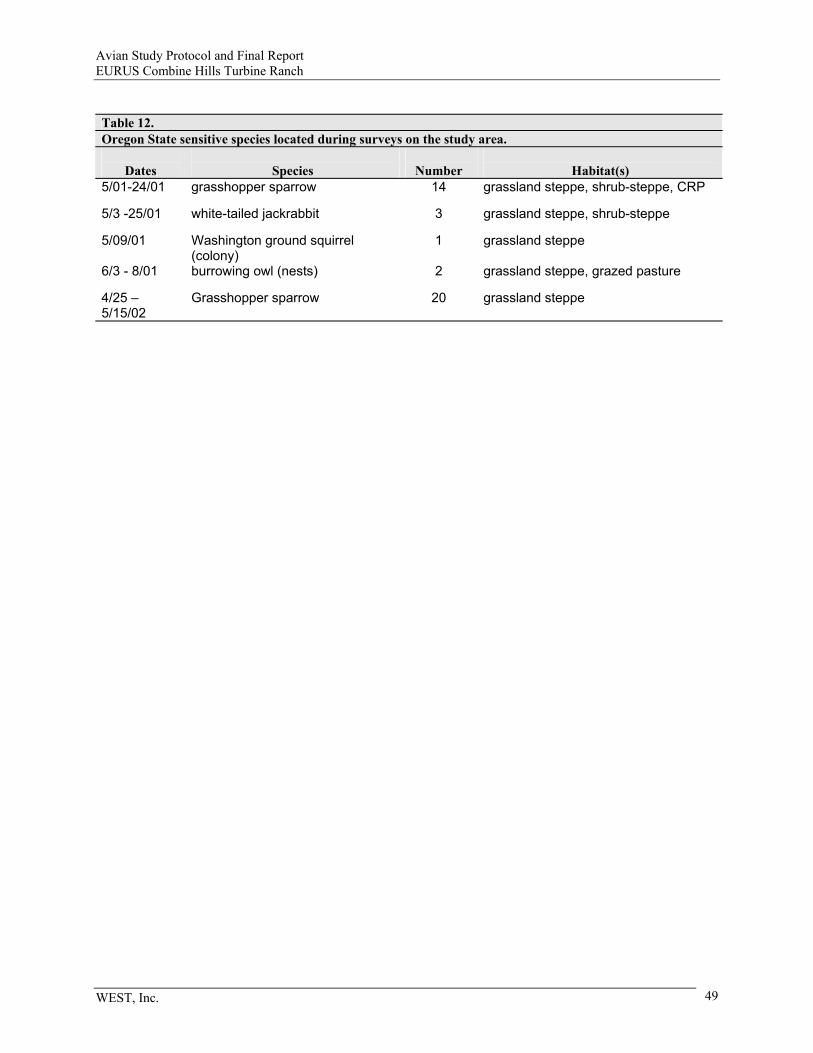
Avian Study Protocol and Final Report EURUS Combine Hills Turbine Ranch
WEST, Inc. 49
Table 12. Oregon State sensitive species located during surveys on the study area.
Dates
Species
Number
Habitat(s)
5/01-24/01 grasshopper sparrow 14 grassland steppe, shrub-steppe, CRP
5/3 -25/01 white-tailed jackrabbit 3 grassland steppe, shrub-steppe
5/09/01 Washington ground squirrel (colony)
1 grassland steppe
6/3 - 8/01 burrowing owl (nests) 2 grassland steppe, grazed pasture
4/25 – 5/15/02
Grasshopper sparrow 20 grassland steppe

Avian Study Protocol and Final Report EURUS Combine Hills Turbine Ranch
WEST, Inc. 50
Table 13.
Habitat types in the study area.
Basic Type Vegetation
Type Mapping
Code
Approximate Acres (percent of study area)* General Habitat Description
Agricultural Cropland AG 1722.25 (44.5%)
Current croplands or recently abandoned cropland.
CRP CRP 0 Conservation Reserve Program lands; previously croplands.
Steppe Shrub-steppe
SS 419.62 (10.8%)
Steppe habitat with a significant shrub component and grass/forb understory. Dominant shrub is usually rabbitbrush (Chrysothamnus spp)
Grassland steppe
GS 321.45 (8.3%)
Predominantly grassland (native and non-native grass species); may have few scattered rabbitbrush shrubs.
Lithosol “Scab”
LH 1209.99 (31.3%)
Shallow-soiled habitat on ridgetops where native buckwheats and Sandberg’s bluegrass dominate.
Shrub/Grass-land Steppe
SS/SG 104.66 (2.7%)
Mosaic of shrub and grassland steppe; usually scattered small patches of shurbs
Sagebrush SB 16.38 (0.5%)
Dense stands of sagebrush (Artemisia spp)
Sagebrush shrub steppe
SS/SB 68.77 (2.3%)
Shrub steppe dominated by sagebrush
*Study area was defined as the area within 300 m of proposed project facilities (e.g, turbines, roads, substations, etc.)

Avian Study Protocol and Final Report EURUS Combine Hills Turbine Ranch
WEST, Inc. 51
Table 14. Number of groups and the total number of individuals of avian species of interest and non-avian species observed incidentally on the study area. Species Groups Observations
Birds
Great-horned owl 4 12 Barn owl 2 2 Golden eagle 1 1 Common Nighthawk 14 14 Grasshopper Sparrow 14 14 Western meadowlark 10 10 Red-tailed Hawk 1 2 Rock Wren 2 3 Northern Oriole 1 1 Song sparrow 1 1 Bank swallow (colony) 1 1
Mammals Mule deer 4 15 Ord’s kangaroo rat 6 6 Deer mouse 6 6 Northern pocket gopher 1 1 Long-tailed weasel 2 2 Badger 2 2 Columbian ground squirrel 2 2
Reptiles Gopher Snake 6 6 Yellow-bellied racer 3 3

Avian Study Protocol and Final Report EURUS Combine Hills Turbine Ranch
WEST, Inc. 52
Figure 1. Regional map showing the Project location.

Avian Study Protocol and Final Report EURUS Combine Hills Turbine Ranch
WEST, Inc. 53
Figure 2. Map of the Project and paired-plot survey points.
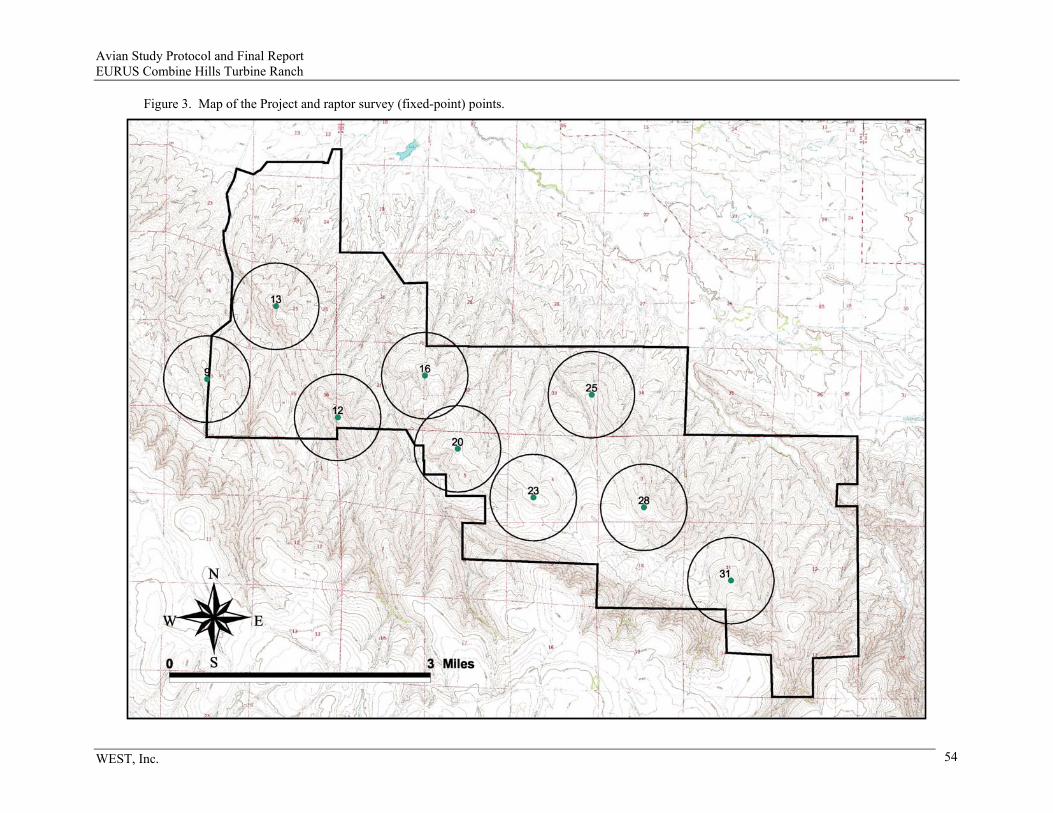
Avian Study Protocol and Final Report EURUS Combine Hills Turbine Ranch
WEST, Inc. 54
Figure 3. Map of the Project and raptor survey (fixed-point) points.

Avian Study Protocol and Final Report EURUS Combine Hills Turbine Ranch
WEST, Inc. 55
Figure 4. Map of the raptor nest survey area and locations of raptor and large bird nests found during the surveys.

Avian Study Protocol and Final Report EURUS Combine Hills Turbine Ranch
WEST, Inc. 56
Figure 5. Map of the Project and sensitive species survey corridors and locations of sensitive species found.

Avian Study Protocol and Final Report EURUS Combine Hills Turbine Ranch
WEST, Inc. 57
Figure 6. Mean use (number detections/30 minute survey) and frequency of occurrence for passerines by survey period (June 2001 – January 2003). The dashed line represented a smoothed estimate.
VISIT
Mea
n U
se
5 10 15 20
02
46
810
Passerines
Summer Fall Winter Spring Summer
VISIT
% F
requ
ency
5 10 15 20
020
4060
8010
0
Summer Fall Winter Spring Summer
Summer vis 1-6Fall vis 7-11Winter vis 12-17
Spring vis 18-23Summer vis 24

Avian Study Protocol and Final Report EURUS Combine Hills Turbine Ranch
WEST, Inc. 58
Figure 7. Mean use (number detections/30-minute survey) and frequency of occurrence for raptors by survey period (June 2001 – January 2003). The dashed line represented a smoothed estimate.
VISIT
Mea
n U
se
5 10 15 20
0.5
1.0
1.5
Raptors
Summer Fall Winter Spring Summer
VISIT
% F
requ
ency
5 10 15 20
2040
6080
Summer Fall Winter Spring Summer
Summer vis 1-6Fall vis 7-11Winter vis 12-17
Spring vis 18-23Summer vis 24

Avian Study Protocol and Final Report EURUS Combine Hills Turbine Ranch
WEST, Inc. 59
Figure 8. Mean use (number detections/30-minute survey +-1 standard error) and frequency of occurrence for passerines by station (June 2001 – January 2003).
9 12 13 16 20 23 25 28 31
01
23
45
6
Mea
n U
sePasserines
Stations
9 12 13 16 20 23 25 28 31
020
4060
80
% F
requ
ency
Stations

Avian Study Protocol and Final Report EURUS Combine Hills Turbine Ranch
WEST, Inc. 60
Figure 9. Mean use (number detections/30-minute survey +-1 standard error) and frequency of occurrence for raptors by station (June 2001 – January 2003).
9 12 13 16 20 23 25 28 31
0.0
0.2
0.4
0.6
0.8
1.0
1.2
1.4
Mea
n U
seRaptors
Stations
9 12 13 16 20 23 25 28 31
020
4060
% F
requ
ency
Stations

Avian Study Protocol and Final Report EURUS Combine Hills Turbine Ranch
WEST, Inc. 61
Figure 10. Mean number of species per survey (June 2001 – January 2003). The dashed line represented a smoothed estimate.
Visit
# sp
ecie
s/su
rvey
5 10 15 20
12
34
Summer Fall Winter Spring Summer
Summer vis 1-6Fall vis 7-11Winter vis 12-17
Spring vis 18-23Summer vis 24

Avian Study Protocol and Final Report EURUS Combine Hills Turbine Ranch
WEST, Inc. 62
Figure 11. Buteo flight paths and perch locations recorded during the fixed-point surveys and incidentally in the study area.

Avian Study Protocol and Final Report EURUS Combine Hills Turbine Ranch
WEST, Inc. 63
Figure 12. Other raptor flight paths and perch locations recorded during the fixed-point surveys and incidentally in the study area.

Avian Study Protocol and Final Report EURUS Combine Hills Turbine Ranch
WEST, Inc. 64
Figure 13. Other large bird flight paths and perch locations recorded during the fixed-point surveys and incidentally in the study area.

Avian Study Protocol and Final Report EURUS Combine Hills Turbine Ranch
WEST, Inc. 65
Figure 14. Map of the Project and habitat types within 300 meters of proposed project facilities (west half).

Avian Study Protocol and Final Report EURUS Combine Hills Turbine Ranch
WEST, Inc. 66
Figure 14. Map of the Project and habitat types within 300 meters of proposed project facilities (east half).


![[FOR BASIC ITEMS ONLY]...Hills, Elagiri Hills, Kalrayan Hills, Nakkanamalai Hills, Naickerneri Hills Tiruvannamalai & Vellore Districts. (xv) An extra 40% on the Rates of Labour, Rates](https://static.fdocuments.in/doc/165x107/60af066b3558e70fc15a9c3d/for-basic-items-only-hills-elagiri-hills-kalrayan-hills-nakkanamalai-hills.jpg)


