Available online at ://staff.oouagoiwoye.edu.ng/uploads/453_COURSES_Stream... · Physiographic...
9
STREAM SEDIMENT GEOCHEMISTRY OF AGADA-DURO, AGORI-ODO AND ASOWOLE AREA, SOUTH WESTERN NIGERIA 1 Akintola, A. I, 2 Egbeyemi, R. O. 3 Ikhane, P. R, 4 Okunlola, O. A, 5 Akintola, G. O and 6 Mazino, A 1,3,5,6 Dept. of Earth Sciences, Faculty of Science, Olabisi Onabanjo University, Ago-Iwoye,Ogun State,Nigeria 2 Dept. of Applied Geoloy FUTA Akure Nigeria 4 Dept. of Geology University of Ibadan Nigeria ARTICLE INFO ABSTRACT The analysis of stream sediments from the eastern part of Dahomey basin was adopted as a means for reconnaissance geochemical prospecting for minerals of economic importance and environmental evaluation in Agada-Duro,Agori-Odo and Asowole area Southwestern Nigeria. The study area is principally a sedimentary terrain composed of ferruginous sandstone. Geochemical data for 15 trace and nine major elements are presented. Statistical and preliminary visual interpretation of the spatial distribution pattern of As, Ni, Cu and Zn did not show any possible potential for economic mineralization or clear-cut relationship as a pathfinder to any known mineralization to be discovered in the area. Interpretations using Total Alkali versus Silica Plot and Alumina content showed that the sediments were derived from a per-aluminous to metaluminous rich rock that is acidic. Environmental evaluation of the study area was done using Index of Geoaccumulation; it was used to determine the effect of trace element distribution in the study area. Copy Right, IJCR, 2012, Academic Journals. All rights reserved. INTRODUCTION Previous Work Previous work on stream sediment geochemistry in southwestern Nigeria include that of Matheis (1978), who used stream sediment reconnaissance surveys as a tool for geochemical mapping of Ilesha schist belt district, but found no distinct anomalies that were related to mineralization. Elueze and Olade (1985) did an interpretation through factor analysis of stream sediment reconnaissance data for gold exploration in Ilesha green stone belt, southwest Nigeria. Description of study area Geology The study area covers approximately 30km 2 and lies in the northwestern part of Abeokuta (Fig. 1 and Fig.2).The geology of the study area is a contact zone comprising of both the Precambrian Basement Complex and sedimentary rock of the western Dahomey Basin. The oldest lithology unit in the Dahomey basin being the Abeokuta group which lies uncomformably over the basement complex. ( Cooray, 1974 ; Omatsola and Adegoke,1981). However, the area mapped falls within the sedimentary part of the contact zone. The rocks found in the area are ferruginous sandstones which fall within the Abeokuta Formation of Dahomey Basin (Fig.4). *Corresponding author: [email protected] Physiographic study of the Agada-Duro, Agori-Odo and Asowole Area The physiographic setting of the southwestern part of Nigeria includes plains with low lying outcrop, rugged terrains and dissected hills of various elevations ranging between 10- 70metres high. The study area which is mainly a sedimentary terrain however has a high to moderate relief. The implication of the land form is that they play a dominant role in the drainage pattern (movement of sediments in and around the location area). The study area has a humid, tropical climate, most of the annual rainfall (1500mm) being confined to the period May-October. Although the area lies in the zone of tropical rain forest, the vegetation now consists of secondary growth as a consequent of intensive cultivation, deforestation and habitation. Chemical weathering is generally intense, penetrating to depths in excess of about 17-25m; this is evident in the lateritic condition of the soils and exposed ferruginous sandstones seen in the area. Sampling and analytical procedures Ten stream sediment samples were collected from selected sites in the study area while 5 were analyzed for their major and trace element compositions. Stream sediments were sampled from active stream channels selecting the silt size- clay size materials low in organic matter, which are found in the drainage basin of the river. During the stream sediment investigations, fresh samples were taken from the middle course where the river is peaceful and the samples are taken close to the bedrock of the drainage basin because a lot of ISSN: 0975-833X Available online at http://www.journalcra.com International Journal of Current Research Vol. 4, Issue, 11, pp.205-213, November, 2012 INTERNATIONAL JOURNAL OF CURRENT RESEARCH Article History: Received 27 th August, 2012 Received in revised form 18 th September, 2012 Accepted 22 th October, 2012 Published online 23 h November, 2012 Key words: Geoaccumulation, Mineralization, Pathfinder, Trace element, Sedimentary, Environmental, Ferruginous.
Transcript of Available online at ://staff.oouagoiwoye.edu.ng/uploads/453_COURSES_Stream... · Physiographic...

z
RESEARCH ARTICLE
STREAM SEDIMENT GEOCHEMISTRY OF AGADA-DURO, AGORI-ODO AND ASOWOLE AREA, SOUTH WESTERN NIGERIA
1Akintola, A. I, 2Egbeyemi, R. O. 3Ikhane, P. R, 4Okunlola, O. A, 5Akintola, G. O and 6Mazino, A
1,3,5,6 Dept. of Earth Sciences, Faculty of Science, Olabisi Onabanjo University, Ago-Iwoye,Ogun State,Nigeria 2Dept. of Applied Geoloy FUTA Akure Nigeria
4Dept. of Geology University of Ibadan Nigeria
ARTICLE INFO ABSTRACT
The analysis of stream sediments from the eastern part of Dahomey basin was adopted as a means for reconnaissance geochemical prospecting for minerals of economic importance and environmental evaluation in Agada-Duro,Agori-Odo and Asowole area Southwestern Nigeria. The study area is principally a sedimentary terrain composed of ferruginous sandstone. Geochemical data for 15 trace and nine major elements are presented. Statistical and preliminary visual interpretation of the spatial distribution pattern of As, Ni, Cu and Zn did not show any possible potential for economic mineralization or clear-cut relationship as a pathfinder to any known mineralization to be discovered in the area. Interpretations using Total Alkali versus Silica Plot and Alumina content showed that the sediments were derived from a per-aluminous to metaluminous rich rock that is acidic. Environmental evaluation of the study area was done using Index of Geoaccumulation; it was used to determine the effect of trace element distribution in the study area.
Copy Right, IJCR, 2012, Academic Journals. All rights reserved.
INTRODUCTION Previous Work Previous work on stream sediment geochemistry in southwestern Nigeria include that of Matheis (1978), who used stream sediment reconnaissance surveys as a tool for geochemical mapping of Ilesha schist belt district, but found no distinct anomalies that were related to mineralization. Elueze and Olade (1985) did an interpretation through factor analysis of stream sediment reconnaissance data for gold exploration in Ilesha green stone belt, southwest Nigeria. Description of study area Geology The study area covers approximately 30km2 and lies in the northwestern part of Abeokuta (Fig. 1 and Fig.2).The geology of the study area is a contact zone comprising of both the Precambrian Basement Complex and sedimentary rock of the western Dahomey Basin. The oldest lithology unit in the Dahomey basin being the Abeokuta group which lies uncomformably over the basement complex. ( Cooray, 1974 ; Omatsola and Adegoke,1981). However, the area mapped falls within the sedimentary part of the contact zone. The rocks found in the area are ferruginous sandstones which fall within the Abeokuta Formation of Dahomey Basin (Fig.4). *Corresponding author: [email protected]
Physiographic study of the Agada-Duro, Agori-Odo and Asowole Area The physiographic setting of the southwestern part of Nigeria includes plains with low lying outcrop, rugged terrains and dissected hills of various elevations ranging between 10-70metres high. The study area which is mainly a sedimentary terrain however has a high to moderate relief. The implication of the land form is that they play a dominant role in the drainage pattern (movement of sediments in and around the location area). The study area has a humid, tropical climate, most of the annual rainfall (1500mm) being confined to the period May-October. Although the area lies in the zone of tropical rain forest, the vegetation now consists of secondary growth as a consequent of intensive cultivation, deforestation and habitation. Chemical weathering is generally intense, penetrating to depths in excess of about 17-25m; this is evident in the lateritic condition of the soils and exposed ferruginous sandstones seen in the area. Sampling and analytical procedures Ten stream sediment samples were collected from selected sites in the study area while 5 were analyzed for their major and trace element compositions. Stream sediments were sampled from active stream channels selecting the silt size-clay size materials low in organic matter, which are found in the drainage basin of the river. During the stream sediment investigations, fresh samples were taken from the middle course where the river is peaceful and the samples are taken close to the bedrock of the drainage basin because a lot of
ISSN: 0975-833X
Available online at http://www.journalcra.com
International Journal of Current Research Vol. 4, Issue, 11, pp.205-213, November, 2012
INTERNATIONAL JOURNAL OF CURRENT RESEARCH
Article History:
Received 27th August, 2012 Received in revised form 18thSeptember, 2012 Accepted 22th October, 2012 Published online 23h November, 2012 Key words: Geoaccumulation, Mineralization, Pathfinder, Trace element, Sedimentary, Environmental, Ferruginous.
heavy minerals are concentrated close to the bedrock so as to get representative samples of the sampling area. Once sediments were collected, the GPS reading of that location was recorded and noted on the map. Sediments were bagged, labeled and were further air-dried for some time. Subsequently, samples were pulverized and sieved to a minus-80 mesh and weighed to 75g per sachet for laboratory analysis. The laboratory method used is inductively Coupled Plasma Mass Spectrometry (ICP-MS)
RESULTS AND INTERPRETATIONS Graphical Representation The concentrations of various trace and major elements sampled in study area are presented in form of bar charts (Fig 3a-3e) and line diagrams, (Fig.4) respectively. Each location where samples for analyses were taken from is labeled from L1 to L5 for Single-element distribution pattern. Results of chemical analyses are summarized in Table 1. To facilitate the assessment of geochemical patterns, maps are presented that show the distribution of selected elements of economic or exploration significance (Fig.7 - 14). Arsenic values range from 12-21ppm, with a regional threshold of 20.88ppm, only sediments taken from Loc 5 has a value of 21ppm, which is a little bit above the regional threshold value. Gold values in the active stream sediments are extremely low and erratic, which range from 0.3-0.7ppm, with a mean concentration of 0.56ppm.This indicates no economic mineralization in the study area. Nickel contents range from 65-80ppm with its mean concentration of 72.20ppm. No area exceeded its regional threshold of 77.83ppm. The extremely high values of lead is a general phenomenon in the location area with a mean concentration of 1354ppm, only LOC 2 and LOC 3 exceeded the regional threshold of 1409ppm,.964ppm respectively and this reflects the influence of environmental factors possibly from anthropogenic sources. This high value of lead poses a great health risk to the inhabitants of the area. Manganese content ranges from 1100ppm -1581ppm, with its mean concentration of 1113ppm and a regional threshold of 1716.65ppm. Cobalt ranges from 40-52ppm, with a mean concentration of 45.8ppm and a regional threshold of 50.6ppm.Sample of cobalt taken from LOC 3 exceeded its regional threshold, having a concentration of 52ppm. Chromium ranges from 117ppm -192ppm, with a mean concentration of 157.20 ppm and a regional threshold of 194ppm; no sample exceeded its regional threshold of 194.2ppm. Copper ranges from 61pp - 82ppm, with a mean concentration of 71.4ppm and a regional threshold of 79.03ppm.Only samples taken at LOC 3 and LOC 5 exceeded its regional threshold with a concentration of 82ppm. Lithium ranges from 40ppm - 52ppm, with a mean concentration of 46pppm and a regional threshold of 46ppm. However no area exceeded its regional threshold. Manganese ranges from 1100ppm - 1600ppm with a mean concentration of 1113ppm and regional threshold of 1716.65ppm; no area sampled exceeded its regional threshold. Phosphorus ranges from 1100ppm - 1410ppm with a mean concentration of 1189.4ppm and a regional threshold of 1318.6ppm, no area exceeded its regional threshold. Tin ranges from 14ppm - 21ppm with a mean concentration of 18.4ppm and a regional threshold of 21.28, no area exceeded its regional threshold value. Lithium ranges from 40ppm - 52ppm, with a
mean concentration of 46pppm and a regional threshold of 46ppm. However no area exceeded its regional threshold. Manganese ranges from 1100ppm - 1600ppm with a mean concentration of 1113ppm and regional threshold of 1716.65ppm, no area sampled exceeded its regional threshold. Phosphorus ranges from 1100ppm - 1410ppm with a mean concentration of 1189.4ppm and a regional threshold of 1318.6ppm, no area exceeded its regional threshold. Tin ranges from 14ppm - 21ppm with a mean concentration of 18.4ppm and a regional threshold of 21.28ppm, no area exceeded its regional threshold value. Vanadium ranges from 48ppm - 71ppm with a mean concentration of 59.2ppm and a regional threshold of 67.54ppm. Sample of vanadium taken at location LOC 3 exceeded the regional threshold value having a concentration of 71ppm. Zinc ranges from 90ppm - 113ppm with a mean concentration of 98ppm and a regional threshold of 107.4ppm. Sample of zinc taken at location LOC 4 exceeded the regional threshold value, having a concentration of 113ppm. Zirconium ranges from 600ppm - 720ppm with a mean concentration of 654ppm and a regional threshold value of 706.7ppm. Sample taken at LOC 5 exceeded its regional threshold value, with a concentration of 720ppm. Generally, no sample taken from any of these locations exceeded the anomalous values (mean+ twice standard deviation). Hence, the concentration of the trace elements in the area represented a background/regional threshold value.
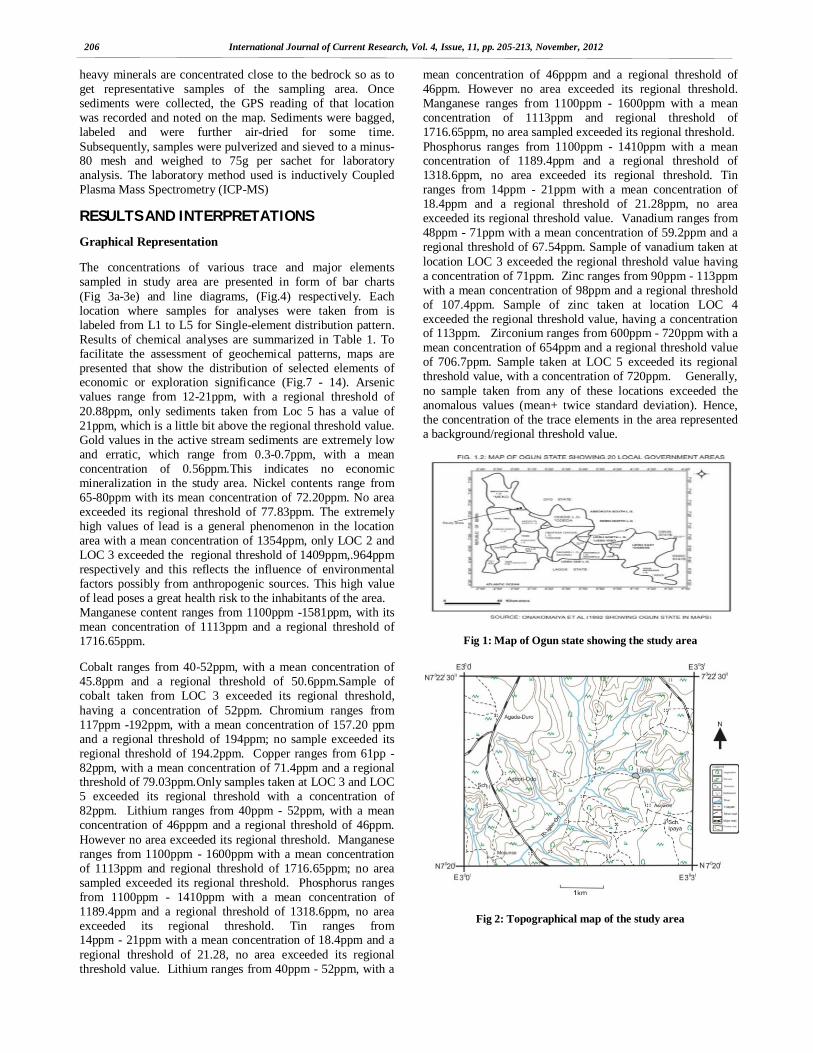
Fig 1: Map of Ogun state showing the study area
Fig 2: Topographical map of the study area
206 International Journal of Current Research, Vol. 4, Issue, 11, pp. 205-213, November, 2012

Fig. 3a Bar charts of Arsenic, Silver and Barium in stream
sediments
Fig 3b: Bar charts of Cobalt. Copper and Chromium
Fig 3c: Bar charts of Lithium. Manganese and Nickel
0
10
20
30
L1 L2 L3 L4 L5
As
As
Location
Conc
entr
atio
n (p
pm)
207 International Journal of Current Research, Vol. 4, Issue, 11, pp. 205-213, November, 2012

Fig 3d: Bar charts of Phosphorus. Tin and Lead
Fig 3e: Bar charts of Vanadium, Zinc and Zircon
Fig 4: Geological map of the study area
Fig 5: Sampling Points of the study area
0
20
40
60
80
SI02AL2O
3FE2O
3M
NO
MG
OCAON
A2OK2OTIO
2P2O
5
L1
L2
Element
Conc
entr
atio
n(%
)
01020304050607080
SI02AL2O
3FE2O
3M
NO
MG
OCAON
A2OK2OTIO
2P2O
5
L3
L4Conc
entr
atio
n (%
)
Major Elements
208 International Journal of Current Research, Vol. 4, Issue, 11, pp. 205-213, November, 2012

Fig 6: Line diagrams for major element concentrations in sample L1,L2,L3 L4 and L5
Fig7: Distribution of Arsenic (As) in stream sediments
Fig 8: Geochemical map showing the distribution of copper in the study area
Fig 9: Distribution of Nickel (Ni) in stream sediments
Fig 10: Geochemical map showing the distribution of Nickel (Ni) in the study area
Fig 11: Distribution of Copper (Cu) in stream sediments
Fig 12: Geochemical map showing the distribution of copper in the study area
Fig 13 Distribution of Zinc (Zn) in stream sediments
01020304050607080
SI…A… FE…M
…M
…C… N
…K… TI…P…
L5
L5Conc
entr
atio
n(%
)
Major Elements
209 International Journal of Current Research, Vol. 4, Issue, 11, pp. 205-213, November, 2012

Fig 14. Geochemical map showing the distribution of Zinc in the study area
SCATTER PLOTS FOR Zn-Ni
NI (PPM)
82807876747270686664
ZN (P
PM
)
120
110
100
90
80 Rsq = 0.9545
SCATTER PLOTS FOR Mn-Cu
CU (PPM)
90807060
MN
(PPM
)
1700
1600
1500
1400
1300
1200
1100
1000 Rsq = 0.6401
SCATTER PLOTS FOR As-Mn
MN (PPM)
17001600150014001300120011001000
AS (P
PM)
22
20
18
16
14
12
10 Rsq = 0.4677
SCATTER PLOTS FOR Cu-Co
CO (PPM)
545250484644424038
CU
(PPM
)
90
80
70
60 Rsq = 0.6810
Fig 15: Scatter Plots between selected trace elements
Fig 16: Total Alkali Vesus Silica Diagram (Cox et al., 1979)
Fig 17: Total Alkali Versus silica Plot
55555555555555N =
ZRZNVSNPBPNIMNLICUCRCOBAAS
8
6
4
2
0
-2
-4
5.005.00
2.00
1.00
2.00
5.001.00
Fig 18: Box Plot for Igeo of trace elements concentrations In stream sediments
210 International Journal of Current Research, Vol. 4, Issue, 11, pp. 205-213, November, 2012

Table 1: Statistical Parameters for stream sediments samples taken at Agada-Duro and environs, southwestern Nigeria
Elementa Or Oxides
N Range Mean Std
Dev. Mean + 1 Std. Dev.
As,ppm 5 9.00 16.80 4.08 20.88 Au,ppm 5 0.50 0.56 0.2 0.76 Ba,ppm 5 100 462.0 37.7 499.7 Co,ppm 5 12 45.8 4.8 50.61 Cr,ppm 5 75 157.2 37.0 194.2 Cu,ppm 5 21 71.4 7.6 79.03 Li,ppm 5 12 46.0 5.33 51.33
Mn,ppm 5 1486 1113.0 603.6 1716.7 Ni,ppm 5 15 72.2 5.63 77.83 P,ppm 5 310 1189.4 129.2 1318.65
Pb,ppm 5 110 1354.0 55.9 1409.94 Sn,ppm 5 7 18.4 2.88 21.28 V,ppm 5 23 59.2 8.34 67.54 Zn,ppm 5 23 98.0 9.43 107.43 Zr,ppm 5 120 654.0 52.7 706.7 SiO2,% 5 3.50 67.47 1.33 68.8
Al2O3 ,% 5 5.25 10.42 2.12 12.54 Fe2O3 ,% 5 3.0 8.05 1.18 9.2 MnO ,% 5 1.90 1.12 0.75 1.88 MgO,% 5 1.18 2.56 0.51 3.07 CaO,% 5 2.53 2.78 1.10 3.88 Na2O,% 5 2.72 2.67 1.15 3.82 K2O,% 5 4.03 3.41 1.52 4.93 TiO2 ,% 5 1.71 1.06 0.65 1.71 P2O5 ,% 5 2.88 3.05 1.20 4.2
Table: 2 Total Alkalis versus Silica
Table: 3 Alumina content
Table 5: Index of Geoaccumulation (Igeo) and contamination
level
Statistical analysis
Table 4: Correlation coefficient ‘r ‘for selected trace elements
As Au Ba Co Cr Cu Li Mn Ni P Pb Sn V Zn Zr As 1 Au .932* 1 Ba -.825 -.627 1 Co .785* .716 -.438 1 Cr .022 .340 .492 .267 1 Cu .558 .597 -.308 .825* .430 1 Li .722 .836* -.621 .224 .171 .202 1 Mn .674 .724 -.495 .643 .368 .902* .536 1 Ni .665 .865* -.156 .675 .747* .602 .624 .617 1 P .429 .307 -.787 -.024 -.475 .187 .544 .509 -.133 1 Pb -.280 -.500 .256 .199 -.307 -.034 -.845 -.431 -.416 -.514 1 Sn -.820 -.762 .912 -.317 .226 -.282 -.878 -.588 -.361 -.809 .624 1 V .138 .006 .602 .443 .751 .497 -.415 .167 .435 -.731 .383 .609* 1 Zn .434 .677 .677 .501 .805* .340 .467 .302 .932* -.434 -.308 -.101 .521 1 Zr
.910*
.841
.841
.467
-.187
.237
.853*
.457
.485
.571
-.464
-.935
-.496
.297
1
Table 6: Geoaccumulation indices for selected trace elements
Elements(PPM)
As Ba Co Cr Cu Li Mn Ni P Sn V Zn Zr Samples L1 -0.32 -0.71 0.41 0.26 -0.12 -1.74 -0.21 -0.77 0.09 1.15 -1.7 -0.51 1.15 L2 -0.21 -0.1 0.48 -0.36 -0.29 -1.17 -0.19 -0.97 -0.03 1.22 0.95 -0.58 1.19 L3 0.263 -0.94 0.79 0.26 0.12 -1.09 0.31 -0.68 0.08 1.15 1.24 -0.42 1.15 L4 0.42 -0.97 0.68 0.36 0.08 -0.79 0.13 -0.59 0.006 0.91 -1.68 -0.26 1.3 L5 0.48 -1.17 0.65 -0.36 -0.02 -0.81 0.33 -0.76 0.32 0.63 -2.28 0.44 1.41
Elements(Oxides) SiO2(%) Na2 O + K2O (%) Samples
L1 66.81 7.78 L2 69.11 5.79 L3 68.22 3.06 L4 67.61 8.89 L5 65.61 4.92
Elementss(Oxides) Al2O3 (%)
Na2 O + K2O (%)
Na2 O + K2O (%) Protolith Type
Samples L1 9.00 7.78 10.45 Metaluminous L2 10.76 5.79 7.37 Per-aluminous L3 12.86 3.06 6.75 Per-aluminous L4 11.88 8.89 13.0 Metaluminous L5 7.61 4.92 6.81 Per-aluminous
211 International Journal of Current Research, Vol. 4, Issue, 11, pp. 205-213, November, 2012

In order to investigate elemental associations among the trace elements in the stream sediments, Pearson correlation was calculated using the SPSS statistical package version 15.0 (Table 4). Very strong and high correlation exists between Cu-Co, Ni-Au, Zn-Cr, Zn-Ni, Zr-As, Ni-Cr and Au-As with “r” as 0.825,0.865,0.805,0.932,0.910,0.747 and 0.932 respectively which indicate same source. Hence negative correlation exist between Zr-V, Pb-Ni, Pb-As, Sn-Co with “r” as -0.496,-0.416,-0.280,-0.317 respectively which suggests different source. Total Alkali Versus Silica Major oxides are used to classify igneous rocks using the TAS diagram (Fig. 16) which divides rocks into Ultra basic, Basic, Intermediate and acid on the basis of their silica content (Cox et al,, 1979).Results are presented in Table.2. From this plot (Fig 17), it was discovered that they all lie above 63%. This indicates that the sediments must have been derived from a protolith that is acidic. Classification based on alumina content Consideration
When Na2O + K2O > Al2O3, it implies a per alkaline parent rock.
When Al2O3 > CaO + K2O + Na2O, it implies a per-aluminous parent rock.
When Na2O + K2O < Al2O3 < CaO + K2O + Na2O, it implies a metaluminous parent rock.
From the above consideration it was discovered that the stream sediments of LOC 2, 3, and 5 were derived from a Peraluminous parent rocks while LOC 1 and 4 were derived from a Metaluminous parent rock (Table 3).
Environmental Geology In order to ascertain the degree of contamination and distinguish between natural and anthropogenic pollution sources, the index of Geoaccumulation (Muller, 1969) was used to determine the implication of trace element distribution in the stream sediments of the study area.
Index Of Geoaccumulation
The index of geoaccumulation (Igeo) can be used to assess whether or not the stream sediments have been contaminated by trace elements (Muller 1969).
Igeo =Log2 CN /1.5 BN
Where CN is the measured concentration of element N in the stream sediments, and BN is the content of elements in ‘average shale’, either directly measured in texturally equivalent uncontaminated stream sediments/soil or taken from literature. The factor 1.5 is introduced to include possible differences in the background values due to litho logical variations. The miller index of geoaccumulation found in various soils/stream sediments is widely recognized in Europe. Igeo consist of seven grades ranging from unpolluted to very seriously polluted (Table 5). The geoaccumulation indices for selected trace elements are presented in Table. 6 Lead displayed a very high contamination level with an Igeo class of 5, which indicates a high level of contamination (Fig. 18). The high
contamination level of Pb in the stream sediments shows that they must have been from potential anthropogenic sources such as from exhaust pipes of motor vehicles, herbicides, chemical contaminants or fertilizer input in farm lands. However, Zr was also moderately polluted in the stream sediments sampled (Fig. 18) with an Igeo of class 2. Co ranged from Uncontaminated to moderately contaminated in the stream sediments (Fig. 18) with an Igeo of class 2. According to the index of geoaccumulation (Igeo) and the contamination level, the degree of contamination from strong to weak in the stream sediments is Pb>Zr>Sn>Co. Generally no other trace elements showed significant contamination level in the stream sediments
Summary and Conclusion
The results of the geochemical analysis of the stream sediments sampled from the study area were interpreted using total alkali versus silica (TAS), Alkali Lime Index diagram, and statistical techniques using correlation coefficient(r). The relative abundance of major elements decreases in the order- SiO2 > Al2O3 > Fe2O3 > K2O > P2O5 > CaO > Na2O> MgO> MnO>TiO2. Interpretations, using Major oxides plots such as Total Alkali versus Silica Content and Alumina content plots showed that samples taken from location 1(L1) and Location 4 (L4) possessed a geochemical characteristic equal to that of a metaluminous rich felsic igneous rock while samples taken from Location 2 (L2), Location 3 (L3) and Location 5 (L5) have been sourced from a peraluminous rich felsic igneous rock. Thus, the stream sediments were proposed to have been geogenically sourced from the mineral constituents that make up the protolith, which are rich in aluminum and silicon related minerals. Statistical analysis of trace elements concentrations and analysis of various metal associations as possible pathfinders for mineralization revealed that there was no appreciable anomaly recorded in the area and no significant economic mineralization could be ascertained. Correlation coefficients between trace elements showed positive for Cu-Co,Ni-Au,Zn-Cr,Zn-Ni,Zr-As and Ni-Cr with “r” as 0.825,0.865,0.805,0.932,0.910 and 0.747 respectively, this revealed that the trace elements were sourced from the same rocks, possibly by co-precipitation of the trace elements in the drainage basin, while the negative correlation between Zr-V,Pb-Ni,Pb-As,Sn-Co with “r” as -0.496,-0.416,-0.280,-0.317 showed that the trace elements were from different sources. Environmental investigations using index of Geoaccumulation, showed the area to be highly polluted in the following order Pb> Zr> Co .This suggests that there must have been an anthropogenic input such as from car exhaust pipes, fertilizers, herbicides and other chemical contaminants in and around the study area. This area could be further investigated by a combination of detailed stream sediment and soil surveys in which the samples are analyzed for other related elements. Acknowledgment The authors are highly indebted to Prof O.O kehinde- Phillips of the Department of Earth Sciences Olabisi Onabanjo University Ago-iwoye. Dr. Oshin, O.O was exceptionally supportive Chemical analysis was done at the Activation laboratories Limited Ontario Canada.
REFFERENCES
212 International Journal of Current Research, Vol. 4, Issue, 11, pp. 205-213, November, 2012

Cooray, P.G. (1974): Some aspects of precambrian geology of Nigeria: a review.(Nigerian) J.Min.Geol.,8, 17-43.
Cox,K.G,Bell,Y.D and Pankhirst,R.J.(1979):The interpretation of igneous rock.George,Allen and Unrin,London
Elueze, A.A and Olade,M.A (1985): Interpretation through factor analysis of stream sediment reconnaissance data for gold exploration in Ilesha green stone belt,southwest
Nigeria.In:Paper,Institution of Mining and Metallurgy. Matheis,G (1978):The application of geochemical mapping as
a mineral exploitation tool in the metasedimentary belts of S.W.Nigeria.Bull.Geol. Ahmadu Bello Univ,1,33-35.
Muller , G .(1969) :Index of Geoaccumulation in sediments of Rhine River. Geol. Journal (2). Pp 108-118p
Omatsola, M.E. and Adegoke, O.S. (1981):T ectonic and cretaceous stratigraphy of the Dahomeyan Basin.Journalof Min.Geology.vol 54.pp65 87.
*******
213 International Journal of Current Research, Vol. 4, Issue, 11, pp. 205-213, November, 2012