
Availability of skilled labour in selected occupations...
84
Availability of skilled labour in selected occupations in Western Australia Chandra Shah Richard Cooney Michael Long & Gerald Burke August 2005 MONASH UNIVERSITY - ACER CENTRE FOR THE ECONOMICS OF EDUCATION AND TRAINING
Transcript of Availability of skilled labour in selected occupations...

Availability of skilled labour in selected occupations in Western
Australia
Chandra Shah
Richard Cooney
Michael Long
& Gerald Burke
August 2005
MONASH UNIVERSITY - ACER
CENTRE FOR THE ECONOMICS OF EDUCATION AND TRAINING


Availability of skilled labour
Contents
Acknowledgements................................................................................................. vii
Executive summary ................................................................................................ viii
1. Introduction...................................................................................................... 1
2. Review of previous studies.................................................................................. 3
3. Companies’ perspectives on skills issues.............................................................. 6 3.1 Company interviews’ summary ..............................................................................6 3.2 Demand for trade and sub-trade skills for selected projects......................................9
4. State and national trends in employment and training......................................... 16 4.1 Employment trends.............................................................................................16 4.2 Job openings for new entrants.............................................................................17 4.3 Trends in vocational education and training .........................................................18 4.4 Contribution of migration to labour supply ...........................................................23 4.5 Skills shortages: indicators, implications and policy responses ................................24 4.6 Summary...........................................................................................................28
5. Demand and supply in selected occupations...................................................... 30 5.1 Introduction.......................................................................................................30 5.2 Mechanical and fabrication trades.......................................................................31
5.2.1 Metal fitters and machinists ...............................................................................32 5.2.2 Structural steel and welding tradespersons ..........................................................37 5.2.3 Supply of qualified personnel.............................................................................41 5.2.4 Summary .........................................................................................................43
5.3 Electrical trades .................................................................................................43 5.3.1 Electricians ......................................................................................................44 5.3.2 Other electrical trades ......................................................................................49 5.3.3 Supply of qualified personnel.............................................................................54 5.3.4 Summary .........................................................................................................55
5.4 Construction sub-trades......................................................................................56 5.4.2 Supply of qualified personnel.............................................................................61 5.4.3 Summary .........................................................................................................62
6. Concluding remarks........................................................................................ 64
References............................................................................................................ 66
Appendix 1 Detailed statistical tables on Australian migration.................................... 68
iii

Availability of skilled labour
Tables and figures
Tables Table 1 Historical (1998-04) and projected (2005-10) employment in Western Australia and
Australia (‘000) ...................................................................................................................... 17
Table 2 Job openings for new entrants in Western Australia and Australia, (2005-2010) (‘000).
................................................................................................................................................. 18
Table 3 ‘Traditional’ apprenticeship numbers in Western Australia and Australia, 1997-2004 ...
................................................................................................................................................. 20
Table 4 Apparent completion rates for ‘traditional’ apprenticeships in Western Australia and Australia, 2001-2004............................................................................................................. 20
Table 5 Traineeship numbers in Western Australia and Australia, 1997-2004.......................... 21
Table 6 Apparent traineeship completion rates in Western Australia and Australia, 1997-2004.
................................................................................................................................................. 21
Table 7 Withdrawals and cancellations from contract of training in Western Australia and Australia, 1997-2004............................................................................................................. 22
Table 8 Trends in number of students enrolled and hours of training provided in VET in Western Australia and Australia, 1995-2004..................................................................... 23
Table 9 Skill shortages in selected* trade occupations, December 2004.................................... 25
Table 10 Selected occupations for investigation and the associated Training Packages ............ 30
Table 11 Numbers of metal fitters and machinists employed in Western Australia and Australia, Census 2001......................................................................................................... 32
Table 12 Historical and projected (2005-2010) employment of metal fitters and machinists (ASCO 4112) in Western Australia and Australia, (‘000) ............................................... 34
Table 13 Job openings for new entrants to metal fitters and machinists trades (ASCO 4112) in Western Australia and Australia, (2005-2010) (‘000)....................................................... 36
Table 14 Numbers of structural steel and welding tradespersons employed in Western Australia and Australia, Census 2001................................................................................. 37
Table 15 Historical and projected (2005-2010) employment of structural steel and welding tradespersons (ASCO 4122) in Western Australia and Australia .................................. 39
Table 16 Job openings for new entrants to the structural steel and welding trades in Western Australia and Australia, (2005-2010) (‘000)....................................................................... 41
Table 17 Numbers of apprentices in mechanical and fabrication trades in Western Australia and Australia, 1997-2004 ..................................................................................................... 42
Table 18 Employment of electricians in Western Australia and Australia, Census 2001........... 45
Table 19 Historical and projected (2005-2010) employment of electricians (ASCO 4311) in Western Australia and Australia ......................................................................................... 47
iv

Availability of skilled labour
Table 20 Job openings for new entrants the electricians trade (ASCO 4311) in Western Australia and Australia, (2005-2010) (‘000)....................................................................... 49
Table 21 Numbers employed in ‘other electrical trades’ in Western Australia and Australia, Census 2001........................................................................................................................... 50
Table 22 Historical and projected (2005-2010) employment in other electrical trades (ASCO 4312, 4314, 4316) in Western Australia and Australia .................................................... 52
Table 23 Job openings for new entrants in other electrical trades (ASCO 4312, 4314, 4316) in Western Australia and Australia, (2005-2010) (‘000)....................................................... 54
Table 24 Trends in apprentices training for electrical trades in Western Australia and Australia, 1997-2004 .............................................................................................................................. 55
Table 25 Employment in construction sub-trades in Western Australia and Australia, Census 2001 ........................................................................................................................................ 57
Table 26 Historical and projected (2005-2010) employment in constructed sub-trades (ASCO 4312, 4314, 4316) in Western Australia and Australia .................................................... 59
Table 27 Job openings for new entrants in construction sub-trades (ASCO 7111, 7122, 7913) in Western Australia and Australia, (2005-2010) (‘000) .................................................. 60
Table 28 Estimated enrolments at certificates I-IV in Civil Construction (BCC), General Construction (BCG) or Metal and Engineering Industry (MEM) Training Packages in Western Australia and Australia, 2001-2004..................................................................... 62
Table A1 All long-term movements by category, 2001-02 to 2003-04 (‘000)............................... 68
Table A2 Permanent arrivals by visa category, 2001-04 (‘000) ....................................................... 69
Table A3 Age profiles of permanent arrivals and departures, 2003-04 (%).................................. 70
Table A4 Country of citizenship of permanent arrivals by visa category, 2001-02 to 2003-04 (per cent)................................................................................................................................ 70
Table A5 Permanent movements by occupation, 2001-02 to 2003-04, (‘000) ............................. 71
Table A6 Long-term resident movements by occupation, 2001-02 to 2003-04, (‘000)............... 72
Table A7 Long-term New Zealand citizen movements by occupation, 2001-02 to 2003-04 .... 73
Table A8 Country of citizenship of temporary residents on business (long stay) visas in Australia (per cent) ............................................................................................................... 75
Table A9 Intended state of residence on arrival of temporary residents on 457 visas in Australia, September, 30 2004, (per cent) ......................................................................... 75
Table A10 Temporary resident arrivals on business (long stay) visas by occupation, 2001-02 to 2003-04, (per cent)................................................................................................................ 76
Table A11 Occupations of pre- and post-migration jobs held by permanent immigrants (per cent) ........................................................................................................................................ 77
v

Availability of skilled labour
Figures Figure 1 Aggregated demand for mechanical tradespersons across a selection of projects in
the resources sector in Western Australia, 2005-2010 .................................................... 10
Figure 2 Net changes in monthly demand for mechanical tradespersons across a selection of projects in the resources sector in Western Australia, 2005-2010................................. 11
Figure 3 Aggregated demand for electrical tradespersons across a selection of projects in the resources sector in Western Australia, 2005-2010........................................................... 12
Figure 4 Net changes in monthly demand for electrical tradespersons across a selection of projects in the resources sector in Western Australia, 2005-2010................................. 13
Figure 5 Aggregated demand for construction sub-trades across a selection of projects in the resources sector in Western Australia, 2005-2010........................................................... 14
Figure 6 Net changes in monthly demand for construction sub-trades across a selection of projects in the resources sector in Western Australia, 2005-2010................................. 15
Figure 7 Index of employment in Western Australia and Australia ............................................. 17
Figure 8 Skilled vacancies index (SVI) for Western Australia and Australia, June 1990 to June 2005 ........................................................................................................................................ 26
Figure 9 Skilled vacancies index (SVI) for metal trades for Western Australia and Australia, June 1990 to June 2005........................................................................................................ 32
Figure 10 Historical and projected employment of metal fitters and machinists (ASCO 4112) in Australia ................................................................................................................................. 33
Figure 11 Historical and projected employment of metal fitters and machinists (ASCO 4112) in Western Australia ................................................................................................................. 34
Figure 12 Numbers of metal fitters and machinists (ASCO 4112) employed by age in 1999 and 2004, Australia....................................................................................................................... 35
Figure 13 Net entrants and net separations of metal fitters and machinists (ASCO 4112) by age between 1999 and 2004, Australia...................................................................................... 36
Figure 14 Historical and projected employment of structural steel and welding tradespersons (ASCO 4122) in Australia.................................................................................................... 38
Figure 15 Historical and projected employment of structural steel and welding tradespersons (ASCO 4122) in Western Australia.................................................................................... 38
Figure 16 Numbers of structural steel and welding tradespersons employed (ASCO 4122) by age in 1999 and 2004, Australia .......................................................................................... 40
Figure 17 Net entrants and separations of structural steel and welding tradespersons (ASCO 4122) by age between 1999 and 2004, Australia .............................................................. 40
Figure 18 Skilled vacancies index (SVI) for electrical trades for Western Australia and Australia, June 1990 to June 2005........................................................................................................ 44
Figure 19 Historical and projected employment of electricians (ASCO 4311) in Australia........ 46
Figure 20 Historical and projected employment of electricians (ASCO 4311) in Western Australia ................................................................................................................................. 46
Figure 21 Number of electricians (ASCO 4311) employed by age in 1999 and 2004, Australia
vi

Availability of skilled labour
................................................................................................................................................. 48
Figure 22 Net entrants and net separations of electricians (ASCO 4311) by age between 1999 and 2004, Australia ............................................................................................................... 48
Figure 23 Historical and projected employment in other electrical trades (ASCO 4312, 4314, 4316) in Australia.................................................................................................................. 51
Figure 24 Historical and projected employment in other electrical trades (ASCO 4312, 4314, 4316) in Western Australia .................................................................................................. 51
Figure 25 Numbers employed in other electrical trades (ASCO 4312, 4314, 4316) by age in 1999 and 2004, Australia ..................................................................................................... 52
Figure 26 Net entrants and net separations of other electrical tradespersons (ASCO 4312, 4314, 4316) by age between 1999 and 2004, Australia .............................................................. 53
Figure 27 Historical and projected employment in construction sub-trades (ASCO 7111, 7122, 7913) in Australia.................................................................................................................. 58
Figure 28 Historical and projected employment in construction sub-trades (ASCO 7111, 7122, 7913) in Western Australia .................................................................................................. 58
Figure 29 Numbers employed in construction sub-trades (ASCO 7111, 7122, 7913) by age in 1999 and 2004, Australia ..................................................................................................... 59
Figure 30 Net entrants and net separations of construction sub-tradespersons (ASCO 7111, 7122, 7913) by age between 1999 and 2004, Australia.................................................... 60
Figure A1 Stock of temporary residents on business (long stay) visas in Australia, June 1997 to December 2004..................................................................................................................... 74
vii

Availability of skilled labour
Acknowledgements
The report acknowledges the assistance provided by the officers of the Chamber of Commerce and Industry of Western Australia and the Department of Education and Training (Western Australia) for this project. We also wish to thank the human resource managers of the resource companies in Western Australia who gave up invaluable time to be interviewed and for providing data on labour demand for this project.
viii

Availability of skilled labour
Executive summary
This report was commissioned by the Chamber of Commerce and Industry of Western Australia (CCI) on behalf of its major member companies in the resources sector. Many of these companies will develop a number of significant resource projects in Western Australia in the next 5 to 6 years.
Concern that shortages of skilled labour may constrain development of new projects in the resources sector in coming years has motivated several reports. This report investigates the future supply of and demand for certain types of skilled labour at the trades and sub-trades levels that will be required for these new resource projects through until 2010.
This report investigates the demand for and supply of workers in the following selected trade and sub-trade occupations:
• fitters, boilermakers, pipe fitters and welders;
• electrical trades; and
• construction sub-trades (including mobile plant, crane, hoist and lift operators and structural steel construction workers).
The occupations have been identified by the companies concerned as important to the completion of their major resources projects in Western Australia over the next five years.
The report describes:
• the nature of skills shortages;
• the experiences of the companies in recruiting skilled labour and their strategies to address skills shortages;
• projected changes in employment to 2010 from growth and replacement of those who leave for reasons such as retirement, ill-health etc, both overall in Western Australia and nationally as well as for workers in the selected occupations;
• the expected number of newly trained workers resulting from apprentices currently in training; and
• the contribution of migration to meeting the demand for new workers.
Major findings
Fitters, boilermakers, pipe fitters and welders
Western Australia will require an additional 2,050 metal fitters and machinists and 3,050 workers in the structural steel and welding trades, a total of 5,100 qualified persons in these trades, in the five and half years through to 2010. These people work mainly as fitters, boilermakers, pipe fitters and welders.
Some of this demand will be met by the 3,200 people in Western Australia currently undertaking the relevant training and who will complete their training by 2008. Perhaps only three-quarters of these, or 2,400, will be available to work as fitters, boilermakers, pipe fitters
ix

Availability of skilled labour
and welders—some may work in other occupations requiring similar training or in other occupations that require little training and others may not work at all as they pursue further or different studies.
Migration is likely to supply only a small number of workers in these trades, between 480 and 530 persons.
Supply of new fitters, boilermakers, pipe fitters and welders to 2008 will be about 2,930. This has to be seen against the demand estimated at 5,100. The shortfall of 2,170 will need to be made from new people beginning apprenticeships that they will complete in 2009 and 2010 and possibly interstate and overseas migration.
After allowing for wastage through non-completion, movements of graduates to other occupations, the four years required for completing an apprenticeship and no change in migration numbers, Western Australia needs at least 3,450 apprenticeship commencements in the metals trades in 2005 and 2006 to meet projected demand. This represents an increase of about 30 per cent over and above the numbers of commencements in 2004.
Electricians trades
Western Australia needs an extra 2,400 electricians and 700 workers in other electrical trades (refrigeration and air-conditioning, electronic instrument and communications) to meet demand for these occupations through to 2010—a total future demand of 3,100 qualified persons.
About 1400 additional workers for the electrical trades will come from those currently in apprenticeships in the years through to 2008. Overseas migration will provide perhaps another 550 electricians and other electrical tradespersons through until 2010.
The supply of 1,950 can be compared with the estimated demand of 3,100. The projected shortfall of 1,150 workers needs to be met from apprentices starting in 2005 and 2006 as well as and interstate and additional overseas migration.
If there is no change in migration numbers then Western Australia needs to attract 1,330 persons to commence training in the next two years. This represents an increase of about 15 per cent over and above the numbers of commencements in 2004.
Construction sub-trades
Western Australia needs an additional 900 mobile plant operators; 200 crane and lifts operators and 200 scaffolders, riggers and steel fixers and erectors to fill expected new jobs through until 2010.
The skills pathway to enter these sub-trade positions is not as well documented or clearly defined as for the trades. In 2003, however, the number of people undertaking non-apprenticeship based training in Western Australia using one of the three relevant Training Packages—Civil Construction (BCC), General Construction (BCG) or Metal and Engineering Industry (MEM)—was about 5,600. All these people have some or all the skills necessary to work in the construction sub-trades. If any lack the skills necessary to work in a particular situation then only a small amount of training will be needed to make them job-ready.
This group receives training useful in a large number of occupations and industry sectors. The resources sector has to compete with these other sectors for these personnel.
It is difficult to estimate the optimum number of persons who should be trained to ensure adequate supply for the construction sub-trades—the data are not adequate to the task. Since
x

Availability of skilled labour
the necessary training can be delivered in a relatively short period, any skills shortage is more likely to reflect the number of persons available for work.
Under current policies, migration is likely to contribute very few new workers in these occupations.
Broader skill issues The resources sector is more prone to experiencing skills shortages and recruitment problems than other sectors because development projects are often in remote and regional areas of the state.
Companies that participated in the consultations identified skilled labour shortages as an important risk currently affecting project planning. To mange this risk they have implemented strategies to improve efficiency in the use of existing labour and reducing future demand; recruitment and retention; and skill formation.
Short-term fluctuations in labour demand for projects make it difficult for companies to offer on-going jobs and maintain a permanent workforce. This however increases the risk of labour shortages. Cooperation between project owners in the scheduling of different phases of projects and in the sharing information on labour supply has the potential to even out demand over time and thus reduce the risk of shortages, though labour costs are only one of the issues affecting the size and timing of investment.
The extent of net separations, particularly among younger aged workers, from some trade occupations should be a concern for industry and governments. Further research is needed to corroborate these initial findings and to also find the causes.
The apprenticeship system in Western Australia is relatively quite efficient—apparent apprenticeship completion rates are much higher than the rest of the country. The system can therefore deliver the additional qualified personnel to meet the anticipated demand if capacity is expanded and enough people are attracted to take up training.
Net migration to Western Australia can contribute towards alleviating some skills shortages. The Australian skills migration programmes are however biased towards immigration of people with higher skills than those at the trade or sub-trade level. Furthermore, getting migrants to work in regional and remote areas, where much of the work is in the resources sector, is a challenge as is that of ensuring migrants’ skills are fully recognised in the Australian labour market.
One way of attracting skilled migrants to the regions in Western Australia is through the State-Specific and Regional Migration Initiatives. Western Australia lags well behind Victoria in successfully attracting skilled migrants under this scheme. Successful strategies in this area are those that have the various levels of government working in partnership with regional employers.
xi


Availability of skilled labour
1. Introduction
The Western Australian economy is currently buoyant with low unemployment and record high business optimism.
Investment, particularly in the state’s resources sector, comprising minerals, oil and gas, is significant. As at June 2005, the value of significant resource projects underway or planned in the state was estimated to be A$51 billion. These projects were expected to create 32,100 jobs at the construction phase and 7,100 permanent operational phase jobs (Government of Western Australia 2005).
With continuing high prices for these commodities in world markets sustained by demand from China and India, a number of new projects are likely to become commercially viable and given the green light for full scale development.
The supply of skilled labour at the right time and right place will be critical for the commercial development of the projects. The current general tightness in the overall labour market has created concern about availability of certain types of skilled and semi-skilled labour for these projects. The often remote location of many resource projects in Western Australia means that even if labour is available at the state level, there may still be recruitment difficulties.
This report was commissioned by the Chamber of Commerce and Industry of Western Australia (CCI), on behalf of its major member companies in the resource sector. Many of these companies are likely to develop a number of significant resource projects in the state in the next five years.
This report investigates the future supply of and demand for certain types of skilled labour at the trades and sub-trades levels that will be required for these projects up to 2010. In particular, it focuses on skilled labour in the mechanical, fabrication and electrical trades and mobile plant operators and construction workers in the sub-trades.
The resource sector competes with the manufacturing sector, mainly defence and shipbuilding in Western Australia, the housing and building construction sector and other infrastructure projects for skilled and semi-skilled labour. Other interstate resources, and sometimes infrastructure, projects also compete for similar types of skilled labour. The study of supply and demand for skilled labour has therefore to be considered in the state and national context.
The research for this report included:
• a review of the other studies of skill needs in Western Australia;
• discussions with individual company and organisation representatives as nominated by CCI as the project manager;
• analyses of some participating companies’ data;
• analyses of state and national data on employment trends and labour turnover; and
• detailed study of the skilled and semi-skilled occupations of interest for this project.
Evidence to support the research was obtained from published and unpublished data from the National Centre for Vocational Education research (NCVER), the Australian Bureau of Statistics (ABS) and the Department of Immigration and Multicultural and Indigenous Affairs (DIMIA).
1

Availability of skilled labour
Additional data were gathered through consultations with individual company and organisation representatives as nominated by the project manager at CCI and confidential company data on labour requirements in selected occupations for major projects there were being commissioned or likely to be commissioned in 2005-2010.
Structure of the report The rest of the report is structured as follows. The next chapter presents a short review of previous research that has examined problems of supply and demand for labour in the resources sector in Australia, but particularly in Western Australia. Chapter 3 contains a summary of views on the risks of skills shortages and their management by the participating companies. The chapter also includes analyses of the estimated demand for different types of labour for a number of projects being considered by some of the participating companies. Chapter 4 provides analyses of employment and training trends and skills shortages issues at the state and national level as a context for this study. Chapter 5 presents the analyses of the demand for and supply of labour in the selected occupations that are of particular interest for this study. The final chapter contains some concluding remarks.
2

Availability of skilled labour
2. Review of previous studies
There have been many reports looking at the demand for and supply of labour for the many resource projects in Australia, particularly in Western Australia. With changing technology and organisational arrangements demand for and the source of labour keeps changing. For example, air travel has reduced the tyranny of distance so that workers can be flown in and out to work on remote sites, for instance, on a cycle of four weeks on one week off. This means that labour for projects can be sourced from distant, sometime interstate and international, sites. This report briefly reviews a few of only the most recent studies.
The Burrup Skills Task Force Report The Burrup Skills Taskforce reported on strategies to address the skill requirements of six planned projects worth A$7.5 billion in the Burrup Peninsula of Western Australia (Burrup Skills Taskforce 2003). The planned projects, all in the oil, gas and petrochemical industries, were committed or planned for 2004 to 2007 and included among others the Woodside LNG expansion (Trains 4 and 5).
The taskforce estimated peak demand for a construction workforce of 6000 personnel in 2005 and a potential for 600 direct and 1700 indirect jobs in the operational phase of the projects. Skills requirements at the trade and semi-trade level were identified in the following areas:
• metals/engineering, electrical/electronic/instrumentation tradespersons; and
• mobile plant and crane operators.
The report concluded that Western Australia had the capacity to supply all labour requirements for the projects via a combination of strategies that were used in 1997/1998 when there was a peak demand for the construction workforce.
The strategies included rapid-response skills development and training, including up-skilling of existing tradespersons, short-term interstate migration and temporary business entry visas.
The report noted that it was likely that skilled people would be attracted to work on the Burrup from other parts of Western Australia and interstate and hence a potential existed for skill shortages elsewhere than the Burrup. Thus one of the recommendations contained in the report was for the government to target and implement strategies ‘to prevent or minimise skill shortages within a whole-of-State context’.
The Argus Report Western Australian Development Projects Employment Demand and Predicted Skill Requirements 2003 – 2007 (ARGUSRESEARCH 2004) was prepared for the Western Australian Department of Education and Training. The study considered all major development projects in the state at that time.
The report identified 62 development projects, valued at A$44.2 billion, committed or being considered for investment in Western Australia as at December 2003. Of these 35 projects valued at A$17.4 billion were committed for construction.
3

Availability of skilled labour
The workforce for the 35 projects committed for construction was forecast to peak at 8,600 during 20041. When operational by 2007, these projects were expected to collectively employ a permanent workforce of 1,500.
Just over half (57 per cent) of the peak labour requirements was estimated to be at the trade, semi-trade and unskilled level.
The value of projects considered in the Argus Report was 132 per cent higher than the value of those considered in the Burrup Skills Task Force Report, yet the expected peak labour demand was only 43 per cent higher. The data from the two reports do not allow an examination of the reasons why the investment/labour ratios in the two projects were so different. It is not clear from the reports how many of the projects considered by the Burrup Skills Task Force Report are also included in the Argus Report. The Argus Report’s recommendations included the adoption of a collaborative training strategy and shared responsibility involving industry, employers, unions and government to ensure skilled labour was available to complete the projects.
Action was suggested in areas of up-skilling, workforce re-entry training, labour migration and retention. Additionally, it was suggested that better information should be disseminated about the development projects and the associated employment opportunities to attract workers to these projects.
NCVER/NILS Report (include reference in endnote) The Prospecting for skills: The current and future skill needs in the minerals sector (NCVER 2005) report was commissioned by the Chamber of Minerals and Energy in Western Australia and the Minerals Council of Australia to investigate the skills shortage issues in the industry. The research was undertaken under the auspices of the National Skills Shortages Strategy.
Unlike the first two reports the scope of this report was national and focussed on the supply of and demand for technicians, skilled tradespersons, semi-skilled operatives, and support staff.
It concluded that currently the sector was experiencing skills shortages. Evidence used to support the conclusion came mainly from examining vacancy rates, relative wages and interviews of company representatives and other stakeholders in the industry.
The recent increases in the Department of Employment and Workplace Relations compiled skilled vacancies index (SVI) for tradespersons and the increase in the vacancy rates in the mining industry in the Australian Bureau of Statistics (ABS) Job vacancy survey (ABS 2005b) provided the main empirical evidence of skills shortages. It should be noted that although for each trade area a different SVI can be analysed, they are not industry-specific. Also, given the relatively small size of the mining sector in the overall workforce the increase observed in the ABS survey may not be significant.
The report provided little hard evidence to suggest wages were rising rapidly in key occupations in the sector. Instead anecdotal reports of ‘salary bidding’ were presented as evidence.
The response of the nine mining companies and the two recruitment companies on the issue of skills shortages was mixed. Although a majority indicated experiencing skills shortages, the extent and impact of them varied across the companies and the site of the operation, with one
1 The timing of the peak in labour demand is not clear in the report. On page 7 it is suggested that the employment demand of 8600 was likely to be sustained from the first quarter of 2004 to the third quarter of 2005 but the data in Figure 5.2 suggests this peak demand was likely to be in 2003.
4

Availability of skilled labour
company having no problems now and not expecting any in the future. Identifying which skills shortage problems the companies faced were in fact skills gaps or recruitment problems could have added value to the report.2
2 The concepts of skill shortages, skills gaps and recruitment problems are defined and discussed later in the report.
5

Availability of skilled labour
3. Companies’ perspectives on skills issues
This chapter reports on the results of interviews held with eight companies, nominated by CCI, about their current and emerging skill needs. Three companies supplied data on the resource projects they had commissioned or were likely to commission for development in 2005-2010 and the likely skill needs for them and their timing. The first section of this chapter reports the interviews and the second section presents analysis of labour demand based on the project data supplied by the companies.
3.1 Company interviews’ summary Project owners in the Western Australian resources sector have found themselves in an unprecedented situation. The sector has been growing rapidly to supply the booming Chinese economy and the global economy generally. The expansion has been cross-sectoral and includes oil and gas as well as minerals, especially iron ore. The boom is occurring against a background of sustained growth in the wider Australian economy and a renewed national interest in public infrastructure projects.
Employers are concerned about the unforeseen and unintended effects of this boom. The usual risk management strategies employed by companies have been thrown into question as firms evaluate the risks that they face in the emerging environment.
Companies in the sector have identified materials shortages, skilled labour shortages and project timing as three key areas of risk currently affecting project planning.
Materials shortages A shortage of parts and construction materials has been one unexpected consequence of the expansion in the resources sector. Such shortages were unanticipated and have served to fuel concerns about other unforeseen effects of the boom. Early in 2005, parts such as truck tyres were in severe shortage and building materials such as cement were in short supply.
Skills shortages Shortages of skilled labour represent a major risk to the successful completion of projects. Projects risk being delayed from the construction phase through to the operational and maintenance phases.
The impact that shortages will have on industrial relations was unknown as cost control in markets where there are shortages becomes more problematic. Added to these uncertainties are factors such as the age of the construction workforce and the likelihood that many in this workforce will retire within the current planning period. The anticipated loss of experienced staff was also raising issues of training and recruitment of supervisory staff.
Companies were already experiencing shortages in occupations such as boilermakers, steel fixers, scaffolders and riggers. In the maintenance area, shortages in the electrical trades and
6

Availability of skilled labour
diesel mechanics have also become apparent. Some companies reported a lack of tenders for some jobs due to labour shortages as many contractors are already working at full capacity.
The analysis of interviews suggests companies are experiencing skill shortages, recruitment difficulties and skill gaps.3 It is important to identify which of these is the problem in a particular situation as each may require a different policy response.
For instance, where there are insufficient persons who currently hold the skills that are needed then recruitment strategies, providing better conditions and benefits etc, may do little to address the problem. Skill shortages can only be addressed by increasing promotion of careers in the sector; provision for training for new entrants in the affected occupations; and by interstate or international immigration.
On the other hand in a tight labour market, such as that in Western Australia now, some companies are recruiting workers who are lacking in some of the skills necessary to work effectively in the jobs on offer. These skill gaps need to be addressed before the recruit becomes fully productive. Such a situation may arise as a result of employees moving between sectors, for example, from domestic construction to plant construction. The occupational skills may be similar but the operating environments are very different and so may give rise to a skills gap.
Managing the risk of labour shortages Companies interviewed indicated three main strategies for managing the risk of labour shortages.
Improved efficiency and demand reduction measures
Companies are considering a range of efficiency measures that can better utilise the existing workforce. Some of these require organisational changes.
Some companies are considering making more intensive use of the existing workforce by offering more hours of work.
Other companies are using mobile teams of skilled labour that can be moved from project to project to meet localised shortages or deal with internal skill deficiencies.
Most companies consider any measure that is going to cost-effectively reduce the demand for labour. The use of new technology; new forms of work organisation; process design and re-engineering are options all considered to reduce the demand for labour.
New construction and processing techniques are being employed to reduce the overall demand for labour as well. In some cases this is done through the use of pre-assembly off-site and/or through the use of modular construction techniques so that plug-and-play modules are shipped to site. Off-sites considered are often in overseas locations. Such practices tend to substantially reduce the demand for on-site labour. Off-site construction is however limited in its application to some types of projects only.
In addition, several companies are now reducing their exposure to risk of skill shortages by using contractors to operate projects. Contractors, both local and international, are also used for shut down maintenance. If the skill shortages do exist and are sector-wide then this mode of
3 What are generically called ‘skill shortages’ actually fall into a number of categories which can be discussed as skill shortages, recruitment difficulties and skill gaps. Shah and Burke (2005b) discuss these concepts and other related issues in detail.
7
Availability of skilled labour
operation does not solve the problem; it only transfers the risk from the project owner to the contractor.
In other cases, companies are examining the remote operation of facilities from metropolitan areas. This reduces the amount of labour required on-site and also removes location as a barrier to recruitment.
Recruitment and retention measures
Most firms first use internal recruitment from other projects in Western Australia or interstate that may be winding down. In some cases this may be from overseas projects. Redeployment can sometimes involve workers moving across sectors, for instance, from an oil project to an LNG project.
Recruitment strategies employed often include the offer of better on-site facilities, better rosters and improved pay and conditions. As the competition for labour increases, poaching is concerning some companies. This may meet the short-term needs of one company but not the needs of the sector as a whole.
External recruitment is being considered beyond the state borders from interstate and overseas, and from other sectors such as the housing construction and the petrochemical industry. Such strategies raise problems of skills gaps as recruits, although having appropriate occupational skills, need orientation to work in a different sector and environment which could often be in a remote location with limited social and community facilities.
In the past a high ratio of experienced to inexperienced employees in the industry has helped new recruits to settle in quickly but with a rapid expansion in activity this ratio has worsened.
Some companies are seeking to improve the retention of permanent employees by developing communities in remote towns and re-engaging with employee relations strategies last seen a generation ago. By investing in the development of towns and building community infrastructure, firms hope to support the development of a stable local workforce. Such strategies are however more feasible for long-term projects in locations that are attractive for people to live in, for example, sites near the coast.
Companies reported serious retention problems among the temporary workforce used during construction, shutdown or maintenance. High turnover rates exist among these workers and also among others who work on a fly-in-fly-out (FIFO) basis. Few retention strategies however seem to be in place for this group. Continuity of work for contractors is one strategy being employed to retain them.
Skill formation strategies
Some companies, perhaps because of their size, have become registered training organisations for training purposes. They have built high quality facilities to train new recruits and to up-skill current workers. As some of these facilities are in the state’s regional areas with many Indigenous people, the companies have adopted a positive Indigenous training policy.
To reduce the risk of skills shortage, some firms are offering to up-skill recruits with basic skills to more advanced skills. For example, welders with basic skills are offered training in advanced welding to operate new technology in the oil and gas sector.
On-site training centres are one option but providing greater access to distance education on-site is another option. A wide range of courses are available by distance education and employees on-site could undertake some study in their breaks if study facilities were available.
8
Availability of skilled labour
FIFO employees also have large blocks of time when they are off-site and thus available for block classes.
In the past decade many firms have reduced the numbers of apprentices they employ directly. Some used group training companies to look after the apprentices. Some firms may now be considering returning to their previous in-house training model. One major obstacle to this is the lack of appropriate on-site supervision.
Summary Skill shortages, skill gaps and recruitment difficulties are a growing concern in the rapidly expanding resources sector in Western Australia. The companies have undertaken or are developing strategies that enable better use of skilled labour, improved recruitment and retention. There are also strategies to increase the levels of training provided or supported by the companies.
Quantifying these issues is extremely difficult. The next section provides analysis of the limited data provided by the companies on labour requirements for a selected number projects.
3.2 Demand for trade and sub-trade skills for selected projects This section reports results from the analyses of data on labour demand for a selection of projects from three4 companies. The projects had either already been approved for development or were more than half way to obtaining financial backing and commissioning in the period to 2010.
Data were provided on the estimated number of persons and the types of skills at the trade and sub-trade level that would be required each month for different phases of each project, including the operations phase. Apart from one, all projects were already being developed or had the approval for development. One significant project was awaiting final approval which was expected in the middle of next year. Its chances of being approved were rated at 70 per cent and this uncertainty has been factored in the analysis below.
The labour demand estimates were provided in the following occupational categories:
1. mechanical trades (fitter, boilermaker, pipe fitter, and welder);
2. electrical trades (electrician, refrigeration and air-conditioning mechanic, instrumentation and communication technician); and
3. construction sub-trades (mobile construction plant operator, scaffolder, construction rigger and crane operator).
In the analyses below, the demand from all projects is aggregated and the analyses are performed for groups of occupations as listed above.5
4 Other companies interviewed were unable to provide data. 5 The quality of some data prevents analysis at the individual occupation level.
9
Availability of skilled labour
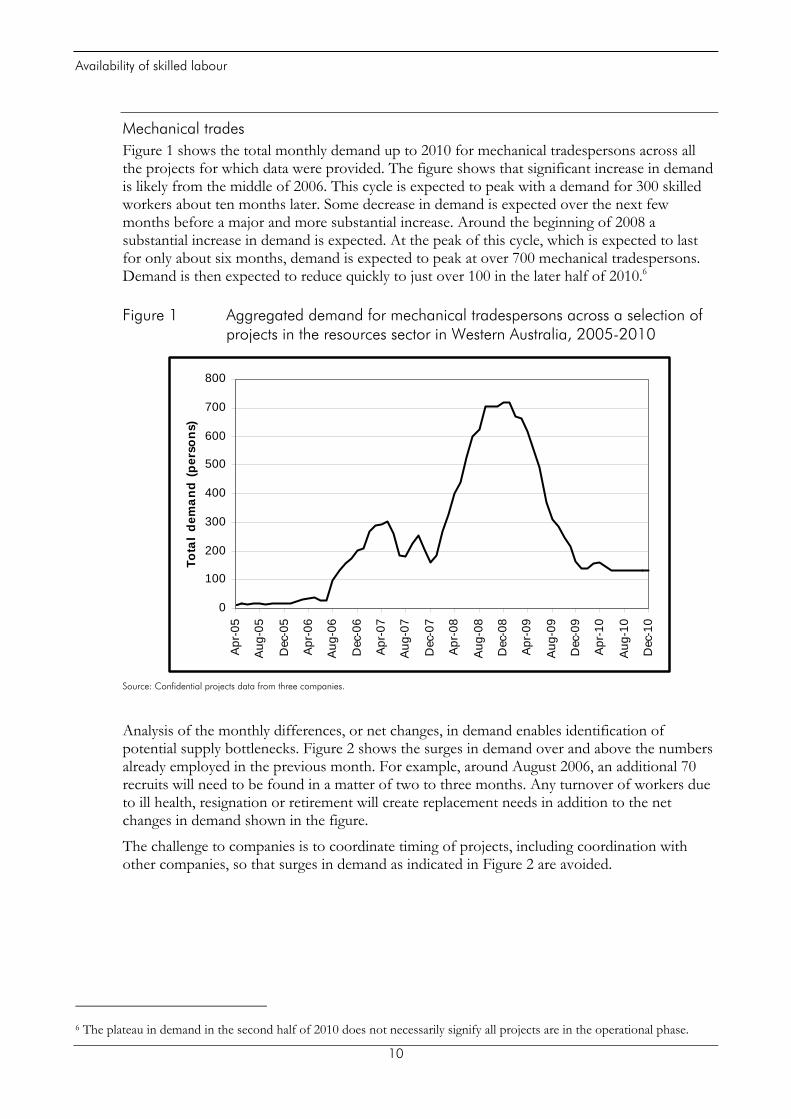
Mechanical trades Figure 1 shows the total monthly demand up to 2010 for mechanical tradespersons across all the projects for which data were provided. The figure shows that significant increase in demand is likely from the middle of 2006. This cycle is expected to peak with a demand for 300 skilled workers about ten months later. Some decrease in demand is expected over the next few months before a major and more substantial increase. Around the beginning of 2008 a substantial increase in demand is expected. At the peak of this cycle, which is expected to last for only about six months, demand is expected to peak at over 700 mechanical tradespersons. Demand is then expected to reduce quickly to just over 100 in the later half of 2010.6
Figure 1 Aggregated demand for mechanical tradespersons across a selection of projects in the resources sector in Western Australia, 2005-2010
0
100
200
300
400
500
600
700
800
Apr
-05
Aug
-05
Dec
-05
Apr
-06
Aug
-06
Dec
-06
Apr
-07
Aug
-07
Dec
-07
Apr
-08
Aug
-08
Dec
-08
Apr
-09
Aug
-09
Dec
-09
Apr
-10
Aug
-10
Dec
-10
Tota
l de
man
d (p
erso
ns)
Source: Confidential projects data from three companies.
Analysis of the monthly differences, or net changes, in demand enables identification of potential supply bottlenecks. Figure 2 shows the surges in demand over and above the numbers already employed in the previous month. For example, around August 2006, an additional 70 recruits will need to be found in a matter of two to three months. Any turnover of workers due to ill health, resignation or retirement will create replacement needs in addition to the net changes in demand shown in the figure.
The challenge to companies is to coordinate timing of projects, including coordination with other companies, so that surges in demand as indicated in Figure 2 are avoided.
6 The plateau in demand in the second half of 2010 does not necessarily signify all projects are in the operational phase.
10

Availability of skilled labour
Figure 2 Net changes in monthly demand for mechanical tradespersons across a selection of projects in the resources sector in Western Australia, 2005-2010
0
10
20
30
40
50
60
70
80
90
100
Apr
-05
Aug
-05
Dec
-05
Apr
-06
Aug
-06
Dec
-06
Apr
-07
Aug
-07
Dec
-07
Apr
-08
Aug
-08
Dec
-08
Apr
-09
Aug
-09
Dec
-09
Apr
-10
Aug
-10
Dec
-10
Exce
ss d
eman
d (p
erso
ns)
Source: Confidential projects data from three companies.
Electrical trades The pattern of aggregate demand for electrical tradespersons is somewhat different to that for mechanical tradespersons. Total demand is expected to rise gradually from around the middle of 2006 and peak at over 500 skilled persons by the end of 2008. After that total expected demand tapers off and plateau at 350 for most of 2010 which suggests that many electrical tradespersons are required for ongoing operational phase of projects.
11

Availability of skilled labour
Figure 3 Aggregated demand for electrical tradespersons across a selection of projects in the resources sector in Western Australia, 2005-2010
0
100
200
300
400
500
600
Apr
-05
Aug
-05
Dec
-05
Apr
-06
Aug
-06
Dec
-06
Apr
-07
Aug
-07
Dec
-07
Apr
-08
Aug
-08
Dec
-08
Apr
-09
Aug
-09
Dec
-09
Apr
-10
Aug
-10
Dec
-10
Tota
l de
man
d (p
erso
ns)
Source: Confidential projects data from three companies.
Figure 4 shows the net changes in monthly demand for electrical tradespersons follows a similar pattern to that for mechanical tradespersons. Surges in demand are expected at similar times for both skill groups.
The coincidence of the surges in demand for mechanical and electrical tradespersons compounds recruitment and labour supply problems, and provides an extra reason for cooperation among companies to manage the timing of projects so that surges in demand can be avoided.
12

Availability of skilled labour
Figure 4 Net changes in monthly demand for electrical tradespersons across a selection of projects in the resources sector in Western Australia, 2005-2010
0
10
20
30
40
50
60
70
80
90
100
Apr
-05
Aug
-05
Dec
-05
Apr
-06
Aug
-06
Dec
-06
Apr
-07
Aug
-07
Dec
-07
Apr
-08
Aug
-08
Dec
-08
Apr
-09
Aug
-09
Dec
-09
Apr
-10
Aug
-10
Dec
-10
Exce
ss d
eman
d (p
erso
ns)
Source: Confidential projects data from three companies.
Construction sub-trades Figure 5 shows the pattern of total demand for construction sub-trades. Two peaks in demand are expected, the first and smaller peak is expected about the middle of 2007 while the second is expected around the end of 2008. Demand of 1,000 persons is expected at the second peak. The demand in 2010 is expected to plateau at just over 500 persons.
13

Availability of skilled labour
Figure 5 Aggregated demand for construction sub-trades across a selection of projects in the resources sector in Western Australia, 2005-2010
0
100
200
300
400
500
600
700
800
900
1000
1100
Apr
-05
Aug
-05
Dec
-05
Apr
-06
Aug
-06
Dec
-06
Apr
-07
Aug
-07
Dec
-07
Apr
-08
Aug
-08
Dec
-08
Apr
-09
Aug
-09
Dec
-09
Apr
-10
Aug
-10
Dec
-10
Tota
l de
man
d
Source: Confidential projects data from three companies.
The pattern of net changes in monthly demand for construction sub-trades in Figure 6 shows a number of small peaks in demand of between 50 and 125 persons until the end of 2008 but also includes a massive surge of about 250 persons in the third quarter of 2006. After the end of 2008 net demand is expected to be zero as total demand declines or plateaus.
Figure 6 Net changes in monthly demand for construction sub-trades across a selection of projects in the resources sector in Western Australia, 2005-2010
0
25
50
75
100
125
150
175
200
225
250
Apr
-05
Aug
-05
Dec
-05
Apr
-06
Aug
-06
Dec
-06
Apr
-07
Aug
-07
Dec
-07
Apr
-08
Aug
-08
Dec
-08
Apr
-09
Aug
-09
Dec
-09
Apr
-10
Aug
-10
Dec
-10
Tota
l de
man
d (p
erso
ns)
Source: Confidential projects data from three companies.
14

Availability of skilled labour
Summary This section has provided a simple model to investigate aggregate expected demand for different types of labour for resource projects using companies’ data. The data are for a selected number of projects from only three companies and hence do not represent the total demand for labour for all projects likely to be commissioned in the state in the period to 2010.
Even with the limited data available, the analyses have demonstrated the risks of shortages in labour supply due to the nature and timing of the projects. The short-term peaks in labour demand make it difficult to offer sustainable jobs and hence attract a loyal workforce.
If the supply of labour remains limited then one option that companies can consider is a cooperative model. In such a model, companies share information on labour supply but most importantly agree to sequencing of projects so that demand is evened out and surges in demand are avoided. This needs attention though it is acknowledged that labour supply and costs are only part of the issues affecting the size and timing of investment.
15
Availability of skilled labour
4. State and national trends in employment and training
Companies compete for skilled labour in the broader state and national environment. This chapter provides this broader context within which to interpret the analyses on particular occupations that form the main focus of this report. The particular occupations— mechanical, fabrication and electrical trades and mobile plant operators and construction sub-trades— are examined in detail in chapter 5.
Demand for skilled labour arises from growth in employment and from labour market turnover. Certain measures of turnover and growth provide estimates of the number of jobs for new entrants to the workforce. The chapter provides state and national level data on these.
Supply of skilled labour is enhanced by the education and training system and for the occupations of interest in this study, by the VET system in particular. In addition migration of skilled labour could add to the supply. These are also reviewed.
The chapter also includes a discussion of skills shortages, their indicators, implications and policy responses.
4.1 Employment trends Table 1 shows historical employment (1998-2004) and trend forecasts7 (2005-2010) for Western Australia compared to Australia as a whole based on data from the Australian Bureau of Statistics (ABS) Labour Force surveys.
Figure 7 shows that the downturn in employment growth between 1998 and 2000 was more severe in Western Australia than for Australia as a whole. It was not until 2003 that the state began to outperform the country as a whole in employment growth. Relative to the employment in 1998, employment in 2010 is projected to be 25 per cent higher in Australia, and just one percentage point lower in Western Australia.
The strong employment figures for Western Australia for the first half of 2005 have resulted in a forecast for 2005 that is higher than suggested by the trend line alone. The figures however may have temporarily peaked in May 2005 as the June 2005 employment declined by 0.7 per cent (ABS 2005c). The result of high actual employment in the first half of 2005 is that the forecast for 2005 is relatively higher than the forecast for 2006.
On current trends the state’s share of national employment is expected to be the same as its share of population which is projected to be 10.2 per cent in 2010. Recent trends and other economic data, however, suggest this estimate may be at the lower end of the scale (ABS 2005a).
7 The forecasts are based on extrapolating from a linear trend model with seasonal dummies. The model was estimated with quarterly data from November 1997 to May 2005. Thus the forecast for 2005 is the average of the actual for the first two quarters and forecasts of the last two quarters of that year.
16

Availability of skilled labour
Table 1 Historical (1998-04) and projected (2005-10) employment in Western Australia and Australia (‘000)
Western Australia Year Number % of Australia Australia 1998 886 10.3 8,572 1999 894 10.3 8,720 2000 914 10.2 8,951 2001 926 10.2 9,063 2002 939 10.2 9,248 2003 962 10.2 9,459 2004 986 10.2 9,636 2005 1,023 10.4 9,893 2006 1,025 10.3 10,019 2007 1,044 10.2 10,202 2008 1,063 10.2 10,385 2009 1,081 10.2 10,568 2010 1,100 10.2 10,751 Source: Based on unpublished ABS Labour Force data for every third month from November 1997 to February 2005, (ABS Cat. no. 6203.0). Forecasts are in italics.
Figure 7 Index of employment in Western Australia and Australia
100
105
110
115
120
125
130
1998 1999 2000 2001 2002 2003 2004 2005 2006 2007 2008 2009 2010
Empl
oym
ent
inde
x (1
998=
100)
WA historical Australia historicalWA forecasts Australia forecasts
Source: Based on unpublished ABS Labour Force data for every third month from November 1997 to February 2005, (ABS Cat. no. 6203.0). Forecasts are in italics.
4.2 Job openings for new entrants Job openings for new entrants are the number of new workers needed in the workforce and result from growth in employment and net replacement needs.
Net replacement needs are due to individuals, typically experienced workers, leaving the workforce because of retirement (for reasons of age or ill-health), emigration or death and are net of those who are re-entering after a temporary absence.
If employment declines, job openings for new entrants due to growth are zero. In this case job openings for new entrants are net replacement needs only.
17

Availability of skilled labour
Job openings for new entrants provide an indication of the minimum number of people who will need training, that is, if training is indeed required. This information is useful for planning training requirements. However it should be noted that not all new jobs require people with qualifications and the training required by migrants may be of a different type, for example, they may be in more immediate need of English language skills rather than vocational skills. On the other hand, additional training needs to be included in the planning for people moving between jobs because these people are, in general, netted out in deriving estimates of net replacement needs. Similarly additional training may also be necessary to up-skill those already employed.
Net replacement needs for Australia for the period 2003-07 were estimated to be, on average, 2.1 per cent per year (Shah and Burke 2003). Using this rate for the period 2005-2010 and growth numbers based on the average trend (Table 1), job openings for new entrants in Western Australia are projected to average 41,000 per annum in the period 2005-2010 or 10.3 per cent of the total in Australia (Table 2).8
Table 2 Job openings for new entrants in Western Australia and Australia, (2005-2010) (‘000)
Western Australia Australia
Year Growth Net replacement
needs
Job openings for new entrants Growth
Net replacement needs
Job openings for new entrants
2005 37 21 58 257 202 459 2006 2 21 23 126 208 334 2007 19 22 41 183 210 393 2008 19 22 41 183 214 397 2009 18 22 40 183 218 401 2010 19 23 42 183 222 405 Total 2005-10 114 131 245 1,115 1,275 2,390 Note: Assumes a uniform net replacement rate of 2.1 per cent for both Western Australia and Australia. The net replacement rate was estimated using the CEET model and was reported in Shah and Burke (2003).
4.3 Trends in vocational education and training Vocational education and training (VET) in Australia is provided by public and private institutions and funded through private and public monies. NCVER holds statistics on publicly-funded VET in Australia. These statistics are held in two different collections: • the Australian VET Statistics: Apprentices and Trainees; and • the National VET Provider Collection.
The first collection holds data on all apprentices and trainees who are undertaking or who have already undertaken training through a contracted training arrangement. The scope of the second collection is all VET delivery funded wholly or in part from public funds and includes:
• all VET delivered by TAFE and other government providers;
• all VET delivered by multi-sector higher education institutions;
• public VET delivered by registered community providers; and
• public VET delivered by registered private providers.
8 Job openings for new entrants in Western Australia for the period from the second half of 2005 to end of 2010 are less by 29,000, which is half the numbers for the whole of 2005. Similarly openings in Australia for the same period are less by 230,000.
18

Availability of skilled labour
The two collections are not mutually exclusive and activities of some students are included in both. Unfortunately the collections do not contain an identifier for records that are included in both collections.9
For the purposes of this study we assume that the Australian VET Statistics: Apprentices and Trainees include data on all apprenticeships and that training for the trade occupations is predominantly via an apprenticeship.
Training required for the sub-trades can be either via a traineeship or competency modules. Some data related to this training is recorded in both databases discussed above. Therefore interpreting such data to assess the supply of trained personnel requires care.
Australian VET Statistics: Apprentices and Trainees Table 3 shows the trends in in-training, commencements and completions of apprenticeships10 in Western Australia11 and Australia.
The numbers of apprentices in-training in Australia have steadily increased from 102,000 in 1997 to 132,000 in 2004, representing an increase of 29 per cent. In Western Australia the numbers in-training actually declined from 1997 to 2001 before increasing. In 2004, 13,100 apprentices were in-training in Western Australia, representing 9.9 per cent of the national total.
Consequently, apprenticeship commencements in Australia have also increased each year since 1997, except that in 2000 and 2001 there was a small decline in numbers. In Western Australia, commencements followed a similar pattern to numbers in-training, but since 2001 the growth in commencements has been strong. Nevertheless the 5,000 commencements in 2004 are still proportionately low compared to the total number of commencements in Australia.
In spite of constant growth in the numbers in-training nationally, completion numbers have remained stagnant at around 20,000 per annum. Completions in Western Australia have averaged about 2,600 each year since 1997 with little change from one year to the next.
Table 3 ‘Traditional’ apprenticeship numbers in Western Australia and Australia, 1997-2004
In-training Commencements Completions WA Aus WA Aus WA Aus Year (’000) % of Aus (’000) (’000) % of Aus (’000) (’000) % of Aus (’000) 1997 11.8 11.5 102.4 3.1 10.4 30.1 2.7 13.2 20.6 1998 11.1 10.9 102.1 3.1 8.8 35.0 2.9 13.1 21.7 1999 10.9 10.2 106.7 2.8 7.0 40.2 2.7 13.6 20.1 2000 10.6 9.8 109.0 2.9 7.6 38.6 2.7 14.2 19.2 2001 10.1 9.2 109.2 2.6 7.1 36.6 2.7 14.3 18.9 2002 10.2 9.0 113.3 3.1 7.5 41.5 2.6 12.6 20.7 2003 11.4 9.4 121.4 3.9 8.1 48.0 2.4 11.1 21.6 2004 13.1 9.9 131.7 5.0 8.7 57.5 2.6 12.0 21.7 Source: Unpublished NCVER Apprentices & Trainees Statistics. In-training data for 2003 and 2004 and commencements and completions data for 2004 are estimates. Some figures may be slightly different to the most recent published data from NCVER because of the latest revisions to published data.
9 Since 2003 the national VET Provider Collection is supposed to include an identifier for an apprentice or trainee with a contract of training but the statistics collected so far indicate massive under reporting. 10 Defined as ‘traditional’ by NCVER. 11 The apprenticeships and traineeships statistics published by the Department of Education and Training (WA) are at variance with the NCVER statistics. In particular, the two agencies appear to define a ‘traditional’ apprenticeship differently. The NCVER definition leads to a lower count than the Department’s definition.
19

Availability of skilled labour
Table 4 shows the apparent completion rates12 for apprenticeships in Australia and Western Australia. It appears that the system in Western Australia is much more efficient than the system in the rest of the country. Apparent completion rates in Western Australia average 87 per cent while in Australia they average 58 per cent.13 The reason for such a large difference is unlikely to be a statistical artefact and needs further investigation.
Applying the average apparent completion rate to commencements in 2001-2004, one can expect 12,600 completions in Western Australia and 106,500 in Australia over 2005-2007.
Table 4 Apparent completion rates for ‘traditional’ apprenticeships in Western Australia and Australia, 2001-2004
Completions as a % of commencements 4 years before Year of completion Western Australia Australia 2001 87.1 62.9 2002 83.9 59.1 2003 85.7 53.7 2004 89.7 56.3 Average 2000-2004 86.6 58.0 Source: Based on unpublished NCVER Apprentices & Trainees Statistics.
Table 5 shows that since 1997 in-training numbers for traineeships in Western Australia have almost doubled while in the country as a whole they have trebled. However in 2004 while traineeship commencements in Western Australia increased sharply, at the national level there was a significant drop.
Either the take-up or funding of traineeships in Western Australia is proportionately not as high as in the rest of the country. In 2004, in-training numbers in Western Australia were just 5 per cent of Australia’s total and commencements, which increased sharply in 2004, were still less than 7 per cent of the total.
Table 5 Traineeship numbers in Western Australia and Australia, 1997-2004 In-training Commencements Completions WA Aus WA Aus WA Aus Year (’000) % of Aus (’000) (’000) % of Aus (’000) (’000) % of Aus (’000) 1997 6.6 7.9 83.6 6.9 8.1 84.5 2.0 6.5 30.8 1998 7.4 6.5 114.5 8.3 6.9 120.0 2.9 7.5 38.9 1999 7.9 5.4 145.7 9.4 5.9 158.5 4.0 7.3 55.0 2000 8.1 4.6 176.2 9.2 5.3 171.7 3.8 5.7 66.3 2001 8.1 3.8 211.3 8.6 4.6 187.3 4.1 5.4 75.4 2002 11.9 4.7 252.6 13.3 6.0 223.0 4.4 4.7 92.9 2003 13.1 4.8 271.3 12.3 5.4 229.8 4.9 4.7 103.2 2004 12.7 5.1 250.7 14.1 6.9 205.6 7.3 6.2 117.3 Source: Unpublished NCVER Apprentices & Trainees Statistics. In-training data for 2003 and 2004 and commencements and completions data for 2004 are estimates. Some figures may be slightly different to the most recent published data from NCVER because of the latest revisions to published data.
12 The apparent completion rate for ‘traditional’ apprenticeships is defined as the ratio of the number of commencements four years ago to the number of completions in the current year. The reason for the four-year lag is because it is assumed that, on average, an apprenticeship takes four years to complete. The apparent completion rate is different to the actual completion rate which requires different type of data for its estimation. 13 According to NCVER (2004), overall, 52% of contracts starting in 1998 resulted in completion. The completion rate rose to 56% for individuals undertaking a particular qualification, taking into account any change of employer or contract. The completion rate rose further to 60% when an individual was tracked across a range of qualifications and employers. These rates are for ‘traditional’ and other apprenticeships combined.
20
Availability of skilled labour
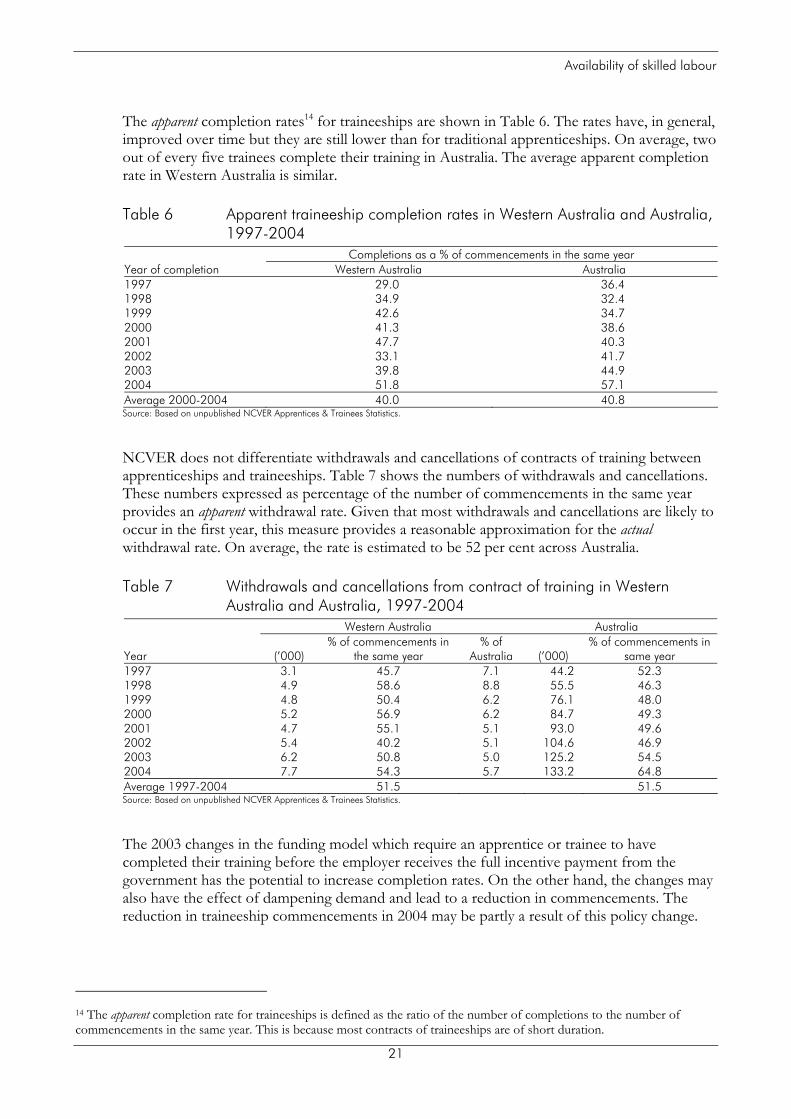
The apparent completion rates14 for traineeships are shown in Table 6. The rates have, in general, improved over time but they are still lower than for traditional apprenticeships. On average, two out of every five trainees complete their training in Australia. The average apparent completion rate in Western Australia is similar.
Table 6 Apparent traineeship completion rates in Western Australia and Australia, 1997-2004
Completions as a % of commencements in the same year Year of completion Western Australia Australia 1997 29.0 36.4 1998 34.9 32.4 1999 42.6 34.7 2000 41.3 38.6 2001 47.7 40.3 2002 33.1 41.7 2003 39.8 44.9 2004 51.8 57.1 Average 2000-2004 40.0 40.8 Source: Based on unpublished NCVER Apprentices & Trainees Statistics.
NCVER does not differentiate withdrawals and cancellations of contracts of training between apprenticeships and traineeships. Table 7 shows the numbers of withdrawals and cancellations. These numbers expressed as percentage of the number of commencements in the same year provides an apparent withdrawal rate. Given that most withdrawals and cancellations are likely to occur in the first year, this measure provides a reasonable approximation for the actual withdrawal rate. On average, the rate is estimated to be 52 per cent across Australia.
Table 7 Withdrawals and cancellations from contract of training in Western Australia and Australia, 1997-2004
Western Australia Australia
Year (’000) % of commencements in
the same year % of
Australia (’000) % of commencements in
same year 1997 3.1 45.7 7.1 44.2 52.3 1998 4.9 58.6 8.8 55.5 46.3 1999 4.8 50.4 6.2 76.1 48.0 2000 5.2 56.9 6.2 84.7 49.3 2001 4.7 55.1 5.1 93.0 49.6 2002 5.4 40.2 5.1 104.6 46.9 2003 6.2 50.8 5.0 125.2 54.5 2004 7.7 54.3 5.7 133.2 64.8 Average 1997-2004 51.5 51.5 Source: Based on unpublished NCVER Apprentices & Trainees Statistics.
The 2003 changes in the funding model which require an apprentice or trainee to have completed their training before the employer receives the full incentive payment from the government has the potential to increase completion rates. On the other hand, the changes may also have the effect of dampening demand and lead to a reduction in commencements. The reduction in traineeship commencements in 2004 may be partly a result of this policy change.
14 The apparent completion rate for traineeships is defined as the ratio of the number of completions to the number of commencements in the same year. This is because most contracts of traineeships are of short duration.
21

Availability of skilled labour
National VET Provider Collection Table 8 shows the number of students enrolled in VET and the total hours of training provided as reported in the National VET Provider Collection. Some students included in this collection will also have been included in the apprentices and trainees’ data set; in particular, most students undertaking a traditional apprenticeship will have been included in both data sets.
The number of students enrolled in VET in Australia grew significantly over the last decade. In 2004, 26 per cent more students enrolled than in 1995. Student numbers however declined in 2001 and 2002 but a major downturn occurred in 2004 when numbers fell by 7 per cent over the previous year.
On the other hand, total hours of training increased steadily until 2003. Although total hours delivered declined in 2004, the intensity of training, as measured by the number of hours of training per student, at 215 was the highest ever in 2004.
The increase in enrolment numbers in Western Australia between 1995 and 2004 was only 17 per cent. The total hours of training delivered in the state however increased by 49 per cent compared to 35 per cent in the country as a whole. In 2004, the intensity of training in Western Australia was 247 hours per student.
The National VET Provider Collection does not contain reliable data on course completions. These are much more difficult to estimate with currently available data.
Table 8 Trends in number of students enrolled and hours of training provided in VET in Western Australia and Australia, 1995-2004
Western Australia Australia Students Total hours Students Total hours Year (’000) % of Aus (millions) % of Aus (‘000) (millions) 1995 108.5 8.6 21.0 8.3 1,268.9 254.4 1996 109.7 8.2 21.7 8.1 1,341.2 268.0 1997 110.8 7.6 21.9 7.7 1,449.1 283.8 1998 114.0 7.6 24.3 8.6 1,509.8 283.4 1999 125.5 7.8 26.5 8.9 1,614.6 298.9 2000 128.7 7.5 27.8 8.9 1,707.9 311.3 2001 135.4 8.1 30.7 9.0 1,679.1 340.4 2002 131.9 7.8 30.0 8.7 1,682.9 345.1 2003 130.4 7.6 31.1 8.9 1,717.8 351.7 2004 126.5 7.9 31.2 9.1 1,595.2 342.4 Source: National VET Provider Collection, NCVER
4.4 Contribution of migration to labour supply In Australia, immigration has often been used as a policy option to solve demographic and labour market problems. The total immigration programme is complex and has a number of dimensions.
As the recent changes announced on April 14, 2005 testify, Australia’s immigration policy is constantly evolving to reflect the economic, social and political environment of the times. At different ends of the spectrum there are the permanent settler and the temporary resident programmes, each consisting of a number streams or subcategories. Arrivals in all streams, except temporary visitors, are permitted to work in varying capacity and conditions.
The general trend in policy is towards increasing the skill component of the programme. In particular, skills acquired in Australia are given priority via onshore processing of overseas student applications for permanent residency.
22

Availability of skilled labour
There is also a discernible shift towards temporary migration to meet short-term employer needs. Unskilled labour supply problems, especially in regional industries such as agriculture, are being addressed through the expansion of the working holiday maker programme in both size and scope.
The net effect on the labour supply can occur via movements of working age (15-64 years) people in a number of different categories and for 2003-04 it is estimated to be:
• 34,300 from permanent movements;
• 9700 from long-term resident movements;
• 2300 from movements of New Zealand citizens (excluding permanent movements); and
• 28,400 from movements of business (long stay)—visa subclass 457; and
• 55,700 from movements of working holiday makers (Shah and Burke 2005a).
Students also add to the supply but without reliable data on the number of overseas students who participate in the labour force, it is difficult to estimate the contribution that students make to overall labour supply.
Not counting the contribution of students, in 2003-04, the annual overall potential contribution of migration to labour supply is estimated to be 130,400. In the trade occupations the increase in supply was estimated to be at least 8,600, with 1,500 in the mechanical and fabrication trades, 1,100 in electrical trades and 1,600 in construction trades (Shah and Burke 2005a).
Western Australia is well behind, particularly Victoria, in attracting skill migrants under State-Specific and Regional Migration Initiatives. Of the 12,800 visa grants under this scheme in 2003-04, Western Australia’s share was 7.6 per cent but Victoria’s share was a massive 50.7 per cent (DIMIA 2005). The recently announced changes to the Australian migration programme encourage further development of this programme.
Analyses of data from the second cohort of the Longitudinal Survey of Immigrants to Australia (LSIA) in Shah and Burke (2005a) show permanent immigrants experience significant downward occupational movement between their pre- and post-migration jobs. Less than half the immigrants in any given occupation, except construction and electrical trades, were found to remain in the same occupation in their pre- and post-migration jobs. For example, only 43 per cent of immigrants with a job in mechanical and fabrication trades prior to migration were employed in the same group of trade occupations in their post-migration jobs. Most of the rest were either not in employment (37 per cent) or were in lower level occupations (16 per cent). On the other hand, 13 per cent of immigrants changed from an associate professional occupation to a mechanical and fabrication trade.
Research suggests over time immigrants experience upward occupational mobility but in the short-term it means considerable waste of skills and loss of productivity.
4.5 Skills shortages: indicators, implications and policy responses A level of anxiety currently exists about skills shortages in Australia, and elsewhere, and its impact on the economy. The public debate on the issue is however often based on anecdotal or unsubstantiated evidence. Part of the reason for this is the difficulty in measuring skill shortages.
The concept of skills shortage has different meanings to different people. This makes it difficult to develop policies to deal with the problem.
23

Availability of skilled labour
Indicators In Australia, the Department of Employment and Workplace Relations (DEWR) annually publishes a list of professional and trade occupations in which skills shortages have been assessed (DEWR 2004). It is the only agency that monitors and collects data on national and regional skills shortages and recruitment difficulties on a regular basis in Australia.
The skills shortages list, together with other information, is used to produce the Migration Occupations in Demand List (MODL) for prioritising visa applications under the Skills Migration programme.
At the end of 2004, DEWR was piloting an extension of the assessment of the skills shortages programme to provide more detailed information for regional areas. The results from these pilots, though encouraging, are limited at this stage.
Under the DEWR definition, shortages are typically for ‘specialised and experienced workers’ and can co-exist with relatively high unemployment overall in the occupation. Thus, an occupation can be assessed as being in shortage even though not all specialisations are in shortage. Furthermore, occupations may be in shortage in a particular geographical area and not in others.
As at December 2004, the DEWR Skill Shortage List included a range of trade occupations, including engineering and electrical/electronics trades, with a national shortage.
Part of the Skill Shortage List is shown in Table 9. Some shortages were in particular specialisations only. For example, in Western Australia shortages for fitters were for those with skills in heavy duty areas. All occupations with a national shortage were also assessed to be in shortage in Western Australia.
Systematic assessment of shortages in the sub-trade occupations is not done by DEWR or any other agency.
Table 9 Skill shortages in selected* trade occupations, December 2004 Occupation AUS NSW VIC QLD SA WA TAS NT Engineering 4112-11 Metal fitter* N S S S S S S S 4112-13 Metal machinist N S S S S S S S 4113-11 Toolmaker N S S S S S S na 4122-11 Metal fabricator* N M-D,R S S S S S S 4122-15 Welder* N S S S S S S S 4124-11 Sheetmetal worker N M-D,R S S S S S S Electrical/electronics 4311-11,13 Electrician* N S S S S S S S 4312-11 Refrigeration & aircon* N S S S S S S S 4313-11 Electrical powerline N S S S S S S 4314 Electronic instrument* N S S S D S S M-D,R 4315-11 Electronic equipment N S S D S S 4315-13 Bus. machine mechanic D S S Source: DEWR (2004) * These are some of the occupations that are of particular interest for this project. Note: N=national shortage; M=shortage in metropolitan area; D=recruitment difficulties; M-D=recruitment difficulties in metropolitan areas; S=state-wide shortage; R=shortage in regional areas; R-D=recruitment difficulties in regional areas; na=not assessed; * indicates shortages in specialisations
The recent employment data indicate employment growth to be stronger in Western Australia now than indicated by the average trend for 1998 to 2005. As an indication of the tightness in
24

Availability of skilled labour
the labour market in this state, the skilled vacancies index (SVI)15 compiled by the DEWR increased by nearly 100 points in Western Australia between June 2002 and June 2005, compared to almost no change for Australia as a whole (Figure 8).
An increase in the SVI could also be an indication of high turnover. In the resources sector, which is a sizeable part of the Western Australian economy, employment is often project-based and in remote areas of the state. The result of this could be high turnover among certain types of workers. The heightened level of activity in the sector in the last few years could also be a contributory factor in the surge in the SVI for the state.
Figure 8 Skilled vacancies index (SVI) for Western Australia and Australia, June 1990 to June 2005
20
40
60
80
100
120
140
160
180
200
220
Jun-
90
Jun-
91
Jun-
92
Jun-
93
Jun-
94
Jun-
95
Jun-
96
Jun-
97
Jun-
98
Jun-
99
Jun-
00
Jun-
01
Jun-
02
Jun-
03
Jun-
04
Jun-
05
Inde
x (N
ov 1
997=
100)
Western Australia Australia
Source: DEWR (2005)
The tightness in the labour market in Western Australia is also indicated by reports of labour scarcity by businesses. The CCI/BankWest Survey of business expectations in the March quarter 2005 reported that 55% of respondents considered labour availability to be ‘scarce’ (up from 33% in the March quarter 2004) (Department of Treasury and Finance (WA) 2005).
While the seasonally adjusted unemployment rate in Western Australia increased from 4.6 per cent in May 2005 to the national rate of 5.0 per cent in June 2005 and employment declined by 0.5 per cent, the participation rate at 68 per cent remained high by national standards (ABS 2005c).
Western Australia recorded wages growth of 4.5% between the March quarters of 2004 and 2005— well above the national increase of 3.9% and higher than any other state or territory over the same period.
15 The Skilled Vacancies Index is released monthly. The Index is based on a count of skilled vacancies in the major metropolitan newspaper of each State and the Northern Territory, usually on the first Saturday of each month (the count is conducted on the second Saturday in January and when the first Saturday is part of a national long weekend). The data published are trend data (November 1997=100). In view of the procedure used for trending, the figures for the six months prior to the current month are subject to revision (DEWR 2005).
25

Availability of skilled labour
Annual wages growth was recorded for labourers (up 8.1%) and tradespersons (up 7.2%). Wages growth in these occupations was driven by continued strong activity in the state's mining and construction sectors, coupled with a shortage of skilled workers (ABS 2005d).
Business investment is forecast to increase by 7.3 per cent in 2005-06, which will make a significant contribution to aggregate economic growth and demand for labour, but represents a marked deceleration from the average of 20 per cent a year in the investment boom of the past three years (Chamber of Commerce and Industry (WA) 2005). According to Department of Treasury and Finance (WA) (2005) real growth in business investment in Western Australia was however only 2.5 per cent for 2004 compared to 8.4 per cent nationally.
The high growth in expenditure on mineral and petroleum exploration in Western Australia is likely to increase development activities in the future thus further fuelling labour demand in some occupations. Expenditure (trend) on exploration in the state grew by 4.7 per cent in the March quarter 2005, and makes it the twelfth consecutive quarter of growth.
Implications and policy responses Shortages could result in under utilisation of capacity and consequently reduced production. If the response of employers is to bid up wages in ways that do not match productivity then higher inflation could result.
Another effect of bidding up wages in times of shortages is that the existing supply of workers circulates more quickly between employers, thus making retention more difficult and the employees involved less productive.
From the workers’ perspective, shortages, or even a perception of it, can be a good thing because it delivers higher wages and a reduced likelihood of unemployment.
Provision of publicly funded training places is one of the ways of overcoming skills shortages and gaps. Public provision is usually rationalised in terms of efficiency and equity arguments. Since economic performance is negatively affected by skills gaps, it is argued that more training will result in an adaptable workforce. The training has, however, to be appropriate to be effective.
Employers’ capacity to respond to shortages will be increased the greater their awareness of the importance of training and the greater their involvement in planning and provision.
Long-term perspective is required on training and its benefits for innovation and profits. Employers, obviously wanting to recoup returns on investment in employees’ training, are naturally concerned about assuming the costs of such training where there is the danger that much of the benefit may be gained by other firms, particularly in markets where margins are narrow.
Pertinent, reliable information about various aspects of the labour market that is up-to-date and available to all agents helps clear imbalances in the market. The information must relate to not just a particular market but across all markets. It must be available on current wage rates, rates of return, unemployment rate, job openings and supply of workers in different sub-markets.
Immigration can be used as a policy instrument to solve skilled and unskilled labour shortage problems. Countries like Australia and Canada have skilled immigration programmes to meet expected shortfall in particular types of skills in their respective economies.
One of the problems with the skilled migration programmes is that arrival of migrants, with appropriate skills, often lags by a considerable time the actual occurrence of the shortage. This means that sometimes the market has already corrected itself by the time the immigrants arrive.
26

Availability of skilled labour
Temporary migration, which is an increasing phenomenon, circumvents this problem to a certain extent. Processing of applications for temporary working permits can be a matter of weeks provided all documents are in order.
Another problem is that migrants generally prefer settling in large metropolitan areas while the shortages are often in regional or remote areas. Assistance to encourage mobility may help alleviate geographical skills imbalances. Promotion of job opportunities and appropriate recruitment strategies could attract more immigrants to work in these areas.
Internal migration programmes are more likely to succeed if supported by comprehensive information, not only about the labour market but also about ancillary services, such as schooling, health and housing.
With rapid technological changes, there will always be a skills gap in the workforce. The rate at which the gap is bridged depends on the training system in place. If the firms were to take greater responsibility to bridge the employee skills gap, and governments assisted in this process, then the adjustment will be much faster and the training could be tailored specific to the firm, thus reducing problems of externalities.
4.6 Summary The demand for and supply of labour for the resources industry in Western Australia is part of broader state and national trends.
Employment in Australia in 2010 is expected to be 25 per cent higher than in 1998, and in Western Australia one percentage point lower than this. Recent trends and other economic data, however, suggest this estimate may be at the lower end of the scale. On current trends Western Australia’s share of national employment is expected to be 10.2 per cent in 2010, the same as its expected population share.
Job openings for new entrants in Western Australia will be about 41,000 per annum in the period 2005-2010 or 10.3 per cent of the total in Australia. Just over half the job openings are expected to be a result of net replacement of those who leave for reasons such as retirement, ill-health etc.
Apprenticeship commencements in Australia have increased each year since 1997, apart from 2000 and 2001 when there was a small decline. In Western Australia, the growth in apprenticeship commencements since 2001 has been strong. Nevertheless the 5,000 commencements in 2004 are still proportionately lower than in the rest of Australia.
Completion of apprenticeships in Western Australia has averaged about 2,600 each year since 1997. The increasing number of commencements in recent years, however, should produce a substantial increase in the number of apprenticeship completions in coming years—perhaps 10,800 during 2005-2008.
The apprenticeship system in Western Australia is relatively efficient—apparent apprenticeship completion rates average 87 per cent compared with 58 per cent nationally.
Since 1997 the numbers of trainees in-training have almost doubled in Western Australia, but nationally they have trebled. The relative trainee numbers are markedly lower in Western Australia. The completion rate of about two out of every five trainees is similar to the national rate though.
In recent years policy has increasingly emphasised skilled migration, including a shift towards temporary migration to meet short-term employer needs.
27

Availability of skilled labour
Potentially migration in 2003-04 could have contributed 130,400 additional persons to the national workforce. Among these were about 8,600 in trade occupations, of whom 1,500 were in the mechanical and fabrication trades, 1,100 in electrical trades and 1,600 in construction trades.
The skills of permanent immigrants are often not fully utilised. For example, in 2003-04 only 43 per cent of migrants who had a job in the mechanical and fabrication trades before migrating were employed in the same group of trade occupations after migrating.
Western Australia lags behind states, particularly Victoria in attracting skilled migrants under State-Specific and Regional Migration Initiatives. In 2003-04 Western Australia’s share of the total visa grants under this scheme was 7.6 per cent compared to 50.7 per cent for Victoria.
28
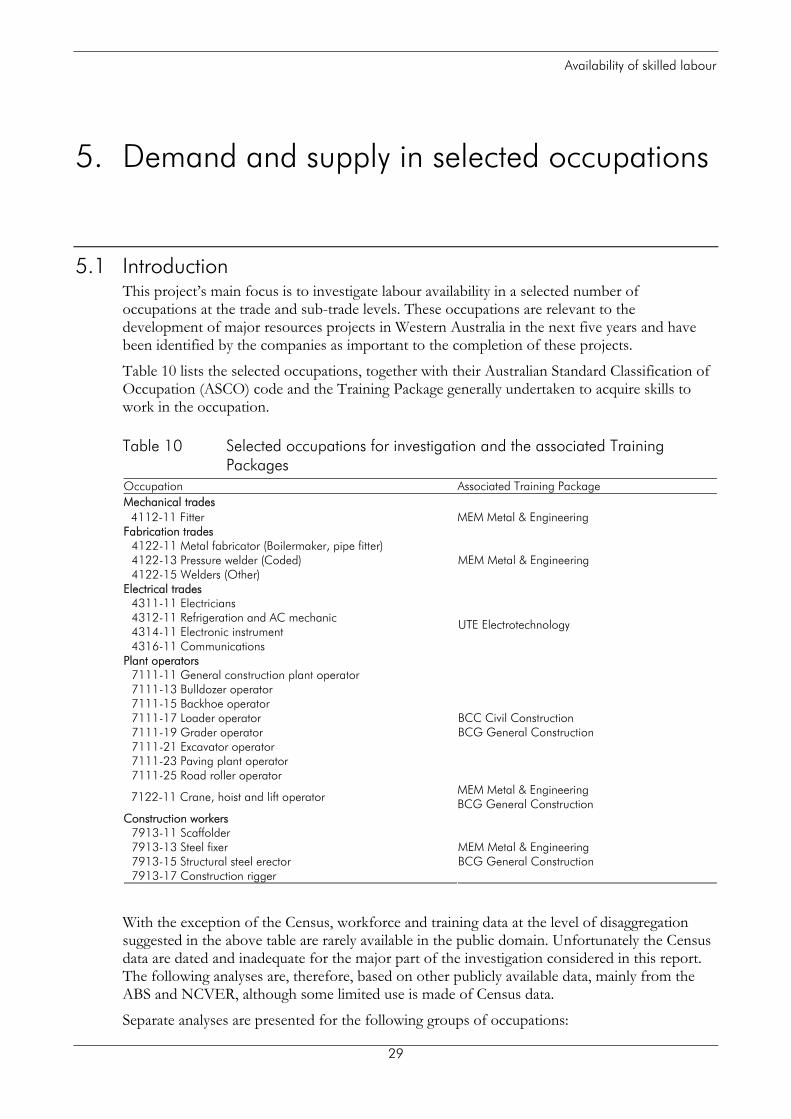
Availability of skilled labour
5. Demand and supply in selected occupations
5.1 Introduction This project’s main focus is to investigate labour availability in a selected number of occupations at the trade and sub-trade levels. These occupations are relevant to the development of major resources projects in Western Australia in the next five years and have been identified by the companies as important to the completion of these projects.
Table 10 lists the selected occupations, together with their Australian Standard Classification of Occupation (ASCO) code and the Training Package generally undertaken to acquire skills to work in the occupation.
Table 10 Selected occupations for investigation and the associated Training Packages
Occupation Associated Training Package Mechanical trades
4112-11 Fitter MEM Metal & Engineering Fabrication trades
4122-11 Metal fabricator (Boilermaker, pipe fitter) 4122-13 Pressure welder (Coded) 4122-15 Welders (Other)
MEM Metal & Engineering
Electrical trades 4311-11 Electricians 4312-11 Refrigeration and AC mechanic 4314-11 Electronic instrument 4316-11 Communications
UTE Electrotechnology
Plant operators 7111-11 General construction plant operator 7111-13 Bulldozer operator 7111-15 Backhoe operator 7111-17 Loader operator 7111-19 Grader operator 7111-21 Excavator operator 7111-23 Paving plant operator 7111-25 Road roller operator
BCC Civil Construction BCG General Construction
7122-11 Crane, hoist and lift operator MEM Metal & Engineering BCG General Construction
Construction workers 7913-11 Scaffolder 7913-13 Steel fixer 7913-15 Structural steel erector 7913-17 Construction rigger
MEM Metal & Engineering BCG General Construction
With the exception of the Census, workforce and training data at the level of disaggregation suggested in the above table are rarely available in the public domain. Unfortunately the Census data are dated and inadequate for the major part of the investigation considered in this report. The following analyses are, therefore, based on other publicly available data, mainly from the ABS and NCVER, although some limited use is made of Census data.
Separate analyses are presented for the following groups of occupations:
29
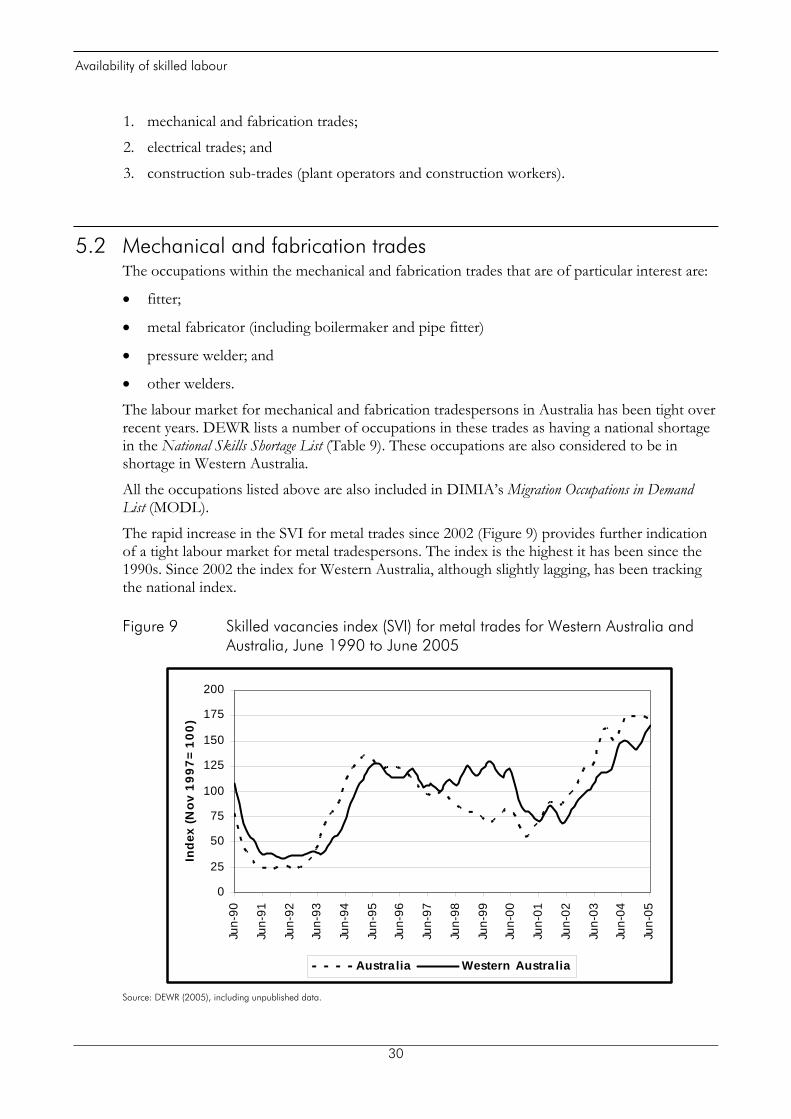
Availability of skilled labour
1. mechanical and fabrication trades;
2. electrical trades; and
3. construction sub-trades (plant operators and construction workers).
5.2 Mechanical and fabrication trades The occupations within the mechanical and fabrication trades that are of particular interest are:
• fitter;
• metal fabricator (including boilermaker and pipe fitter)
• pressure welder; and
• other welders.
The labour market for mechanical and fabrication tradespersons in Australia has been tight over recent years. DEWR lists a number of occupations in these trades as having a national shortage in the National Skills Shortage List (Table 9). These occupations are also considered to be in shortage in Western Australia.
All the occupations listed above are also included in DIMIA’s Migration Occupations in Demand List (MODL).
The rapid increase in the SVI for metal trades since 2002 (Figure 9) provides further indication of a tight labour market for metal tradespersons. The index is the highest it has been since the 1990s. Since 2002 the index for Western Australia, although slightly lagging, has been tracking the national index.
Figure 9 Skilled vacancies index (SVI) for metal trades for Western Australia and Australia, June 1990 to June 2005
0
25
50
75
100
125
150
175
200
Jun-
90
Jun-
91
Jun-
92
Jun-
93
Jun-
94
Jun-
95
Jun-
96
Jun-
97
Jun-
98
Jun-
99
Jun-
00
Jun-
01
Jun-
02
Jun-
03
Jun-
04
Jun-
05
Inde
x (N
ov 1
997=
100)
Australia Western Australia
Source: DEWR (2005), including unpublished data.
30

Availability of skilled labour
5.2.1 Metal fitters and machinists
Employment trends and projections The fitters’ occupation is one of three main occupations that make up the metal fitters and machinists group. According to Census 2001 data in Table 11, fitters make up 90 per cent of the metal and fitters and machinists group in terms of the numbers of persons employed.16
Western Australia employed about 10,500 fitters in 2001, which is 14 per cent of the national total. The high demand for such skills in the state is partly driven by the large resources sector in the state’s economy.
Table 11 Numbers of metal fitters and machinists employed in Western Australia and Australia, Census 2001
WA Australia
ASCO code Occupation description Number % of Australia Number % of unit group 4112 Metal fitters & machinists 10,298 14 74,688 100
4112-01 Supervisor. fitters & machinists 533 18 2,997 4 4112-11 Fitter 8,384 14 60,620 81 4112-13 Machinist (First Class) 693 12 5,611 8 4112-15 TCF mechanic 22 3 674 1 4112-81 Apprentice fitter 651 14 4,588 6 4112-83 Apprentice machinist 16 9 182 0 4112-85 Apprentice TCF mechanic 0 0 15 0
Source: Unpublished ABS Census 2001.
The trend in the numbers employed in Australia since the end of 1997 suggests the demand for metal fitters and machinists have been in decline (Figure 10). Part of the decline may be related to the contraction of the textile, footwear and clothing industry in Australia which traditionally provided many jobs in this occupation.
In contrast, the numbers employed in these occupations in Western Australia have, on average, remained reasonably constant although there is significant volatility from one quarter to another in the numbers employed (Figure 11).17
While the forecasts18 suggest the demand for fitters and machinists may decline nationally, it is likely to remain reasonably constant, at about 14,000 persons, in Western Australia. Consequently, the state’s share of the total number of fitters and machinists employed nationally is expected to increase to about an average of 16.8 per cent for the 2005-10 period compared to14.5 per cent previously (Table 12).
The expected decline in interstate employment could mean that some fitters and machinists may be unemployed in the eastern states in the next few years. This group is a potential source of supply for projects in Western Australia. If the labour market tightens further in Western Australia then, given the right incentives and appropriate recruitment, some of these fitters and machinists could be enticed to the state either permanently or temporarily.
16 Includes supervisors and apprentices. 17 Part of the volatility in the numbers for Western Australia is because of the smaller representation of the state’s workforce in the national Labour Force survey. Estimates based on small sample sizes can vary substantially. 18 The forecasts are based on extrapolating from a linear trend model with seasonal dummies. The model was estimated with quarterly data from November 1997 to February 2005. Thus the forecast for 2005 is the average of the actual for the first quarter and forecasts of the last three quarters of that year.
31

Availability of skilled labour
Figure 10 Historical and projected employment of metal fitters and machinists (ASCO 4112) in Australia
70
75
80
85
90
95
100
105
110
Nov
-97
Nov
-98
Nov
-99
Nov
-00
Nov
-01
Nov
-02
Nov
-03
Nov
-04
Nov
-05
Nov
-06
Nov
-07
Nov
-08
Nov
-09
Nov
-10
Empl
oym
ent
('000
)
H istorical Forecasts
Source: Based on unpublished ABS Labour Force data for every third month from November 1997 to February 2005, (ABS Cat. no. 6203.0).
Figure 11 Historical and projected employment of metal fitters and machinists (ASCO 4112) in Western Australia
10
11
12
13
14
15
16
17
18
Nov
-97
Nov
-98
Nov
-99
Nov
-00
Nov
-01
Nov
-02
Nov
-03
Nov
-04
Nov
-05
Nov
-06
Nov
-07
Nov
-08
Nov
-09
Nov
-10
Empl
oym
ent
('000
)
H istorical Forecasts
Source: Based on unpublished ABS Labour Force data for every third month from November 1997 to February 2005, (ABS Cat. no. 6203.0).
Table 12 Historical and projected (2005-2010) employment of metal fitters and machinists (ASCO 4112) in Western Australia and Australia, (‘000)
Western Australia Australia Year (‘000) % of Australia (‘000) 1998 15.0 14.9 100.6 1999 11.1 12.1 92.0 2000 12.1 12.3 98.5
32

Availability of skilled labour
2001 14.6 15.0 97.5 2002 13.2 14.9 88.6 2003 14.5 15.9 91.1 2004 14.4 16.1 89.4 2005 13.4 15.6 86.1 2006 13.9 16.3 85.4 2007 13.9 16.6 83.7 2008 13.9 16.9 82.1 2009 14.0 17.4 80.4 2010 14.0 17.8 78.7 Source: Based on unpublished ABS Labour Force data for every third month from November 1997 to February 2005, (ABS Cat. no. 6203.0). Forecasts are in italics.
Net entrants and net separations Overall employment of fitters and machinists in Australia was only marginally lower in 2004 compared to 1999. However, as Figure 12 shows, the age profiles of the occupation in the two years have many differences.19 The figure shows that not only did the median age increase over this period but the distribution also changed. In particular, employment of 25-34 year-olds is much lower in 2004 than in 1999.
Figure 12 Numbers of metal fitters and machinists (ASCO 4112) employed by age in 1999 and 2004, Australia
0
2
4
6
8
10
12
14
16
15-1
9
20-2
4
25-2
9
30-3
4
35-3
9
40-4
4
45-4
9
50-5
4
55-5
9
60-6
4
65-6
9
70+
Age
Pers
ons
('000
)
1999 2004
Source: Based on unpublished ABS Labour Force data for 1999 and 2004, (ABS Cat. no. 6203.0).
Comparing the same age cohort in the occupation at the two points in time (for example, 15-19 year-olds in 1999 compared to 20-24 year-olds in 2004) provides estimates of net entrants and net separations by age. Net separations of fitters and machinists occur from all age groups except 15-19 and 45-49 age groups (Figure 13).
In general, net separations would be expected to occur mainly from older age groups. When net separations also occur from younger age groups, it suggests overall declining employment in the
19 The analysis by age of fitters and machinists employed in Western Australia is difficult because the labour force estimates are likely to be based on very small sample sizes and hence have large standard errors.
33

Availability of skilled labour
occupation or retention problems. For example, Figure 13 suggests retention problems among prime working age fitters and machinists. Interestingly, the figure also suggests net entrants to the occupations among the 45-49 age group, indicating re-entry of older, experienced workers or workers who have been retrained.
The patterns in Figure 13 are suggestive and based on data from two years. Further time series analysis is required to establish whether similar patterns emerge using data for different periods.
Figure 13 Net entrants and net separations of metal fitters and machinists (ASCO 4112) by age between 1999 and 2004, Australia
-4.0
-2.0
0.0
2.0
4.0
6.0
15-1
9
20-2
4
25-2
9
30-3
4
35-3
9
40-4
4
45-4
9
50-5
4
55-5
9
60-6
4
65-6
9
70+
Age in 1999
Pers
ons
('000
)
Net entrants Net separations
Source: Based on unpublished ABS Labour Force data 1999 and 2004, (ABS Cat. no. 6203.0).
Job openings for new entrants The expected negative growth in the employment of fitters and machinists in Australia in the next six years means that job openings for new entrants are likely to be only as a result of replacement needs. About 9,600 such jobs per annum are likely to be available (Table 13).
In Western Australia, after an initial negative growth in 2005, growth is likely to pick up in 2006 but otherwise little growth is expected. Job openings for new entrants expect to average 370 per annum. Western Australia is expected to have 23 per cent of all job openings for fitters and machinists in Australia in the next six years.
Table 13 Job openings for new entrants to metal fitters and machinists trades (ASCO 4112) in Western Australia and Australia, (2005-2010) (‘000)
Western Australia Australia
Year Growth Net replacement
needs
Job openings for new entrants Growth
Net replacement needs
Job openings for new entrants
2005 -1.0 0.3 0.3 -3.3 1.7 1.7 2006 0.5 0.3 0.8 -0.7 1.6 1.6 2007 0.0 0.3 0.3 -1.7 1.6 1.6 2008 0.0 0.3 0.3 -1.6 1.6 1.6 2009 0.1 0.3 0.4 -1.7 1.6 1.6 2010 0.0 0.3 0.3 -1.7 1.5 1.5
34

Availability of skilled labour
Total 2005-10 -0.4 1.6 2.2 -10.7 9.6 9.6 Note: Assumes a uniform net replacement rate of 1.9 per cent for both Western Australia and Australia. The occupational net replacement rates were estimated using the CEET model and are reported in Shah and Burke (2003).
5.2.2 Structural steel and welding tradespersons
Employment trends and projections The structural steel and welding group of occupations consists of fabricators and welders. The Census 2001 data indicate about 60 percent of the group was employed as fabricators and the rest as welders. Pressure welders form a tiny minority among welders (Table 14).
About 7,500 fabricators and welders were employed in Western Australia in 2001. They represent 15 per cent of the total number employed nationally.
Table 14 Numbers of structural steel and welding tradespersons employed in Western Australia and Australia, Census 2001
WA Australia
ASCO code Occupation description Number % of Australia Number % of unit group 4122 Structural steel & welding 7,477 15 50,049 100
4122-01 Supervisor structural steel & welding 370 16 2,305 5 4122-11 Metal fabricator 4,103 16 26,119 52 4122-13 Pressure welder 19 16 118 0 4122-15 Welder (First Class) 2,513 14 18,329 37 4122-81 Apprentice metal fabricator 388 15 2,568 5 4122-83 Apprentice welder 83 14 609 1
Source: Unpublished ABS Census 2001.
Figure 14 shows the numbers of metal fabricators and welders employed in Australia have been increasing in the last couple of years after remaining static for the previous five years. Projections based on the historical trend suggest employment in these occupations will steadily increase to 72,500 by 2010 (Table 15).
In Western Australia, the growth in employment in these occupations has been sustained over a much longer period (Figure 15). The future demand in the state is expected to be 12,300,20 or 17 per cent of the national total by 2010.
20 The regression model for Western Australia was estimated with data from first quarter 1999 to first quarter 2005 to allow an appropriate capture of the strong trend over the last four years.
35

Availability of skilled labour
Figure 14 Historical and projected employment of structural steel and welding tradespersons (ASCO 4122) in Australia
50
55
60
65
70
75
80N
ov-9
7
Nov
-98
Nov
-99
Nov
-00
Nov
-01
Nov
-02
Nov
-03
Nov
-04
Nov
-05
Nov
-06
Nov
-07
Nov
-08
Nov
-09
Nov
-10
Empl
oym
ent
('000
)
H istorical Forecasts
Source: Based on unpublished ABS Labour Force data for every third month from November 1997 to February 2005, (ABS Cat. no. 6203.0).
Figure 15 Historical and projected employment of structural steel and welding tradespersons (ASCO 4122) in Western Australia
5
6
7
8
9
10
11
12
13
14
15
16
Nov
-97
Nov
-98
Nov
-99
Nov
-00
Nov
-01
Nov
-02
Nov
-03
Nov
-04
Nov
-05
Nov
-06
Nov
-07
Nov
-08
Nov
-09
Nov
-10
Empl
oym
ent
('000
)
H istorical Forecasts
Source: Based on unpublished ABS Labour Force data for every third month from November 1997 to February 2005, (ABS Cat. no. 6203.0).
36

Availability of skilled labour
Table 15 Historical and projected (2005-2010) employment of structural steel and welding tradespersons (ASCO 4122) in Western Australia and Australia
Western Australia Australia Year (‘000) % of Australia (‘000) 1998 10.3 16.5 62.6 1999 9.6 15.6 61.7 2000 8.2 12.6 65.1 2001 7.3 12.2 59.7 2002 10.1 16.6 60.9 2003 9.2 14.4 63.7 2004 10.3 14.8 69.6 2005 11.0 15.9 69.0 2006 10.8 15.8 68.5 2007 11.2 16.1 69.5 2008 11.5 16.4 70.5 2009 11.9 16.7 71.5 2010 12.3 16.9 72.5 Source: Based on unpublished ABS Labour Force data for every third month from November 1997 to February 2005, (ABS Cat. no. 6203.0). Forecasts are in italics.
Net entrants and net separations There were 13 per cent more fabricators and welders employed in Australia in 2004 than in 1999. Their age profiles in the respective years are shown in Figure 16. Despite this growth the median age for fabricators and welders is higher in 2004 than in 1999.
Figure 17 shows that net separations are relatively lower. A significant number who left were between 55 and 64 years of age but there was also a sizeable group aged 30-34 years who left. Once again, this is an indication of retention problems among workers of this age group, the reasons for which need additional investigation as it represents a drain and wastage of much needed skills.
Not surprisingly, a high number of net entrants to the occupation are aged 15-24 years. There is also evidence of entry or re-entry of older workers which partly offset the high net separations among 30-34 year-olds.
37

Availability of skilled labour
Figure 16 Numbers of structural steel and welding tradespersons employed (ASCO 4122) by age in 1999 and 2004, Australia
0
2
4
6
8
10
12
15-1
9
20-2
4
25-2
9
30-3
4
35-3
9
40-4
4
45-4
9
50-5
4
55-5
9
60-6
4
65-6
9
70+
Age
Pers
ons
('000
)
1999 2004
Source: Based on unpublished ABS Labour Force data 1999 and 2004, (ABS Cat. no. 6203.0).
Figure 17 Net entrants and separations of structural steel and welding tradespersons (ASCO 4122) by age between 1999 and 2004, Australia
-4.0-3.0-2.0-1.00.01.02.03.04.05.0
15-1
9
20-2
4
25-2
9
30-3
4
35-3
9
40-4
4
45-4
9
50-5
4
55-5
9
60-6
4
65-6
9
70+
Age in 1999
Pers
ons
('000
)
Net entrants Net separations
Source: Based on unpublished ABS Labour Force data 1999 and 2004, (ABS Cat. no. 6203.0).
Job openings for new entrants The expected job openings for new entrants to the fabrication and welding trades in Australia are likely to average 2,100 per year between 2005 and 2010 (Table 16).
In Western Australia job openings are expected to average almost 600 per year, representing 28 per cent of the national total.
38
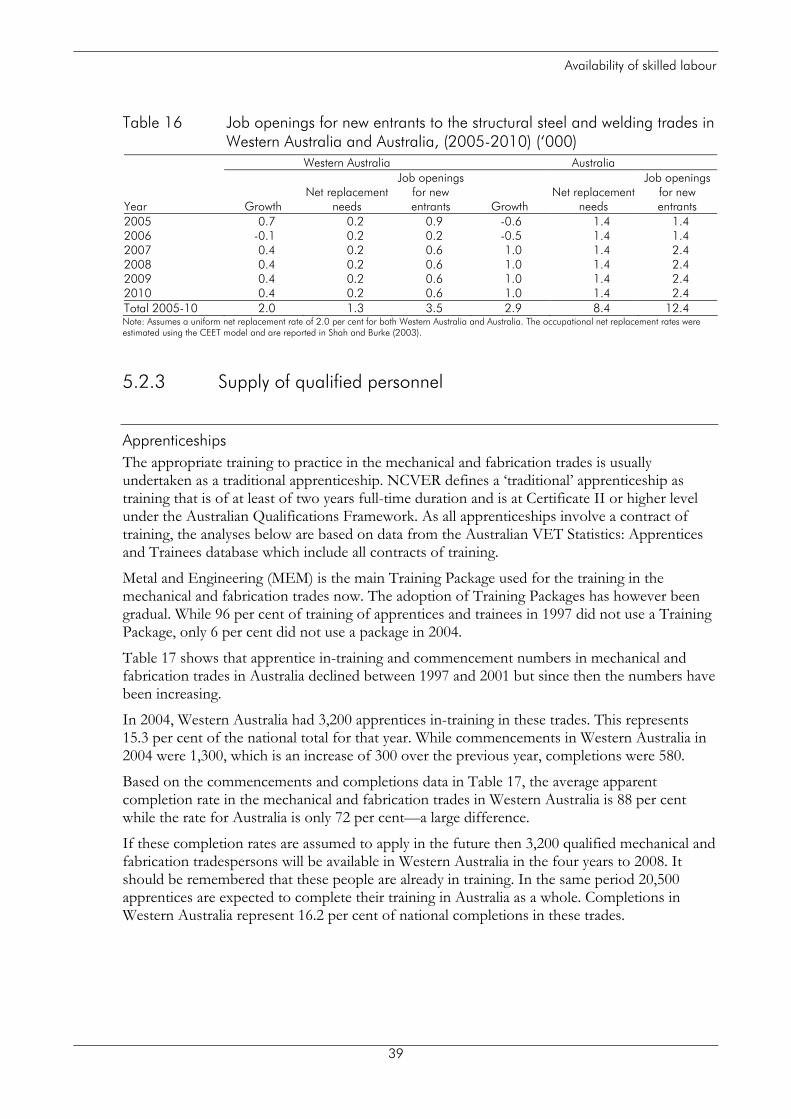
Availability of skilled labour
Table 16 Job openings for new entrants to the structural steel and welding trades in Western Australia and Australia, (2005-2010) (‘000)
Western Australia Australia
Year Growth Net replacement
needs
Job openings for new entrants Growth
Net replacement needs
Job openings for new entrants
2005 0.7 0.2 0.9 -0.6 1.4 1.4 2006 -0.1 0.2 0.2 -0.5 1.4 1.4 2007 0.4 0.2 0.6 1.0 1.4 2.4 2008 0.4 0.2 0.6 1.0 1.4 2.4 2009 0.4 0.2 0.6 1.0 1.4 2.4 2010 0.4 0.2 0.6 1.0 1.4 2.4 Total 2005-10 2.0 1.3 3.5 2.9 8.4 12.4 Note: Assumes a uniform net replacement rate of 2.0 per cent for both Western Australia and Australia. The occupational net replacement rates were estimated using the CEET model and are reported in Shah and Burke (2003).
5.2.3 Supply of qualified personnel
Apprenticeships The appropriate training to practice in the mechanical and fabrication trades is usually undertaken as a traditional apprenticeship. NCVER defines a ‘traditional’ apprenticeship as training that is of at least of two years full-time duration and is at Certificate II or higher level under the Australian Qualifications Framework. As all apprenticeships involve a contract of training, the analyses below are based on data from the Australian VET Statistics: Apprentices and Trainees database which include all contracts of training.
Metal and Engineering (MEM) is the main Training Package used for the training in the mechanical and fabrication trades now. The adoption of Training Packages has however been gradual. While 96 per cent of training of apprentices and trainees in 1997 did not use a Training Package, only 6 per cent did not use a package in 2004.
Table 17 shows that apprentice in-training and commencement numbers in mechanical and fabrication trades in Australia declined between 1997 and 2001 but since then the numbers have been increasing.
In 2004, Western Australia had 3,200 apprentices in-training in these trades. This represents 15.3 per cent of the national total for that year. While commencements in Western Australia in 2004 were 1,300, which is an increase of 300 over the previous year, completions were 580.
Based on the commencements and completions data in Table 17, the average apparent completion rate in the mechanical and fabrication trades in Western Australia is 88 per cent while the rate for Australia is only 72 per cent—a large difference.
If these completion rates are assumed to apply in the future then 3,200 qualified mechanical and fabrication tradespersons will be available in Western Australia in the four years to 2008. It should be remembered that these people are already in training. In the same period 20,500 apprentices are expected to complete their training in Australia as a whole. Completions in Western Australia represent 16.2 per cent of national completions in these trades.
39
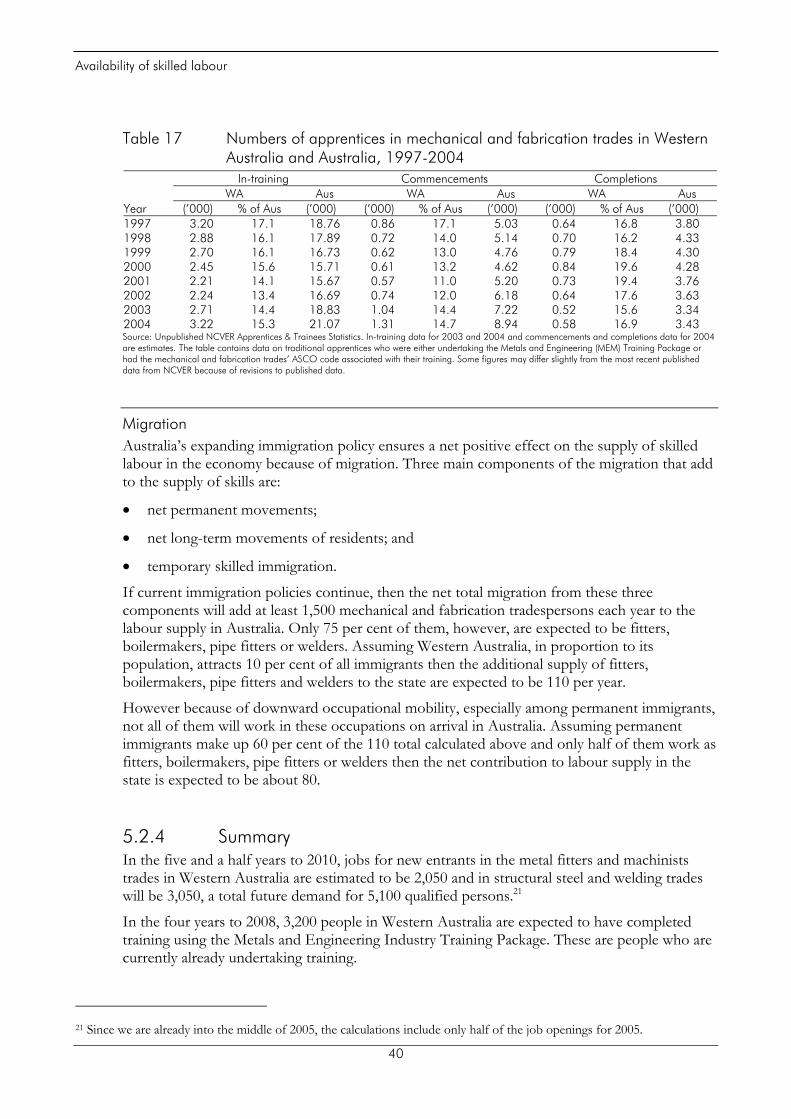
Availability of skilled labour
Table 17 Numbers of apprentices in mechanical and fabrication trades in Western Australia and Australia, 1997-2004
In-training Commencements Completions WA Aus WA Aus WA Aus Year (’000) % of Aus (’000) (’000) % of Aus (’000) (’000) % of Aus (’000) 1997 3.20 17.1 18.76 0.86 17.1 5.03 0.64 16.8 3.80 1998 2.88 16.1 17.89 0.72 14.0 5.14 0.70 16.2 4.33 1999 2.70 16.1 16.73 0.62 13.0 4.76 0.79 18.4 4.30 2000 2.45 15.6 15.71 0.61 13.2 4.62 0.84 19.6 4.28 2001 2.21 14.1 15.67 0.57 11.0 5.20 0.73 19.4 3.76 2002 2.24 13.4 16.69 0.74 12.0 6.18 0.64 17.6 3.63 2003 2.71 14.4 18.83 1.04 14.4 7.22 0.52 15.6 3.34 2004 3.22 15.3 21.07 1.31 14.7 8.94 0.58 16.9 3.43 Source: Unpublished NCVER Apprentices & Trainees Statistics. In-training data for 2003 and 2004 and commencements and completions data for 2004 are estimates. The table contains data on traditional apprentices who were either undertaking the Metals and Engineering (MEM) Training Package or had the mechanical and fabrication trades’ ASCO code associated with their training. Some figures may differ slightly from the most recent published data from NCVER because of revisions to published data.
Migration Australia’s expanding immigration policy ensures a net positive effect on the supply of skilled labour in the economy because of migration. Three main components of the migration that add to the supply of skills are:
• net permanent movements;
• net long-term movements of residents; and
• temporary skilled immigration.
If current immigration policies continue, then the net total migration from these three components will add at least 1,500 mechanical and fabrication tradespersons each year to the labour supply in Australia. Only 75 per cent of them, however, are expected to be fitters, boilermakers, pipe fitters or welders. Assuming Western Australia, in proportion to its population, attracts 10 per cent of all immigrants then the additional supply of fitters, boilermakers, pipe fitters and welders to the state are expected to be 110 per year.
However because of downward occupational mobility, especially among permanent immigrants, not all of them will work in these occupations on arrival in Australia. Assuming permanent immigrants make up 60 per cent of the 110 total calculated above and only half of them work as fitters, boilermakers, pipe fitters or welders then the net contribution to labour supply in the state is expected to be about 80.
5.2.4 Summary In the five and a half years to 2010, jobs for new entrants in the metal fitters and machinists trades in Western Australia are estimated to be 2,050 and in structural steel and welding trades will be 3,050, a total future demand for 5,100 qualified persons.21
In the four years to 2008, 3,200 people in Western Australia are expected to have completed training using the Metals and Engineering Industry Training Package. These are people who are currently already undertaking training.
21 Since we are already into the middle of 2005, the calculations include only half of the job openings for 2005.
40

Availability of skilled labour
This Training Package is used to deliver training for a range of mechanical and fabrication engineering trades. Hence the number of qualified people from the training system available for the occupations listed above is going to less than total numbers who have completed the Training Package. We estimate 2,400, or 7522 per cent of the total, to be available for these occupations. Of the rest, some may not work at all and others will work either in other occupations that require similar training or in occupations where such training is not required at all.
The contribution of migration to the supply of these skills, under current policies, is likely to be modest, perhaps in the region of 480 persons. The changes to the skills migration policies announced a few months ago may increase supply by another 10 per cent thus pushing the total to about 530.
The total supply to 2010, with additional commencements, is then likely to be 2,930. This leaves a shortfall of 2,170 to be made up from state training and interstate and overseas migration.
After allowing for wastage through non-completion, movements of graduates to other occupations23 and assuming training takes four years to complete, Western Australia needs have a total of at least 3,450 apprenticeship commencements in the metals trades in 2005 and 2006 to meet projected demand. This represents an increase of 30 per cent over and above the numbers of commencements in 2004.
Two approaches to meeting the demand for fitters, boilermakers, pipe fitters and welders would be either to boost current training effort or to maintain current effort and make up the difference through interstate recruitment and/or attract a larger share of international migrants to Australia to the state.
5.3 Electrical trades The occupations within the electrical trades that are of particular interest are:
• electricians;
• refrigeration and air-conditioning mechanics;
• electronic instrument; and
• communication technician.
The latter three occupations are relatively small in terms of the numbers of people employed. Therefore data for them are aggregated under the ‘other electrical trades’ label and the analyses presented below will be for this composite occupation group.
The labour market for electrical tradespersons has also been tight in the last few years. Except for communication technician, all the above occupations are currently included in DEWR’s National Skills Shortage List as being in shortage nationally as well as in Western Australia (Table 9). Some of these occupations are also in the Migration Occupations in Demand List (MODL).
The SVI for electrical trades for Australia shows an increasing trend since the middle of 2002 and currently it is at the highest level since 1990 (see Figure 18). The index for Western
22 Approximately 75 per cent of mechanical and fabrication engineering tradespersons are employed in the occupations that are the focus of this report. We assume 5 per cent to either not work or to work in unrelated occupations. 23 Assumes 5 per cent of graduates do not practice in the occupation they qualified for and 25 percent practice in other mechanical and fabrication trades.
41

Availability of skilled labour
Australia has a cyclical. In June 2000 it peaked at a record high level followed by a spectacular decline a year later. Since then it has increased sharply again and in the last couple of years it has remained relatively stable at a high level, which reflects a continuing tight labour market.
Figure 18 Skilled vacancies index (SVI) for electrical trades for Western Australia and Australia, June 1990 to June 2005
0255075
100125150175200225250275300
Jun-
90
Jun-
91
Jun-
92
Jun-
93
Jun-
94
Jun-
95
Jun-
96
Jun-
97
Jun-
98
Jun-
99
Jun-
00
Jun-
01
Jun-
02
Jun-
03
Jun-
04
Jun-
05
Inde
x (N
ov 1
997=
100)
Australia Western Australia
Source: DEWR (2005), includes unpublished data.
5.3.1 Electricians
Employment trends and projections There are two occupations in the electrician’s group—electrician and lift mechanic. Lift mechanics are likely to have the general electrician’s training plus some additional training to be able to work on lifts. Only two per cent of electricians employed at Census 2001 were however lift mechanics (Table 18).
In 2001, Western Australia employed 8,700, or 11 per cent of all electricians in Australia.
Table 18 Employment of electricians in Western Australia and Australia, Census 2001
WA Australia
ASCO code Occupation description Number % of Australia Number % of unit group 4311 Electricians 8,722 11 78,713 100
4311-01 Supervisor electricians 554 14 3,843 5 4311-11 General electrician 6,989 11 63,981 81 4311-13 Electrician (Special Class) 22 10 227 0 43111-5 Lift mechanic 99 6 1,637 2 4311-81 Apprentice electrician 1,052 12 8,944 11 4311-83 Apprentice lift mechanic 6 8 80 0
Source: Unpublished ABS Census 2001.
42

Availability of skilled labour
Apart from short-term aberrations which could be data collection related, the general trend in the numbers of electricians employed in Australia since the end of 1997 has been increasing (Figure 19). The average annual employment between 1997 and 2004 was 96,000.
In contrast, the pattern of employment of electricians in Western Australia can be characterised as having three phases—an increasing phase until August 2001, followed by a prolonged decline until February 2003 and finally a sharp increase thereafter (Figure 20).
The projection of the trend in Figure 19 suggests the demand for electricians in Australia is likely to be about 112,000 by 2010 (Table 19).
On the other hand, the underlying trend for Western Australia is negative suggesting future demand may be less than the current average employment. This pattern, however, is not consistent with the 2004 employment data. For this reason we have used the overall historical average employment to project demand for 2005-2010. Accordingly total demand in Western Australia is expected to be 9,900 each year to 2010. If the recent demand is sustained over the next one or two quarters then these projections may need to be revised upwards.
As a consequence of increasing demand nationally and stagnant demand in Western Australia, the proportion of the total number of electricians working in the state is expected to decline.
Figure 19 Historical and projected employment of electricians (ASCO 4311) in Australia
70
80
90
100
110
120
Nov
-97
Nov
-98
Nov
-99
Nov
-00
Nov
-01
Nov
-02
Nov
-03
Nov
-04
Nov
-05
Nov
-06
Nov
-07
Nov
-08
Nov
-09
Nov
-10
Empl
oym
ent
('000
)
H istorical Forecasts
Source: Based on unpublished ABS Labour Force data for every third month from November 1997 to February 2005, (ABS Cat. no. 6203.0).
43

Availability of skilled labour
Figure 20 Historical and projected employment of electricians (ASCO 4311) in Western Australia
7
8
9
10
11
12
13
Nov
-97
Nov
-98
Nov
-99
Nov
-00
Nov
-01
Nov
-02
Nov
-03
Nov
-04
Nov
-05
Nov
-06
Nov
-07
Nov
-08
Nov
-09
Nov
-10
Empl
oym
ent
('000
)
H istorical Forecasts
Source: Based on unpublished ABS Labour Force data for every third month from November 1997 to February 2005, (ABS Cat. no. 6203.0).
Table 19 Historical and projected (2005-2010) employment of electricians (ASCO 4311) in Western Australia and Australia
Western Australia Australia Year (‘000) % of Australia (‘000) 1998 10.1 11.0 92.0 1999 10.3 10.9 94.6 2000 10.5 11.2 94.0 2001 11.5 13.4 85.8 2002 9.2 9.7 95.3 2003 9.4 8.7 107.9 2004 8.6 8.6 99.8 2005 10.4 10.0 102.2 2006 10.0 9.5 104.6 2007 10.0 9.3 106.4 2008 10.0 9.1 108.2 2009 10.0 9.0 110.1 2010 10.0 8.8 111.9 Source: Based on unpublished ABS Labour Force data for every third month from November 1997 to February 2005, (ABS Cat. no. 6203.0). The forecasts are in italics. The forecasts for Western Australia assume the demand in 2006-2010 will be the same as the average employment in the historical period.
Net entrants and net separations The age distributions of electricians employed in 1999 and 2004 are shown in Figure 21. The figure shows substantially more electricians aged 45 to 59 employed in 2004 than in 1999.
Figure 22 shows net entrants and net separations of electricians by age. It indicates that about 9,000 electricians aged 25-39 left the occupation between 1999 and 2004. Such a high rate of wastage of young, trained workers must concern the industry and governments. The entry or re-entry of some older aged electricians is not sufficient to offset the loss of younger workers.
44

Availability of skilled labour
Figure 21 Number of electricians (ASCO 4311) employed by age in 1999 and 2004, Australia
02468
1012141618
15-1
9
20-2
4
25-2
9
30-3
4
35-3
9
40-4
4
45-4
9
50-5
4
55-5
9
60-6
4
65-6
9
70+
Age
Pers
ons
('000
)
1999 2004
Source: Based on unpublished ABS Labour Force data 1999 and 2004, (ABS Cat. no. 6203.0).
Figure 22 Net entrants and net separations of electricians (ASCO 4311) by age between 1999 and 2004, Australia
-8.0
-6.0
-4.0
-2.0
0.0
2.0
4.0
6.0
8.0
15-1
9
20-2
4
25-2
9
30-3
4
35-3
9
40-4
4
45-4
9
50-5
4
55-5
9
60-6
4
65-6
9
70+
Age in 1999
Pers
ons
('000
)
Net entrants Net separations
Source: Based on unpublished ABS Labour Force data 1999 and 2004, (ABS Cat. no. 6203.0).
Job openings for new entrants Both high growth and high net replacement rate for electricians mean job openings for new entrants in the occupation will average about 4,800 per annum until 2010 (Table 20).
45

Availability of skilled labour
In spite of projected zero growth in demand for electricians in Western Australia, which as discussed earlier needs to be monitored over the next six months, high net replacement needs means job openings for new entrants will still be over 500 per annum.
Job openings for new entrants in Western Australia are expected to be 10.9 per cent of the national total.
Table 20 Job openings for new entrants the electricians trade (ASCO 4311) in Western Australia and Australia, (2005-2010) (‘000)
Western Australia Australia
Year Growth Net replacement
needs
Job openings for new entrants Growth
Net replacement needs
Job openings for new entrants
2005 1.8 0.2 2.1 2.4 2.6 5.0 2006 -0.4 0.3 0.3 2.4 2.7 5.1 2007 0.0 0.3 0.3 1.8 2.7 4.5 2008 0.0 0.3 0.3 1.8 2.8 4.6 2009 0.0 0.3 0.3 1.9 2.8 4.7 2010 0.0 0.3 0.3 1.8 2.9 4.7 Total 2005-10 1.4 1.5 3.4 12.1 16.4 28.5 Note: Assumes a uniform net replacement rate of 2.6 per cent for both Western Australia and Australia. The occupational net replacement rates were estimated using the CEET model and are reported in Shah and Burke (2003).
5.3.2 Other electrical trades
Employment trends and projections As the Census data in Table 21 shows, the refrigeration and air-conditioning mechanics make up 36.1 per cent, the electronic instrument technicians 2.5 per cent and communications technicians 61.4 per cent of the composite group in which a total of about 35,000 people were employed in 2001.
Table 21 Numbers employed in ‘other electrical trades’ in Western Australia and Australia, Census 2001
WA Australia
ASCO code Occupation description Number % of Australia Number % of unit group 4312 Refrigeration & air conditioning 1,342 11 12,508 100
4312-01 Supervisor refrigeration. & aircon. mechs. 44 10 457 4 4312-11 Refrigeration. & aircon. Mechanic 1,137 11 10,584 85 4312-81 Apprentice refrigeration & aircon. Mechanic 161 11 1,467 12
4314 Electronic instrument 125 14 868 100 4314-01 Supervisor electronic instrument 7 14 55 6 4314-11 General electronic instrument 36 10 372 43 4314-13 Electronic instrument (Special Class) 77 18 420 48 4314-81 Apprentice electronic instrument 4 18 21 2
4316 Communications 2,073 10 21,315 100 4316-01 Supervisor communications 86 9 944 4 4316-11 General communications 1,560 10 15,071 71 4316-13 Communications linesperson 420 8 5,112 24 4316-81 Apprentice gen. comm. 6 4 165 1 4316-83 Apprentice comm. Linesperson 0 0 23 0
Source: Unpublished ABS Census 2001.
46

Availability of skilled labour
Figure 23 shows a high level of variability in the numbers employed in the other electrical trades in Australia over time. Not surprisingly, the employment series for Western Australia is equally volatile (Figure 24).
The overall trend in employment in the other electrical trades in Australia is negative. A closer examination of the data shows that until the beginning of 2001 employment in these occupations fluctuated around a mean of 45,000 and from the end of 2003 until most recently it has been fluctuating around a mean of 40,000. In between these two periods the employment numbers have been volatile.
Consequently, we have used the average employment in the historical period as expected demand for other electrical tradespersons in 2005-2010 (Table 22). The demand for electrical tradespersons in Australia is expected to be 43,000 per annum to 2010. In Western Australia the demand is expected to be about 4,500 per annum.
Figure 23 Historical and projected employment in other electrical trades (ASCO 4312, 4314, 4316) in Australia
30
35
40
45
50
Nov
-97
Nov
-98
Nov
-99
Nov
-00
Nov
-01
Nov
-02
Nov
-03
Nov
-04
Nov
-05
Nov
-06
Nov
-07
Nov
-08
Nov
-09
Nov
-10
Empl
oym
ent
('000
)
H istorical Forecasts
Source: Based on unpublished ABS Labour Force data for every third month from November 1997 to February 2005, (ABS Cat. no. 6203.0).
47

Availability of skilled labour
Figure 24 Historical and projected employment in other electrical trades (ASCO 4312, 4314, 4316) in Western Australia
3
3.5
4
4.5
5
5.5
6
Nov
-97
Nov
-98
Nov
-99
Nov
-00
Nov
-01
Nov
-02
Nov
-03
Nov
-04
Nov
-05
Nov
-06
Nov
-07
Nov
-08
Nov
-09
Nov
-10
Empl
oym
ent
('000
)
H istorical Forecasts
Source: Based on unpublished ABS Labour Force data for every third month from November 1997 to February 2005, (ABS Cat. no. 6203.0).
Table 22 Historical and projected (2005-2010) employment in other electrical trades (ASCO 4312, 4314, 4316) in Western Australia and Australia
Western Australia Australia Year (‘000) % of Australia (‘000) 1998 3.8 8.5 44.6 1999 4.4 9.6 46.1 2000 4.2 9.3 44.9 2001 4.1 9.9 41.6 2002 3.7 9.1 40.8 2003 4.9 10.9 45.0 2004 4.5 11.4 39.7 2005 4.2 9.8 42.7 2006 4.4 10.2 43.2 2007 4.5 10.4 43.2 2008 4.5 10.4 43.2 2009 4.6 10.6 43.2 2010 4.6 10.6 43.2 Source: Based on unpublished ABS Labour Force data for every third month from November 1997 to February 2005, (ABS Cat. no. 6203.0). The forecasts are in italics. Forecasts for Australia are based on the assumption that demand in 2006-2010 will be the same as average employment in the historical period.
Net entrants and net separations Figure 25 shows the age profiles of other electrical tradespersons in 1999 and 2004. Unlike in 1999, in 2004 almost equal numbers were employed in each of the age groups between 20 and 54 years.
The analysis of net entrants and net separations shown in Figure 26 indicate net separations from all ages above 24 years. Further time series analysis is needed to establish if the same patterns of separation are evident in other time periods. The existence of similar patterns in other periods would be an indication of serious retention problems in these occupations.
48
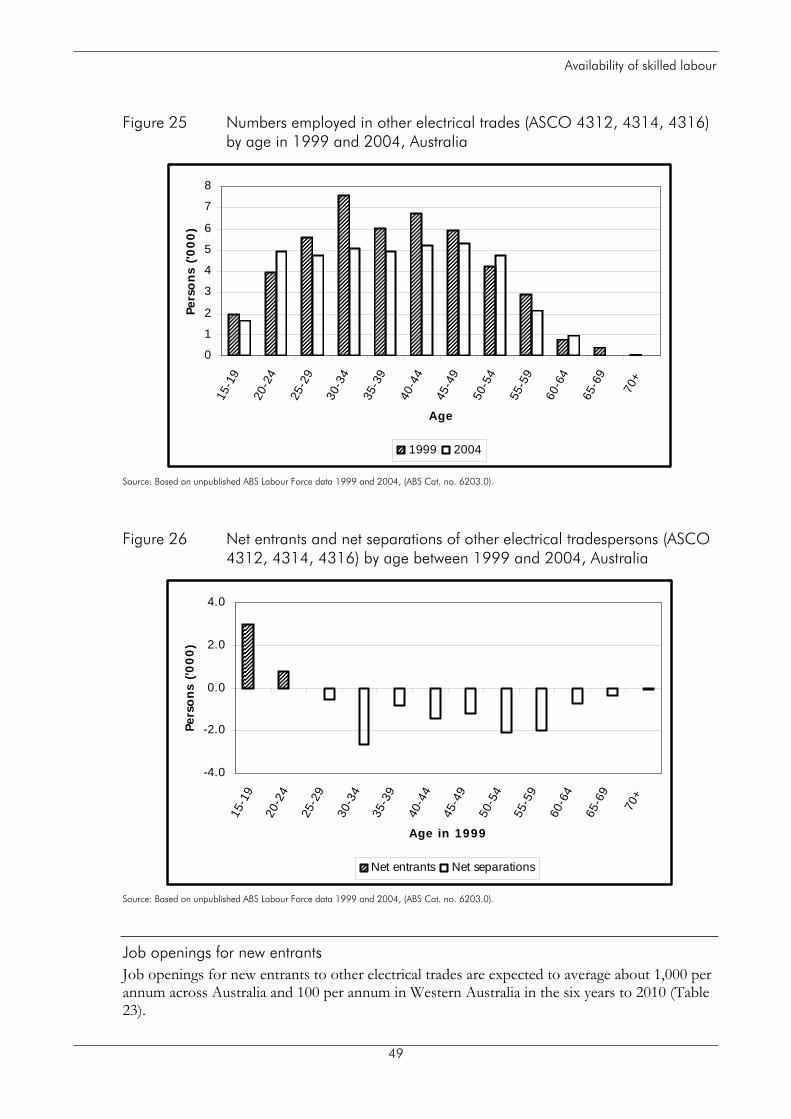
Availability of skilled labour
Figure 25 Numbers employed in other electrical trades (ASCO 4312, 4314, 4316) by age in 1999 and 2004, Australia
0
1
2
3
4
5
6
7
8
15-1
9
20-2
4
25-2
9
30-3
4
35-3
9
40-4
4
45-4
9
50-5
4
55-5
9
60-6
4
65-6
9
70+
Age
Pers
ons
('000
)
1999 2004
Source: Based on unpublished ABS Labour Force data 1999 and 2004, (ABS Cat. no. 6203.0).
Figure 26 Net entrants and net separations of other electrical tradespersons (ASCO 4312, 4314, 4316) by age between 1999 and 2004, Australia
-4.0
-2.0
0.0
2.0
4.0
15-1
9
20-2
4
25-2
9
30-3
4
35-3
9
40-4
4
45-4
9
50-5
4
55-5
9
60-6
4
65-6
9
70+
Age in 1999
Pers
ons
('000
)
Net entrants Net separations
Source: Based on unpublished ABS Labour Force data 1999 and 2004, (ABS Cat. no. 6203.0).
Job openings for new entrants Job openings for new entrants to other electrical trades are expected to average about 1,000 per annum across Australia and 100 per annum in Western Australia in the six years to 2010 (Table 23).
49

Availability of skilled labour
The net replacement rate assumed in the calculations in Table 23 is at the lower end in the light of net separations patterns observed in Figure 26. If a higher net replacement rate, such as the average net replacement rate for all occupations, is assumed then job openings for new entrants would be higher.
Table 23 Job openings for new entrants in other electrical trades (ASCO 4312, 4314, 4316) in Western Australia and Australia, (2005-2010) (‘000)
Western Australia Australia
Year Growth Net replacement
needs
Job openings for new entrants Growth
Net replacement needs
Job openings for new entrants
2005 -0.3 0.05 0.0 3.0 0.4 3.4 2006 0.2 0.05 0.2 0.5 0.5 1.0 2007 0.1 0.05 0.1 0.0 0.5 0.5 2008 0.0 0.05 0.0 0.0 0.5 0.5 2009 0.1 0.05 0.1 0.0 0.5 0.5 2010 0.0 0.05 0.1 0.0 0.5 0.5 Total 2005-10 0.1 0.30 0.7 3.5 2.8 6.3 Note: Assumes a uniform net replacement rate of 1.1 per cent for both Western Australia and Australia. The occupational net replacement rates were estimated using the CEET model and are reported in Shah and Burke (2003).
5.3.3 Supply of qualified personnel
Apprenticeships The appropriate training required to practice in the electrical trades is usually undertaken as a traditional apprenticeship as well. The Electrotechnology Industry (UTE) is currently the main Training Package used for training in the electrical trades.24 The adoption of Training Packages has also been gradual in this industry.
Table 24 shows that in-training numbers in the electrical trades in Australia have steadily increased from 13,900 to 16,800 between 1997 and 2001. In Western Australia the numbers have varied in a narrow range between 1400 and 1500.
Commencement numbers show, in general, similar patterns to in-training numbers. Until 2003, commencements in Western Australia averaged around 400 year but in 2004 they jumped to 600. A large rise in commencements is also recorded in this year at the national level.
The average apparent completion rate for apprentices in the electrical trades is estimated to be 66 per cent in Australia while in Western Australia the rate is estimated to be an impressive 91 per cent.
If these completion rates were to apply in the future, then apprenticeship completions in the electrical trades can be expected to be 1,500 in Western Australia in the four years to 2008. In the same period completions at the national level can be expected to be 14,100.
24 Telecommunications (ICT) and Electricity Supply Industry – Transmission and Distribution (UTT) are other packages used but their use is small compared to the Electrotechnology (UTE) package.
50
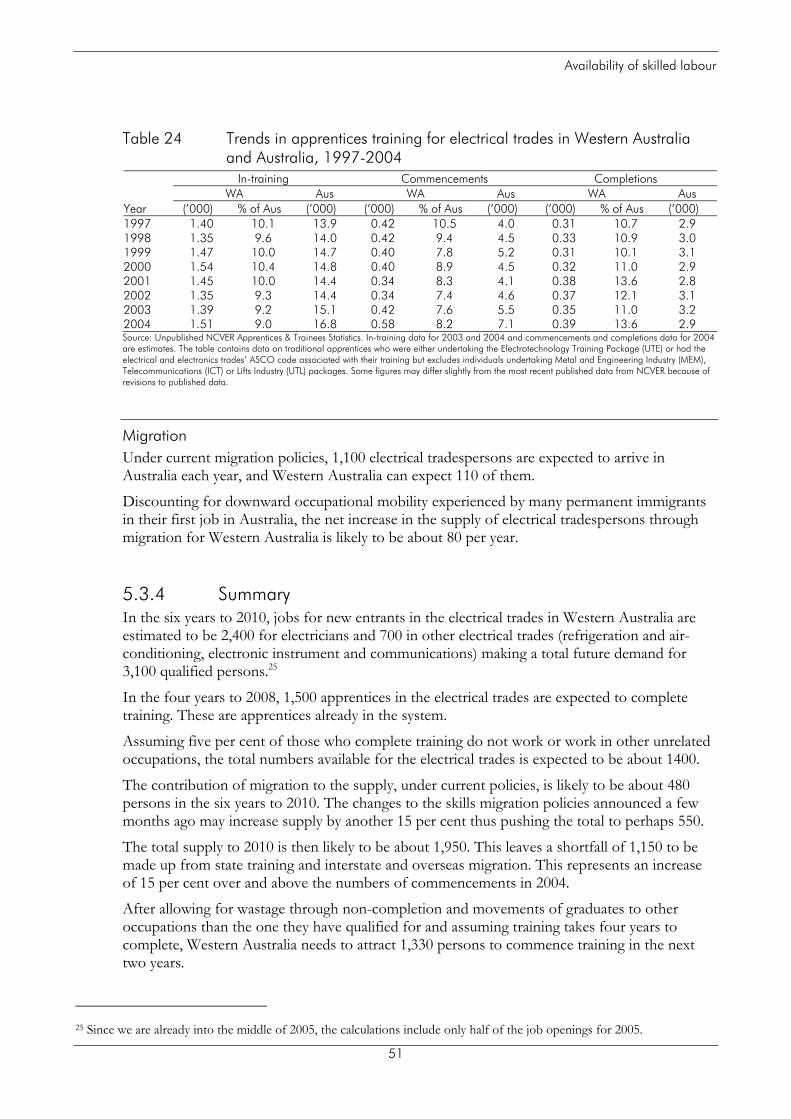
Availability of skilled labour
Table 24 Trends in apprentices training for electrical trades in Western Australia and Australia, 1997-2004
In-training Commencements Completions WA Aus WA Aus WA Aus Year (’000) % of Aus (’000) (’000) % of Aus (’000) (’000) % of Aus (’000) 1997 1.40 10.1 13.9 0.42 10.5 4.0 0.31 10.7 2.9 1998 1.35 9.6 14.0 0.42 9.4 4.5 0.33 10.9 3.0 1999 1.47 10.0 14.7 0.40 7.8 5.2 0.31 10.1 3.1 2000 1.54 10.4 14.8 0.40 8.9 4.5 0.32 11.0 2.9 2001 1.45 10.0 14.4 0.34 8.3 4.1 0.38 13.6 2.8 2002 1.35 9.3 14.4 0.34 7.4 4.6 0.37 12.1 3.1 2003 1.39 9.2 15.1 0.42 7.6 5.5 0.35 11.0 3.2 2004 1.51 9.0 16.8 0.58 8.2 7.1 0.39 13.6 2.9 Source: Unpublished NCVER Apprentices & Trainees Statistics. In-training data for 2003 and 2004 and commencements and completions data for 2004 are estimates. The table contains data on traditional apprentices who were either undertaking the Electrotechnology Training Package (UTE) or had the electrical and electronics trades’ ASCO code associated with their training but excludes individuals undertaking Metal and Engineering Industry (MEM), Telecommunications (ICT) or Lifts Industry (UTL) packages. Some figures may differ slightly from the most recent published data from NCVER because of revisions to published data.
Migration Under current migration policies, 1,100 electrical tradespersons are expected to arrive in Australia each year, and Western Australia can expect 110 of them.
Discounting for downward occupational mobility experienced by many permanent immigrants in their first job in Australia, the net increase in the supply of electrical tradespersons through migration for Western Australia is likely to be about 80 per year.
5.3.4 Summary In the six years to 2010, jobs for new entrants in the electrical trades in Western Australia are estimated to be 2,400 for electricians and 700 in other electrical trades (refrigeration and air-conditioning, electronic instrument and communications) making a total future demand for 3,100 qualified persons.25
In the four years to 2008, 1,500 apprentices in the electrical trades are expected to complete training. These are apprentices already in the system.
Assuming five per cent of those who complete training do not work or work in other unrelated occupations, the total numbers available for the electrical trades is expected to be about 1400.
The contribution of migration to the supply, under current policies, is likely to be about 480 persons in the six years to 2010. The changes to the skills migration policies announced a few months ago may increase supply by another 15 per cent thus pushing the total to perhaps 550.
The total supply to 2010 is then likely to be about 1,950. This leaves a shortfall of 1,150 to be made up from state training and interstate and overseas migration. This represents an increase of 15 per cent over and above the numbers of commencements in 2004.
After allowing for wastage through non-completion and movements of graduates to other occupations than the one they have qualified for and assuming training takes four years to complete, Western Australia needs to attract 1,330 persons to commence training in the next two years.
25 Since we are already into the middle of 2005, the calculations include only half of the job openings for 2005.
51

Availability of skilled labour
Two approaches to meeting demand would be either to boost current training effort substantially or to maintain current effort and make up the difference through interstate recruitment and/or attract a larger share of international migrants to Australia to the state.
5.4 Construction sub-trades The occupational groups in the construction sub-trades of particular interest for this project are:
• mobile plant operators;
• crane, hoist or lift operator; and
• structural steel construction workers.
Within these occupational groups are included the occupations of scaffolder, rigger and general construction plant operator among others. The training required for occupations within each of the above groups is similar and if one has training to practise in one occupation then to practise in another in the same group is a matter of just a little additional training if that.
Individually the above occupational groups are relatively small in terms of the numbers of persons employed in them. For the purposes of this study the three groups are combined under the ‘construction sub-trades’ label.
Employment trends and projections In 2001, of the total number of persons employed in the construction sub-trades 67 per cent were mobile plant operators, 15 per cent were crane, hoist or lift operator and 18 per cent structural steel construction workers. In Western Australia the percentage for mobile plant operators was a little lower and for the other two occupations it was a little higher (Table 25).
Table 25 Employment in construction sub-trades in Western Australia and Australia, Census 2001
WA Australia
ASCO code Occupation description Number % of Australia Number % of unit group 7111 Mobile construction plant operator 4,518 13 35,068 100
7111-11 Gen. construction plant operator 1,010 13 7,894 23 7111-13 Bulldozer operator 332 13 2,471 7 7111-15 Backhoe operator 160 5 2,905 8 7111-17 Loader operator 1,422 18 8,043 23 7111-19 Grader operator 610 19 3,238 9 7111-21 Excavator operator 411 7 6,131 17 7111-23 Paving plant operator 462 13 3,471 10 7111-25 Road roller operator 111 12 915 3
7122 Crane hoist or lift operator 1,257 16 7,760 100 7122-11 Crane hoist or lift operator 1,257 16 7,760 100
7913 Structural steel construction 1,549 16 9,551 100 7913-11 Scaffolder 614 21 2,877 30 7913-13 Steel fixer 211 11 2,002 21 7913-15 Structural steel erector 51 16 318 3 7913-17 Construction rigger 674 15 4,354 46
Source: Unpublished ABS Census 2001.
Figure 27 shows an increasing underlying trend in the employment of construction sub-trade workers in Australia over last seven to eight years. Surprisingly a similar trend is not evident in
52

Availability of skilled labour
the employment series for Western Australia where the total numbers employed has fluctuated substantially over time around an average of about 11,000 (Figure 28).
The national total demand for labour in the construction sub-trades, based on historical trend in employment, is expected to increase steadily to about 91,000 by 2010 while in Western Australia it is expected to be constant around 11,000 over the forecast period (Table 26).
Figure 27 Historical and projected employment in construction sub-trades (ASCO 7111, 7122, 7913) in Australia
60
65
70
75
80
85
90
95
100
Nov
-97
Nov
-98
Nov
-99
Nov
-00
Nov
-01
Nov
-02
Nov
-03
Nov
-04
Nov
-05
Nov
-06
Nov
-07
Nov
-08
Nov
-09
Nov
-10
Empl
oym
ent
('000
)
H istorical Forecasts
Source: Based on unpublished ABS Labour Force data for every third month from November 1997 to February 2005, (ABS Cat. no. 6203.0).
53

Availability of skilled labour
Figure 28 Historical and projected employment in construction sub-trades (ASCO 7111, 7122, 7913) in Western Australia
8
9
10
11
12
13
14
Nov
-97
Nov
-98
Nov
-99
Nov
-00
Nov
-01
Nov
-02
Nov
-03
Nov
-04
Nov
-05
Nov
-06
Nov
-07
Nov
-08
Nov
-09
Nov
-10
Empl
oym
ent
('000
)
H istorical Forecasts
Source: Based on unpublished ABS Labour Force data for every third month from November 1997 to February 2005, (ABS Cat. no. 6203.0).
Table 26 Historical and projected (2005-2010) employment in constructed sub-trades (ASCO 4312, 4314, 4316) in Western Australia and Australia
Western Australia Australia Year (‘000) % of Australia (‘000) 1998 11.3 16.9 66.9 1999 10.8 15.4 70.4 2000 10.4 14.3 72.9 2001 11.5 16.1 71.5 2002 10.3 14.0 73.5 2003 11.9 15.2 78.6 2004 10.6 13.8 77.2 2005 11.1 9.7 82.1 2006 11.0 10.2 82.9 2007 11.0 10.4 84.9 2008 11.0 10.4 86.9 2009 11.0 10.6 88.8 2010 10.9 10.6 90.8 Source: Based on unpublished ABS Labour Force data for every third month from November 1997 to February 2005, (ABS Cat. no. 6203.0). The forecasts are in italics.
Net entrants and net separations The age profile of construction sub-tradespersons changed little between 1999 and 2004 (Figure 29). The profiles are symmetrical around a median age of between 40-44 years.
Figure 30 shows a clear, well-defined pattern of net entries into and net separations from the construction sub-trades. Entries into the occupations are of younger workers while exits are of older workers. Given that employment is increasing in these occupations, total net separations are out numbered by total net entrants.
54
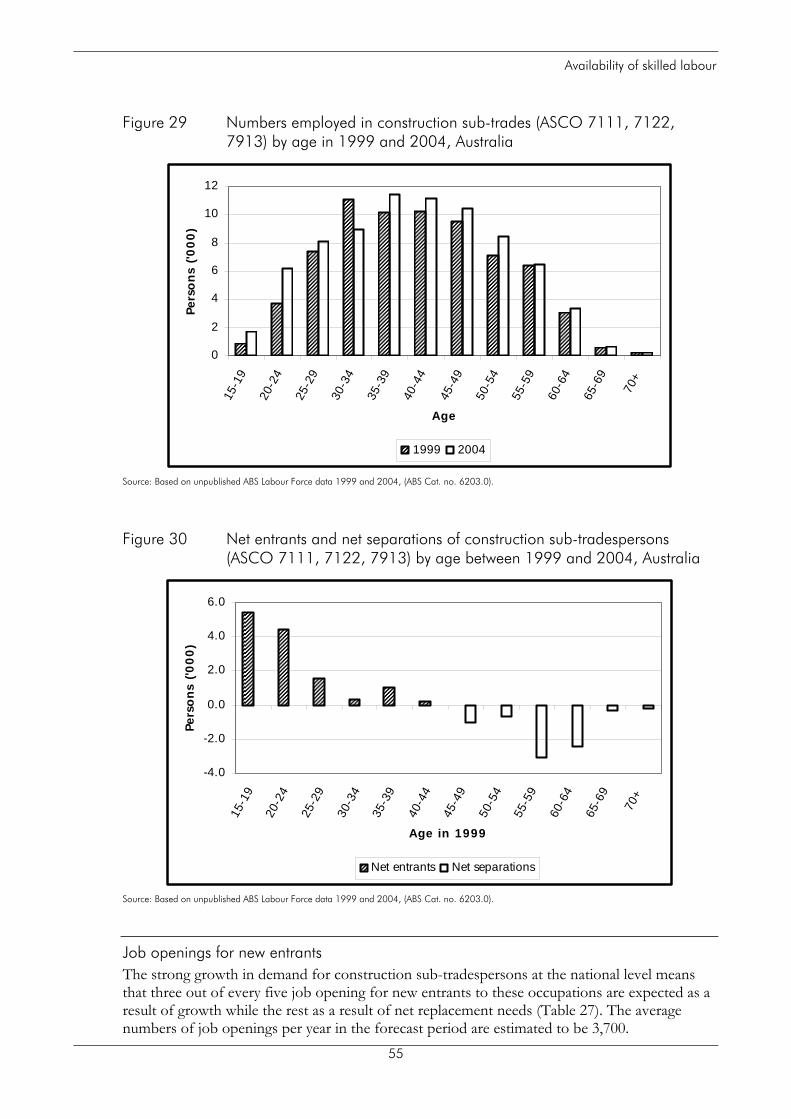
Availability of skilled labour
Figure 29 Numbers employed in construction sub-trades (ASCO 7111, 7122, 7913) by age in 1999 and 2004, Australia
0
2
4
6
8
10
12
15-1
9
20-2
4
25-2
9
30-3
4
35-3
9
40-4
4
45-4
9
50-5
4
55-5
9
60-6
4
65-6
9
70+
Age
Pers
ons
('000
)
1999 2004
Source: Based on unpublished ABS Labour Force data 1999 and 2004, (ABS Cat. no. 6203.0).
Figure 30 Net entrants and net separations of construction sub-tradespersons (ASCO 7111, 7122, 7913) by age between 1999 and 2004, Australia
-4.0
-2.0
0.0
2.0
4.0
6.0
15-1
9
20-2
4
25-2
9
30-3
4
35-3
9
40-4
4
45-4
9
50-5
4
55-5
9
60-6
4
65-6
9
70+
Age in 1999
Pers
ons
('000
)
Net entrants Net separations
Source: Based on unpublished ABS Labour Force data 1999 and 2004, (ABS Cat. no. 6203.0).
Job openings for new entrants The strong growth in demand for construction sub-tradespersons at the national level means that three out of every five job opening for new entrants to these occupations are expected as a result of growth while the rest as a result of net replacement needs (Table 27). The average numbers of job openings per year in the forecast period are estimated to be 3,700.
55

Availability of skilled labour
In contrast, most job openings for new entrants in Western Australia are a result of net replacement. Such job openings are expected to average 270 per annum.
Table 27 Job openings for new entrants in construction sub-trades (ASCO 7111, 7122, 7913) in Western Australia and Australia, (2005-2010) (‘000)
Western Australia Australia
Year Growth Net replacement
needs
Job openings for new entrants Growth
Net replacement needs
Job openings for new entrants
2005 0.5 0.2 0.7 4.9 1.3 6.2 2006 -0.1 0.2 0.2 0.8 1.4 2.2 2007 0.0 0.2 0.2 2.0 1.4 3.4 2008 0.0 0.2 0.2 2.0 1.4 3.4 2009 0.0 0.2 0.2 1.9 1.5 3.4 2010 -0.1 0.2 0.2 2.0 1.5 3.5 Total 2005-10 0.3 1.1 1.6 13.6 8.5 22.1 Note: Assumes a uniform net replacement rate of 1.7 per cent for both Western Australia and Australia. This rate was estimated for mobile construction plant operators, the largest of the three occupations that make up this group. The occupational net replacement rates were estimated using the CEET model and are reported in Shah and Burke (2003).
5.4.2 Supply of qualified personnel Estimating the supply of qualified personnel for the construction sub-trades is much more problematic than for the trade occupations. Apart from a few appropriate modules, including the occupational health and safety module, from an appropriate Training Package, no other training is required to work in some of these occupations. Thus it is not necessary to complete a qualification or a Training Package in order to be work ready.
In a tight labour market, or when there are recruitment difficulties such as for work in remote sites, some employers may privately provide the necessary training to those who are unskilled but available for work. Some workers pay for the training themselves. Anecdotal evidence suggests the training provided is often very specific for the job and may last for just a few days. In some instances the training is mandated by on-site unions.
Table 10 in section 5.1 suggests the appropriate training for the construction sub-trades is via one of three Training Packages: Civil Construction (BCC), General Construction (BCG) or Metal and Engineering Industry (MEM).
Data from the Australian VET Statistics: Apprentices and Trainees database suggest that apprenticeships are non-existent in the construction sub-trades and in Western Australia and even traineeships are rare.
The identification of all individuals who are undertaking one of the above three packages and who are not apprentices is difficult as these individuals can be in either or both national collections or be not included at all. Furthermore, there is no flag in the National VET Collection to indicate if a person included there has also been included in the Australian VET Statistics: Apprentices and Trainees database.26 In Western Australia almost all apprentices and about 70 per cent of all trainees are included in both databases.27
For the purposes of this study we wish to estimate the total number of persons undertaking one of the three Training Packages at certificate I-IV level and who are not doing an apprenticeship.
26 Attempts to have this flag included in the collections commenced in 2003 but as at present it is not considered to provide reliable statistics. 27 This is a ‘guesstimate’ of officers of the Department of Education and Training, Western Australia.
56

Availability of skilled labour
We use the following formula to estimate this number:
3.0×+− zyx
where is the number of persons in the National VET Collection doing one of the three packages at certificate I-IV; and and are the numbers of ‘traditional’ apprentices and trainees, respectively, in the Australian VET Statistics: Apprentices and Trainees database and who are also doing one of the three packages.
xy z
Finally, this number is adjusted up by 10 per cent to account for the fact that some training in this area is privately funded and not captured in any of the publicly available statistics.
Table 28 shows the estimates of the numbers in-training in a given year.28 It shows that training in this area in Western Australia has been well above the national average in the three years to 2003. The low enrolments in 2000 may be a reflection of the slow uptake of Training Packages to deliver this type of training in the state.
However it must be emphasised that only a fraction of the people undertaking the training intend to work in the construction sub-trades. Many of them are undertaking the training to work in one of the many other occupations for which such training is also suitable.
Table 28 Estimated enrolments at certificates I-IV in Civil Construction (BCC), General Construction (BCG) or Metal and Engineering Industry (MEM) Training Packages in Western Australia and Australia, 2001-2004
Western Australia Australia Year (’000) % of Aus (’000) 2000 0.7 5.5 13.5 2001 3.9 14.4 26.9 2002 5.5 17.0 32.1 2003 5.6 17.9 31.3 Source: Based on data from the National VET Provider Collection and the Australian VET Statistics: Apprentices and Trainees, NCVER.
Migration Overseas migration is an insignificant contributor to the supply of labour in the construction sub-trades.
5.4.3 Summary In the six years to 2010, a total of 1,400 jobs for new entrants in the construction sub-trades are estimated to be available in Western Australia. They comprise 900 jobs for mobile plant operators, 200 for crane, hoist and lift operators and 200 for scaffolders, riggers and steel fixers.29
In 2003, the number of people undertaking non-apprenticeship based training in Western Australia using one of the three Training Packages—Civil Construction (BCC), General Construction (BCG) or Metal and Engineering Industry (MEM)—was estimated to be 5,600.
All these people have some or all the skills necessary to work in the construction sub-trades. If any of them lack the skills necessary to work in a particular situation then only a small amount of training will be needed to get them job-ready.
28 The data on completions in the National VET Provider Collection are unreliable. 29 Since we are already into the middle of 2005, the calculations include only half of the job openings for 2005.
57

Availability of skilled labour
However the resources sector has to compete with the other sectors for these personnel. This is because the nature of the training received by the group is transferable across a large number of other occupations and industry sectors.
Without extensive and more detailed data, it is difficult to ascertain what should be the optimum number of persons who should be trained to ensure adequate supply for the construction sub-trades. Since the training required can be delivered in a relatively short period, the bottleneck, if there is a shortage of labour, is more likely to be the number of persons available for work.
The contribution of migration to the supply, under current policies, is likely to be insignificant but given that many migrants to Australia experience downward occupational mobility on arrival, with appropriate recruitment strategies, some could be attracted to work in these occupations if shortages occur. Interstate migration may be used to boost supply for Western Australia.
58
Availability of skilled labour
6. Concluding remarks
This study has analysed the demand for and supply of labour to 2010 in a selected number of occupations at the trades and sub-trades levels that are of particular concern for some major Western Australian companies in the resources sector. The sector is more prone to experiencing skills shortages and recruitment problems than other sectors because resources projects are often in remote and regional areas of the state.
Companies that participated in the consultations identified skilled labour shortages as an important risk currently affecting project planning. To mange this risk they have implemented strategies to improve efficiency in the use of existing labour and reducing future demand; recruitment and retention; and skill formation.
Analysis of project data showed additional risks of shortages in labour supply due to the nature and scheduling of the projects. Short-term fluctuations in labour demand for projects make it difficult for companies to offer ongoing jobs and maintain a permanent workforce.
The analyses included assessing whether the current pattern of supply from the state training system and migration is going to be sufficient to meet demand resulting from growth and net replacement needs in the selected occupations.
The extent of net separations, particularly among younger aged workers, from some trade occupations should be a concern for industry and governments. Further research is needed to corroborate these initial findings and to also find the causes.
Although commencements of apprenticeships in the mechanical and fabrication and electrical trades have increased substantially in Western Australia in the last few years, they need to increase further to meet projected demand.
The apprenticeship system in Western Australia is relatively quite efficient—apparent apprenticeship completion rates are much higher than the rest of the country. The system can therefore deliver the additional qualified personnel to meet the anticipated demand if capacity is expanded and enough people are attracted to take up training.
The skills pathway to enter the construction sub-trades is not well documented or as clearly defined as for the trades. People working in these occupations often acquire the necessary skills through completing modules of competencies but more often through experience on the job. Completing the modules of competencies is often the requirement for getting the ‘ticket’ to work on a site.
Hence it is difficult to estimate the optimum number of persons who should be trained to ensure adequate supply for the construction sub-trades—the data are not adequate to the task. Since the necessary training can be delivered in a relatively short period, any skills shortage is more likely to reflect the number of persons available for work.
Net migration to Western Australia can contribute towards alleviating some skills shortages. The Australian skills migration programmes are however biased towards immigration of people with higher skills than those at the trade or sub-trade level. Furthermore, getting migrants to work in regional and remote areas, where much of the work is in the resources sector, is a challenge as is that of ensuring migrants’ skills are fully recognised in the Australian labour market.
59

Availability of skilled labour
One way of attracting skilled migrants to the regions in Western Australia is through the State-Specific and Regional Migration Initiatives. Western Australia lags well behind Victoria in successfully attracting skilled migrants under this scheme. Successful strategies in this area are those that have the various levels of government working in partnership with regional employers.
Short-term fluctuations in labour demand for projects make it difficult for companies to offer on-going jobs and maintain a permanent workforce. This however increases the risk of labour shortages. Cooperation between project owners in the scheduling of different phases of projects and in the sharing information on labour supply has the potential to even out demand over time and thus reduce the risk of shortages.
60

Availability of skilled labour
References
ARGUSRESEARCH 2004, Western Australian Development Projects Employment Demand and Predicted Skill Requirements 2003 – 2007, Report for the Department of Education and Training (WA), Perth.
Australian Bureau of Statistics (ABS) 2003, 'Net Overseas Migration: Adjusting for Actual Duration of Stay or Absence', Demography Working Paper 2003/05, ABS, Canberra.
Australian Bureau of Statistics (ABS) 2005a, Australian Demographic Statistics, cat. no. 3101.0, ABS, Canberra.
Australian Bureau of Statistics (ABS) 2005b, Job vacancies, Cat. no. 6354.0, ABS, Canberra. Australian Bureau of Statistics (ABS) 2005c, Labour Force Australia, June 2005, Cat. no. 6202.0, ABS,
Canberra. Australian Bureau of Statistics (ABS) 2005d, Western Ausralian Statistical Indicators, Cat. no. 1367.5, ABS,
Canberra. Burrup Skills Taskforce (Chair N Marlborough) 2003, Emerging Industries on the Burrup: Skills Needs and
Strategies, Report of the Burrup Skills Task Force to the Government of Western Australia, Department of Education and Training, Perth.
Chamber of Commerce and Industry (Western Australia) 2005, Economic Compass, viewed 15 July, <http://www.cciwa.com/default.aspx?MenuID=1357#>.
Department of Employment and Workplace Relations (DEWR) 2004, National Skills Shortage Lists Australia - 2004, DEWR, viewed 14 June 2005, <http://www.workplace.gov.au/NR/rdonlyres/A821DE6D-8708-4E63-BADC-6FBB107A1A83/0/NSSTradesupdateDecember2004V2.pdf>.
Department of Employment and Workplace Relations (DEWR) 2005, Vacancy Report, DEWR, viewed 14 July 2005, <http://www.workplace.gov.au/NR/rdonlyres/E0EDC78C-B7F3-4008-8DBE-027AD36F71BC/0/VRJUNE05v2.pdf>.
Department of Immigration and Multicultural and Indigenous Affairs (DIMIA) 2004, Population flows: immigration aspects (2002-03 edition), DIMIA, Canberra.
Department of Immigration and Multicultural and Indigenous Affairs (DIMIA) 2005, Population flows: immigration aspects (2003-04 edition), DIMIA, Canberra.
Department of Treasury and Finance (WA) 2005, Western Australia Economic Summary, Department of Treasury and Finance (WA),, Perth.
Government of Western Australia 2005, Prospect (June-August 2005), Department of Industry and Resources, viewed 18 July, <http://www.doir.wa.gov.au/documents/investment/ProspectJune2005.pdf>.
Harding, G & Webster, E 2002, The working holiday maker scheme and the Austrlaian labour market, Report to the Department of Employment and Workplace Relations and the Department of Immigration and Multicultural Affairs, Melbourne.
National Centre for Vocational Education Research (NCVER) 2004, Insight, NCVER, viewed 25 July, <http://www.ncver.edu.au/files/insight13.pdf>.
National Centre for Vocational Education Research (NCVER) (in association with the National Institute of Labour Studies (NILS) 2005, Prospecting for skills: the current and future skill needs in the minerals sector, NCVER, Adelaide, SA.
Shah, C & Burke, G 2003, Job turnover: replacement needs and vacancies by occupation, Report to the Department of Employment and Workplace Relations, Canberra.
61

Availability of skilled labour
Shah, C & Burke, G 2005a, Recent skill migration and occupational mobility of immigrants with VET qualifications: Australia, Report to ANTA, Brisbane.
Shah, C & Burke, G 2005b, 'Skills shortages: concepts, measurement and policy repsonses', Australian Bulletin of Labour, vol. 31, 1, pp. 44-71.
62
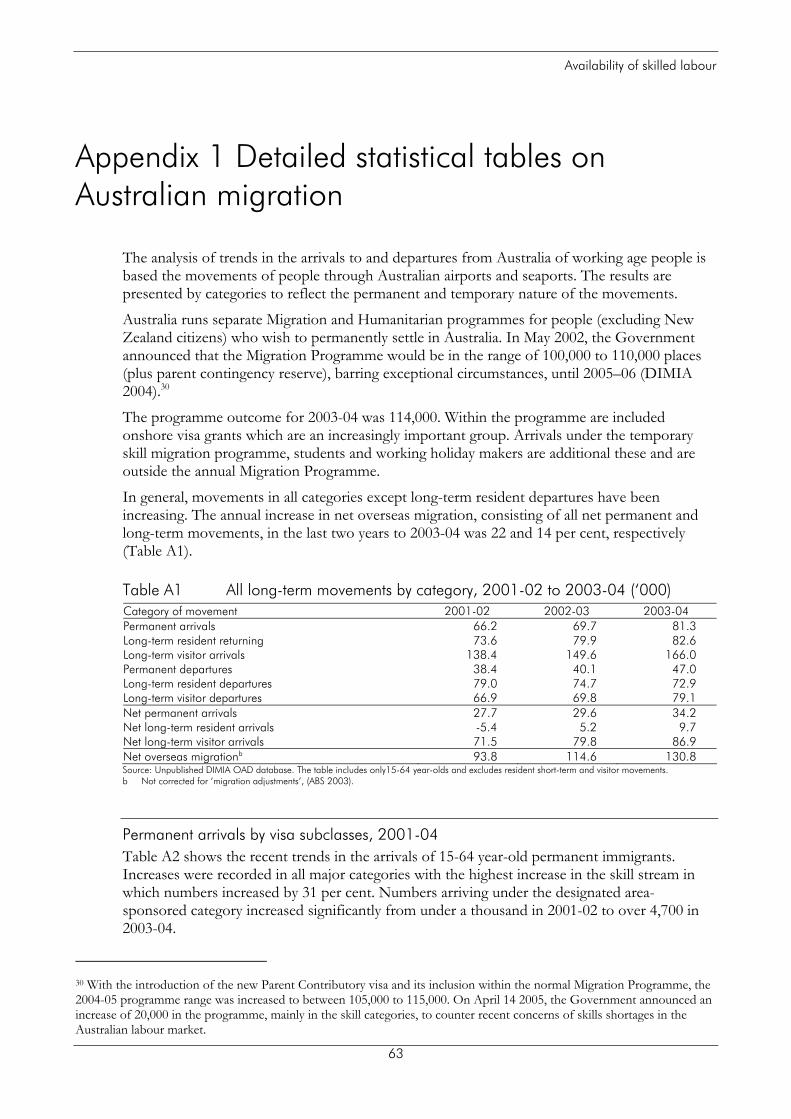
Availability of skilled labour
Appendix 1 Detailed statistical tables on Australian migration
The analysis of trends in the arrivals to and departures from Australia of working age people is based the movements of people through Australian airports and seaports. The results are presented by categories to reflect the permanent and temporary nature of the movements.
Australia runs separate Migration and Humanitarian programmes for people (excluding New Zealand citizens) who wish to permanently settle in Australia. In May 2002, the Government announced that the Migration Programme would be in the range of 100,000 to 110,000 places (plus parent contingency reserve), barring exceptional circumstances, until 2005–06 (DIMIA 2004).30
The programme outcome for 2003-04 was 114,000. Within the programme are included onshore visa grants which are an increasingly important group. Arrivals under the temporary skill migration programme, students and working holiday makers are additional these and are outside the annual Migration Programme.
In general, movements in all categories except long-term resident departures have been increasing. The annual increase in net overseas migration, consisting of all net permanent and long-term movements, in the last two years to 2003-04 was 22 and 14 per cent, respectively (Table A1).
Table A1 All long-term movements by category, 2001-02 to 2003-04 (‘000) Category of movement 2001-02 2002-03 2003-04 Permanent arrivals 66.2 69.7 81.3 Long-term resident returning 73.6 79.9 82.6 Long-term visitor arrivals 138.4 149.6 166.0 Permanent departures 38.4 40.1 47.0 Long-term resident departures 79.0 74.7 72.9 Long-term visitor departures 66.9 69.8 79.1 Net permanent arrivals 27.7 29.6 34.2 Net long-term resident arrivals -5.4 5.2 9.7 Net long-term visitor arrivals 71.5 79.8 86.9 Net overseas migrationb 93.8 114.6 130.8 Source: Unpublished DIMIA OAD database. The table includes only15-64 year-olds and excludes resident short-term and visitor movements. b Not corrected for ‘migration adjustments’, (ABS 2003).
Permanent arrivals by visa subclasses, 2001-04 Table A2 shows the recent trends in the arrivals of 15-64 year-old permanent immigrants. Increases were recorded in all major categories with the highest increase in the skill stream in which numbers increased by 31 per cent. Numbers arriving under the designated area-sponsored category increased significantly from under a thousand in 2001-02 to over 4,700 in 2003-04.
30 With the introduction of the new Parent Contributory visa and its inclusion within the normal Migration Programme, the 2004-05 programme range was increased to between 105,000 to 115,000. On April 14 2005, the Government announced an increase of 20,000 in the programme, mainly in the skill categories, to counter recent concerns of skills shortages in the Australian labour market.
63

Availability of skilled labour
A number of visa categories, which collectively come under the State-Specific and Regional Migration Initiatives, have been introduced that specifically target migration to regional areas. State and Territory governments play a strong role in the nomination process. Visa grants, as opposed to actual arrivals, under these initiatives increased more than three-fold to 12,700 in the three years to 2003-04. Victoria is by far the largest beneficiary of the programme with about half of all visa grants (DIMIA 2005).
The increase in the skills stream, announced by the Government in April 2005, is expected to target immigrants sponsored by employers, states and regions and the additional occupations in MODL.
Table A2 Permanent arrivals by visa category, 2001-04 (‘000)Visa category 2001-02 2002-03 2003-04 Family 19.5 23.7 24.6 Skill stream 26.4 28.2 37.0
Australian-sponsored 3.2 3.1 4.4 Designated area-sponsored 0.9 1.6 4.7 Employer nominated scheme (ENS) 1.2 1.2 1.4
Regional 0.2 0.3 0.4 Labour agreement 0.3 0.2 0.3 Others 0.7 0.7 0.7
Independent 16.4 18.2 22.9 Independent/Distinguished talent 16.3 17.9 22.0 State-nominated 0.1 0.3 0.9
Business 4.7 3.9 3.6 Humanitarian 4.4 6.0 6.2 NZ citizen 15.5 11.6 13.2 Others 0.3 0.3 0.3 All arrivals 66.2 69.7 81.3 Source: Unpublished DIMIA OAD database. The table includes only15-64 year-olds.
Age profiles of permanent arrivals and departures Table A3 shows the age profiles of permanent arrivals and departures. The Australian migration programme, particularly the skill stream, is deliberately biased towards people of prime working age. Overall 47 per cent of arrivals in the skill stream are aged 25-34 years, with the percentage as high as 59 in the Skilled-independent sub-category.
64
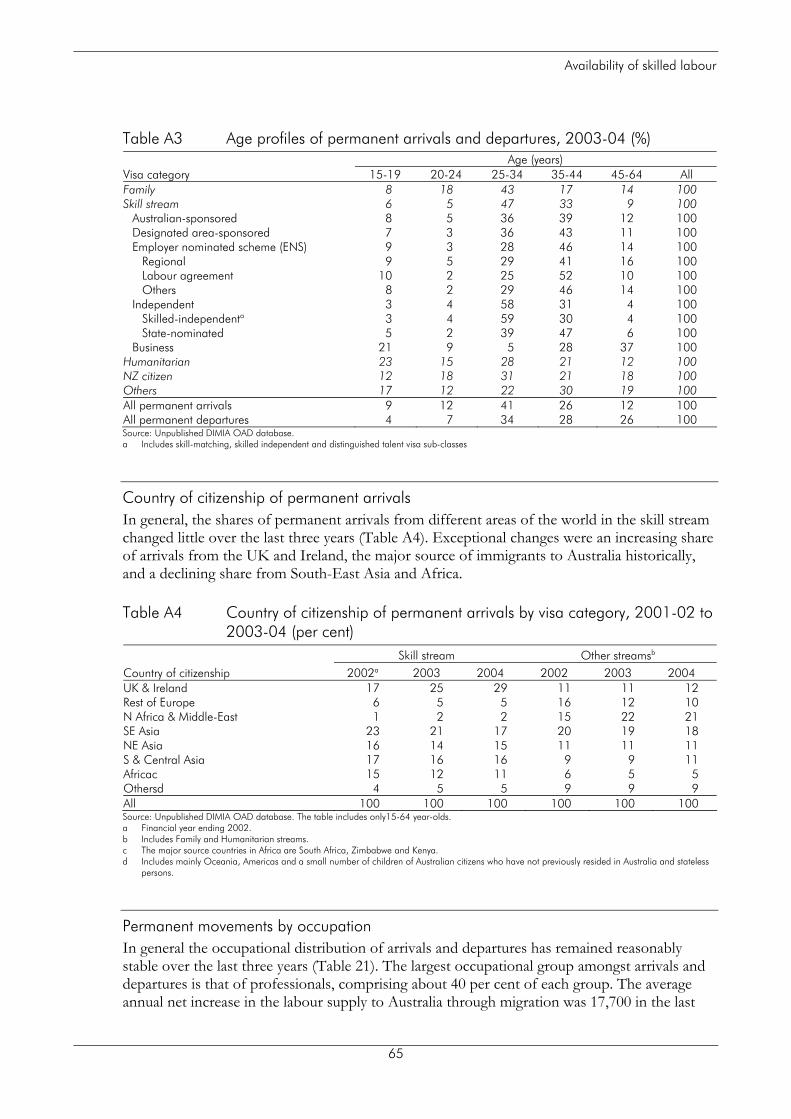
Availability of skilled labour
Table A3 Age profiles of permanent arrivals and departures, 2003-04 (%) Age (years) Visa category 15-19 20-24 25-34 35-44 45-64 All Family 8 18 43 17 14 100 Skill stream 6 5 47 33 9 100
Australian-sponsored 8 5 36 39 12 100 Designated area-sponsored 7 3 36 43 11 100 Employer nominated scheme (ENS) 9 3 28 46 14 100
Regional 9 5 29 41 16 100 Labour agreement 10 2 25 52 10 100 Others 8 2 29 46 14 100
Independent 3 4 58 31 4 100 Skilled-independenta 3 4 59 30 4 100 State-nominated 5 2 39 47 6 100
Business 21 9 5 28 37 100 Humanitarian 23 15 28 21 12 100 NZ citizen 12 18 31 21 18 100 Others 17 12 22 30 19 100 All permanent arrivals 9 12 41 26 12 100 All permanent departures 4 7 34 28 26 100 Source: Unpublished DIMIA OAD database. a Includes skill-matching, skilled independent and distinguished talent visa sub-classes
Country of citizenship of permanent arrivals In general, the shares of permanent arrivals from different areas of the world in the skill stream changed little over the last three years (Table A4). Exceptional changes were an increasing share of arrivals from the UK and Ireland, the major source of immigrants to Australia historically, and a declining share from South-East Asia and Africa.
Table A4 Country of citizenship of permanent arrivals by visa category, 2001-02 to 2003-04 (per cent)
Skill stream Other streamsb
Country of citizenship 2002a 2003 2004 2002 2003 2004 UK & Ireland 17 25 29 11 11 12 Rest of Europe 6 5 5 16 12 10 N Africa & Middle-East 1 2 2 15 22 21 SE Asia 23 21 17 20 19 18 NE Asia 16 14 15 11 11 11 S & Central Asia 17 16 16 9 9 11 Africac 15 12 11 6 5 5 Othersd 4 5 5 9 9 9 All 100 100 100 100 100 100 Source: Unpublished DIMIA OAD database. The table includes only15-64 year-olds. a Financial year ending 2002. b Includes Family and Humanitarian streams. c The major source countries in Africa are South Africa, Zimbabwe and Kenya. d Includes mainly Oceania, Americas and a small number of children of Australian citizens who have not previously resided in Australia and stateless
persons.
Permanent movements by occupation In general the occupational distribution of arrivals and departures has remained reasonably stable over the last three years (Table 21). The largest occupational group amongst arrivals and departures is that of professionals, comprising about 40 per cent of each group. The average annual net increase in the labour supply to Australia through migration was 17,700 in the last
65

Availability of skilled labour
three years. This includes 400 associate professionals and 3,700 tradespersons. The net increase in trade occupations in 2003-04 was 4,700.
Arrivals of tradespersons increased by 53 per cent in the last three years, and even though departures also increased they were by only by half as much. Part of the recent increases may be a response to reports of skills shortages in the trades in Australia. The arrivals of mechanical and fabrication tradespersons increased the most.
Table A5 Permanent movements by occupation, 2001-02 to 2003-04, (‘000) Arrivals Departures Occupation group 2002a 2003 2004 2002 2003 2004 Managers & professionals 24.7 25.5 30.9 17.7 18.5 20.8 Associate professionals 3.1 3.3 4.5 2.9 3.1 3.8
Sci, engineering & related 0.5 0.5 0.6 0.3 0.3 0.3 Other associate prof 2.6 2.8 3.9 2.7 2.8 3.5
Trades 4.7 5.8 7.2 2.0 2.1 2.5 Mechanical & fabrication 0.7 0.9 1.4 0.2 0.2 0.3 Electrical 0.7 0.8 1.1 0.2 0.2 0.2 Construction 1.1 1.2 1.6 0.6 0.7 0.8 Other trades 2.2 2.8 3 1 1.1 1.2
Mobile construction plant ops 0.0 0.0 0.0 0.0 0.0 0.0 Crane, hoist & lift operators 0.0 0.0 0.0 0.0 0.0 0.0 Structural steel construction 0.0 0.0 0.0 0.0 0.0 0.0 Other occupations 8.5 8.5 10.1 7.3 7.5 9.4 Inadequately described 6.0 6.7 7.6 1.9 2.0 2.1 Not in the labour force 19.0 19.9 20.9 6.6 6.8 8.4 All 66.2 69.7 81.3 38.4 40.1 47.0 Source: Unpublished DIMIA OAD database. The table includes only15-64 year-olds. a Financial year ending 2002.
Long-term resident movements by occupation In the last three years a decreasing number of residents have been leaving Australia and an increasing number returning (Table A6). Over this period 9500 more residents returned than departed. While there was a net outflow from Australia of managers and professionals of 8100, there was a net inflow of 2000 associate professionals and 2400 tradespersons (1500 just in construction trades).
66

Availability of skilled labour
Table A6 Long-term resident movements by occupation, 2001-02 to 2003-04, (‘000)
Departures Returns Occupation group 2002a 2003 2004 2002 2003 2004 Managers & professionals 41.1 38.6 37.6 33.5 37.1 38.6 Associate professionals 5.1 4.9 5.1 5.3 5.6 6.2
Sci, engineering & related 0.6 0.6 0.6 0.5 0.6 0.6 Other associate prof 4.5 4.3 4.5 4.7 5.0 5.5
Trades 4.0 3.8 3.8 4.2 4.8 5.0 Mechanical & fabrication 0.4 0.3 0.4 0.4 0.4 0.5 Electrical 0.6 0.5 0.6 0.6 0.7 0.7 Construction 1.2 1.1 1.1 1.4 1.7 1.8 Other trades 1.9 1.8 1.6 1.8 2.0 2.0
Mobile construction plant ops 0.0 0.0 0.0 0.0 0.0 0.0 Crane, hoist & lift operators 0.0 0.0 0.0 0.0 0.0 0.0 Structural steel construction 0.0 0.0 0.0 0.0 0.0 0.0 Other occupations 14.7 13.7 13.8 12.8 13.4 13.9 Inadequately described 2.5 2.6 1.7 5.4 5.7 5.4 Not in the labour force 11.6 11.1 10.9 12.2 13.2 13.4 All 79.0 74.7 72.9 73.6 79.9 82.6 Source: Unpublished DIMIA OAD database. The table includes only15-64 year-olds. a Financial year ending 2002.
Long-term movements of New Zealand citizens by occupation New Zealand citizens have freedom to move to and from Australia without restriction. Although some, as discussed earlier, arrive as permanent residents and are included within permanent settler movements, the vast majority come under the Trans-Tasman Travel Arrangement.
The buoyant New Zealand economy in recent years together with the changes in the social security arrangements has resulted in a drop in the total number of New Zealanders present in Australia. At June 30, 2004 their numbers were 445,000 compared to an average of about 460,000 in the previous three years (DIMIA 2005).
Net inflows of long-term New Zealand citizens to Australia in the three years to 2003-04 were 6100 persons (Table A7). A large majority of them were managers or professionals. Net inflows of tradespersons were negligible.
67
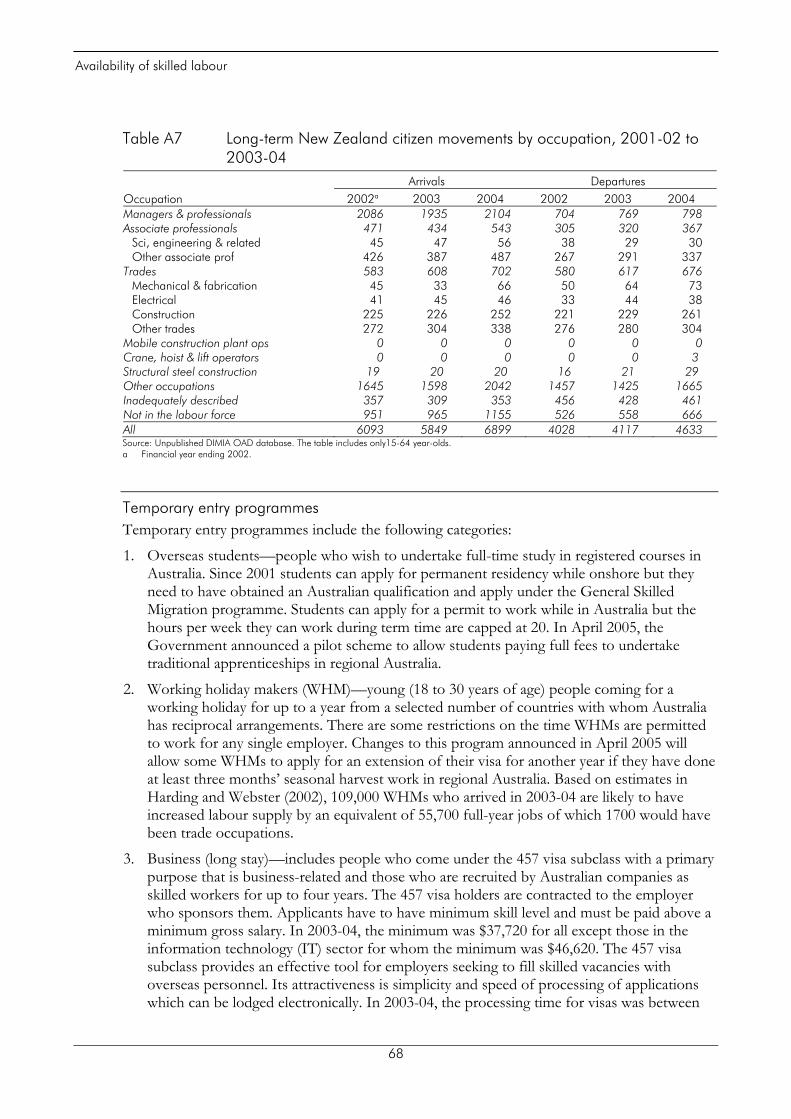
Availability of skilled labour
Table A7 Long-term New Zealand citizen movements by occupation, 2001-02 to 2003-04
Arrivals Departures Occupation 2002a 2003 2004 2002 2003 2004 Managers & professionals 2086 1935 2104 704 769 798 Associate professionals 471 434 543 305 320 367
Sci, engineering & related 45 47 56 38 29 30 Other associate prof 426 387 487 267 291 337
Trades 583 608 702 580 617 676 Mechanical & fabrication 45 33 66 50 64 73 Electrical 41 45 46 33 44 38 Construction 225 226 252 221 229 261 Other trades 272 304 338 276 280 304
Mobile construction plant ops 0 0 0 0 0 0 Crane, hoist & lift operators 0 0 0 0 0 3 Structural steel construction 19 20 20 16 21 29 Other occupations 1645 1598 2042 1457 1425 1665 Inadequately described 357 309 353 456 428 461 Not in the labour force 951 965 1155 526 558 666 All 6093 5849 6899 4028 4117 4633 Source: Unpublished DIMIA OAD database. The table includes only15-64 year-olds. a Financial year ending 2002.
Temporary entry programmes Temporary entry programmes include the following categories:
1. Overseas students—people who wish to undertake full-time study in registered courses in Australia. Since 2001 students can apply for permanent residency while onshore but they need to have obtained an Australian qualification and apply under the General Skilled Migration programme. Students can apply for a permit to work while in Australia but the hours per week they can work during term time are capped at 20. In April 2005, the Government announced a pilot scheme to allow students paying full fees to undertake traditional apprenticeships in regional Australia.
2. Working holiday makers (WHM)—young (18 to 30 years of age) people coming for a working holiday for up to a year from a selected number of countries with whom Australia has reciprocal arrangements. There are some restrictions on the time WHMs are permitted to work for any single employer. Changes to this program announced in April 2005 will allow some WHMs to apply for an extension of their visa for another year if they have done at least three months’ seasonal harvest work in regional Australia. Based on estimates in Harding and Webster (2002), 109,000 WHMs who arrived in 2003-04 are likely to have increased labour supply by an equivalent of 55,700 full-year jobs of which 1700 would have been trade occupations.
3. Business (long stay)—includes people who come under the 457 visa subclass with a primary purpose that is business-related and those who are recruited by Australian companies as skilled workers for up to four years. The 457 visa holders are contracted to the employer who sponsors them. Applicants have to have minimum skill level and must be paid above a minimum gross salary. In 2003-04, the minimum was $37,720 for all except those in the information technology (IT) sector for whom the minimum was $46,620. The 457 visa subclass provides an effective tool for employers seeking to fill skilled vacancies with overseas personnel. Its attractiveness is simplicity and speed of processing of applications which can be lodged electronically. In 2003-04, the processing time for visas was between
68

Availability of skilled labour
29 and 43 days for high risk cases and between 14 and 18 days for low risk cases ( DIMIA 2005).
In terms of immediate addition to labour supply in the selected occupations only the Business (long stay) category is of significance. Hence only data on arrivals in this category are analysed below.
The OAD data are unsuitable for analysing the contribution of 457 visa holders to labour supply because each of them often generates multiple records in a particular year due to frequent short-term movements in and out of Australia. Furthermore, a significant proportion of them are granted visas onshore and hence are not captured in the OAD database.
Stock data on the number of 457 visa holders present in Australia at a particular point in time can however provide an alternative database to study the trends in temporary skilled migration. The stock database is limited though as it does not include information on occupation or qualifications.
Figure A1 shows that the temporary skilled migration scheme expanded rapidly from its inception in 1996 until 2001, which is the time when significant softening in the labour market for ICT personnel occurred. Since then the stock of people under this visa category has remained relatively constant at just under 45,000 persons.
Many 457 visa holders apply for permanent residency while on shore before their temporary visa expires.
Figure A1 Stock of temporary residents on business (long stay) visas in Australia, June 1997 to December 2004
10
20
30
40
50
1997
.219
97.3
1997
.419
98.1
1998
.219
98.3
1998
.419
99.1
1999
.219
99.3
1999
.420
00.1
2000
.220
00.3
2000
.420
01.1
2001
.220
01.3
2001
.420
02.1
2002
.220
02.3
2002
.420
03.1
2003
.220
03.3
2003
.420
04.1
2004
.220
04.3
2004
.4
Quarter
Stoc
k ('0
00)
Source: Unpublished, DIMIA Stock data. The chart includes only those aged over 19 years.
The relative importance of the source countries for temporary skilled migration has shifted over the last seven years (Table A8). The main change is that the UK and Ireland have become even more dominant sources than before. On the other hand the Americas (mainly North America), Japan and South Korea have declined in importance.
69

Availability of skilled labour
Table A8 Country of citizenship of temporary residents on business (long stay) visas in Australia (per cent)
Country of citizenship September, 30 1997 September, 30 2004
UK & Ireland 29 38 Rest of Europe 13 12 NE Asia 23 16 Rest of Asia 8 16 Americas 19 10 Others 7 9 All 100 100 Source: Unpublished, DIMIA Stock data. The table includes only those aged over 19 years.
Almost half of all temporary residents in Australia on September 30, 2004 who were on 457 visa had initially intended to stay in New South Wales (Table A9). Data on where these people were actually working at the time of the stocktake are unavailable.
Table A9 Intended state of residence on arrival of temporary residents on 457 visas in Australia, September, 30 2004, (per cent)
Intended state of residence September, 30 2004
New South Wales 48 Victoria 21 Queensland 11 South Australia 3 Western Australia 9 Tasmania 0 Northern Territory 1 Australian Capital Territory 1 Not stated 7 All 100 Source: Unpublished, DIMIA Stock data. The table includes only those aged over 19 years.
The OAD data can provide some indication of the occupations of 457 visa arrivals, although useful information is limited to those who are long-term arrivals only. As Table A10 shows two out of every three arrivals under this category are either managers or professionals. Persons in trade occupations are a very small proportion of total arrivals but the proportion has been increasing and in 2004 it was 3.6 per cent.
70

Availability of skilled labour
Table A10 Temporary resident arrivals on business (long stay) visas by occupation, 2001-02 to 2003-04, (per cent)
Long-term arrivals Occupation group 2002a 2003 2004 Managers & professionals 64.6 64.1 64.4 Associate professionals 7.0 7.1 7.4
Sci, engineering & related 0.7 0.8 0.8 Other associate prof 6.3 6.2 6.6
Trades 2.4 3.2 3.6 Mechanical & fabrication 0.3 0.5 0.8 Electrical 0.4 0.4 0.3 Construction 0.4 0.5 0.4 Other trades 1.4 1.9 1.9
Mobile construction plant ops 0.0 0.0 0.0 Crane, hoist & lift operators 0.0 0.0 0.0 Structural steel construction 0.0 0.0 0.0 Other occupations 8.5 8.6 9.3 Inadequately described 6.2 5.8 5.0 Not in the labour force 11.4 11.3 10.4 All 100.0 100.0 100.0 All (number) 28,500 28,100 31,400 Source: Unpublished DIMIA OAD database. The table includes only15-64 year-olds. a Financial year ending 2002.
Onshore outcomes The 2003-04 Migration programme included 36,700 persons granted permanent residency on the basis of onshore applications (DIMIA 2005). People making onshore applications could have arrived in Australia under any of a number of temporary resident visa categories, including student and temporary business visas.
Many applicants for onshore visas are already in the workforce at the time of visas are granted. Hence as such they are not new additions to the labour supply.
Comparing pre- and post-migration occupations The Longitudinal Survey of Immigrants to Australia (LSIA) provides information on the labour market experience of permanent immigrants to Australia. Analysis of data from LSIA 2 shows immigrants experience significant downward occupational movement between their pre- and post-migration jobs (Table A12). The table shows that less than half of all immigrants in a
The table shows that less than half the immigrants in any given occupation, except construction and electrical trades, remained in the same occupation in their pre- and post-migration jobs. For example, only 43 per cent of immigrants with a job in mechanical and fabrication trades prior to migration were employed in the same group of trade occupations in their post-migration jobs. Most of the rest were either not in employment (37 per cent) or in lower level occupations (16 per cent). On the other hand, 13 per cent of immigrants changed from an associate professional occupation to a mechanical and fabrication trade.
Research into barriers faced by immigrants in obtaining jobs commensurate with their skills can provide a basis for developing policies and programmes that will help them fully realise their human capital potential. It is also possible that some employer recruiting practices are inadequate in targeting newly arrived immigrants. Finally, there is always the possibility that newly arrived immigrants are discriminated against by some employers.
71

Availability of skilled labour
Table A11 Occupations of pre- and post-migration jobs held by permanent immigrants (per cent)
Post-migration occupation Pre-migration occupation A B C D E F G H I J K All Managers & professionals (A) 43 1 4 0 1 0 0 0 0 16 35 100 Sci, Eng & related assoc. prof. (B) 14 19 0 13 5 0 0 0 0 12 37 100 Other assoc prof. (C) 8 0 20 0 0 1 4 0 0 25 41 100 Mechanical & fab eng trades (D) 0 0 0 43 0 2 1 0 0 16 37 100 Electrical trades (E) 1 2 0 0 54 1 1 0 0 12 29 100 Construction trades (F) 0 0 6 0 0 65 0 0 0 8 21 100 Other trades (G) 3 0 2 1 1 1 23 0 1 27 41 100 Mobile construction plant ops. (H) 0 0 0 0 0 0 0 0 0 95 5 100 Crane, hoist & lift operators (I) 0 0 0 0 0 100 0 0 0 0 0 100 All other occupations (J) 4 0 2 0 0 1 1 0 0 39 52 100 Not employed (K) 5 0 0 0 0 1 0 0 0 11 82 100 All 19 1 4 1 1 2 2 0 0 20 51 100 Source: LSIA, Cohort 2 (arrived in Australia the year ending August 2000), Wave 1. The pre-migration job relates to job held by the principal applicant and migrating unit spouse in the 12 months prior to migration while the post –migration job relates to the main job held at the time of the first interview. Percentages in the table are weighted estimates based on a sample of 4181 individuals. Estimates based on a small number of sample observations may be subject large standard errors.
72