Availability Management Issues - itSMF
48
© 2007 Hewlett-Packard Development Company, L.P. The information contained herein is subject to change without notice Technology for better business outcomes Availability Management Issues Arthur Lampert, Ph.D., CISSP HP Services
Transcript of Availability Management Issues - itSMF

© 2007 Hewlett-Packard Development Company, L.P. The information contained herein is subject to change without notice
Technology for better business outcomes
Availability Management IssuesArthur Lampert, Ph.D., CISSPHP Services

Objectives for this session• During this session you will learn:−Effective approaches for defining service availability−Understanding some availability design issues
September 26, 2008 2

Agenda• The Availability Lifecycle• Defining Service Availability• Designing Services to Meet Availability
Requirements

The availability lifecycle

Service Value comes from …• Service Utility−What does the service do?−Functional requirements−Features, inputs, outputs…− “fit for purpose”
• Service Warranty−How well does the service do it?−Non-functional requirements−Capacity, performance, availability, security,
continuity…− “fit for use”
September 26, 2008 5

Service Warranty and risks
September 26, 2008 6
low
power/ network failure
virus attack
security breach- hacker
natural disaster- fire, flood, adverse weather
man made disaster- terrorism, malicious damage
planned downtime
internal security/fraud
denial of service attack
software failure
application failure
configuration issues
hardware failure
Continuity Security
data corruptioninsufficient capacityCapacity
Availability
highim
pact
highfrequencylow

The ITIL Service Lifecycle
September 26, 2008
ServiceDesign
Service
ITIL
ServiceStrategy
ServiceOperation
ServiceDesign
Continual ServiceImprovement
ServiceTransition
7

The Availability Lifecycle
Monitor, React, Prevent
Manage& SupportRelease
Bui
ld, T
est,
Dep
loy
Changes
Availability Reporting,
Service Failure Analysis
Continual Improvement Process & Feedback Loop
Availability Design
Design for Availability
Design for Recovery
Design for Continuity
People Process Technology
Detect Respond Diagnose Repair Recover Restore
SiteData Service Process
OLA
s &
Und
erpi
nnin
g C
ontra
cts
Inst
rum
enta
tion
and
Tool
s
IT S
ervi
ce M
anag
emen
t Pro
cess
es
Bus
ines
s M
anag
emen
t
Business RequirementsGathering
Document
Availability Targets
Service Levels
Acceptance Criteria
Reporting Metrics
DefineEducate
Negotiate
Key
Bus
ines
s Fu
nctio
ns
Impa
ct o
f Dow
ntim
e
Def
initi
on o
f Ava
ilabi
lity
Transition Continual Improvement
Tran
sitio
n
Ope
ratio
n
Des
ign
Stra
tegy
September 26, 2008 8

Defining Availability

Traditional view of availabilityPercentage Availability Annual Downtime
99% 87.6 hours (3½ days)
99.5% 43.8 hours
99.9% 8.8 hours
99.95% 4.4 hours
99.99% 53 minutes
99.999% 5.3 minutes
September 26, 2008 10

The traditional calculation
• AST = Agreed Service Time• DT = Downtime
%100×−
=AST
DTASTtyAvailabili
September 26, 2008 11
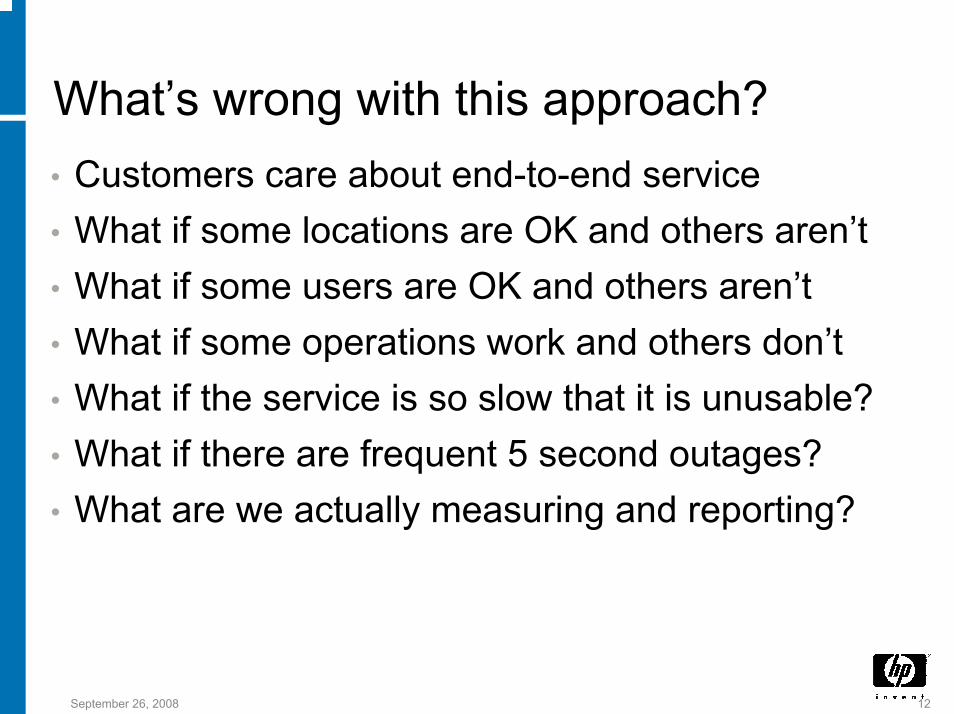
What’s wrong with this approach?• Customers care about end-to-end service• What if some locations are OK and others aren’t• What if some users are OK and others aren’t• What if some operations work and others don’t• What if the service is so slow that it is unusable?• What if there are frequent 5 second outages?• What are we actually measuring and reporting?
September 26, 2008 12

Where to measure availability?
Database Server DesktopNetwork
September 26, 2008 13
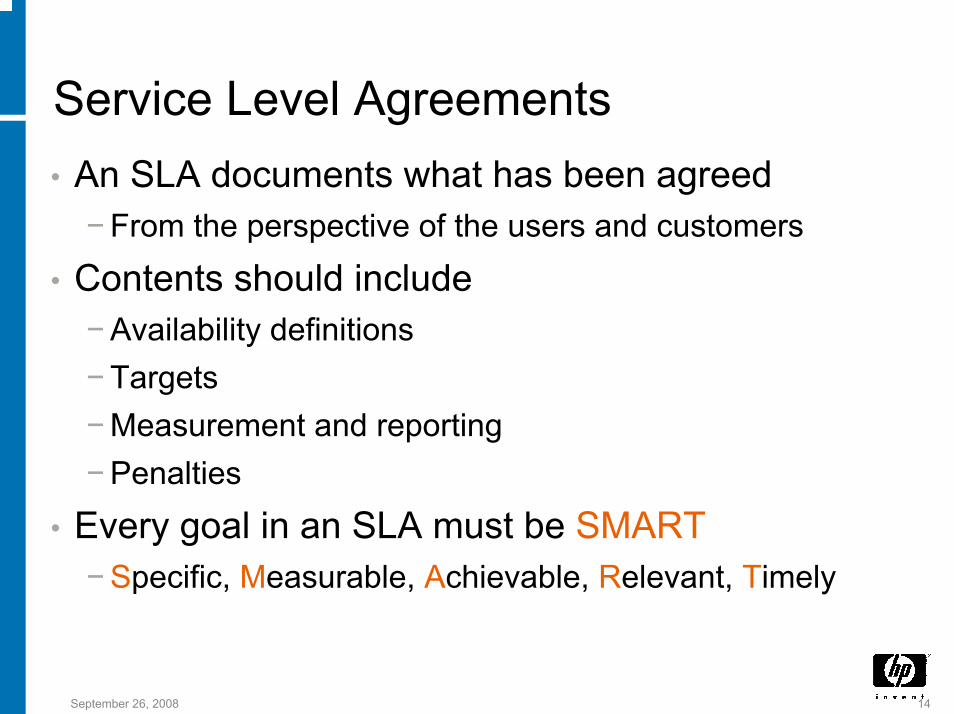
Service Level Agreements• An SLA documents what has been agreed−From the perspective of the users and customers
• Contents should include−Availability definitions−Targets−Measurement and reporting−Penalties
• Every goal in an SLA must be SMART−Specific, Measurable, Achievable, Relevant, Timely
September 26, 2008 14
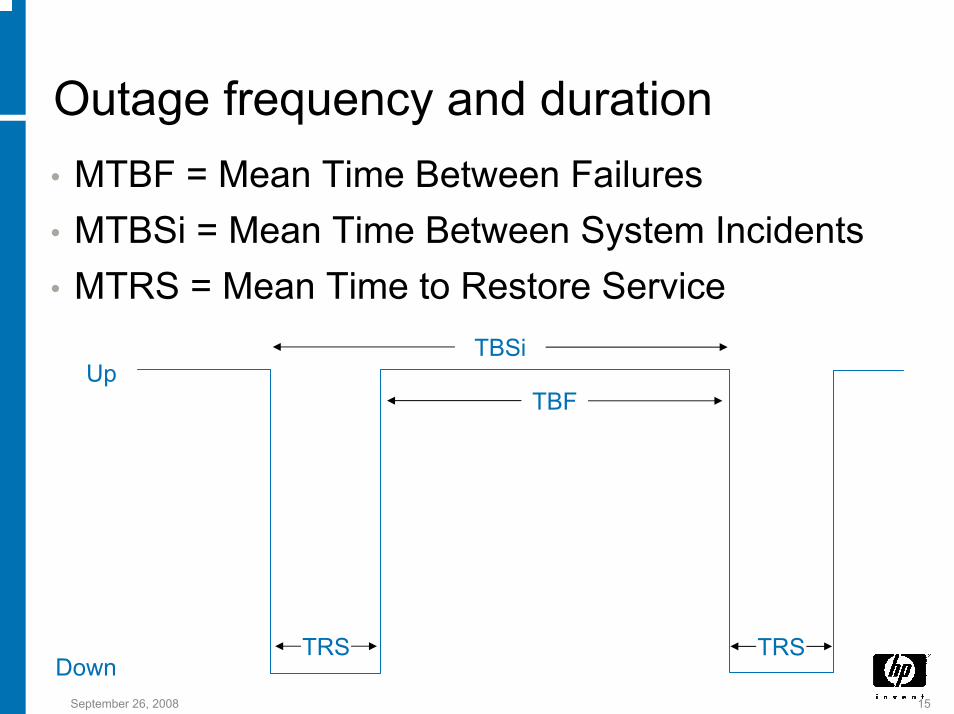
Outage frequency and duration• MTBF = Mean Time Between Failures• MTBSi = Mean Time Between System Incidents• MTRS = Mean Time to Restore Service
Up
DownTRS TRS
TBF
TBSi
September 26, 2008 15

Outage frequency and duration• Which of these is better?
September 26, 2008 16
UpMTBF = 19 days MTTR = 1 day Availability = 95%
Down
MTBF = 22.8 hrs MTTR = 1.2 hrs Availability = 95%
Up
Down

Failover Events• How long does a failover take?−Between cluster members?−When a RAID disk fails?−When a network link fails?
• Does fail over have a business impact?−Do transactions have to be restarted?−What is the longest “short” outage that can be ignored?
• What if the cluster continuously fails over?−What is the maximum frequency of these types of event
September 26, 2008 17

Outage frequency and duration• Agree availability in terms of −Frequency of incidents−Duration of incidents
• Agree failover events which won’t be counted−Frequency−Duration− Impact
September 26, 2008 18

An agreement with the business• Outage duration and frequency must be agreed− In terms that the business understands−With metrics that support the business mission
• What might such an agreement look like?
September 26, 2008 19

Example agreement
Outage duration Maximum frequency
up to 2 minutes 2 events in any hour5 events in any day10 events in any week
2 minutes to 30 minutes
2 events in any week6 events in any quarter
30 minutes to 4 hours 4 events in any year
4 hours to 8 hours 1 event in any year
Maximum Annual Downtime
8 hours + (4 * 4 hours) + (24 * 30 mins) = 36 hours
Availability = (8760 – 36) / 8760 = 99.6%September 26, 2008 20

Number of users affected
September 26, 2008
• Most failures do not cause complete loss of service
• Typical scenario−Some users have no service at all−Other users completely unaffected
• Extreme cases−Only one user is affected−Only one user is able to work!
• Should these count as downtime or not?21
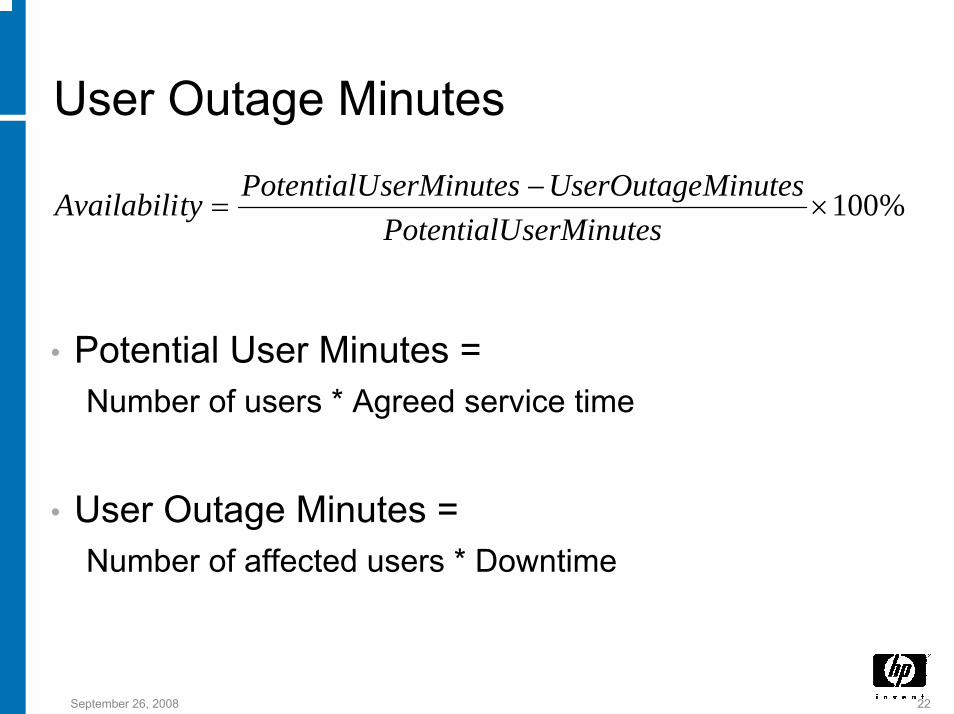
User Outage Minutes
%100×−
=serMinutesPotentialU
MinutesUserOutageserMinutesPotentialUtyAvailabili
• Potential User Minutes = Number of users * Agreed service time
• User Outage Minutes = Number of affected users * Downtime
September 26, 2008 22

Potential User Minutes• Not every minute is equal!
Day and timePotential number of users
Weekly PotentialUserMinutes
Monday – Friday 00:00 – 07:00 500 1,050,000
Monday – Friday 07:00 – 09:00 2,500 1,500,000
Monday – Friday 09:00 – 18:00 5,000 13,500,000
Monday – Friday 18:00 – 21:00 1,000 900,000
Monday – Friday 21:00 – 00:00 500 450,000
Saturday – Sunday 500 1,440,000
Weekly Total 18,840,000
September 26, 2008 23

User Outage Minutes example• Using data from previous slide• There is an outage that loses email service to
500 users for 2 hours on a Monday morning at 10:00
• UserOutageMinutes = 500 * 2 * 60• PotentialUserMinutes for the week = 18,840,000• Availability = 18,840,000 – 60,000 / 18,840,000
99.68%
September 26, 2008 24

What if there aren’t users?• Transaction based
systems
• Manufacturing systems
• etc...
%100×−
=nitsPotentialULostUnitsnitsPotentialUtyAvailabili
−=
onsTTransactiPotentialILostTransaonsTTransactiPotentialItyAvailabili ctions %100×
September 26, 2008 25

Critical business functions• Some failures only affect part of a service−ATMs can dispense money but not print statements −Can browse old emails but can’t send or receive−Reservation system can see bookings but not make
new ones
• It is up to the business to define the relative importance of each type of transaction
• You can use transaction weightings to modify availability figures
September 26, 2008 26

Example transaction weightingsIT function that is not available % service impact
Sending email 100%
Receiving email 100%
Using shared distribution lists to send email 10%
Updating shared distribution lists 5%
Reading public folders 50%
Updating public folders 10%
Accessing shared calendars 30%
Updating shared calendars 10%
Why don’t these add up to 100%?
September 26, 2008 27

What about poor performance?• Most SLAs have performance targets• What if the performance is SO SLOW that the
service can’t be used?−Some SLAs count this as downtime−Others count it separately, with its own penalties−The important thing is to discuss, agree, and document
• IT organisation can only agree performance if customer agrees maximum workload− It is the job of the business to forecast the work, not IT
September 26, 2008 28

Example performance agreement
IT function Required response time (when service is available)
Login 99% within 5 seconds99.9% within 15 seconds
Seat availability check 95% within 10 seconds99% within 30 seconds
Seat booking 99% within 40 seconds100% within 60 seconds
Check in 95% within 20 seconds100% within 60 seconds
September 26, 2008 29

Planned downtime• What effect does a planned outage have on
availability?
• AST = Agreed Service Time
• If the planned outage is not in a service window then it does not impact availability−Some SLAs specify when maintenance will happen−Some SLAs allow additional planned downtime with
sufficient notice
September 26, 2008 30

Measurement Period• Remember that Availability is defined as
• AST = Agreed Service Time• DT = Downtime
• What time period should we use for the agreed service time?
%100×−
=AST
DTASTtyAvailabili
September 26, 2008 31
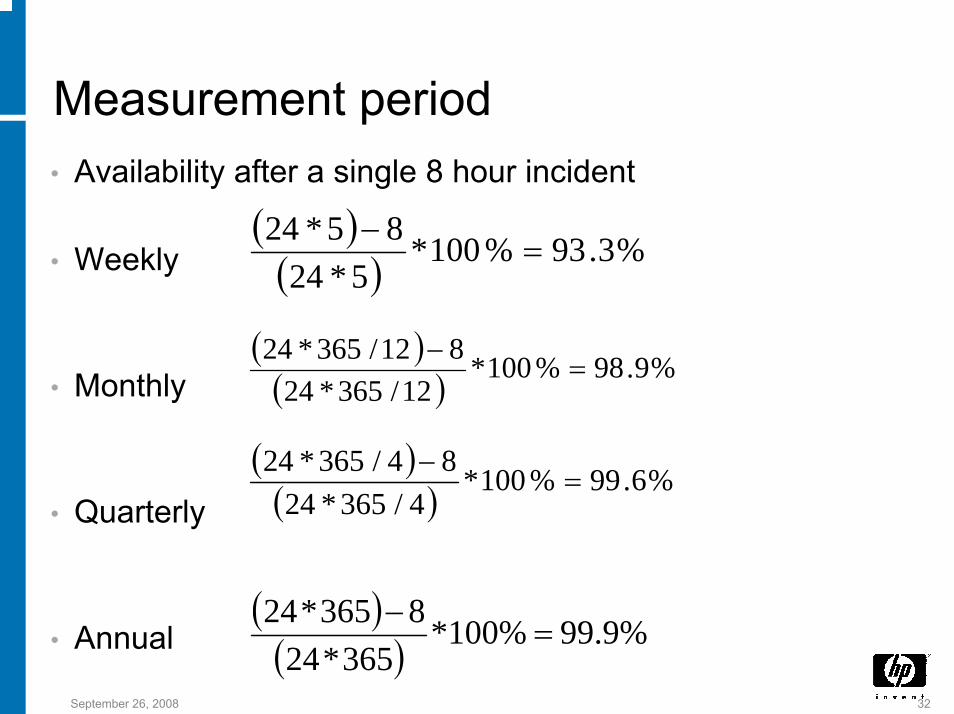
Measurement period• Availability after a single 8 hour incident
• Weekly
• Monthly
• Quarterly
• Annual
( )( ) %3.93%100*
5*2485*24
=−
( )( ) %9.98%100*
12/365*24812/365*24
=−
( )( ) %6.99%100*
4/365*2484/365*24
=−
( )( ) %9.99%100*
365*248365*24
=−
September 26, 2008 32

Measuring Availability• You have a good definition of Availability− It is specific about what will be delivered− It is achievable− It is relevant to the service you deliver− It is defined over a clear time period
• So what have we forgotten?−A definition is of no use at all if you can’t measure it
September 26, 2008 33

How can you measure availability?• Service Desk Records−Fairly easy to implement, inexpensive−Can lead to disputes about accuracy of data
• Instrument all components and calculate−Difficult to implement, expensive−May fail to detect complex or subtle failures
• Use dummy transactions / clients to simulate−Actually measures end-to-end availability−May miss complex or subtle failures
September 26, 2008 34
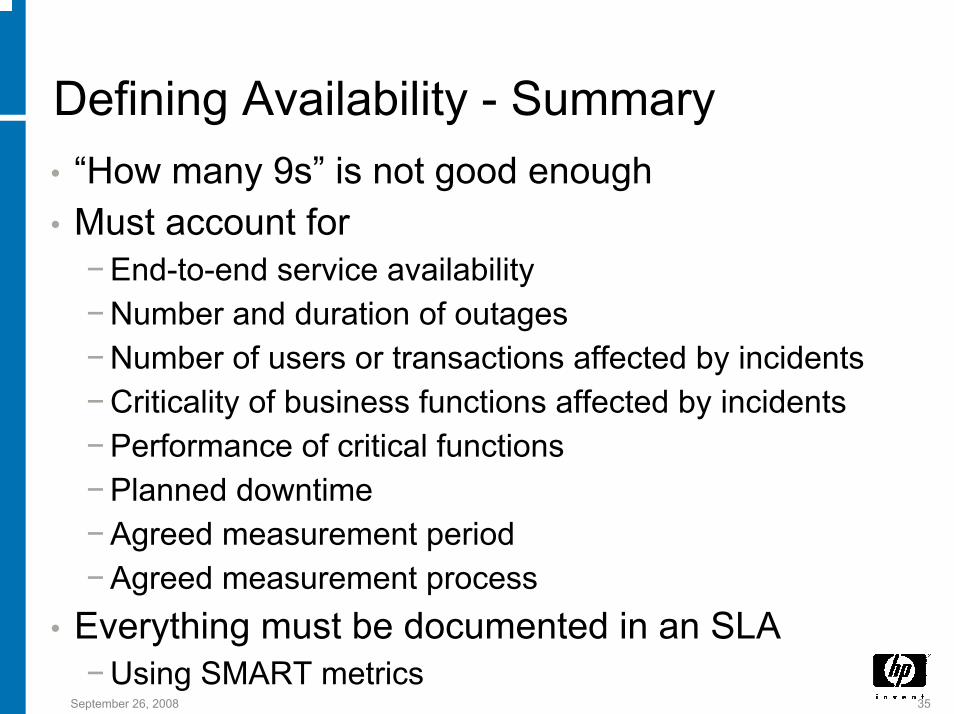
Defining Availability - Summary• “How many 9s” is not good enough• Must account for−End-to-end service availability−Number and duration of outages−Number of users or transactions affected by incidents−Criticality of business functions affected by incidents−Performance of critical functions−Planned downtime−Agreed measurement period−Agreed measurement process
• Everything must be documented in an SLA−Using SMART metrics
September 26, 2008 35

Designing for availability

The Availability Lifecycle
Monitor, React, Prevent
Manage& SupportRelease
Bui
ld, T
est,
Dep
loy
Changes
Availability Reporting,
Service Failure Analysis
Continual Improvement Process & Feedback Loop
Availability Design
Design for Availability
Design for Recovery
Design for Continuity
People Process Technology
Detect Respond Diagnose Repair Recover Restore
SiteData Service Process
OLA
s &
Und
erpi
nnin
g C
ontra
cts
Inst
rum
enta
tion
and
Tool
s
IT S
ervi
ce M
anag
emen
t Pro
cess
es
Bus
ines
s M
anag
emen
t
Business RequirementsGathering
Document
Availability Targets
Service Levels
Acceptance Criteria
Reporting Metrics
DefineEducate
Negotiate
Key
Bus
ines
s Fu
nctio
ns
Def
initi
on o
f Ava
ilabi
lity
Impa
ct o
f Dow
ntim
e
September 26, 2008 37
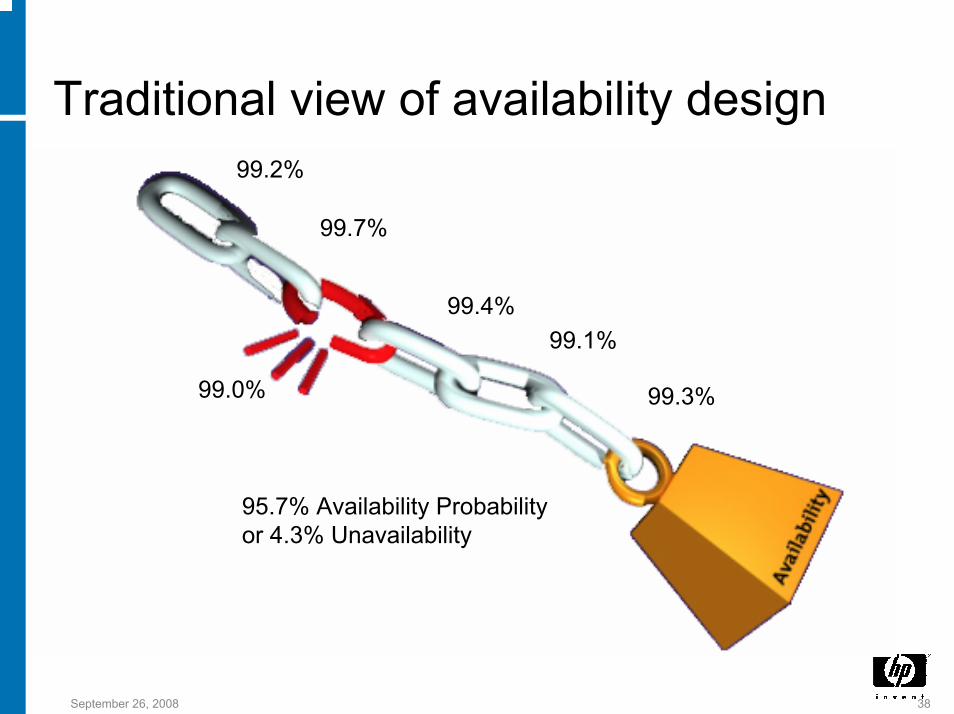
Traditional view of availability design99.2%
99.7%
99.4%99.1%
99.3%99.0%
95.7% Availability Probabilityor 4.3% Unavailability
September 26, 2008 38
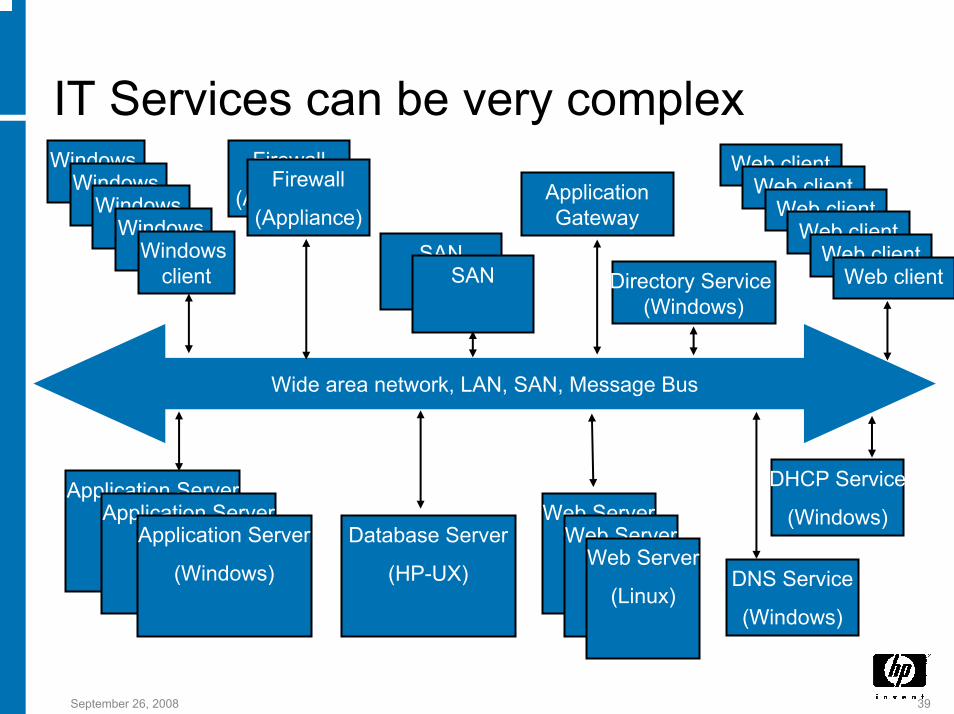
IT Services can be very complex
ApplicationGateway
Web Server
(Linux)
Application Server
(Windows)Application Server
(Windows)Application Server
(Windows)
Database Server
(HP-UX)
Web Server
(Linux)Web Server
(Linux)
DHCP Service
(Windows)
DNS Service
(Windows)
Firewall
(Appliance)Firewall
(Appliance)
SANSAN
Wide area network, LAN, SAN, Message Bus
Directory Service (Windows)
Web clientWeb client
Web clientWeb client
Web clientWeb client
Windows clientWindows
clientWindows clientWindows
clientWindows client
September 26, 2008 39

Modelling and predicting availability• What is the MTBF of a human being?• Availability modelling tools−Can only model and predict technology−Are not good at predicting failover duration and errors−Assume that automation is always perfect
• Most downtime comes from people and process• So how do you design a solution to meet an
availability requirement?
September 26, 2008 40

What is the MTBF of a human being?• Less than 10 years• 10 to 40 years• 40 to 70 years• 70 to 120 years• 120 to 200 years• More than 200 years
September 26, 2008 41

Design the technology• You need to use the right technique for each
component in your solution• Understand contribution of each component to
overall service• Understand the impact of other components• Define component availability requirements
based on service requirements• Identify possible strategies for each component• Think about requirements for maintenance−Planned downtime is still downtime
September 26, 2008 42

What happens when a component failsIncident
StartIncident
End
Uptime
ServiceUnavailable
Downtime
ServiceAvailable
Detect Diagnose Repair Recover Restore
September 26, 2008 43

Instrumentation and tools• Event detection and correlation• Tools to manage blades, virtualisation, SOA…−Consolidate and release changes and patches−Rapidly deploy servers−Automatically redeploy applications to other servers
• All these tools must work together−What happens if you move services to balance power
without thinking about the whole service
• What happens if the management tools go wrong?
• What happens if system managers get it wrong?September 26, 2008 44

People and Process• Skills, roles, and processes must match
technology• Managing virtualised SOA and Blade technology−How do you make sure you can apply the required
updates and patches in a high availability environment?−How do you manage your CMDB?−How much automation of changes can you risk?−How do you manage network and VLANs?
• Imagine a single blade enclosure where every blade supports a different business application−You may never be able to do maintenance− Imagine virtualisation running above the blade layer
September 26, 2008 45
Design the underpinning support• Supporting services need to be appropriate for
each component• Service Level Managers can’t usually negotiate a
separate contract for each service• Use supplier management to ensure you get
what you need for all your services−Continual Improvement as well as good contracts−Differentiated service levels for different components
• Make sure support teams can actually deliver−An OLA is not an alternative to skills, tools and
processesSeptember 26, 2008 46

In conclusion• Define availability targets in a way that:−means something to the business− can be reliably measured and reported
• Design solutions that can meet your targets
September 26, 2008 47