Availability and Reliability of Education Finance Data in...
35
Information Paper No. 43 May 2017 Availability and Reliability of Education Finance Data in Household Surveys
Transcript of Availability and Reliability of Education Finance Data in...
Information Paper No. 43
May 2017
Availability and Reliability of Education Finance Data
in Household Surveys

2
UIS InformationPaper Nº 43 | 2017
Table of contents
1. Introduction ........................................................................................................................................................... 3
2. Data sources .......................................................................................................................................................... 4
3. International frameworks for household expenditure on education data .................................................. 5
4. Characteristics of education expenditure data in household surveys .......................................................... 6
4.1. Availability and comprehensiveness of expenditure data ........................................................................... 6
4.2. Items merged with other items...................................................................................................................... 10
4.3. Level at which the information is collected (household or individual) ..................................................... 12
4.4. Recall period ..................................................................................................................................................... 14
4.5. Availability and characteristics of data on funding sources ....................................................................... 15
5. Can household survey data fill the gaps in UIS educational expenditure data? ............................................ 18
5.1. Availability of expenditure items according to the UOE/NEA classification ............................................. 18
5.2. Current school attendance by household members .................................................................................. 19
5.3. Useful surveys for education expenditure indicator calculation ............................................................... 20
6. Conclusion and recommendations ...................................................................................................................... 23
Annex 1: List of surveys analysed ............................................................................................................................. 27
Annex 2: Availability of expenditure items by region ............................................................................................. 30
Annex 3: Availability of data on funding sources by region .................................................................................. 32
Annex 4: Availability of data on scholarships by region ........................................................................................ 33
Annex 5: List of useful surveys for calculation of household education expenditure indicators .................... 34
References ................................................................................................................................................................... 35
3
UIS Information Paper Nº 43| 2017
1. Introduction
This report examines the availability and reliability of data on household expenditure on education for the
production and analysis of Sustainable Development Goals (SDG) indicator 4.5.4 (education expenditure per
student by level of education and source of funding) and other relevant indicators based on household
expenditure on education.1
The UNESCO Institute for Statistics (UIS) collects information on household expenditure with its Survey of
Formal Education that is sent annually to all UNESCO Member States. The questionnaire on educational
expenditure is designed to gather internationally comparable data for all levels of formal education by
source of funding (government, international, private), destination, and type of expenditure.2 However, few
countries report data on private spending to the UIS.
Gaps in data collected from countries can in theory be filled with information from national household
surveys, but these are primarily tailored to meet national data needs and may apply different methods and
standards. In some cases, differences between national data collections can also be linked to limited
provision of technical assistance to countries and inappropriate methodological decisions. By looking at the
characteristics of education expenditure data gathered in various household surveys and the information
required for producing education finance indicators, this report aims to determine which surveys can be
used to calculate the internationally comparable indicators needed for monitoring of international goals.
This document presents the findings from an analysis of education finance metadata based on information
from household survey questionnaires compiled by the International Household Survey Network (IHSN). The
surveys were screened by the UIS based on a set of minimum criteria and classified according to their degree
of usefulness for the purpose of calculating education expenditure indicators. To be usable for the
calculation of international indicators, a survey should collect data on a minimum set of expenditure items
covering the most important education expenses. This includes tuition fees, other required fees, expenses
for textbooks, expenses for other education materials, and spending for uniforms and other required
clothing. Ideally, the expenses should be collected at the level of individual household members and the
survey must include information on the current level of education of each household member attending
school.
This report comprises six sections, including this introduction. Section 2 summarizes the IHSN dataset used
for the analysis. Section 3 describes the international frameworks on which UIS household education
expenditure data are based. Section 4 highlights the content of the different surveys and discusses the
characteristics of the expenditure data available for analysis and indicator calculation.
1 Accurate information on education expenditure is also needed for the computation of consumption-based poverty and inequality measures and for studies of intra-household resource allocation, but this is not the focus of the present report. 2 The UIS questionnaires, including questionnaire UIS/ED/B on educational expenditure, can be retrieved fromhttp://uis.unesco.org/en/methodology.

4
UIS Information Paper Nº 43| 2017
Section 5 focuses on the minimum requirements for calculation of education expenditure indicators and
assesses the surveys’ degree of usefulness for that purpose. Finally, section 6 concludes the paper with some
recommendations for data collection with future household surveys in order to yield reliable and
internationally comparable data on education finance.
2. Data sources
The analysis in this report is based on a dataset prepared by the International Household Survey Network
(IHSN) as part of its initiatives on food and non-food consumption data assessment. The assessment form
used to compile the data on non-food expenditures and the complete dataset are available at
http://ihsn.org/projects/non-food-assessment.
The IHSN dataset comprises information from 100 nationally representative surveys on household
consumption and expenditures. For this report, the UIS only used data from surveys carried out in
99 UNESCO Member States or Associate Members that are listed in Annex 1. Each country is represented by
a single survey in the IHSN dataset, which covers approximately one half of all developing countries. The
IHSN started the survey assessment in August 2014 with the objective of compiling data from different
countries.The final set of surveys consists of the most recent household expenditure surveys for which
sufficient documentation was available to the IHSN.
Figure 1 shows the regional distribution of the surveys included in the analysis. Sub-Saharan African
countries account for more than one third of the total number of surveys, providing good coverage for the
region (with 40 countries out of 52). The Caucasus and Central Asia and Southern Asia are also well
represented, with respectively seven countries out of eight and eight countries out of nine included. The
other regions have lower coverage, especially Eastern Asia and Western Asia, which have one country out of
six and two countries out of 11, respectively, in the dataset.
Figure 1: Regional distribution of surveys
5
UIS Information Paper Nº 43| 2017
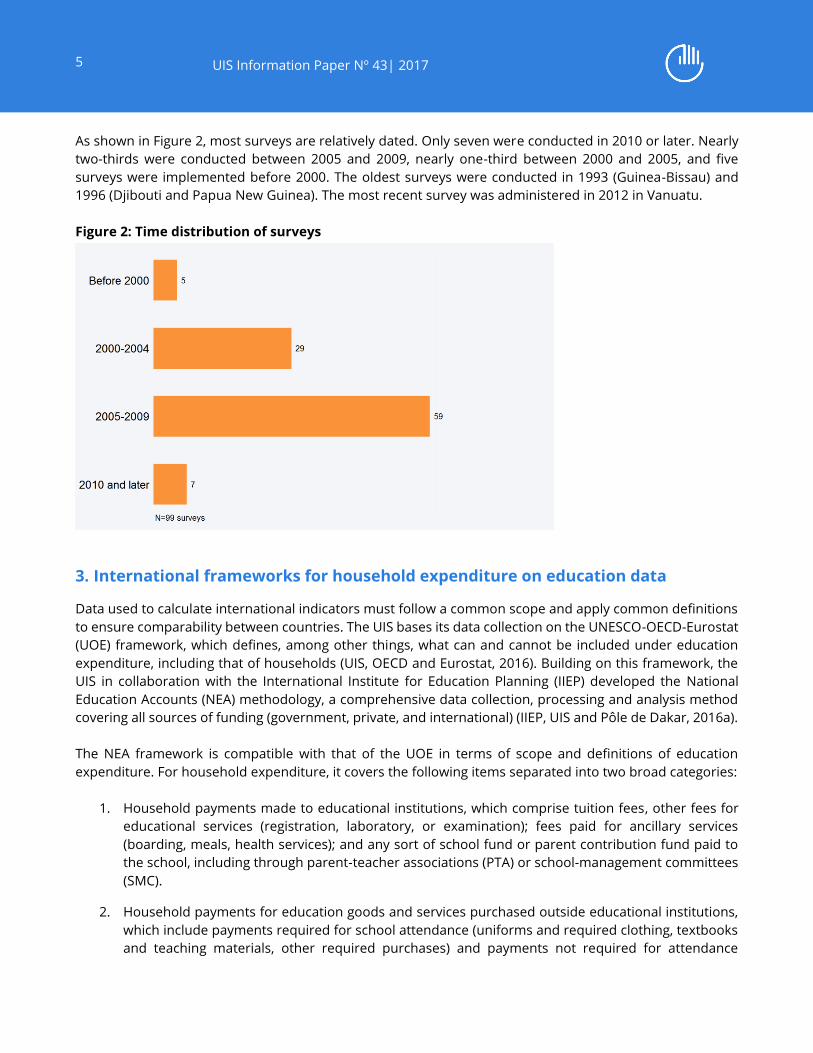
As shown in Figure 2, most surveys are relatively dated. Only seven were conducted in 2010 or later. Nearly
two-thirds were conducted between 2005 and 2009, nearly one-third between 2000 and 2005, and five
surveys were implemented before 2000. The oldest surveys were conducted in 1993 (Guinea-Bissau) and
1996 (Djibouti and Papua New Guinea). The most recent survey was administered in 2012 in Vanuatu.
Figure 2: Time distribution of surveys
3. International frameworks for household expenditure on education data
Data used to calculate international indicators must follow a common scope and apply common definitions
to ensure comparability between countries. The UIS bases its data collection on the UNESCO-OECD-Eurostat
(UOE) framework, which defines, among other things, what can and cannot be included under education
expenditure, including that of households (UIS, OECD and Eurostat, 2016). Building on this framework, the
UIS in collaboration with the International Institute for Education Planning (IIEP) developed the National
Education Accounts (NEA) methodology, a comprehensive data collection, processing and analysis method
covering all sources of funding (government, private, and international) (IIEP, UIS and Pôle de Dakar, 2016a).
The NEA framework is compatible with that of the UOE in terms of scope and definitions of education
expenditure. For household expenditure, it covers the following items separated into two broad categories:
1. Household payments made to educational institutions, which comprise tuition fees, other fees for
educational services (registration, laboratory, or examination); fees paid for ancillary services
(boarding, meals, health services); and any sort of school fund or parent contribution fund paid to
the school, including through parent-teacher associations (PTA) or school-management committees
(SMC).
2. Household payments for education goods and services purchased outside educational institutions,
which include payments required for school attendance (uniforms and required clothing, textbooks
and teaching materials, other required purchases) and payments not required for attendance

6
UIS Information Paper Nº 43| 2017
(private lessons, transportation to and from school, canteen fees where the service is not provided
by educational institutions, and additional books or computer used at home).
Any expenditure that is not related to attending formal education should be excluded, for example
expenditure on music, painting classes, or other extra-curricular activities.
Household surveys do not currently collect data specifically according to this framework, and the coverage
of education expenditure can vary greatly from survey to survey. In some cases, total expenditure may be
incomplete and not reflect the full education cost incurred by households, while in others it may be
overestimated if it includes items, which should not be considered education expenditure.
As they are the existing international frameworks to compare education expenditure between countries, the
UOE and NEA will serve as the basis for the calculation of SDG indicator 4.5.4 and other education finance
indicators. Determining whether or not data from household surveys can be used for these indicators
therefore implies assessing what is collected and how against these frameworks.
4. Characteristics of education expenditure data in household surveys
This section describes the content of the household expenditure surveys included in the IHSN dataset. It
discusses different characteristics of the surveys, which determine their ease of use and reliability for
indicator calculation: the comprehensiveness of the education expenditure items included, the separation
or merging of collected items, the level at which expenditure data are collected, and the recall period used.
It also provides information on the availability of data on funding sources.
4.1. Availability and comprehensiveness of expenditure data
All 99 surveys in the IHSN dataset collected data on household education expenditure. A comprehensive list
of 12 possible expenditure items makes it possible to assess the completeness of the data collection of each
survey. The 12 items are:
Tuition
Other required fees (admission fees, registration fees, examination fees, etc.)
Tutoring/private lessons
Parent association fees
Uniform and other required clothing
Textbooks
Other education materials
School meals/canteen

7
UIS Information Paper Nº 43| 2017
Transportation to and from school
Lodging (boarding) fee
Contribution for construction/maintenance of school facilities
Gifts/unofficial payments
If surveys collected information on expenditures on items not included in the list above, this was captured
in a category called “Other”.
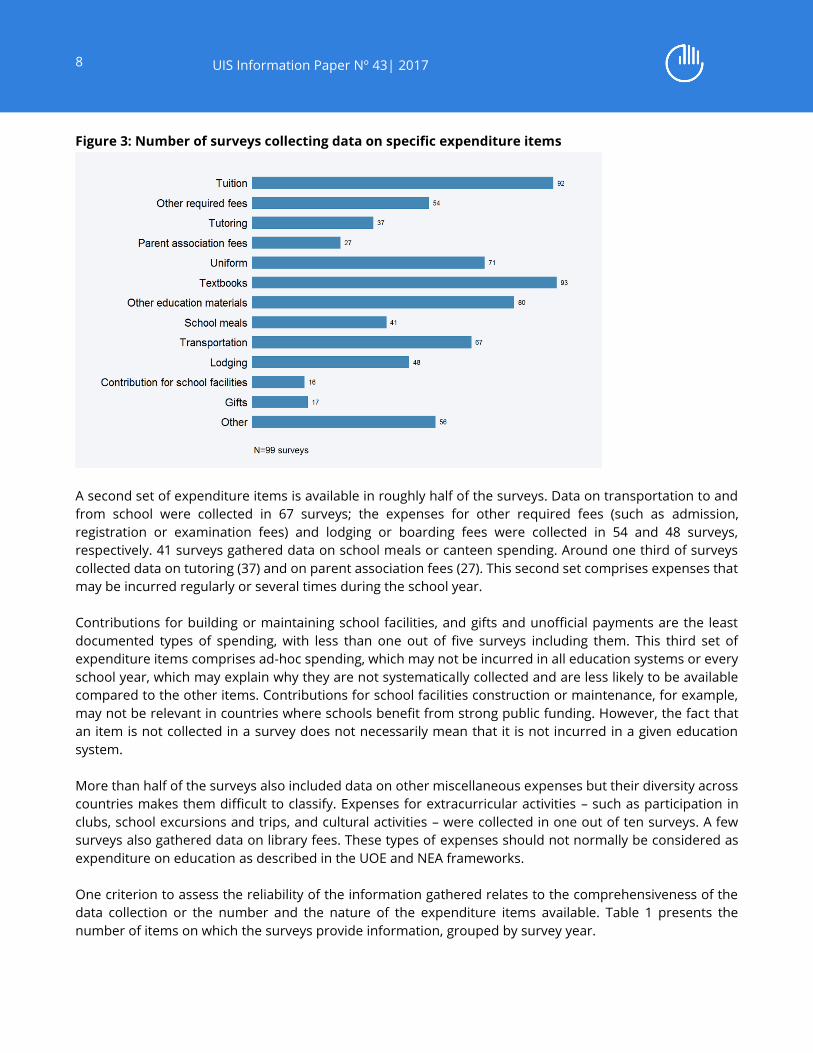
While all surveys addressed the topic, not every national survey collected data on the complete range of
expenditure items. This is an important issue as surveys not including the items required in the UOE and
NEA frameworks may not be useful for production of comparable education expenditure indicators. Figure
3 presents the overall availability of expenditure data in the 99 surveys examined, based on the
comprehensive list of possible expenditure items. Annex 2 provides detail on the availability of each
expenditure item by region.
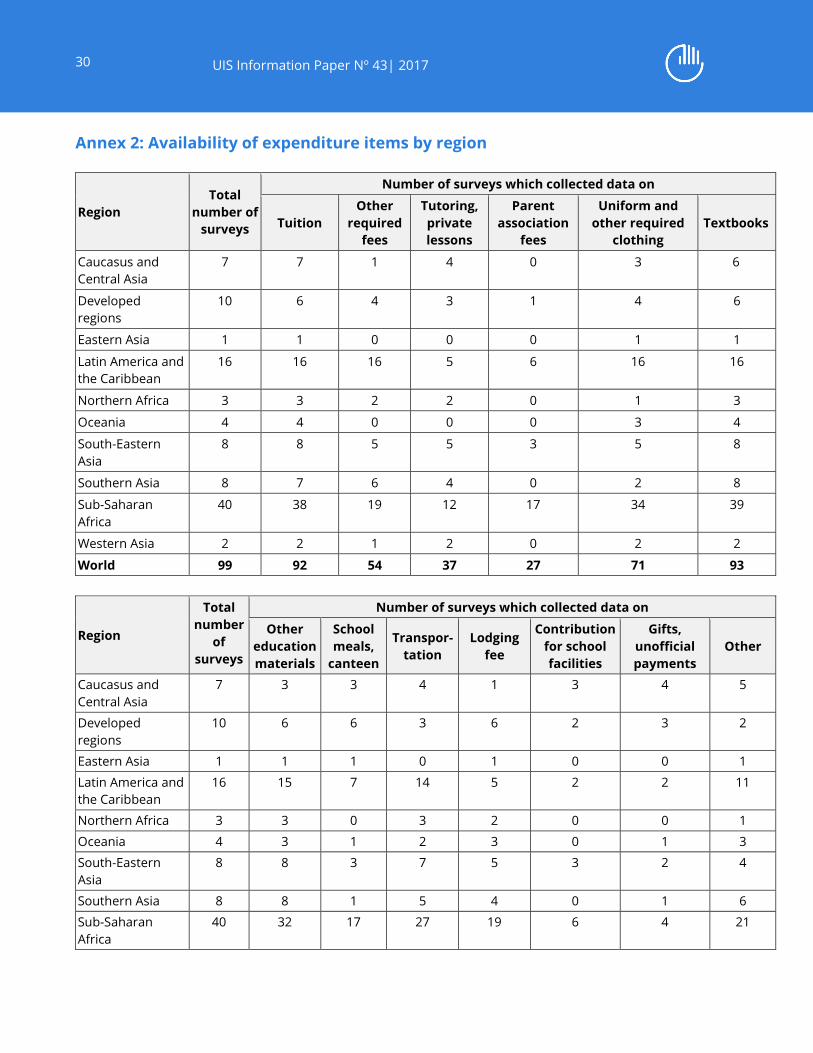
Some spending items are largely available in most surveys: nine out of ten surveys collected data on tuition
and on textbooks, while around eight out of ten collected data on other education materials. Additionally,
amounts spent on uniforms and other required clothing are available in 71 surveys. In surveys with a
reduced scope gathering data on a limited number of items, those frequently collected items are also often
available. Among the 22 surveys with five or fewer expenditure items covered, tuition expenses were
systematically included, while textbook expenses and spending for other education materials were also
commonly collected, in 16 and 11 surveys, respectively. Those widely available items are common expenses
required in most education systems. They usually represent an important and determined amount for the
school year and are generally paid once at the beginning of the academic year (uniform and textbooks) or at
least in a few determined instalments (tuition). These specificities make them staple elements of the
education cost for households that are relatively easy to quantify and remember and therefore to collect.
8
UIS Information Paper Nº 43| 2017
Figure 3: Number of surveys collecting data on specific expenditure items
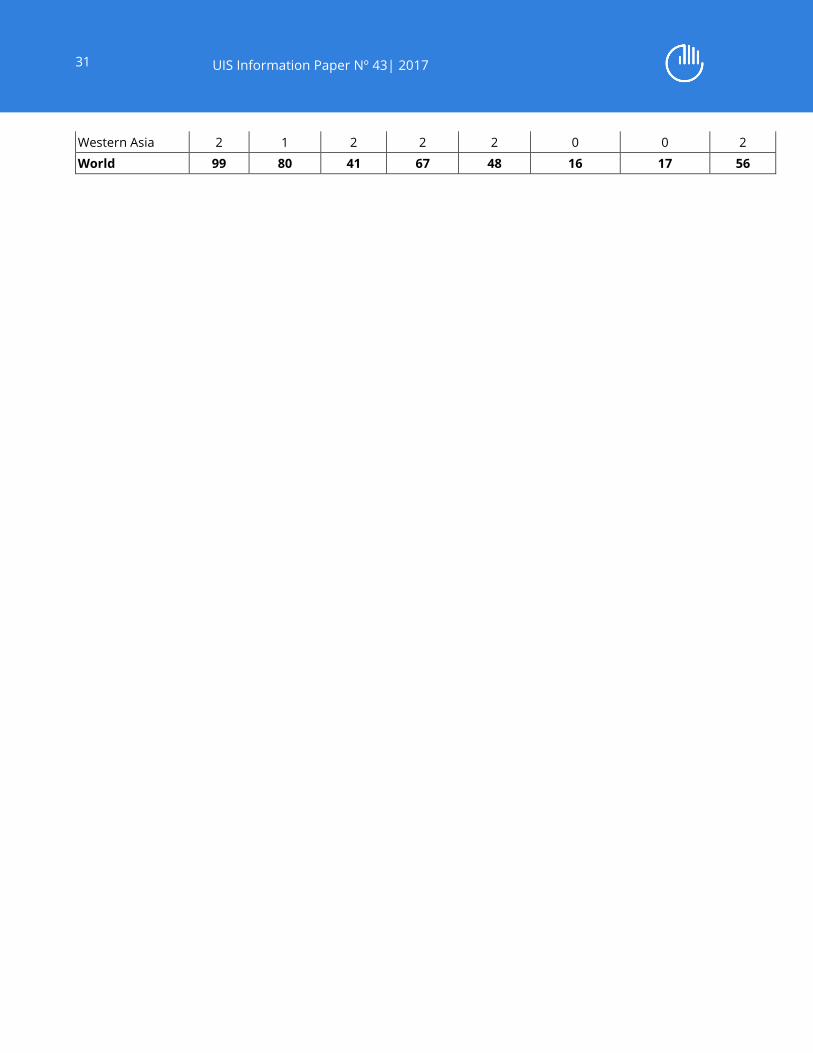
A second set of expenditure items is available in roughly half of the surveys. Data on transportation to and
from school were collected in 67 surveys; the expenses for other required fees (such as admission,
registration or examination fees) and lodging or boarding fees were collected in 54 and 48 surveys,
respectively. 41 surveys gathered data on school meals or canteen spending. Around one third of surveys
collected data on tutoring (37) and on parent association fees (27). This second set comprises expenses that
may be incurred regularly or several times during the school year.
Contributions for building or maintaining school facilities, and gifts and unofficial payments are the least
documented types of spending, with less than one out of five surveys including them. This third set of
expenditure items comprises ad-hoc spending, which may not be incurred in all education systems or every
school year, which may explain why they are not systematically collected and are less likely to be available
compared to the other items. Contributions for school facilities construction or maintenance, for example,
may not be relevant in countries where schools benefit from strong public funding. However, the fact that
an item is not collected in a survey does not necessarily mean that it is not incurred in a given education
system.
More than half of the surveys also included data on other miscellaneous expenses but their diversity across
countries makes them difficult to classify. Expenses for extracurricular activities – such as participation in
clubs, school excursions and trips, and cultural activities – were collected in one out of ten surveys. A few
surveys also gathered data on library fees. These types of expenses should not normally be considered as
expenditure on education as described in the UOE and NEA frameworks.
One criterion to assess the reliability of the information gathered relates to the comprehensiveness of the
data collection or the number and the nature of the expenditure items available. Table 1 presents the
number of items on which the surveys provide information, grouped by survey year.
9
UIS Information Paper Nº 43| 2017
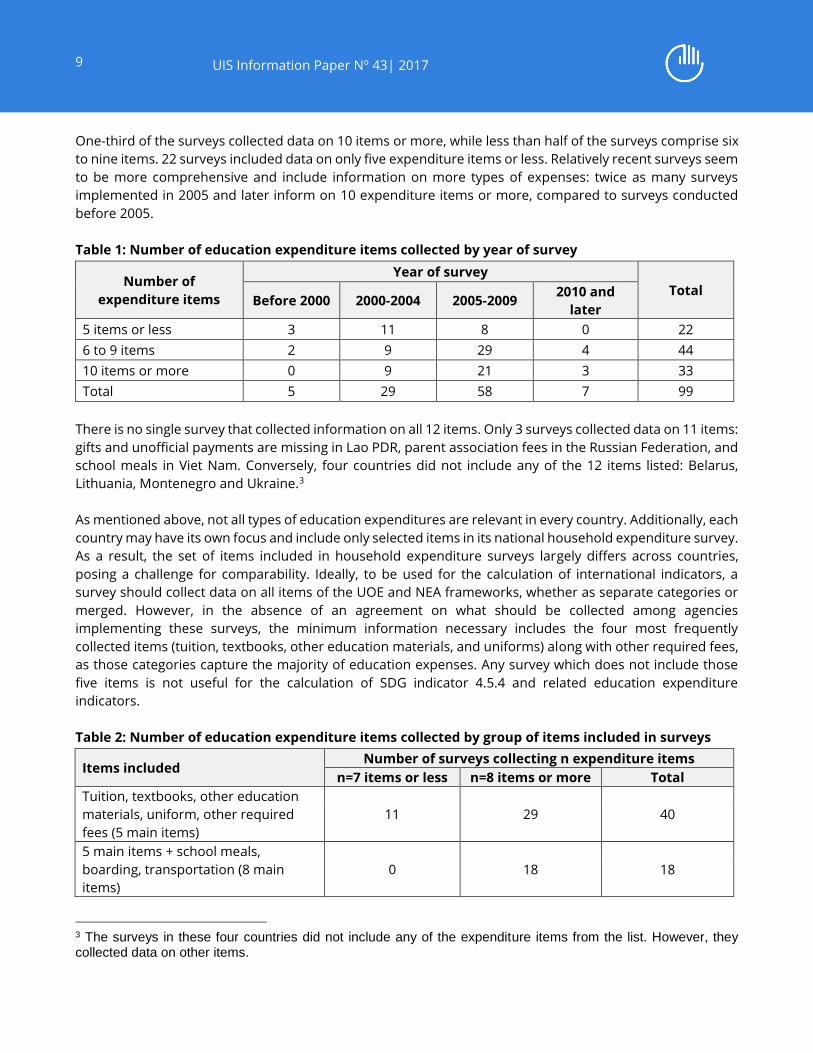
One-third of the surveys collected data on 10 items or more, while less than half of the surveys comprise six
to nine items. 22 surveys included data on only five expenditure items or less. Relatively recent surveys seem
to be more comprehensive and include information on more types of expenses: twice as many surveys
implemented in 2005 and later inform on 10 expenditure items or more, compared to surveys conducted
before 2005.
Table 1: Number of education expenditure items collected by year of survey
Number of
expenditure items
Year of survey
Total Before 2000 2000-2004 2005-2009
2010 and
later
5 items or less 3 11 8 0 22
6 to 9 items 2 9 29 4 44
10 items or more 0 9 21 3 33
Total 5 29 58 7 99
There is no single survey that collected information on all 12 items. Only 3 surveys collected data on 11 items:
gifts and unofficial payments are missing in Lao PDR, parent association fees in the Russian Federation, and
school meals in Viet Nam. Conversely, four countries did not include any of the 12 items listed: Belarus,
Lithuania, Montenegro and Ukraine.3
As mentioned above, not all types of education expenditures are relevant in every country. Additionally, each
country may have its own focus and include only selected items in its national household expenditure survey.
As a result, the set of items included in household expenditure surveys largely differs across countries,
posing a challenge for comparability. Ideally, to be used for the calculation of international indicators, a
survey should collect data on all items of the UOE and NEA frameworks, whether as separate categories or
merged. However, in the absence of an agreement on what should be collected among agencies
implementing these surveys, the minimum information necessary includes the four most frequently
collected items (tuition, textbooks, other education materials, and uniforms) along with other required fees,
as those categories capture the majority of education expenses. Any survey which does not include those
five items is not useful for the calculation of SDG indicator 4.5.4 and related education expenditure
indicators.
Table 2: Number of education expenditure items collected by group of items included in surveys
Items included Number of surveys collecting n expenditure items
n=7 items or less n=8 items or more Total
Tuition, textbooks, other education
materials, uniform, other required
fees (5 main items)
11 29 40
5 main items + school meals,
boarding, transportation (8 main
items)
0 18 18
3 The surveys in these four countries did not include any of the expenditure items from the list. However, they collected data on other items.

10
UIS Information Paper Nº 43| 2017
Table 2 shows the number of expenditure items collected and the inclusion of the main expenditure
expenses in the surveys. 40 surveys comprise data on the five main types of spending minimally required to
produce the expenditure indicator. If the comprehensiveness criterion is tightened to include the eight most
important expenses – including school meals, boarding, and transportation – the number of surveys meeting
that benchmark falls to 18.
4.2. Items merged with other items
Another criterion to assess the reliability of the expenditure data is exclusivity. Collecting items distinctly and
not merging them with other types of spending facilitates the grouping of expenses into the sub-groups of
the UOE/NEA frameworks. Table 3 presents the number of surveys collecting the information as a distinct
element or merged with another category for each expenditure item. Overall, a non-negligible number of
surveys contain merged spending items. Data on textbooks, other education materials, and school meal
expenses are merged in half of the surveys (44 surveys out of 93 for textbooks, 43 out of 80 for other
education materials, and 18 out of 41 for school meals).
Data on tutoring or private lessons, on uniform and other required clothing, and on transportation are the
least frequently merged (two surveys out of 37, four out of 71, and six out of 67, respectively). Of all surveys
assessed, only 16 have their whole set of expenditure items collected separately.
Table 3: Expenditure items collected separately or merged with other elements
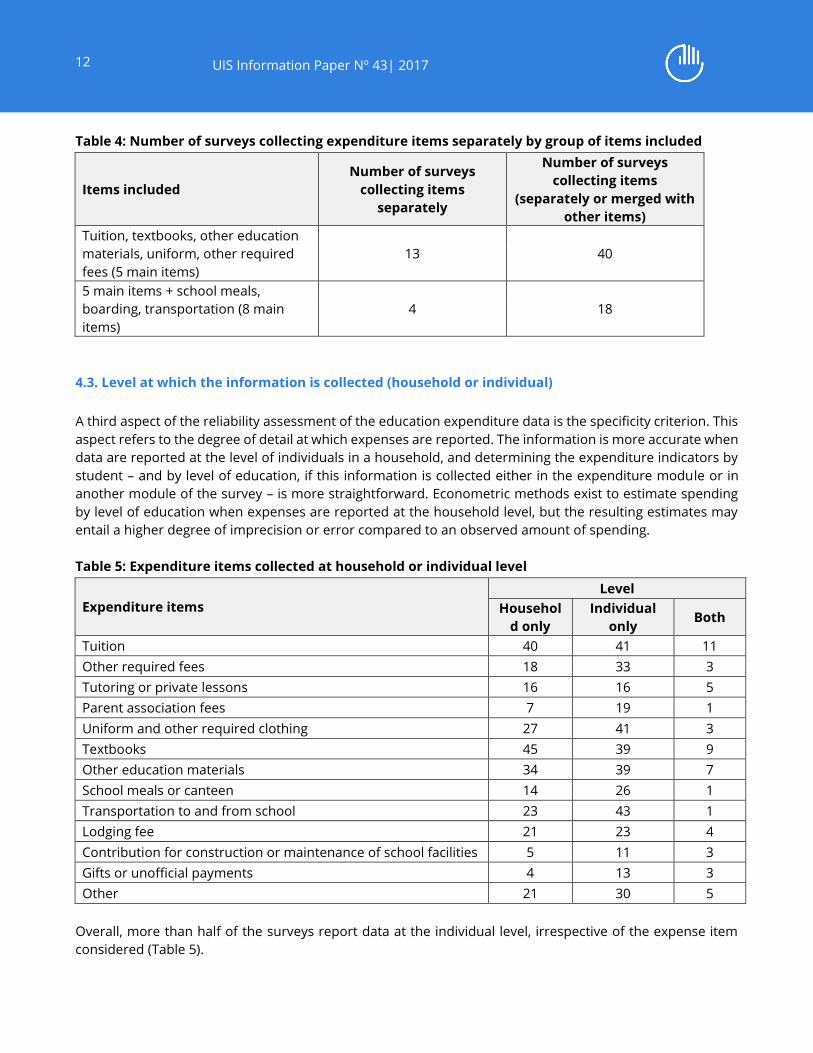
Table 4 shows the number of surveys collecting the main expenditure items separately. Around one out of
eight (13 surveys) included the five minimally required items as separate expenses, while only four surveys
collected information on the eight main items.
While unmerged items are easier to use, an item merged with another one falling into the same NEA sub-
group is still useful as the most important disaggregation is between expenses paid to schools and expenses
Expenditure items Collected
separately
Merged with
other items Total
Tuition 72 20 92
Other required fees 37 17 54
Tutoring or private lessons 35 2 37
Parent association fees 21 6 27
Uniform and other required clothing 67 4 71
Textbooks 49 44 93
Other education materials 37 43 80
School meals and canteen 23 18 41
Transportation to and from school 61 6 67
Lodging fee 32 16 48
Contribution for construction or maintenance of school
facilities 11 5 16
Gifts and unofficial payments 11 6 17
Other 55 1 56

11
UIS Information Paper Nº 43| 2017
paid outside school. For example, in many cases (16 out of 20 surveys) tuition is merged with other required
fees, which would still allow the use of that merged item for calculation of the aggregated amount paid to
educational institutions. Similarly, in 13 surveys out of 18, school meal expenses are merged with boarding
fees.
12
UIS Information Paper Nº 43| 2017
Table 4: Number of surveys collecting expenditure items separately by group of items included
Items included
Number of surveys
collecting items
separately
Number of surveys
collecting items
(separately or merged with
other items)
Tuition, textbooks, other education
materials, uniform, other required
fees (5 main items)
13 40
5 main items + school meals,
boarding, transportation (8 main
items)
4 18
4.3. Level at which the information is collected (household or individual)
A third aspect of the reliability assessment of the education expenditure data is the specificity criterion. This
aspect refers to the degree of detail at which expenses are reported. The information is more accurate when
data are reported at the level of individuals in a household, and determining the expenditure indicators by
student – and by level of education, if this information is collected either in the expenditure module or in
another module of the survey – is more straightforward. Econometric methods exist to estimate spending
by level of education when expenses are reported at the household level, but the resulting estimates may
entail a higher degree of imprecision or error compared to an observed amount of spending.
Table 5: Expenditure items collected at household or individual level
Expenditure items
Level
Househol
d only
Individual
only Both
Tuition 40 41 11
Other required fees 18 33 3
Tutoring or private lessons 16 16 5
Parent association fees 7 19 1
Uniform and other required clothing 27 41 3
Textbooks 45 39 9
Other education materials 34 39 7
School meals or canteen 14 26 1
Transportation to and from school 23 43 1
Lodging fee 21 23 4
Contribution for construction or maintenance of school facilities 5 11 3
Gifts or unofficial payments 4 13 3
Other 21 30 5
Overall, more than half of the surveys report data at the individual level, irrespective of the expense item
considered (Table 5).

13
UIS Information Paper Nº 43| 2017
14
UIS Information Paper Nº 43| 2017
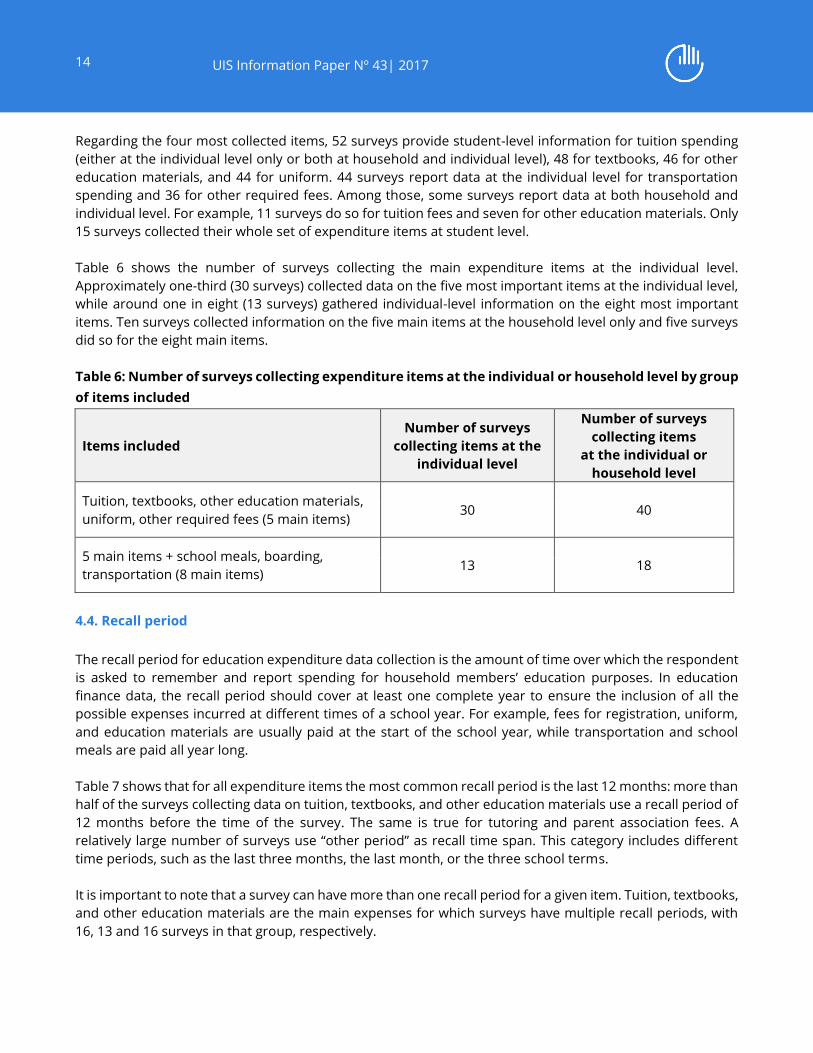
Regarding the four most collected items, 52 surveys provide student-level information for tuition spending
(either at the individual level only or both at household and individual level), 48 for textbooks, 46 for other
education materials, and 44 for uniform. 44 surveys report data at the individual level for transportation
spending and 36 for other required fees. Among those, some surveys report data at both household and
individual level. For example, 11 surveys do so for tuition fees and seven for other education materials. Only
15 surveys collected their whole set of expenditure items at student level.
Table 6 shows the number of surveys collecting the main expenditure items at the individual level.
Approximately one-third (30 surveys) collected data on the five most important items at the individual level,
while around one in eight (13 surveys) gathered individual-level information on the eight most important
items. Ten surveys collected information on the five main items at the household level only and five surveys
did so for the eight main items.
Table 6: Number of surveys collecting expenditure items at the individual or household level by group
of items included
Items included
Number of surveys
collecting items at the
individual level
Number of surveys
collecting items
at the individual or
household level
Tuition, textbooks, other education materials,
uniform, other required fees (5 main items) 30 40
5 main items + school meals, boarding,
transportation (8 main items) 13 18
4.4. Recall period
The recall period for education expenditure data collection is the amount of time over which the respondent
is asked to remember and report spending for household members’ education purposes. In education
finance data, the recall period should cover at least one complete year to ensure the inclusion of all the
possible expenses incurred at different times of a school year. For example, fees for registration, uniform,
and education materials are usually paid at the start of the school year, while transportation and school
meals are paid all year long.
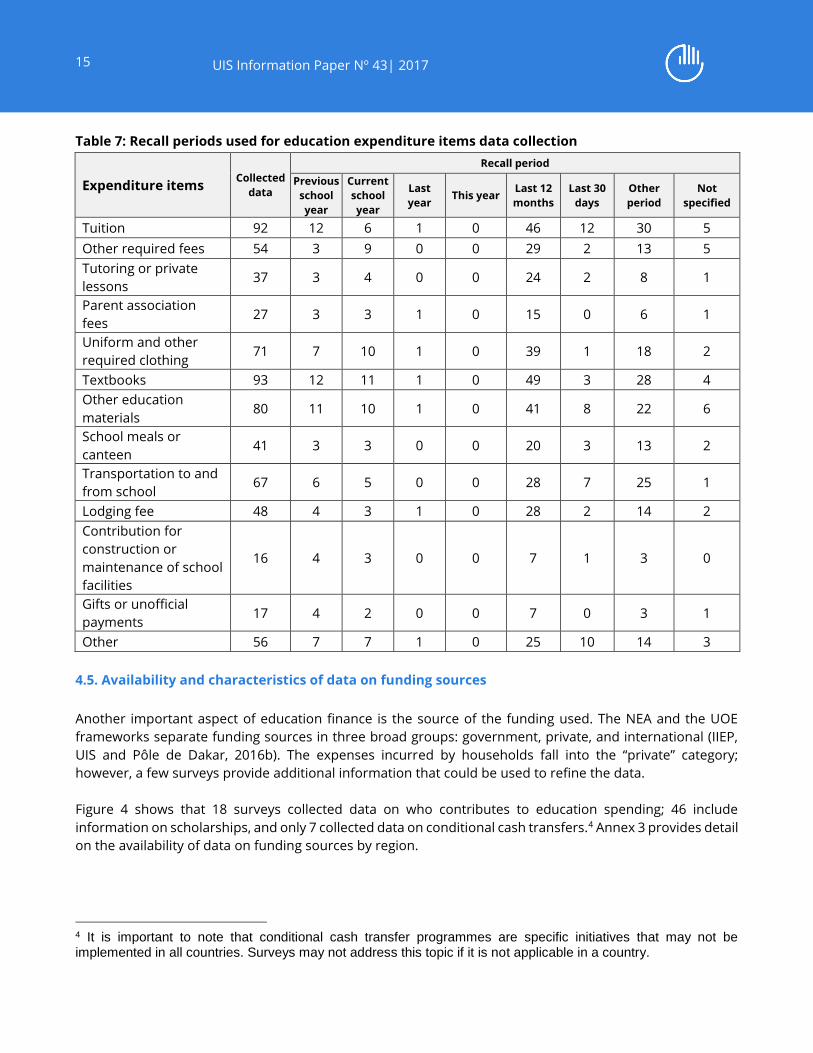
Table 7 shows that for all expenditure items the most common recall period is the last 12 months: more than
half of the surveys collecting data on tuition, textbooks, and other education materials use a recall period of
12 months before the time of the survey. The same is true for tutoring and parent association fees. A
relatively large number of surveys use “other period” as recall time span. This category includes different
time periods, such as the last three months, the last month, or the three school terms.
It is important to note that a survey can have more than one recall period for a given item. Tuition, textbooks,
and other education materials are the main expenses for which surveys have multiple recall periods, with
16, 13 and 16 surveys in that group, respectively.
15
UIS Information Paper Nº 43| 2017
Table 7: Recall periods used for education expenditure items data collection
Expenditure items Collected
data
Recall period
Previous
school
year
Current
school
year
Last
year This year
Last 12
months
Last 30
days
Other
period
Not
specified
Tuition 92 12 6 1 0 46 12 30 5
Other required fees 54 3 9 0 0 29 2 13 5
Tutoring or private
lessons 37 3 4 0 0 24 2 8 1
Parent association
fees 27 3 3 1 0 15 0 6 1
Uniform and other
required clothing 71 7 10 1 0 39 1 18 2
Textbooks 93 12 11 1 0 49 3 28 4
Other education
materials 80 11 10 1 0 41 8 22 6
School meals or
canteen 41 3 3 0 0 20 3 13 2
Transportation to and
from school 67 6 5 0 0 28 7 25 1
Lodging fee 48 4 3 1 0 28 2 14 2
Contribution for
construction or
maintenance of school
facilities
16 4 3 0 0 7 1 3 0
Gifts or unofficial
payments 17 4 2 0 0 7 0 3 1
Other 56 7 7 1 0 25 10 14 3
4.5. Availability and characteristics of data on funding sources
Another important aspect of education finance is the source of the funding used. The NEA and the UOE
frameworks separate funding sources in three broad groups: government, private, and international (IIEP,
UIS and Pôle de Dakar, 2016b). The expenses incurred by households fall into the “private” category;
however, a few surveys provide additional information that could be used to refine the data.
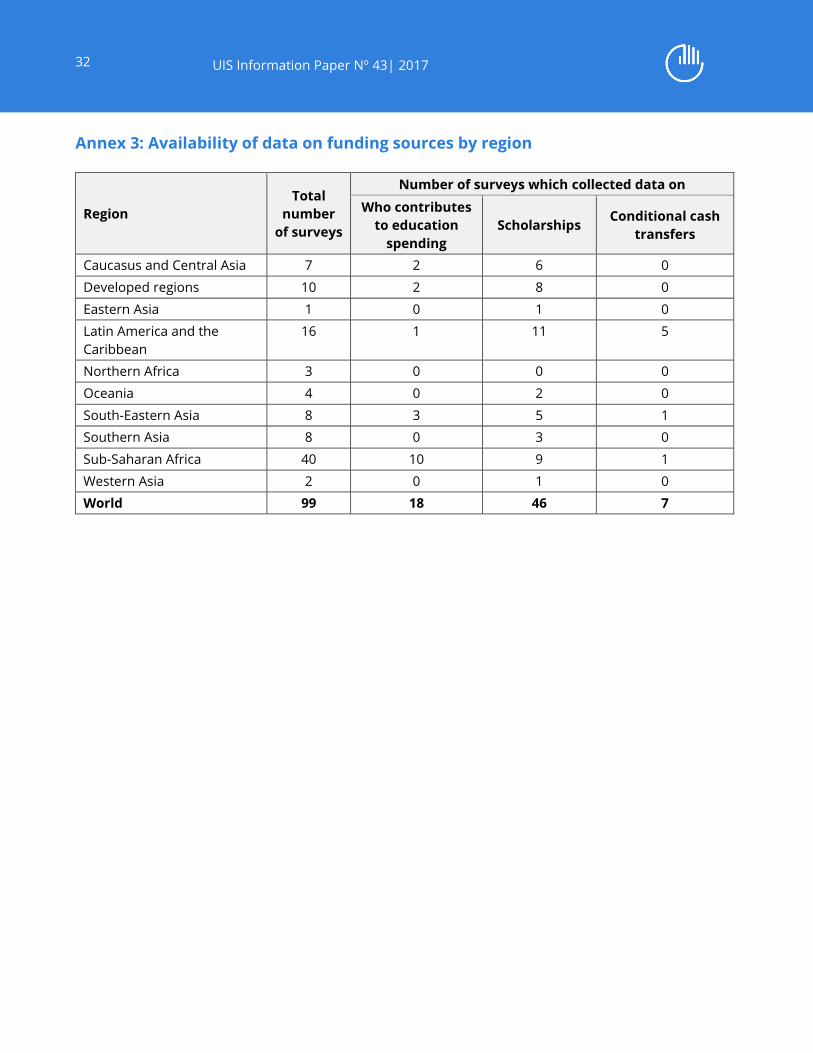
Figure 4 shows that 18 surveys collected data on who contributes to education spending; 46 include
information on scholarships, and only 7 collected data on conditional cash transfers.4 Annex 3 provides detail
on the availability of data on funding sources by region.
4 It is important to note that conditional cash transfer programmes are specific initiatives that may not be implemented in all countries. Surveys may not address this topic if it is not applicable in a country.

16
UIS Information Paper Nº 43| 2017
Figure 4: Availability of funding sources data in household surveys
Data on scholarships are more frequently collected than details on who contributes to education spending
but this information is available in less than one-half of the surveys. Information on scholarships can be
collected either at household level or at individual level. This aspect is also an indicator of the specificity of
the data collection. The practice that provides more accurate data is to gather information at student level.
34 surveys out of the 46 collecting scholarship data followed this practice. Whether the information is
available at the household level only or at individual level, the amount of the scholarship is the element that
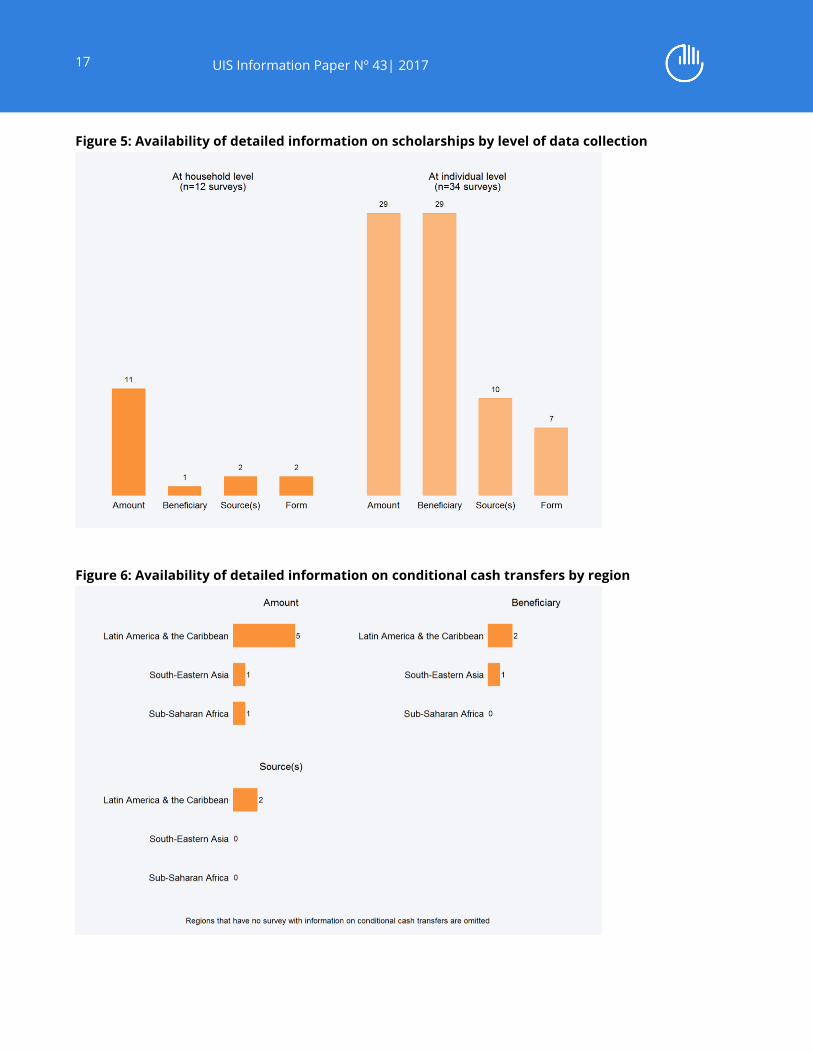
is reported in most surveys (Figure 5). The source of the scholarship and its form were collected only in a few
cases. Two surveys gathered that information at household level and 10 and 7 surveys, respectively, at
individual level. To be useful for reporting of funding by source, such as for SDG indicator 4.5.4, knowing
who paid for the scholarship is necessary for consolidation and netting out of transfers between sources.
Details on the availability of scholarship information by region can be found in Annex 4.
Only seven of the 99 surveys included information on conditional cash transfers, possibly because this type
of initiative is not a widespread practice and may not be applicable in all countries. Figure 6 shows that few
details are provided on conditional cash transfers. While information on the amount was collected in all
seven surveys, only three inform on the beneficiary of the transfers, and two on the source.
17
UIS Information Paper Nº 43| 2017
Figure 5: Availability of detailed information on scholarships by level of data collection
Figure 6: Availability of detailed information on conditional cash transfers by region

18
UIS Information Paper Nº 43| 2017
To sum up, 18 surveys can potentially be used to determine the source of funding in households, as they
include information on who contributes to covering the cost of education. Among these surveys, 10 have
additional information on scholarship providers, and two on conditional cash transfer providers.
Available data on funding sources is limited although the identification and inclusion of subsidies and other
external contributions is an important consideration in the analysis of education expenditures. Assessing
the final cost of education to households after deducting subsidies is often challenging due to the various
possible forms of support. Households may also differ in their understanding of what constitutes its
expenses for education and may include or exclude any subsidies received in their reporting.
5. Can household survey data fill the gaps in UIS educational expenditure data?
The UIS collects data on educational expenditure through an annual survey involving all UNESCO Member
States (see Section 1). National coverage of the collected data is currently insufficient for monitoring of
international goals, with information on household expenditure available for only around 30% of countries
for 2005 or a more recent year.To calculate SDG indicator 4.5.4 (education expenditure per student by level
of education and source of funding), it is necessary to have data on education expenditure at the household
or individual level, information on school attendance of household members at the time of the survey, and
details on the level of education currently attended by household members. Additionally, the UIS
expenditure surveyrequires household expenditure data to be disaggregatedbetween, at a minimum,
payments to educational institutions and payments outside educational institutions. This section aims to
determine to what extent currently available household survey data can fill the gaps in the UIS database.
5.1. Availability of expenditure items according to the UOE/NEA classification
Table 8 summarizes the number of surveys with available data on the categories and sub-categories of the
NEA classification. All household payments to educational institutions can be calculated for 19 surveys which
collected data on all sub-categories in this group, while all payments outside educational institutions can be
calculated for 27 surveys. In total, 10 surveys include information on all items of the NEA classification.
It is important to note that the IHSN dataset analysed for this report does not provide information on
expenses for additional books, computers or learning software to be used at home in support of schooling.
Therefore, these items are not included in table 8.
Table 8: Number of surveys collecting data on the categories defined in the NEA classification
Household
expenditure
category
Household expenditure
sub-category
Number of surveys collecting data
On the sub-
category
On all items
of the
category
On all items
Payments to
educational
institutions
Tuition fees 92
19 10 Other fees 54
Ancillary fees 57
Other contributions to school 34
19
UIS Information Paper Nº 43| 2017
Payments outside
educational
institutions
Uniforms 71
27
Textbooks and other
materials 93
Private tutoring 37
Transportation 67
When using the NEA classification, it is essential to make sure that all items are correctly categorized, as
payments to and outside educational institutions can vary across countries. Special attention is needed for
meals and canteen fees, for example, as those services may not always be provided through educational
institutions and may have to be classified with payments outside educational institutions.
It is also important to make sure that each expenditure item amount is collected either separately or in a
way that allows grouping according to the NEA categories and sub-categories.
5.2. Current school attendance by household members
By combining information on education expenditure at the household or individual level with information
on school attendance by all household members, it is possible to determine spending by level of education.
It is important to note that information on spending for all ages, including household members of pre-
primary age, is necessary for the calculation of total household expenditure on education, regardless of
whether data are collected at the household or individual level. To correctly allocate spending to each level
of education, information on school attendance must also be comprehensive and cover all household
members.
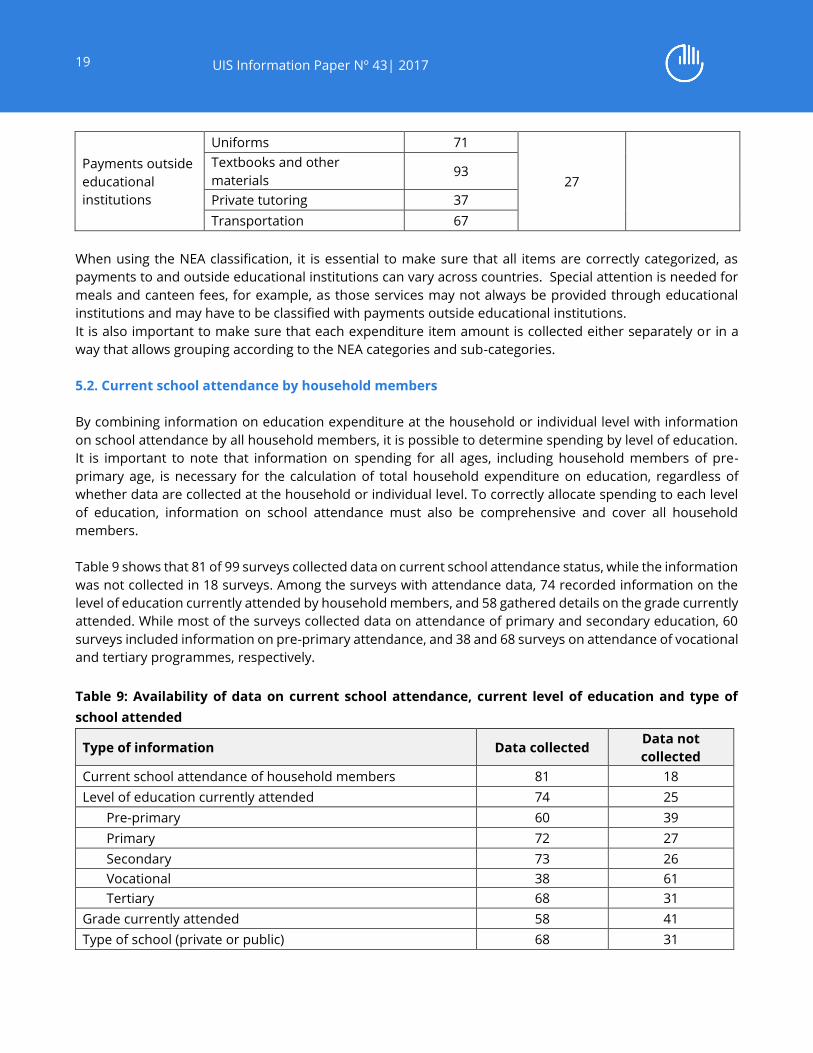
Table 9 shows that 81 of 99 surveys collected data on current school attendance status, while the information
was not collected in 18 surveys. Among the surveys with attendance data, 74 recorded information on the
level of education currently attended by household members, and 58 gathered details on the grade currently
attended. While most of the surveys collected data on attendance of primary and secondary education, 60
surveys included information on pre-primary attendance, and 38 and 68 surveys on attendance of vocational
and tertiary programmes, respectively.
Table 9: Availability of data on current school attendance, current level of education and type of
school attended
Type of information Data collected Data not
collected
Current school attendance of household members 81 18
Level of education currently attended 74 25
Pre-primary 60 39
Primary 72 27
Secondary 73 26
Vocational 38 61
Tertiary 68 31
Grade currently attended 58 41
Type of school (private or public) 68 31

20
UIS Information Paper Nº 43| 2017
Additionally, the education expenditure indicator should also be disaggregated by type of institution
attended. Information on the type of school (private or public) is available in 68 of the 99 surveys analysed.
Table 10 provides information on the age range for which data on current school attendance were collected.
35 of the 81 surveys with data on current school attendance included very young household members, aged
2 years or less, 22 surveys collected data on school attendance for household members aged 3 or 4 years
and above, and 24 included all household members from age 5 or 6.Most surveys did not specify an upper
age limit for questions about school attendance. 75 of the 81 surveys collected information on school
attendance for all household members at or above the minimum age, the other surveys collected this
information for smaller age groups.
Table 10: Availability of current school attendance data and current level of education attended by
age of household members
Age range Number of surveys
Lower age limit
0 to 2 years 35
3 or 4 years 22
5 or 6 years 24
Upper age limit
7 years 1
18 to 24 years 3
30 to 35 years 2
No upper limit 75
Note: “No upper limit” includes two surveys with 99 years as the upper age limit but in these surveys 99
years was the highest age recorded.
5.3. Useful surveys for education expenditure indicator calculation
Table 11 groups the surveys according to their degree of relevance or usefulness for calculation of education
expenditure indicators. Three main criteria are retained to classify the surveys:
Coverage and comparability: This criterion relates to the comprehensiveness of the expenditure
items. A survey including the complete list of expenditure items based on the NEA classification
(tuition, other fees, ancillary fees, other contribution to school, uniform and other required clothing,
textbooks and other materials, private class or tutoring expenses, and transportation) is considered
very useful. Only 10 surveys meet this criterion. 31 surveys are considered somewhat useful as they
cover at least the five most important items. 58 surveys are not useful as they do not cover the five
items minimally required to produce the indicator.
Timeliness: The more recent the data the more valuable they are. Not only do they reflect current
household expenditure better, they also allow more accurate estimation of expenses at an ulterior
date if needed. Seven surveys are considered very useful for the extraction of current data on
spending as they were carried out in 2010 or later, 58 surveys from 2005 to 2009 are somewhat
useful, while 34 surveys are not useful because they were conducted before 2005. However, the
latter surveys can still be used to generate time series of household expenditure on education,
provided they meet the other criteria outlined in this document.
21
UIS Information Paper Nº 43| 2017
Level of data collection: Three important points are combined in this criterion. First, surveys should
ideally collect data at the individual level. Second, information on the level of education attended is
indispensable. And third, information on the type of school attended will allow disaggregation of SDG
indicator 4.5.4 as required. 29 surveys meet these three requirements and are thus very useful
according to this criterion. 45 surveys collected information on the current level attended but only
have information for some expenditure items at the individual level. 25 surveys do not include
information on the current level of attendance of household members and are therefore deemed
not useful.
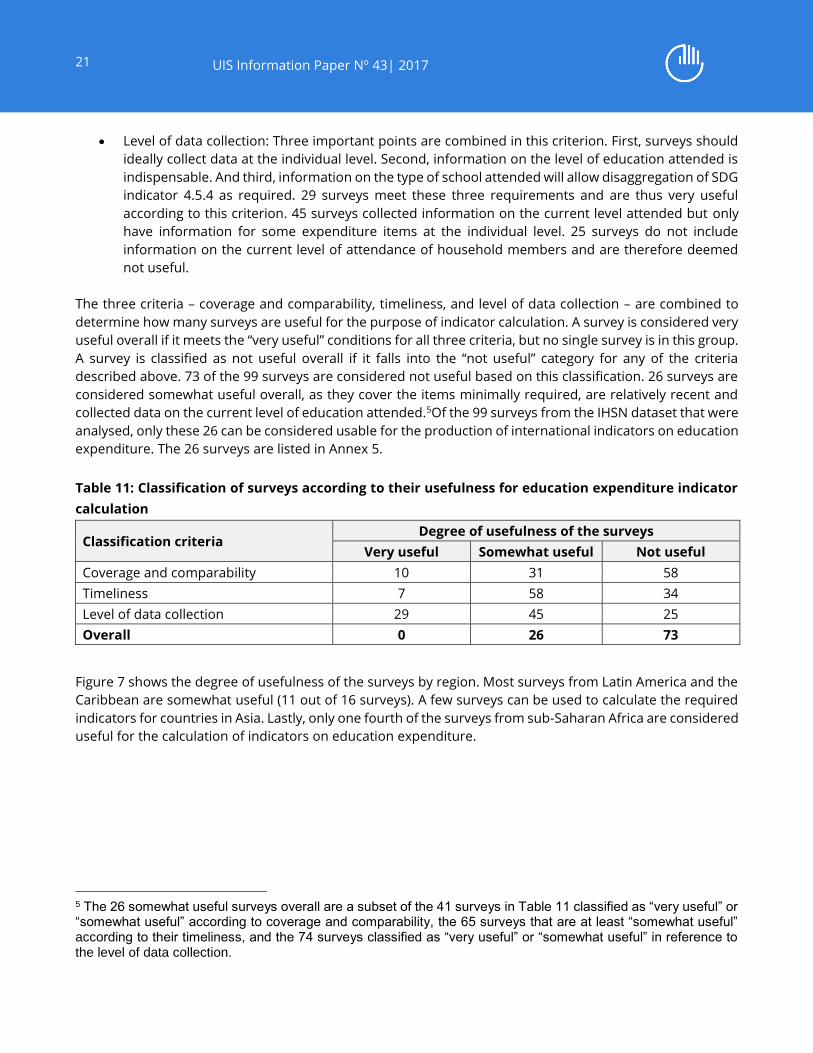
The three criteria – coverage and comparability, timeliness, and level of data collection – are combined to
determine how many surveys are useful for the purpose of indicator calculation. A survey is considered very
useful overall if it meets the “very useful” conditions for all three criteria, but no single survey is in this group.
A survey is classified as not useful overall if it falls into the “not useful” category for any of the criteria
described above. 73 of the 99 surveys are considered not useful based on this classification. 26 surveys are
considered somewhat useful overall, as they cover the items minimally required, are relatively recent and
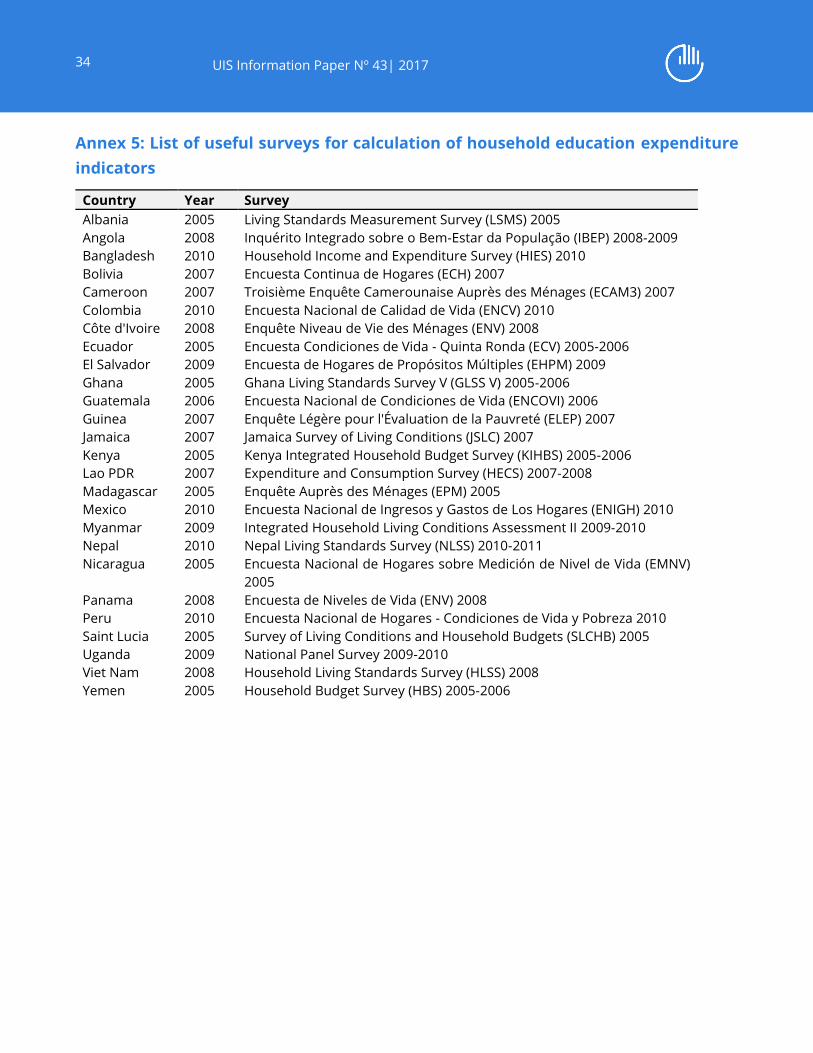
collected data on the current level of education attended.5Of the 99 surveys from the IHSN dataset that were
analysed, only these 26 can be considered usable for the production of international indicators on education
expenditure. The 26 surveys are listed in Annex 5.
Table 11: Classification of surveys according to their usefulness for education expenditure indicator
calculation
Classification criteria Degree of usefulness of the surveys
Very useful Somewhat useful Not useful
Coverage and comparability 10 31 58
Timeliness 7 58 34
Level of data collection 29 45 25
Overall 0 26 73
Figure 7 shows the degree of usefulness of the surveys by region. Most surveys from Latin America and the
Caribbean are somewhat useful (11 out of 16 surveys). A few surveys can be used to calculate the required
indicators for countries in Asia. Lastly, only one fourth of the surveys from sub-Saharan Africa are considered
useful for the calculation of indicators on education expenditure.
5 The 26 somewhat useful surveys overall are a subset of the 41 surveys in Table 11 classified as “very useful” or “somewhat useful” according to coverage and comparability, the 65 surveys that are at least “somewhat useful” according to their timeliness, and the 74 surveys classified as “very useful” or “somewhat useful” in reference to the level of data collection.

22
UIS Information Paper Nº 43| 2017
Figure 7: Degree of usefulness of surveys by region
With the metadata available for analysis it was not possible to answer some questions that are also of
interest, such as which proportion of households incur education costs or whether education is provided
free of charge. Any insights into these topics will be gained only through an analysis of the actual household
survey data.
23
UIS Information Paper Nº 43| 2017
6. Conclusion and recommendations
The objective of this brief analysis is to evaluate the availability and reliability of education finance data in
household surveys in order to determine whether they can be used as a relevant data source for indicators
needed to monitor SDG 4 on education, notably indicator 4.5.4 (education expenditure per student by level
of education and source of funding). One important finding is that all surveys provide information on
education expenditure. However, the breadth of the information collected and the methods of data
collection vary greatly across surveys, which limits their comparability and usability for the estimation of total
household expenditure on education as required for the UIS education finance survey. Only one quarter of
the surveys analysed for this report are usable for this purpose.
Harmonizing the information collected in household surveys and ensuring its accuracy and
comprehensiveness would be a major step towards enhancing the availability and quality of education
financedata. Further research – including desk review of relevant literature and more in-depth analysis of
survey data – is required to produce comprehensive guidelines on the design of education expenditure
modules in household surveys, but several areas for improvement can already be identified.
1. Coverage of the expenditure items list:
The most important element would be for all questionnaires to cover, at a minimum, all
household expenditures on education items described in the UOE and NEA frameworks (which
are compatible). Additional items of national interest can be included, but separately. This is
essential to ensure comparability between surveys and for the data to be usable to calculate SDG
indicator 4.5.4.
The expenditure items should be grouped in a way that permits distinguishing between
payments to educational institutions and expenditure outside educational institutions. This is
necessary when integrating household survey data with an analysis of total funding for
education, including government and international sources. Further disaggregation would be
desirable as described in Table 12. Studies have shown that information on household spending
collected with surveys is more comprehensive and more reliable if individual expenditure items
are listed separately rather than grouped together; however, too many items may be difficult to
manage. If countries wish to gather information on expenditure items not listed in Table 12,
these should be collected in separate categories so that they can be excluded during the
calculation of internationally comparable indicators.
Where larger categories are chosen, definitions should nonetheless clarify that all required items
are included. For example, it would be acceptable to have only one “tuition and other fees”
category, but it should be clear to the interviewer and the respondent that this should include
official tuition fees, exam and registration fees, ancillary fees, and contributions to any school
funds (construction, parent-teacher association, or school management committee).
Survey questions referring to “other” expense categories, where the included items are not
specified, should be avoided, as respondents can be tempted to include elements which should
not be considered education expenditure.
24
UIS Information Paper Nº 43| 2017
The total amount of education expenses should be reported systematically if a household is
unable to give a breakdown of the spending.
2. Exclusivity of the expenditure items list: The main expenses are not always distinctly identified,
as some surveys merge them in larger categories. Ensuring that the main items of interest are
collected separately in household surveys is important for data accuracy.
25
UIS Information Paper Nº 43| 2017
3. Level of collection of the expenditure data: Preferably, all amounts should be recorded at the
individual level and, in addition, the level of education attended of each household member should
be clearly noted in the questionnaire. This would allow the calculation of expenditure per student
and by level of education. Alternatively, expenditure at the level of the household can be
disaggregated by level of education, as long as information on school attendance of all household
members is available.
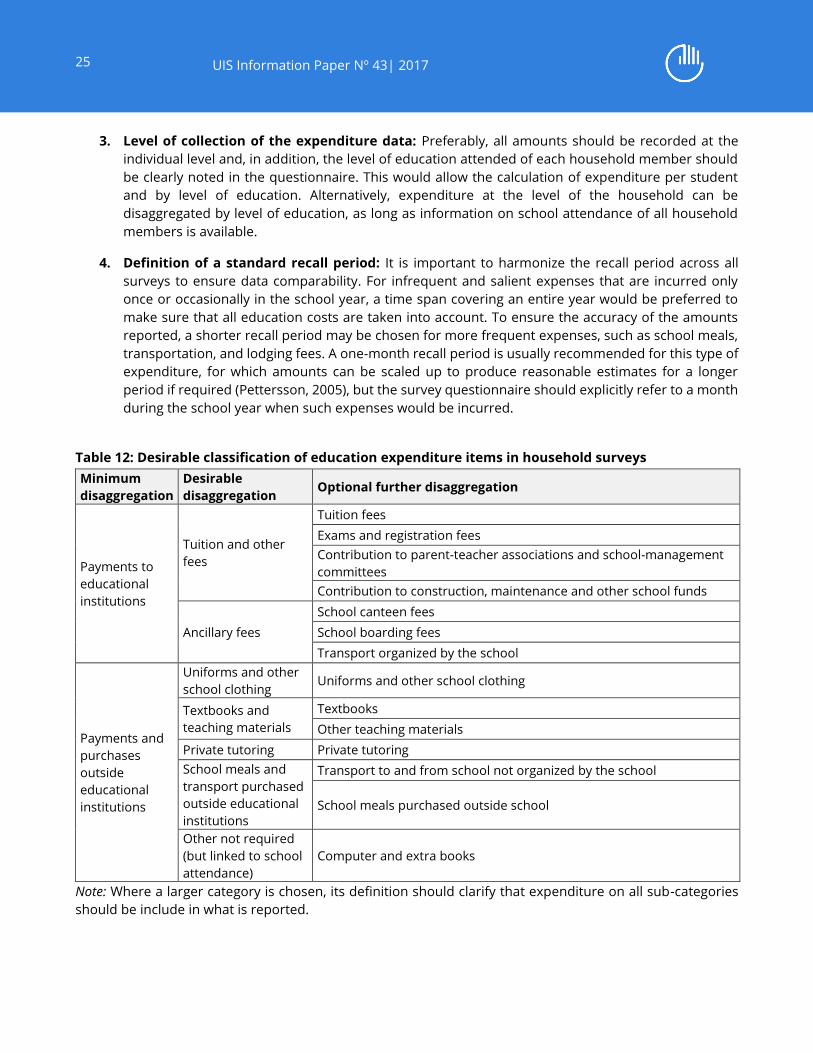
4. Definition of a standard recall period: It is important to harmonize the recall period across all
surveys to ensure data comparability. For infrequent and salient expenses that are incurred only
once or occasionally in the school year, a time span covering an entire year would be preferred to
make sure that all education costs are taken into account. To ensure the accuracy of the amounts
reported, a shorter recall period may be chosen for more frequent expenses, such as school meals,
transportation, and lodging fees. A one-month recall period is usually recommended for this type of
expenditure, for which amounts can be scaled up to produce reasonable estimates for a longer
period if required (Pettersson, 2005), but the survey questionnaire should explicitly refer to a month
during the school year when such expenses would be incurred.
Table 12: Desirable classification of education expenditure items in household surveys
Minimum
disaggregation
Desirable
disaggregation Optional further disaggregation
Payments to
educational
institutions
Tuition and other
fees
Tuition fees
Exams and registration fees
Contribution to parent-teacher associations and school-management
committees
Contribution to construction, maintenance and other school funds
Ancillary fees
School canteen fees
School boarding fees
Transport organized by the school
Payments and
purchases
outside
educational
institutions
Uniforms and other
school clothing Uniforms and other school clothing
Textbooks and
teaching materials
Textbooks
Other teaching materials
Private tutoring Private tutoring
School meals and
transport purchased
outside educational
institutions
Transport to and from school not organized by the school
School meals purchased outside school
Other not required
(but linked to school
attendance)
Computer and extra books
Note: Where a larger category is chosen, its definition should clarify that expenditure on all sub-categories
should be include in what is reported.
26
UIS Information Paper Nº 43| 2017
These general recommendations must be considered in relation with the work of a task force on education
spending estimates from household surveys that was formed as part of the Intersecretariat Working Group
on Household Surveys (ISWGHS), with representatives from the UIS, IIEP-Pôle de Dakar, the World Bank, and
other organizations.6 The task force aims to refine the definition of the SDG education finance indicator,
including the expenditure types and sources that it will encompass. More detailed guidance on how to
improve household survey questionnaires for the collection of comprehensive, reliable and comparable data
on education finance is expected as a major outcome of this work.
Potential harmonization of surveys will not produce new data for several years. In the meantime, it would
be worth exploiting available data from the 26 surveys from the IHSN dataset which have been identified as
“somewhat useful” by this analysis, as well as other currently available surveys that meet the criteria outlined
in this report.7 Where possible, the data from these surveys should also be integrated into the UIS database
for the calculation of SDG indicator 4.5.4 and other education finance indicators.
6 For more information on the ISWGHS, see https://unstats.un.org/iswghs/. 7 The IHSN Survey Catalog (http://catalog.ihsn.org/index.php/catalog) and the LSMS Dataset Finder (http://iresearch.worldbank.org/lsms/lsmssurveyFinder.htm) are among the tools can be used to identify other, more recent surveys with education expenditure data.
27
UIS Information Paper Nº 43| 2017
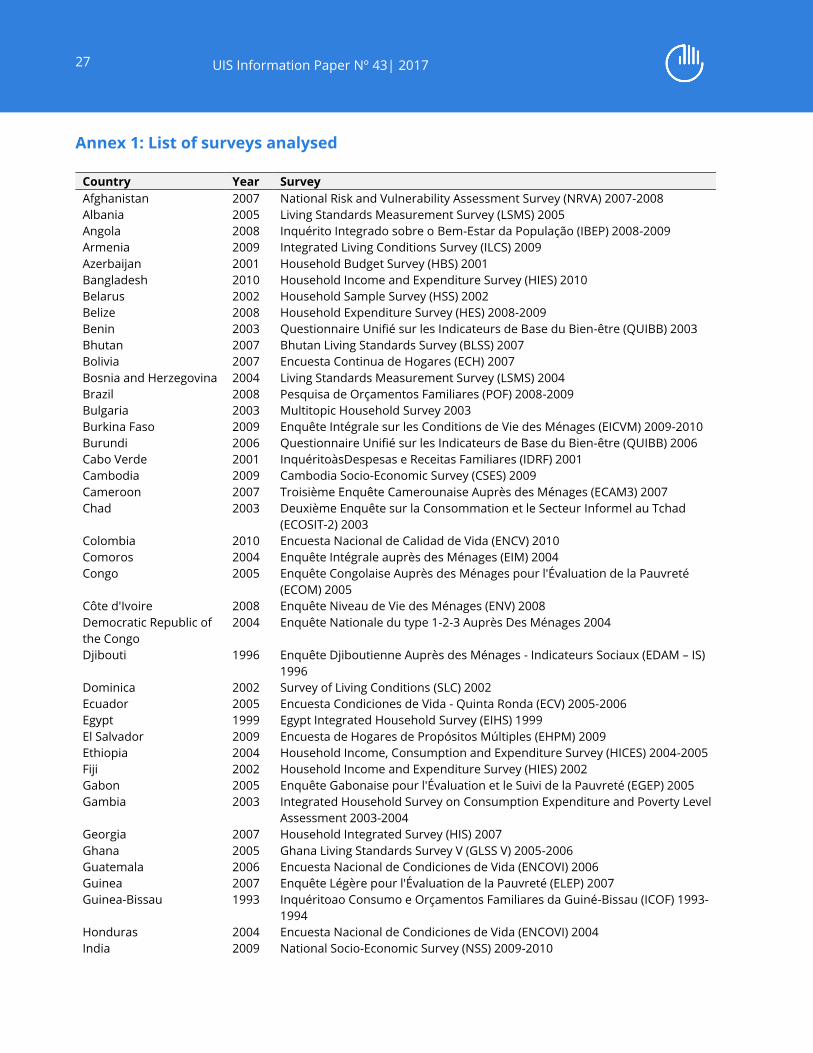
Annex 1: List of surveys analysed
Country Year Survey
Afghanistan 2007 National Risk and Vulnerability Assessment Survey (NRVA) 2007-2008
Albania 2005 Living Standards Measurement Survey (LSMS) 2005
Angola 2008 Inquérito Integrado sobre o Bem-Estar da População (IBEP) 2008-2009
Armenia 2009 Integrated Living Conditions Survey (ILCS) 2009
Azerbaijan 2001 Household Budget Survey (HBS) 2001
Bangladesh 2010 Household Income and Expenditure Survey (HIES) 2010
Belarus 2002 Household Sample Survey (HSS) 2002
Belize 2008 Household Expenditure Survey (HES) 2008-2009
Benin 2003 Questionnaire Unifié sur les Indicateurs de Base du Bien-être (QUIBB) 2003
Bhutan 2007 Bhutan Living Standards Survey (BLSS) 2007
Bolivia 2007 Encuesta Continua de Hogares (ECH) 2007
Bosnia and Herzegovina 2004 Living Standards Measurement Survey (LSMS) 2004
Brazil 2008 Pesquisa de Orçamentos Familiares (POF) 2008-2009
Bulgaria 2003 Multitopic Household Survey 2003
Burkina Faso 2009 Enquête Intégrale sur les Conditions de Vie des Ménages (EICVM) 2009-2010
Burundi 2006 Questionnaire Unifié sur les Indicateurs de Base du Bien-être (QUIBB) 2006
Cabo Verde 2001 InquéritoàsDespesas e Receitas Familiares (IDRF) 2001
Cambodia 2009 Cambodia Socio-Economic Survey (CSES) 2009
Cameroon 2007 Troisième Enquête Camerounaise Auprès des Ménages (ECAM3) 2007
Chad
2003
Deuxième Enquête sur la Consommation et le Secteur Informel au Tchad
(ECOSIT-2) 2003
Colombia 2010 Encuesta Nacional de Calidad de Vida (ENCV) 2010
Comoros 2004 Enquête Intégrale auprès des Ménages (EIM) 2004
Congo
2005
Enquête Congolaise Auprès des Ménages pour l'Évaluation de la Pauvreté
(ECOM) 2005
Côte d'Ivoire 2008 Enquête Niveau de Vie des Ménages (ENV) 2008
Democratic Republic of
the Congo
2004
Enquête Nationale du type 1-2-3 Auprès Des Ménages 2004
Djibouti 1996 Enquête Djiboutienne Auprès des Ménages - Indicateurs Sociaux (EDAM – IS)
1996
Dominica 2002 Survey of Living Conditions (SLC) 2002
Ecuador 2005 Encuesta Condiciones de Vida - Quinta Ronda (ECV) 2005-2006
Egypt 1999 Egypt Integrated Household Survey (EIHS) 1999
El Salvador 2009 Encuesta de Hogares de Propósitos Múltiples (EHPM) 2009
Ethiopia 2004 Household Income, Consumption and Expenditure Survey (HICES) 2004-2005
Fiji 2002 Household Income and Expenditure Survey (HIES) 2002
Gabon 2005 Enquête Gabonaise pour l'Évaluation et le Suivi de la Pauvreté (EGEP) 2005
Gambia 2003 Integrated Household Survey on Consumption Expenditure and Poverty Level
Assessment 2003-2004
Georgia 2007 Household Integrated Survey (HIS) 2007
Ghana 2005 Ghana Living Standards Survey V (GLSS V) 2005-2006
Guatemala 2006 Encuesta Nacional de Condiciones de Vida (ENCOVI) 2006
Guinea 2007 Enquête Légère pour l'Évaluation de la Pauvreté (ELEP) 2007
Guinea-Bissau 1993 Inquéritoao Consumo e Orçamentos Familiares da Guiné-Bissau (ICOF) 1993-
1994
Honduras 2004 Encuesta Nacional de Condiciones de Vida (ENCOVI) 2004
India 2009 National Socio-Economic Survey (NSS) 2009-2010

28
UIS Information Paper Nº 43| 2017
Country Year Survey
Indonesia 2002 National Socio-Economic Survey (SUSENAS) 2002
Iraq 2006 Household Socio-Economic Survey (HSES) 2006-2007
Jamaica 2007 Jamaica Survey of Living Conditions (JSLC) 2007
Kazakhstan 2009 Household Budget Survey (HBS) 2009
Kenya 2005 Kenya Integrated Household Budget Survey (KIHBS) 2005-2006
Lao PDR 2007 Expenditure and Consumption Survey (HECS) 2007-2008
Latvia 2007 Household Budget Survey (HBS) 2007
Lesotho 2002 Household Budget Survey (HBS) 2002-2003
Liberia 2007 Core Welfare Indicators Questionnaire (CWIQ) 2007
Lithuania 2003 Household Budget Survey (HBS) 2003
Madagascar 2005 Enquête Auprès des Ménages (EPM) 2005
Malawi 2004 Second Integrated Household Survey (IHS) 2004-2005
Maldives 2004 Vulnerability and Poverty Assessment Survey II (VPA) 2004
Mali 2006 Enquête Légère Intégrée auprès des Ménages (ELIM) 2006
Marshall Islands 2002 Household Income and Expenditure Survey (HIES) 2002
Mauritania 2004 Questionnaire Unifié des Indicateurs de Base du Bien-être (QUIBB) 2004
Mexico 2010 Encuesta Nacional de Ingresos y Gastos de Los Hogares (ENIGH) 2010
Mongolia 2007 Household Socio-Economic Survey (HSES) 2007-2008
Montenegro 2009 Household Budget Survey (HBS) 2009
Morocco 2000 The National Survey on Household Budgeting and Consumption 2000
Mozambique 2008 Inquérito sobre Orçamento Familiar (IOF) 2008-2009
Myanmar 2009 Integrated Household Living Conditions Assessment II 2009-2010
Nepal 2010 Nepal Living Standards Survey (NLSS) 2010-2011
Nicaragua 2005 Encuesta Nacional de Hogares sobre Medición de Nivel de Vida (EMNV)
2005
Niger 2007 Enquête Nationale sur le Budget et la Consommation des Ménages (ENBC)
2007
Nigeria 2010 General Household Survey (GHS) 2010
Pakistan 2004 Pakistan Social and Living Standards Measurement Survey (PSLM) 2004-
2005
Panama 2008 Encuesta de Niveles de Vida (ENV) 2008
Papua New Guinea 1996 Household Survey (HS) 1996
Paraguay 2000 Encuesta Integrada de Hogares (ENH) 2000-2001
Peru 2010 Encuesta Nacional de Hogares - Condiciones de Vida y Pobreza 2010
Philippines 2006 Family Income and Expenditure Survey (FIES) 2006
Romania 2007 Household Budget Survey (HBS) 2007
Russian Federation 2008 Household Budget Survey (HBS) 2008
Rwanda 2005 Integrated Household Living Conditions Survey (EICV 2) 2005
Saint Lucia 2005 Survey of Living Conditions and Household Budgets (SLCHB) 2005
Sao Tome and Principe 2000 Inquérito sobre Condições de Vida das Familias 2000
Senegal 2005 Enquête de Suivi de la Pauvreté au Sénégal (ESPS) 2005
Seychelles 1999 Household Expenditure Survey (HES) 1999-2000
Sierra Leone 2003 Sierra Leone Integrated Household Survey (SLIHS) 2003
South Africa 2005 Household Income and Expenditure Survey (HIES) 2005-2006
Sri Lanka 2006 Household Income Expenditure Survey (HIES) 2006-2007
Sudan 2009 National Baseline Household Survey (NBHS) 2009

29
UIS Information Paper Nº 43| 2017
Swaziland 2000 Household Income and Expenditure Survey (HIES) 2000-2001
Tajikistan 2009 Living Standards Measurement Survey (TLSMS) 2009
Thailand 2009 Household Socio-Economic Survey (HSES) 2009
Country Year Survey
Timor-Leste 2007 Survey of Living Standards 2007 and Extension 2008
Togo 2006 Questionnaire des Indicateurs de Base du Bien-être (QUIBB) 2006
Tunisia
2005
Enquête Nationale sur le Budget, la Consommation et le Niveau des
Ménages (ENBCM) 2005
Turkmenistan 2003 Living Standards Measurement Survey (LSMS) 2003
Uganda 2009 National Panel Survey 2009-2010
Ukraine 2006 Survey of the Conditions of Life of Ukraine's Households 2006
United Republic of
Tanzania
2008 National Panel Survey 2008-2009
Uzbekistan 2000 Household Budget Survey (HBS) 2000
Vanuatu 2012 Pacific Living Condition Survey, Hybrid Survey 2012-2013
Viet Nam 2008 Household Living Standards Survey (HLSS) 2008
Yemen 2005 Household Budget Survey (HBS) 2005-2006
Zambia 2006 Living Conditions Monitoring Survey V (LCMS V) 2006
30
UIS Information Paper Nº 43| 2017
Annex 2: Availability of expenditure items by region
Region
Total
number of
surveys
Number of surveys which collected data on
Tuition
Other
required
fees
Tutoring,
private
lessons
Parent
association
fees
Uniform and
other required
clothing
Textbooks
Caucasus and
Central Asia
7 7 1 4 0 3 6
Developed
regions
10 6 4 3 1 4 6
Eastern Asia 1 1 0 0 0 1 1
Latin America and
the Caribbean
16 16 16 5 6 16 16
Northern Africa 3 3 2 2 0 1 3
Oceania 4 4 0 0 0 3 4
South-Eastern
Asia
8 8 5 5 3 5 8
Southern Asia 8 7 6 4 0 2 8
Sub-Saharan
Africa
40 38 19 12 17 34 39
Western Asia 2 2 1 2 0 2 2
World 99 92 54 37 27 71 93
Region
Total
number
of
surveys
Number of surveys which collected data on
Other
education
materials
School
meals,
canteen
Transpor-
tation
Lodging
fee
Contribution
for school
facilities
Gifts,
unofficial
payments
Other
Caucasus and
Central Asia
7 3 3 4 1 3 4 5
Developed
regions
10 6 6 3 6 2 3 2
Eastern Asia 1 1 1 0 1 0 0 1
Latin America and
the Caribbean
16 15 7 14 5 2 2 11
Northern Africa 3 3 0 3 2 0 0 1
Oceania 4 3 1 2 3 0 1 3
South-Eastern
Asia
8 8 3 7 5 3 2 4
Southern Asia 8 8 1 5 4 0 1 6
Sub-Saharan
Africa
40 32 17 27 19 6 4 21
31
UIS Information Paper Nº 43| 2017
Western Asia 2 1 2 2 2 0 0 2
World 99 80 41 67 48 16 17 56
32
UIS Information Paper Nº 43| 2017
Annex 3: Availability of data on funding sources by region
Region
Total
number
of surveys
Number of surveys which collected data on
Who contributes
to education
spending
Scholarships Conditional cash
transfers
Caucasus and Central Asia 7 2 6 0
Developed regions 10 2 8 0
Eastern Asia 1 0 1 0
Latin America and the
Caribbean
16 1 11 5
Northern Africa 3 0 0 0
Oceania 4 0 2 0
South-Eastern Asia 8 3 5 1
Southern Asia 8 0 3 0
Sub-Saharan Africa 40 10 9 1
Western Asia 2 0 1 0
World 99 18 46 7

33
UIS Information Paper Nº 43| 2017
Annex 4: Availability of data on scholarships by region
Region
Total
number
of surveys
Number of surveys which collected data on
Amount of
scholarship
Beneficiary
of
scholarship
Source(s) of
scholarship Form of
scholarship
Caucasus and Central Asia 7 6 4 2 1
Developed regions 10 8 8 0 0
Eastern Asia 1 1 1 1 0
Latin America and the
Caribbean
16 8 7 4 6
Northern Africa 3 0 0 0 0
Oceania 4 1 1 0 1
South-Eastern Asia 8 4 1 1 1
Southern Asia 8 3 2 1 0
Sub-Saharan Africa 40 8 5 3 0
Western Asia 2 1 1 0 0
World 99 40 30 12 9
34
UIS Information Paper Nº 43| 2017
Annex 5: List of useful surveys for calculation of household education expenditure
indicators
Country Year Survey
Albania 2005 Living Standards Measurement Survey (LSMS) 2005
Angola 2008 Inquérito Integrado sobre o Bem-Estar da População (IBEP) 2008-2009
Bangladesh 2010 Household Income and Expenditure Survey (HIES) 2010
Bolivia 2007 Encuesta Continua de Hogares (ECH) 2007
Cameroon 2007 Troisième Enquête Camerounaise Auprès des Ménages (ECAM3) 2007
Colombia 2010 Encuesta Nacional de Calidad de Vida (ENCV) 2010
Côte d'Ivoire 2008 Enquête Niveau de Vie des Ménages (ENV) 2008
Ecuador 2005 Encuesta Condiciones de Vida - Quinta Ronda (ECV) 2005-2006
El Salvador 2009 Encuesta de Hogares de Propósitos Múltiples (EHPM) 2009
Ghana 2005 Ghana Living Standards Survey V (GLSS V) 2005-2006
Guatemala 2006 Encuesta Nacional de Condiciones de Vida (ENCOVI) 2006
Guinea 2007 Enquête Légère pour l'Évaluation de la Pauvreté (ELEP) 2007
Jamaica 2007 Jamaica Survey of Living Conditions (JSLC) 2007
Kenya 2005 Kenya Integrated Household Budget Survey (KIHBS) 2005-2006
Lao PDR 2007 Expenditure and Consumption Survey (HECS) 2007-2008
Madagascar 2005 Enquête Auprès des Ménages (EPM) 2005
Mexico 2010 Encuesta Nacional de Ingresos y Gastos de Los Hogares (ENIGH) 2010
Myanmar 2009 Integrated Household Living Conditions Assessment II 2009-2010
Nepal 2010 Nepal Living Standards Survey (NLSS) 2010-2011
Nicaragua 2005 Encuesta Nacional de Hogares sobre Medición de Nivel de Vida (EMNV)
2005
Panama 2008 Encuesta de Niveles de Vida (ENV) 2008
Peru 2010 Encuesta Nacional de Hogares - Condiciones de Vida y Pobreza 2010
Saint Lucia 2005 Survey of Living Conditions and Household Budgets (SLCHB) 2005
Uganda 2009 National Panel Survey 2009-2010
Viet Nam 2008 Household Living Standards Survey (HLSS) 2008
Yemen 2005 Household Budget Survey (HBS) 2005-2006
35
UIS Information Paper Nº 43| 2017
References
International Institute for Educational Planning (IIEP), UNESCO Institute for Statistics (UIS), and Pôle de Dakar.
2016a. Methodology of National Education Accounts. Paris: IIEP.
http://www.uis.unesco.org/Education/Documents/nea-methodology-en.pdf.
———. 2016b. Who Pays for What in Education? The Real Costs Revealed through National Education Accounts.
Montreal: UIS. http://www.uis.unesco.org/Education/Documents/nea-report-results-en.pdf.
Pettersson, Hans. 2005. “Chapter XXIV: Survey Design and Sample Design in Household Budget Surveys.” In
Household Sample Surveys in Developing and Transition Countries. New York: United Nations.
http://unstats.un.org/unsd/HHsurveys/pdf/Household_surveys.pdf.
UNESCO Institute for Statistics (UIS), Organisation for Economic Co-operation and Development (OECD), and
Eurostat. 2016. UOE Data Collection on Formal Education: Manual on Concepts, Definitions and
Classifications. Montreal, Paris, Luxembourg: UIS, OECD, Eurostat.
http://uis.unesco.org/sites/default/files/documents/uoe2016manual_11072016_0.pdf.