Autumn Newsletter 2013
14
Autumn 2013 Newsletter When it comes to building an investment portfolio there are a few golden rules: know what you want to achieve; research thoroughly before committing any money; and avoid the temptation to risk every penny on just one area of the market. Concentration is Ok but don’t marry the position be ready to sell. If the past few years have taught us anything it's that there are no guarantees of investment success, so ensuring you have a diversified spread of assets is essential to reduce your overall level of risk. A well- constructed portfolio should be diversified in a variety of ways, including overall investment style, number of individual asset classes, spread of geographical allocation and the approach of the fund manager. The best way to start investing is through some planning and preparation. Here are five easy steps to get you onto the road to investing. Step 1: Define your goals. Setting clear goals with achievable targets is the first step in the planning process. For example, 'I want to retire at 60 with an after tax income of $50,000 which will last at least 25 years'. Step 2: Educate yourself and understand the investment basics. The main things you need to get to grips with are the different asset classes (i.e. local and global shares, property and fixed interest) and how they perform, the relationship between risk and return, and why diversification is something you should consider. Start by reading the financial press and look for more information on our website. Step 3: Check your investment strategy options. There are quite a few strategies that you can use to build wealth and achieve your goals faster - starting a regular investment plan, investing for growth and re-investing distributions are just three examples. Step 4: Decide if you need professional help. Keeping up with changes to tax, superannuation regulations, market movements and tracking investment performance can be a bit of a minefield. We believe that working with a financial planner can help you achieve your financial goals. Step 5: Start investing. No matter how much time you spend considering your strategies, watching the stock markets or planning which funds to put your money into, until you place those investments they can't start working for you. Planning is good, but also action! Copyright(C) 2013 Banner Financial Services Japan K.K. All Rights Reserved.
-
Upload
jason-manuel-de-herrera -
Category
Documents
-
view
102 -
download
4
description
My summer newsletter for portfolio updates and investment opportunities. Aimed for future growth with separate, distinct strategies.For example:Funds aiming for 6~9% returnFunds aiming for 10~15%+ returnGold and precious metalsIndividual Shares and Exchange Traded Funds (ETF’s)Crude Oil and How to Take Advantage of itThe Dow Jones Industrial Average and the S&P 500Private Healthcare vs. Japanese National Insurance
Transcript of Autumn Newsletter 2013
Autumn 2013 Newsletter
When it comes to building an investment portfolio there are a few golden rules: know what you want to achieve; research thoroughly before committing any money; and avoid the temptation to risk every penny on just one area of the market. Concentration is Ok but don’t marry the position be ready to sell.
If the past few years have taught us anything it's that there are no guarantees of investment success, so ensuring you have a diversified spread of assets is essential to reduce your overall level of risk. A well-constructed portfolio should be diversified in a variety of ways, including overall investment style, number of individual asset classes, spread of geographical allocation and the approach of the fund manager.
The best way to start investing is through some planning and preparation. Here are five easy steps to get you onto the road to investing.
Step 1: Define your goals.
Setting clear goals with achievable targets is the first step in the planning process. For example, 'I want to retire at 60 with an after tax income of $50,000 which will last at least 25 years'.
Step 2: Educate yourself and understand the investment basics.
The main things you need to get to grips with are the different asset classes (i.e. local and global shares, property and fixed interest) and how they perform, the relationship between risk and return, and why diversification is something you should consider. Start by reading the financial press and look for more information on our website.
Step 3: Check your investment strategy options.
There are quite a few strategies that you can use to build wealth and achieve your goals faster - starting a regular investment plan, investing for growth and re-investing distributions are just three examples.
Step 4: Decide if you need professional help.
Keeping up with changes to tax, superannuation regulations, market movements and tracking investment performance can be a bit of a minefield. We believe that working with a financial planner can help you achieve your financial goals.
Step 5: Start investing.
No matter how much time you spend considering your strategies, watching the stock markets or planning which funds to put your money into, until you place those investments they can't start working for you. Planning is good, but also action!
Copyright(C) 2013 Banner Financial Services Japan K.K. All Rights Reserved.
Funds aiming for 6~9% return
Coral Student Portfolio
The Coral Student Portfolio offers investors the opportunity to participate in the growing sector of Student Accommodation. The Fund invests in a range of established UK schemes and providers and is also positioned to benefit from emerging opportunities in select international centers. By spreading investment across several specialist providers, it removes single operator risk and can shift emphasis to developing geographic trends. The Coral Student Portfolio launched in March 2009 and is an EU Fund, domiciled and regulated by the CSSF, in Luxembourg.
Key Highlights of the Student Portfolio Include:
• Spread of Provider Risk - Reduces provider risk by offering exposure to over 33,000 beds in 90 sites in 27 towns and cities across the UK and Internationally – more than any other fund
• Contemporary Focus – High concentration in key university locations in Scotland, London and Russell Group higher education institutions
• Independent Investment Advisers – The Fund has engaged leading independent advisers including CBRE, which is authorized by the FCA
• Liquidity – Topical, managed liquidity policy • Regulation and Governance- Robustly EU-regulated in Luxembourg with independent
administration and custody • Availability - the Coral Student Portfolio is readily available through most leading Life Company
Portfolio Bonds and selected platforms
In an evolving UK higher education landscape, Coral’s ability to move with the market will become essential while the sector’s enduring fundamentals provide positive indications for continuing investor returns; skill, flexibility and liquidity, which are key components of Coral’s proposition, will become of growing importance.
Coral Student Portfolio Fund Fact Sheet Coral Student Portfolio Underlying Fund Information
The Rudolf Wolff Income Fund
In today’s investment climate, there are a number of pressing concerns facing investors who are seeking income: historically low dividend yields, lowest ever interest rates, falling real estate yields and uncertain bond markets.
In response to these concerns, in 2011 Rudolf Wolff launched the Income Fund (the “Fund”), targeting 7% gross per annum.
The Fund invests in a weighted portfolio of income bearing financial instruments, including Permanent Interest Bearing Shares (“PIBS”) issued by UK building societies, preference shares and debt instruments issued by bank and insurance/assurance groups, as well as general corporate debt.
The Fund is designed to produce an attractive rate of income whilst maintaining the underlying asset value of investment. It may possibly suit those of your clients who are looking for higher returns than are currently being offered by standard building society accounts or bank deposit accounts.
The income is distributed semi-annually, at the end of March and September. Investors may elect to have the income reinvested.
The Rudolf Wolff Income Fund Fact Sheet The Rudolf Wolff Income Fund Presentation
Copyright(C) 2013 Banner Financial Services Japan K.K. All Rights Reserved.
US Investing with the World’s Original Hedge Fund
A s an investor, do you worry about the QE-laced stock rally continuing, given the threat of QE withdrawal? And as an expatriate American investor, with restrictions on investing at home, are you wary of
investing offshore, particularly with the real prospect of FATCA implementation?
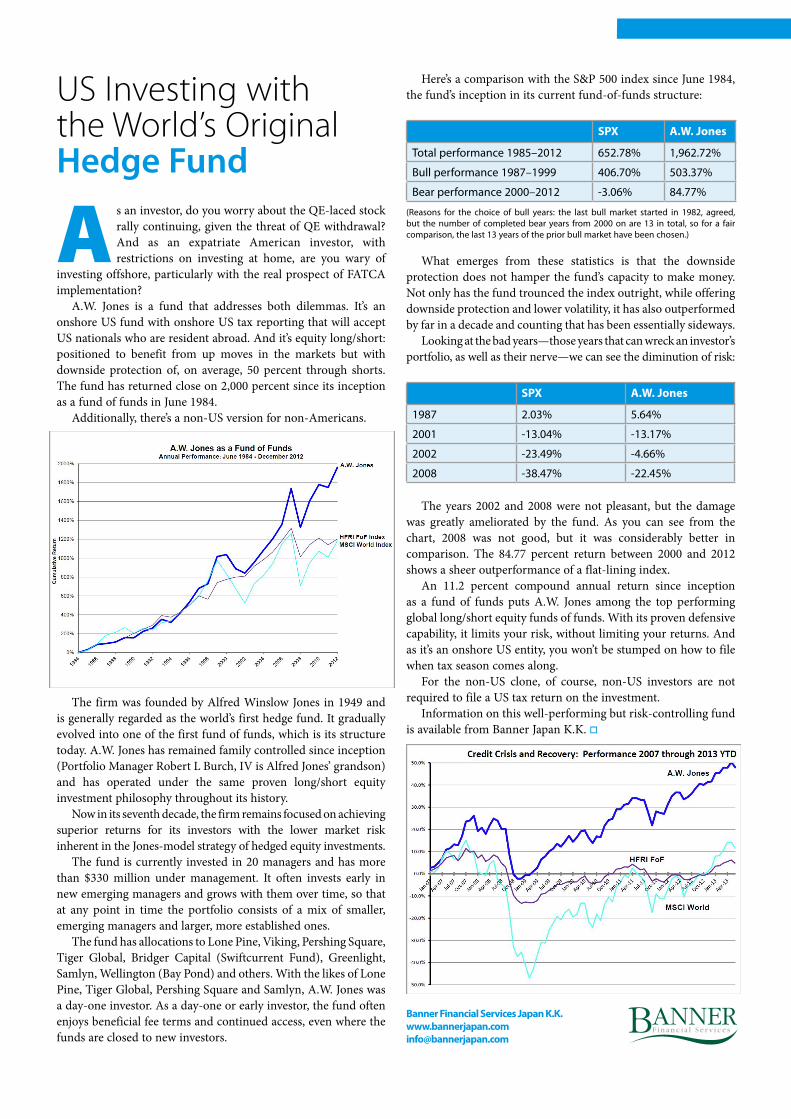
A.W. Jones is a fund that addresses both dilemmas. It’s an onshore US fund with onshore US tax reporting that will accept US nationals who are resident abroad. And it’s equity long/short: positioned to benefit from up moves in the markets but with downside protection of, on average, 50 percent through shorts. The fund has returned close on 2,000 percent since its inception as a fund of funds in June 1984.
Additionally, there’s a non-US version for non-Americans.
Here’s a comparison with the S&P 500 index since June 1984, the fund’s inception in its current fund-of-funds structure:
SPX A.W. Jones
total performance 1985–2012 652.78% 1,962.72%
Bull performance 1987–1999 406.70% 503.37%
Bear performance 2000–2012 -3.06% 84.77%
(reasons for the choice of bull years: the last bull market started in 1982, agreed, but the number of completed bear years from 2000 on are 13 in total, so for a fair comparison, the last 13 years of the prior bull market have been chosen.)
What emerges from these statistics is that the downside protection does not hamper the fund’s capacity to make money. Not only has the fund trounced the index outright, while offering downside protection and lower volatility, it has also outperformed by far in a decade and counting that has been essentially sideways.
Looking at the bad years—those years that can wreck an investor’s portfolio, as well as their nerve—we can see the diminution of risk:
SPX A.W. Jones
1987 2.03% 5.64%
2001 -13.04% -13.17%
2002 -23.49% -4.66%
2008 -38.47% -22.45%
The years 2002 and 2008 were not pleasant, but the damage was greatly ameliorated by the fund. As you can see from the chart, 2008 was not good, but it was considerably better in comparison. The 84.77 percent return between 2000 and 2012 shows a sheer outperformance of a flat-lining index.
An 11.2 percent compound annual return since inception as a fund of funds puts A.W. Jones among the top performing global long/short equity funds of funds. With its proven defensive capability, it limits your risk, without limiting your returns. And as it’s an onshore US entity, you won’t be stumped on how to file when tax season comes along.
For the non-US clone, of course, non-US investors are not required to file a US tax return on the investment.
Information on this well-performing but risk-controlling fund is available from Banner Japan K.K. o
The firm was founded by Alfred Winslow Jones in 1949 and is generally regarded as the world’s first hedge fund. It gradually evolved into one of the first fund of funds, which is its structure today. A.W. Jones has remained family controlled since inception (Portfolio Manager Robert L Burch, IV is Alfred Jones’ grandson) and has operated under the same proven long/short equity investment philosophy throughout its history.
Now in its seventh decade, the firm remains focused on achieving superior returns for its investors with the lower market risk inherent in the Jones-model strategy of hedged equity investments.
The fund is currently invested in 20 managers and has more than $330 million under management. It often invests early in new emerging managers and grows with them over time, so that at any point in time the portfolio consists of a mix of smaller, emerging managers and larger, more established ones.
The fund has allocations to Lone Pine, Viking, Pershing Square, Tiger Global, Bridger Capital (Swiftcurrent Fund), Greenlight, Samlyn, Wellington (Bay Pond) and others. With the likes of Lone Pine, Tiger Global, Pershing Square and Samlyn, A.W. Jones was a day-one investor. As a day-one or early investor, the fund often enjoys beneficial fee terms and continued access, even where the funds are closed to new investors.
Banner Financial Services Japan [email protected]
Monthly Savings Plans
Regular savings plans are products offered by big international insurance companies based in offshore centers like the Isle of Man and Guernsey.
These plans are "whole of life, unit linked, life assurance products" and your monthly investment amount buys units in the funds you have selected. When setting up a savings plan you agree to a contract and a term, the minimum term being five years. Ideally you choose a term that corresponds with a financial goal, e.g. retirement, and a monthly amount you think you can comfortably afford throughout the term.
If you want to save a small amount each month you should look at a longer term plan, 10 years, or better 15 or 20 years, to make it worth your while and cost effective. The best friend for achieving growth and accumulating capital is time and persistence.
Portable pension plans are a means for people working abroad to build up a lump sum for their retirement – we can help you get one started.
In signing up for a portable pension plan you agree to a contract. This will be a minimum of five years but is best aimed at your earliest foreseeable retirement age. This will normally be between 55 and 60. You also agree on a monthly amount to put away. The more you put into the plan, the more there will be for your retirement. However, you should not take on an obligation you cannot fulfill.
All plans have a minimum contribution period, ranging from five to twenty-eight months, in which you must make the contributions. Beyond that you are free to discontinue, but discontinuation makes the plan less efficient financially. The flexibility to miss a few payments, if you lose your job or decide to go round the world, is there, but in taking out the plan you should not set the contribution level unrealistically high – your income might increase, but then so might your responsibilities.
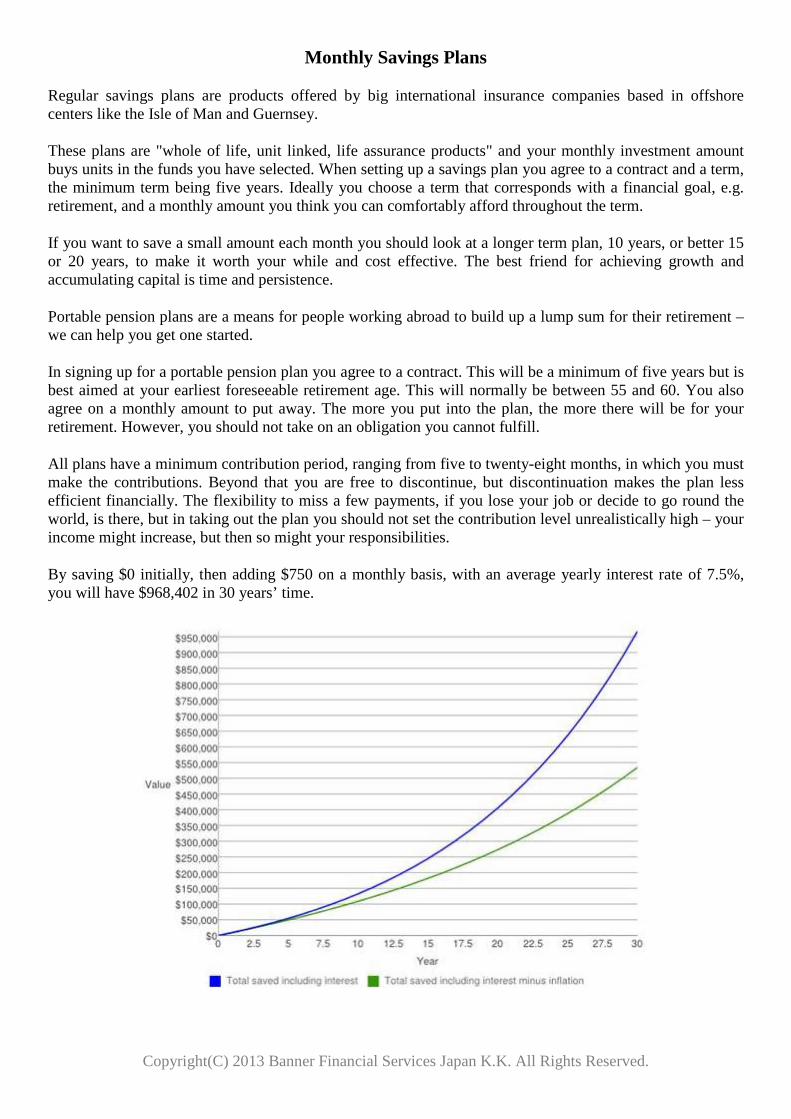
By saving $0 initially, then adding $750 on a monthly basis, with an average yearly interest rate of 7.5%, you will have $968,402 in 30 years’ time.
Copyright(C) 2013 Banner Financial Services Japan K.K. All Rights Reserved.
Funds aiming for 10~15%+ return
Kijani Commodity Fund
The Fund’s objective is to manage a unique blend of physical and insured commodities trading, utilizing a proprietary system that exploits arbitrage opportunities in short term commodity contracts. This strategy capitalizes on the global demand for certain commodities and at the same time the methodology minimizes risk and volatility.
The primary focus of the Fund is currently precious metals, however other commodities will be traded as market conditions dictate and where the most profitable arbitrage opportunities arise.
The daily management and highly liquid nature of the trades means that the Fund is able to make gains regardless of market direction as profits can be generated in both rising and falling markets.
Non-Correlated-Unlike “long only” Funds, Kijani’s unique approach ensures that profits are made over relatively short trading cycles. It is not necessary for the price of a particular commodity to rise in order for the Fund to make a profit. The Fund is not correlated to Commodity prices, Equities or Bonds.
Ethical approach-The name “Kijani” means green in Swahili. The Fund’s Directors and management are committed to trading activities that promote the virtues of ethical and sustainable business practices. This management philosophy will provide longevity to the Kijani business model and will greatly help Kijani succeed in some of the world’s foremost growth markets. The Directors strongly believe that profitability and sustainability can be achieved together.
Kijani Commodity Fund Fact Sheet Kijani Commodity Fund Brochure http://www.bloomberg.com/quote/FKIJCOM:MP
The Magma Fund
Magma performed as we would have hoped in June, a month that saw the return of significant volatility in financial markets. The fund, although marginally down for the month, out-performed indices by a distance. IQS Futures fund (50% of Magma) fell by 2.1% as early losses were recovered strongly in the last ten days of the month. IQS is still strongly positive for the first half of the year with a gain of 14.5%.
CF Odey UK Absolute Return (30% of Magma) climbed another 2.3% in June compared to a fall in the FTSE All Share index of -3.6%; nearly 6% of out-performance as the fund continued its long run of sustained strong returns. Long equity positions fell but short government bond futures, currency hedges, short equities, and short equity index futures all gained.
BNY Mellon Absolute Return Equity (20% of Magma) rose by a little over 1% in June, compared to a return for the MSCI World index of -2.1%. As volatility is rising again, restructuring stories where companies have more control over their own destiny are proving attractive to the fund managers.
The combination of these three funds has made Magma resilient in falling markets and dynamic in rising markets and we are confident this will remain the case for the future.
The Magma Fund Fact Sheet The Magma Fund Presentation
Copyright(C) 2013 Banner Financial Services Japan K.K. All Rights Reserved.
Gold
The short answer as to why I like gold is because I believe there’s too much debt in the world. Generally speaking, a government with too much debt can:
• Try to outgrow its debt load: as the economy grows, the debt-to-GDP ratio declines, possibly making the debt burden more sustainable.
• Pay off the debt by raising taxes or lowering expenditures to lower a country’s debt-to-GDP ratio. • Restructure, i.e. defaulting on the debt. • “Print money” – or more precisely the modern electronic version thereof, as can be achieved through
asset purchases by a central bank.
The Eurozone has been experimenting with austerity in an effort to contain or lower their debt-to-GDP ratios over time. In contrast, the U.S., U.K., and Japan have shown a willingness to resort to the printing presses to address their debt loads.
Japan, with its debt-to-GDP ratio above 230% has a problem. The biggest problem may well be complacency: Japan’s populist Prime Minster Abe wants to pursue Depression era fiscal policy, as well as aggressive monetary policy to help Japan out of deflation. What policy makers in Japan appear to underestimate is that the country’s current account surplus has melted away. As long as the country had a current account surplus, inaction allowed market forces to play out, encouraged consumers to save more, a positive feedback loop fostering deflation, as well as a stronger yen.
As Japan’s current account balance has been eroding, the dynamics have been changing. the government has indebted itself to the tune of 230% of GDP… a total exceeding ONE QUADRILLION yen.
And according to the Japanese government’s own figures, they spent a mind-boggling 24.3% of their entire national tax revenue just to pay interest on the debt last year!
Slowly, somewhere between this untenable fiscal position and the radiation leak at Fukushima, a few Japanese people realized that their confidence in the system was misguided.
BMG GoldBullion funds are also fully backed by allocated bullion with no liens or encumbrances.
• BMG Funds set the gold standard in offering you the absolute security of allocated and insured bullion.
• BMG BullionFund is the world's first and only open-end mutual fund trust that purchases equal dollar amounts of gold, silver and platinum bullion.
• BMG Gold BullionFund is an open-end mutual fund trust that purchases gold bullion. • BMG Gold Advantage Return BullionFund couples monthly fixed cash distributions with an
underlying asset of physical gold bullion.
BMG GoldBullion Fund Fact Sheet
Copyright(C) 2013 Banner Financial Services Japan K.K. All Rights Reserved.
Personal Portfolio Bonds
An offshore portfolio bond is a tax efficient wrapper that can hold a variety of assets like stocks and shares or mutual funds. This is a bond that adds the legal and tax shield of a life insurance policy to an investment portfolio. It is structured to simply combine a life insurance policy and a portfolio to create a wrapper that investors can buy, manage and sell their assets through.
The specific benefits of investing in offshore bonds depend upon your individual circumstances. The investment funds held within offshore bonds grow free of year-on-year taxation, unlike comparable OEICs, which are taxed annually on capital growth. Some of the individual funds within an Offshore Bond may be subject to withholding tax.
You won't be liable for capital gains tax when you sell a profitable fund to purchase another fund within your offshore portfolio bond. If you made the same switches within an OEIC, or your equity or unit trust investments outside a portfolio bond, you may be liable for capital gains tax. This is one way that offshore bonds are often a more tax-efficient way for you to invest.
Offshore bonds are designed to be flexible; especially with regards to letting you take ad-hoc withdrawals, or set up an income stream into an offshore bank with internet banking and credit card attached. Another major benefit is the ability to transfer in and consolidate all your existing stocks, mutual fund and other investments. This gives them the tax efficiency and ease of administration of the other assets within the portfolio bond.
Some key benefits:
1. All your assets can be held in one platform a. This allows you to view everything easily b. You can view everything online and stay up to date c. Multi-currency cash accounts
2. Tax efficient structure
a. Treated as a life insurance policy b. No tax on capital gains or FX gains c. Only taxed when money is taken out of the bond
3. You can buy (from recognized stock exchanges):
a. Stocks b. Shares c. ETFs d. Fixed-interest securities e. A wide range of funds, globally
4. We issue instructions to buy, sell, or FX and the company does the rest
a. No application forms required, just a simple, one page instruction b. The company follows up with the fund house for all documentation c. Contract Notes for your dealings are online for your record
5. Minimum investment :
a. GBP 50,000 (or currency equivalent) b. Top-ups are GBP7,5000
Copyright(C) 2013 Banner Financial Services Japan K.K. All Rights Reserved.
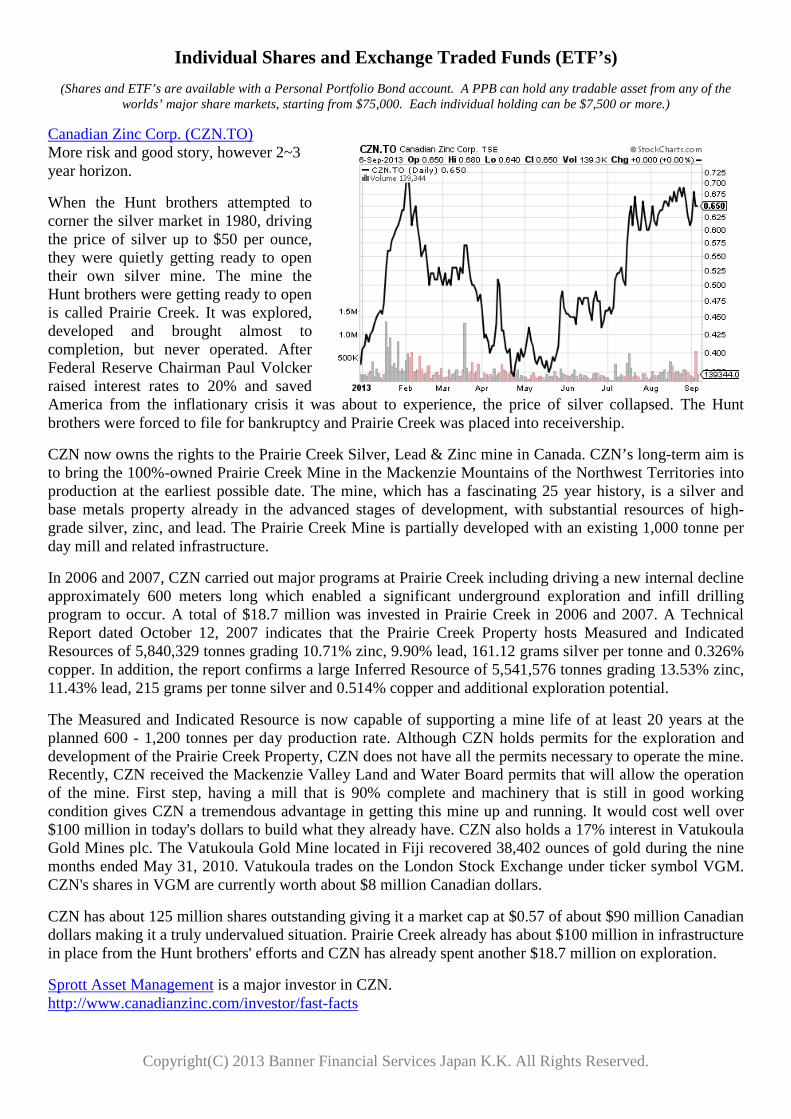
Individual Shares and Exchange Traded Funds (ETF’s) (Shares and ETF’s are available with a Personal Portfolio Bond account. A PPB can hold any tradable asset from any of the
worlds’ major share markets, starting from $75,000. Each individual holding can be $7,500 or more.)
Canadian Zinc Corp. (CZN.TO) More risk and good story, however 2~3 year horizon.
When the Hunt brothers attempted to corner the silver market in 1980, driving the price of silver up to $50 per ounce, they were quietly getting ready to open their own silver mine. The mine the Hunt brothers were getting ready to open is called Prairie Creek. It was explored, developed and brought almost to completion, but never operated. After Federal Reserve Chairman Paul Volcker raised interest rates to 20% and saved America from the inflationary crisis it was about to experience, the price of silver collapsed. The Hunt brothers were forced to file for bankruptcy and Prairie Creek was placed into receivership.
CZN now owns the rights to the Prairie Creek Silver, Lead & Zinc mine in Canada. CZN’s long-term aim is to bring the 100%-owned Prairie Creek Mine in the Mackenzie Mountains of the Northwest Territories into production at the earliest possible date. The mine, which has a fascinating 25 year history, is a silver and base metals property already in the advanced stages of development, with substantial resources of high-grade silver, zinc, and lead. The Prairie Creek Mine is partially developed with an existing 1,000 tonne per day mill and related infrastructure.
In 2006 and 2007, CZN carried out major programs at Prairie Creek including driving a new internal decline approximately 600 meters long which enabled a significant underground exploration and infill drilling program to occur. A total of $18.7 million was invested in Prairie Creek in 2006 and 2007. A Technical Report dated October 12, 2007 indicates that the Prairie Creek Property hosts Measured and Indicated Resources of 5,840,329 tonnes grading 10.71% zinc, 9.90% lead, 161.12 grams silver per tonne and 0.326% copper. In addition, the report confirms a large Inferred Resource of 5,541,576 tonnes grading 13.53% zinc, 11.43% lead, 215 grams per tonne silver and 0.514% copper and additional exploration potential.
The Measured and Indicated Resource is now capable of supporting a mine life of at least 20 years at the planned 600 - 1,200 tonnes per day production rate. Although CZN holds permits for the exploration and development of the Prairie Creek Property, CZN does not have all the permits necessary to operate the mine. Recently, CZN received the Mackenzie Valley Land and Water Board permits that will allow the operation of the mine. First step, having a mill that is 90% complete and machinery that is still in good working condition gives CZN a tremendous advantage in getting this mine up and running. It would cost well over $100 million in today's dollars to build what they already have. CZN also holds a 17% interest in Vatukoula Gold Mines plc. The Vatukoula Gold Mine located in Fiji recovered 38,402 ounces of gold during the nine months ended May 31, 2010. Vatukoula trades on the London Stock Exchange under ticker symbol VGM. CZN's shares in VGM are currently worth about $8 million Canadian dollars.
CZN has about 125 million shares outstanding giving it a market cap at $0.57 of about $90 million Canadian dollars making it a truly undervalued situation. Prairie Creek already has about $100 million in infrastructure in place from the Hunt brothers' efforts and CZN has already spent another $18.7 million on exploration.
Sprott Asset Management is a major investor in CZN. http://www.canadianzinc.com/investor/fast-facts
Copyright(C) 2013 Banner Financial Services Japan K.K. All Rights Reserved.
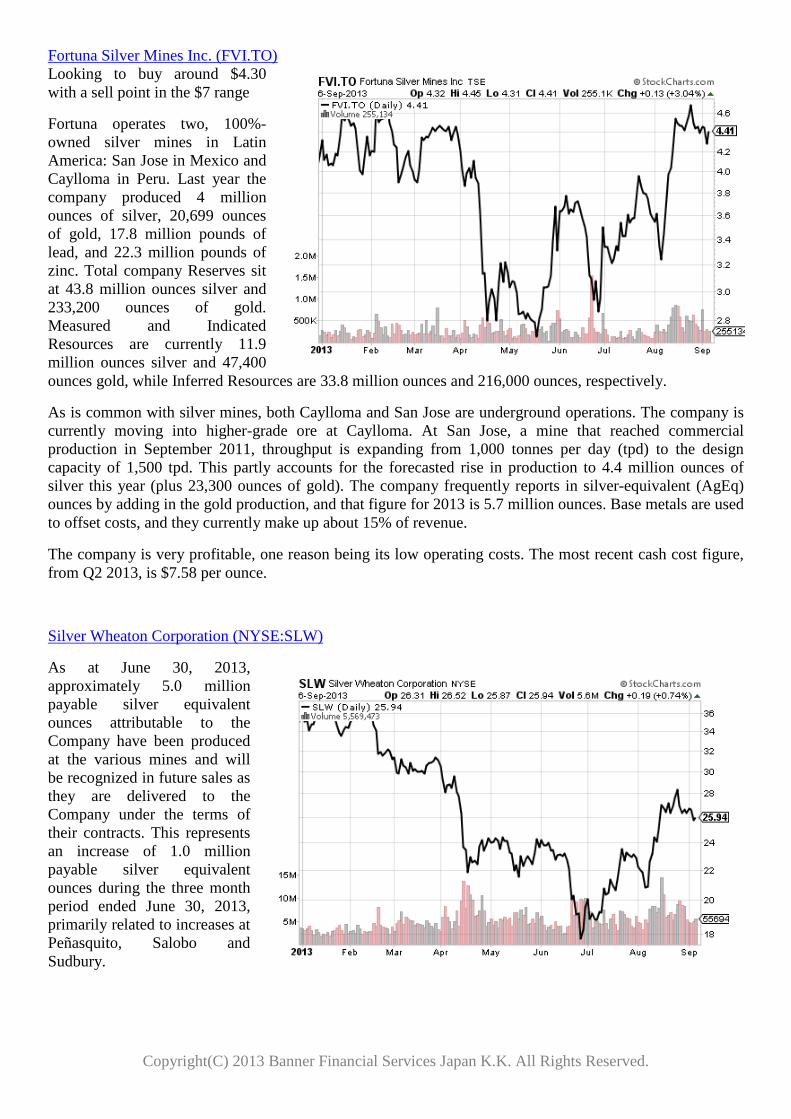
Fortuna Silver Mines Inc. (FVI.TO) Looking to buy around $4.30 with a sell point in the $7 range
Fortuna operates two, 100%-owned silver mines in Latin America: San Jose in Mexico and Caylloma in Peru. Last year the company produced 4 million ounces of silver, 20,699 ounces of gold, 17.8 million pounds of lead, and 22.3 million pounds of zinc. Total company Reserves sit at 43.8 million ounces silver and 233,200 ounces of gold. Measured and Indicated Resources are currently 11.9 million ounces silver and 47,400 ounces gold, while Inferred Resources are 33.8 million ounces and 216,000 ounces, respectively.
As is common with silver mines, both Caylloma and San Jose are underground operations. The company is currently moving into higher-grade ore at Caylloma. At San Jose, a mine that reached commercial production in September 2011, throughput is expanding from 1,000 tonnes per day (tpd) to the design capacity of 1,500 tpd. This partly accounts for the forecasted rise in production to 4.4 million ounces of silver this year (plus 23,300 ounces of gold). The company frequently reports in silver-equivalent (AgEq) ounces by adding in the gold production, and that figure for 2013 is 5.7 million ounces. Base metals are used to offset costs, and they currently make up about 15% of revenue.
The company is very profitable, one reason being its low operating costs. The most recent cash cost figure, from Q2 2013, is $7.58 per ounce.
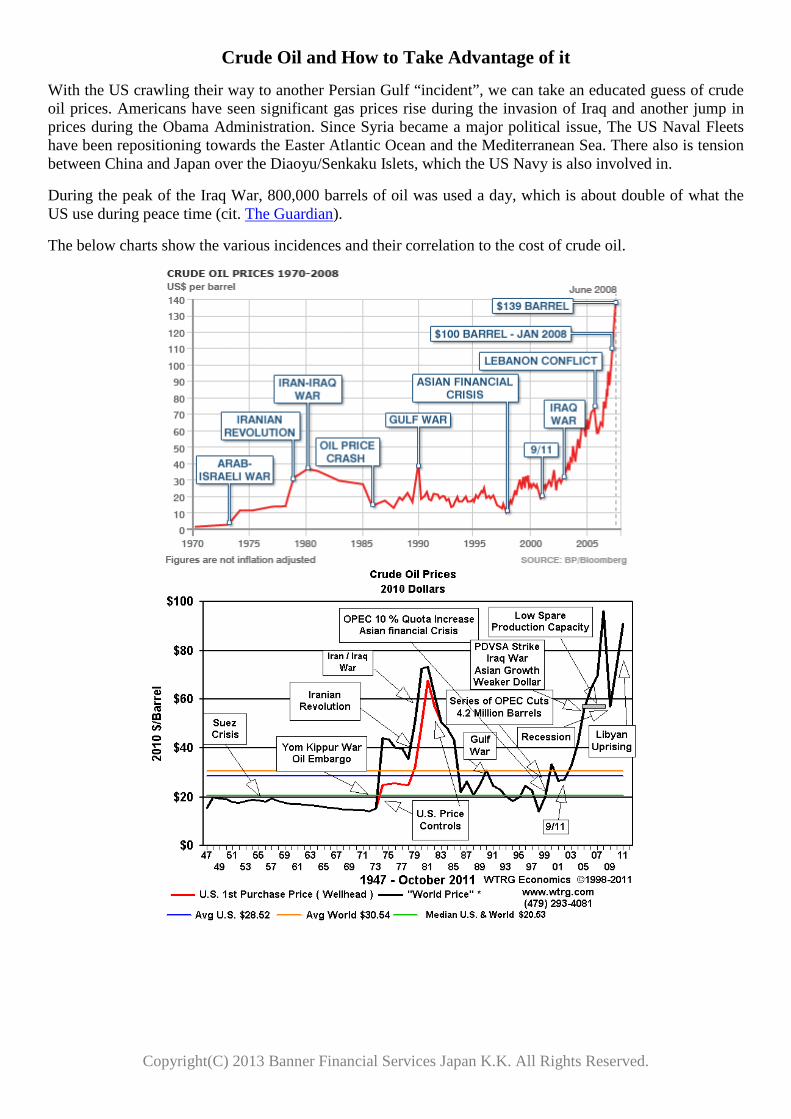
Silver Wheaton Corporation (NYSE:SLW)
As at June 30, 2013, approximately 5.0 million payable silver equivalent ounces attributable to the Company have been produced at the various mines and will be recognized in future sales as they are delivered to the Company under the terms of their contracts. This represents an increase of 1.0 million payable silver equivalent ounces during the three month period ended June 30, 2013, primarily related to increases at Peñasquito, Salobo and Sudbury.
Copyright(C) 2013 Banner Financial Services Japan K.K. All Rights Reserved.
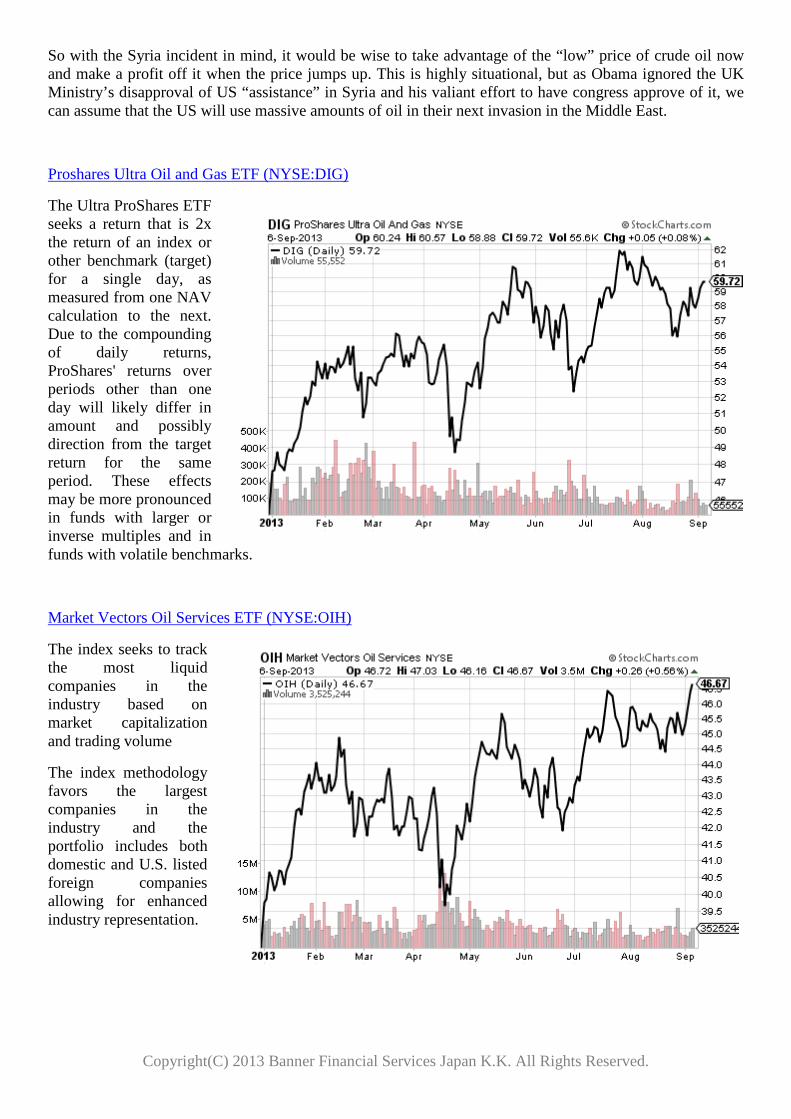
Crude Oil and How to Take Advantage of it
With the US crawling their way to another Persian Gulf “incident”, we can take an educated guess of crude oil prices. Americans have seen significant gas prices rise during the invasion of Iraq and another jump in prices during the Obama Administration. Since Syria became a major political issue, The US Naval Fleets have been repositioning towards the Easter Atlantic Ocean and the Mediterranean Sea. There also is tension between China and Japan over the Diaoyu/Senkaku Islets, which the US Navy is also involved in.
During the peak of the Iraq War, 800,000 barrels of oil was used a day, which is about double of what the US use during peace time (cit. The Guardian).
The below charts show the various incidences and their correlation to the cost of crude oil.
Copyright(C) 2013 Banner Financial Services Japan K.K. All Rights Reserved.
So with the Syria incident in mind, it would be wise to take advantage of the “low” price of crude oil now and make a profit off it when the price jumps up. This is highly situational, but as Obama ignored the UK Ministry’s disapproval of US “assistance” in Syria and his valiant effort to have congress approve of it, we can assume that the US will use massive amounts of oil in their next invasion in the Middle East.
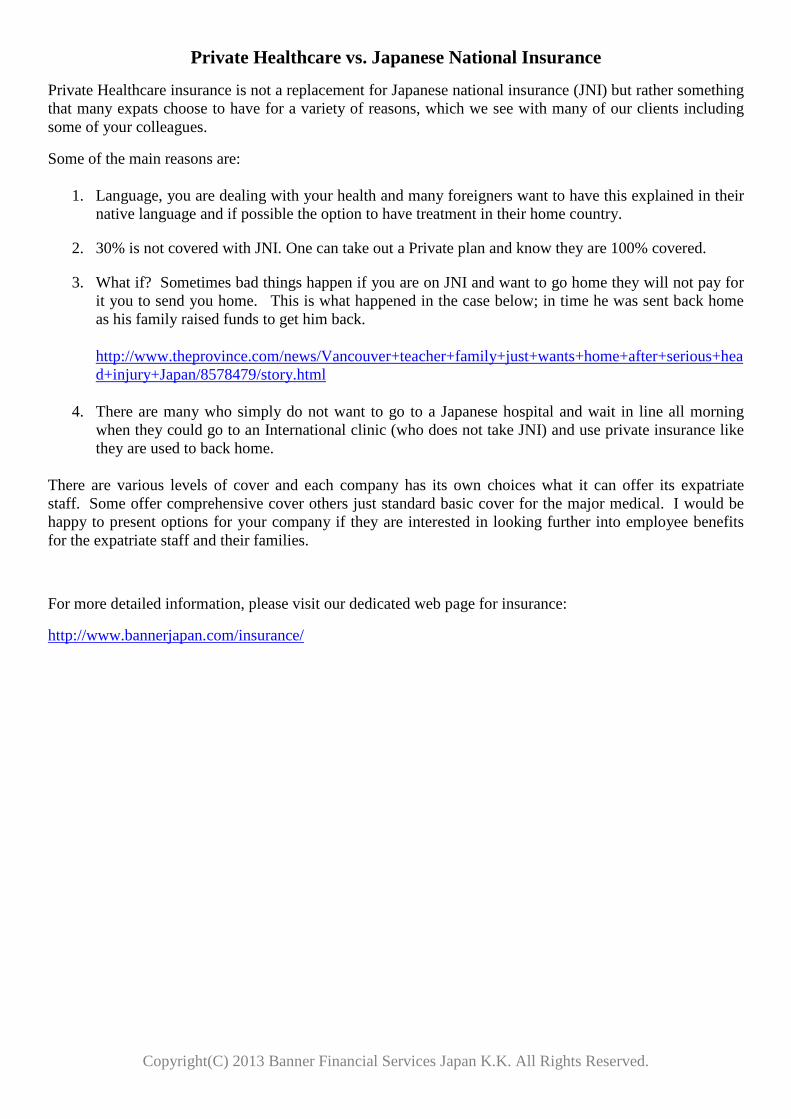
Proshares Ultra Oil and Gas ETF (NYSE:DIG)
The Ultra ProShares ETF seeks a return that is 2x the return of an index or other benchmark (target) for a single day, as measured from one NAV calculation to the next. Due to the compounding of daily returns, ProShares' returns over periods other than one day will likely differ in amount and possibly direction from the target return for the same period. These effects may be more pronounced in funds with larger or inverse multiples and in funds with volatile benchmarks.
Market Vectors Oil Services ETF (NYSE:OIH)
The index seeks to track the most liquid companies in the industry based on market capitalization and trading volume
The index methodology favors the largest companies in the industry and the portfolio includes both domestic and U.S. listed foreign companies allowing for enhanced industry representation.
Copyright(C) 2013 Banner Financial Services Japan K.K. All Rights Reserved.

The Dow Jones Industrial Average and the S&P 500
Sell in May and go away… but when do you buy it? The Dow Jones Industrial Average has had an average return of only 0.3% during the May-October period, compared with an average gain of 7.5% during the November-April period. We look to purchase when there is reasonable timing and as you can see in the chart below, this ETF fluctuates (roughly) between 145 and 157. So a purchase around 150 would be reasonable.
SPDR DJ Industrial Average ETF (NYSE:DIA)
S&P 500 Index Principal Protected Products
Widely regarded as the best single gauge in the U.S. equities market, this world-renowned index includes a representative sample of 500 companies in the leading industries of the U.S. The S&P 500 focuses on the large-cap segment of the market, with over 80% coverage of U.S. equities, but it is also an ideal proxy for the total market.
S&P 500 Index Principal Protected notes' key advantages:
• Principal Protected • 100% Participation in the growth of the S&P 500 Index • Security through the safe and private custody of assets • Ability to participate in stock market growth without the downside risk
Key Features:
• Currency: USD ($) • Flexibility to invest regularly or in lump sum • Investment Terms:
o 7 years lump sums (min $10,000 can be toped up min $10,000) or o 15 years regular contribution (min $2400 per annum for 15 years)
Copyright(C) 2013 Banner Financial Services Japan K.K. All Rights Reserved.
Private Healthcare vs. Japanese National Insurance
Private Healthcare insurance is not a replacement for Japanese national insurance (JNI) but rather something that many expats choose to have for a variety of reasons, which we see with many of our clients including some of your colleagues.
Some of the main reasons are:
1. Language, you are dealing with your health and many foreigners want to have this explained in their native language and if possible the option to have treatment in their home country.
2. 30% is not covered with JNI. One can take out a Private plan and know they are 100% covered.
3. What if? Sometimes bad things happen if you are on JNI and want to go home they will not pay for it you to send you home. This is what happened in the case below; in time he was sent back home as his family raised funds to get him back.
http://www.theprovince.com/news/Vancouver+teacher+family+just+wants+home+after+serious+head+injury+Japan/8578479/story.html
4. There are many who simply do not want to go to a Japanese hospital and wait in line all morning when they could go to an International clinic (who does not take JNI) and use private insurance like they are used to back home.
There are various levels of cover and each company has its own choices what it can offer its expatriate staff. Some offer comprehensive cover others just standard basic cover for the major medical. I would be happy to present options for your company if they are interested in looking further into employee benefits for the expatriate staff and their families.
For more detailed information, please visit our dedicated web page for insurance:
http://www.bannerjapan.com/insurance/
Copyright(C) 2013 Banner Financial Services Japan K.K. All Rights Reserved.

Article written by,
Jason De Herrera Adviser Banner Financial Services Japan K.K. 4F Esperanza Ebisu Bldg. 3-2-19 Ebisu Minami Shibuya-Ku, Tokyo 150-0022 Japan Tel (English): 03-5724-5100 Tel (日本語): 03-5724-5200 Fax: 03-5724-5300 E-mail: [email protected] Webpage: www.BannerJapan.com LinkedIn: jp.linkedin.com/in/jmdeherrera Blog: jmdeherrera-banner.blogspot.jp
Copyright(C) 2013 Banner Financial Services Japan K.K. All Rights Reserved.