Autumn 2020 Analyst Presentation
44
Autumn 2020 Analyst Presentation
Transcript of Autumn 2020 Analyst Presentation
Autumn 2020Analyst Presentation
2
Forward Looking Statements
This presentation contains statements that we believe are “forward-looking statements” within the meaning of the Private SecuritiesLitigation Reform Act of 1995. Forward-looking statements generally can be identified by the use of words such as “may,” “will,”“expect,” “intend,” “estimate,” “anticipate,” “believe,” “continue,” “ forecast,“ “guidance” or words of similar meaning. All forward-looking statements are subject to risks and uncertainties that could cause actual results to differ materially from those anticipated as ofthe date of this presentation. Important factors that could cause actual results to differ materially from these expectations include,among other things, the following: negative impacts to our businesses, including demand for our products, particularly commercialproducts, operations and workforce dislocation and disruption, supply chain disruption and liquidity as a result of the severity andduration of the COVID-19 pandemic; a failure to recover or further weakening of the Chinese economy and/or a failure to recover orfurther decline in the growth rate of consumer spending or housing sales in China; negative impact to our businesses frominternational tariffs and trade disputes; a failure to recover or further weakening in the high efficiency boiler market segment in theU.S.; significant volatility in raw material availability and prices; our inability to implement or maintain pricing actions; potentialweakening in U.S. residential or commercial construction or instability in our replacement markets; foreign currency fluctuations;inability to successfully integrate or achieve our strategic objectives resulting from acquisitions; competitive pressures on ourbusinesses; the impact of potential information technology or data security breaches; changes in government regulations or regulatoryrequirements; and adverse developments in general economic, political and business conditions in the key regions of the world.Forward-looking statements included in this presentation are made only as of the date of this presentation, and the company is underno obligation to update these statements to reflect subsequent events or circumstances. All subsequent written and oral forward-looking statements attributed to the company, or persons acting on its behalf, are qualified entirely by these cautionary statements.This presentation contains certain non-GAAP financial measures as that term is defined by the SEC. Non-GAAP financial measuresare generally identified by “Adjusted” (Adj.) or “Non-GAAP.”

3
Who We Are
GLOBAL MANUFACTURER of residential and commercial water heaters, boilers and water treatment products
23 Manufacturing Facilities
$3.0B Annual Sales
15,100 Employees

4
Compelling Investment Thesis
Market leader Stable/growing U.S. replacement market; operating leverage from incremental new construction and replacement
Strength of premium brand, distribution, manufacturing and innovation provide clear market advantage in China
5 year adjusted EPS CAGR through 2019 = 12.7%
5 year dividend CAGR through 2019 = 24.5%
5 year cumulative cash returned to shareholders from dividends and shares repurchased = $1.4 billion
Strong balance sheet and cash flow to support future growth, share repurchase and acquisitions
5
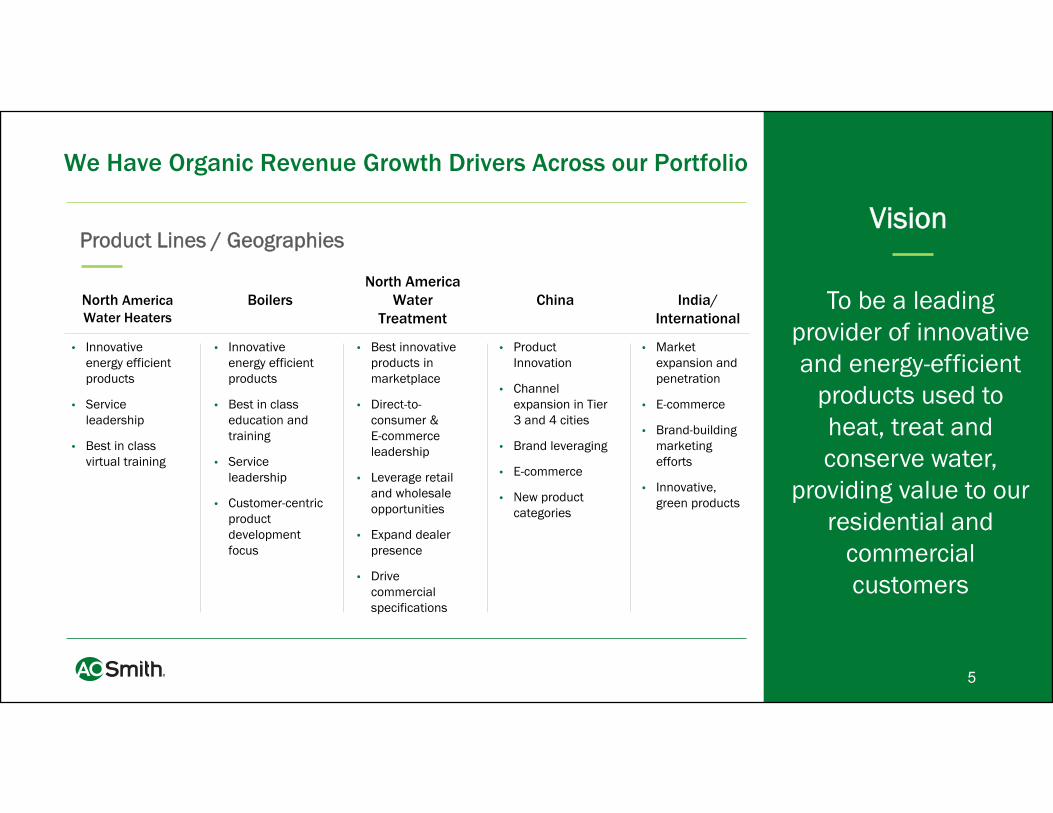
We Have Organic Revenue Growth Drivers Across our Portfolio
• Innovative energy efficient products
• Service leadership
• Best in class virtual training
• Innovative energy efficient products
• Best in class education and training
• Service leadership
• Customer-centric product development focus
• Best innovative products in marketplace
• Direct-to-consumer & E-commerce leadership
• Leverage retail and wholesale opportunities
• Expand dealer presence
• Drive commercial specifications
• Product Innovation
• Channel expansion in Tier 3 and 4 cities
• Brand leveraging
• E-commerce
• New product categories
• Market expansion and penetration
• E-commerce
• Brand-building marketing efforts
• Innovative, green products
To be a leading provider of innovative and energy-efficient
products used to heat, treat and conserve water,
providing value to our residential and
commercial customers
VisionProduct Lines / Geographies
North America Water Heaters
BoilersNorth America
Water Treatment
China India/International
6
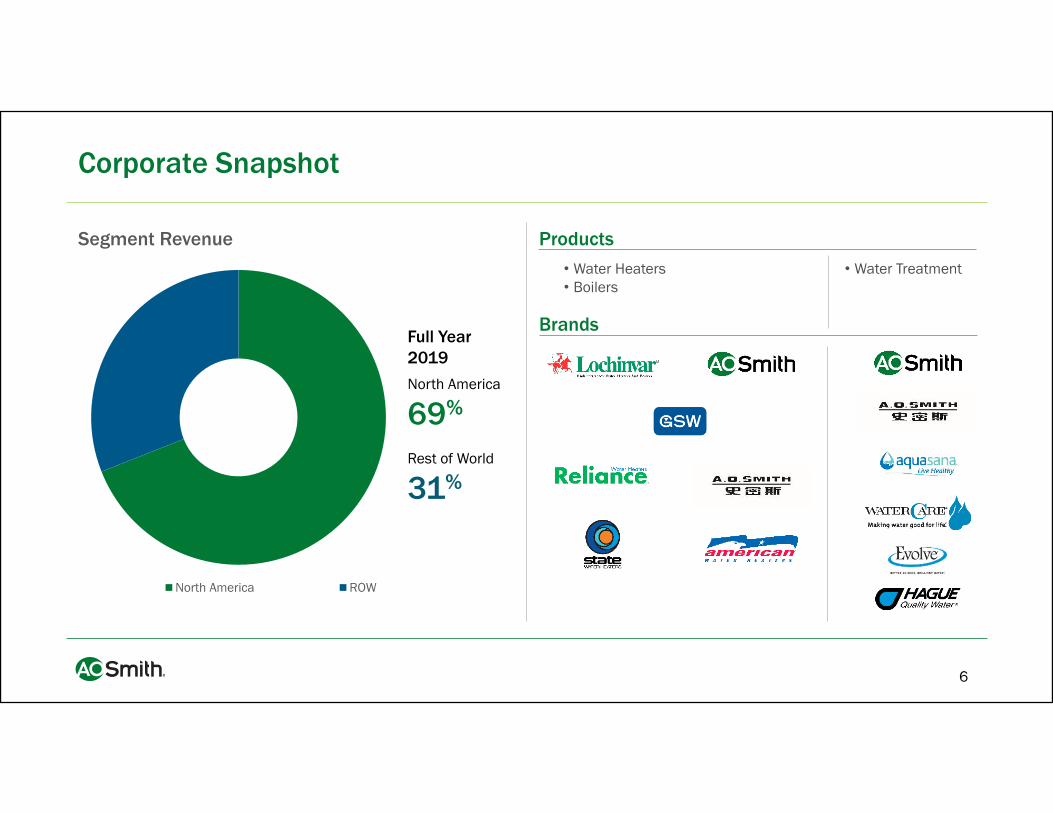
Corporate Snapshot
Brands
North America ROW
North America
69%
Rest of World
31%
Full Year 2019
Segment Revenue Products
• Water Heaters• Boilers
• Water Treatment

7
Leading Market Share in the U.S. Water Heater Market Segment1
OtherOther
Residential Market2019 market share data (AHRI + tankless)
Commercial Market2
2019 market share data (AHRI)
0%
10%
20%
30%
40%
50%
60%
A O Smith Rheem Bradford White Other
1 AOS actual shipments and AOS estimates of competitors’ shipments2 Commercial water heater segment as defined by AHRI, total 2019 commercial units as reported by AHRI = 239,000 units
0%
10%
20%
30%
40%
A O S ith Rh B df d Whit Oth
8
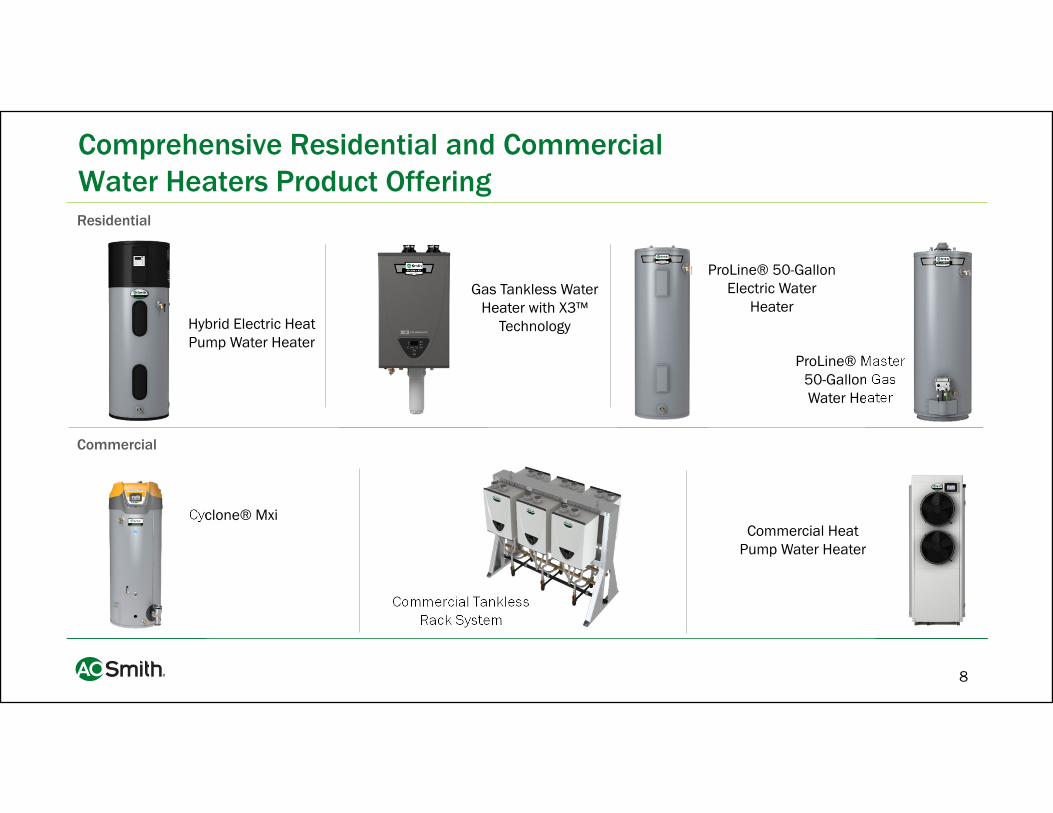
Comprehensive Residential and Commercial Water Heaters Product Offering
Hybrid Electric Heat Pump Water Heater
Residential
Commercial
Gas Tankless Water Heater with X3™
Technology
ProLine® Master 50-Gallon Gas Water Heater
Cyclone® Mxi
Commercial Tankless Rack System
Commercial Heat Pump Water Heater
ProLine® 50-Gallon Electric Water
Heater
9
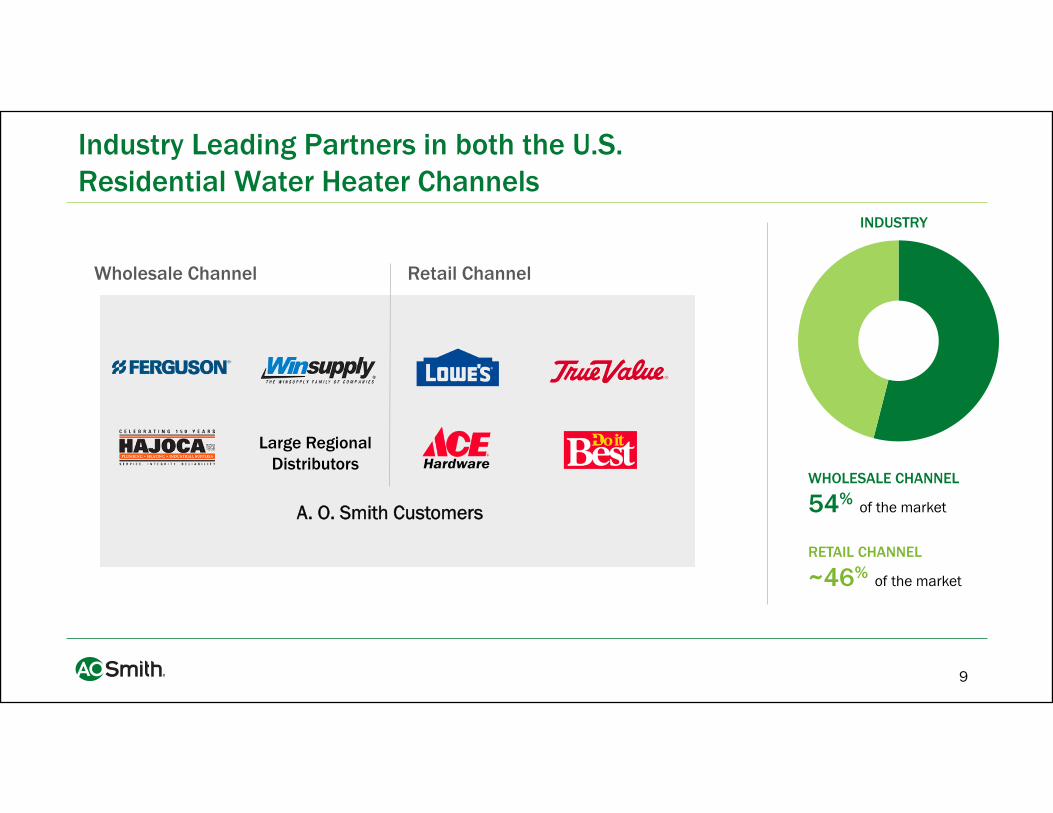
Industry Leading Partners in both the U.S. Residential Water Heater Channels
WHOLESALE CHANNEL
54% of the market
RETAIL CHANNEL
~46% of the market
Wholesale Channel Retail Channel
Large Regional Distributors
A. O. Smith Customers
INDUSTRY
10
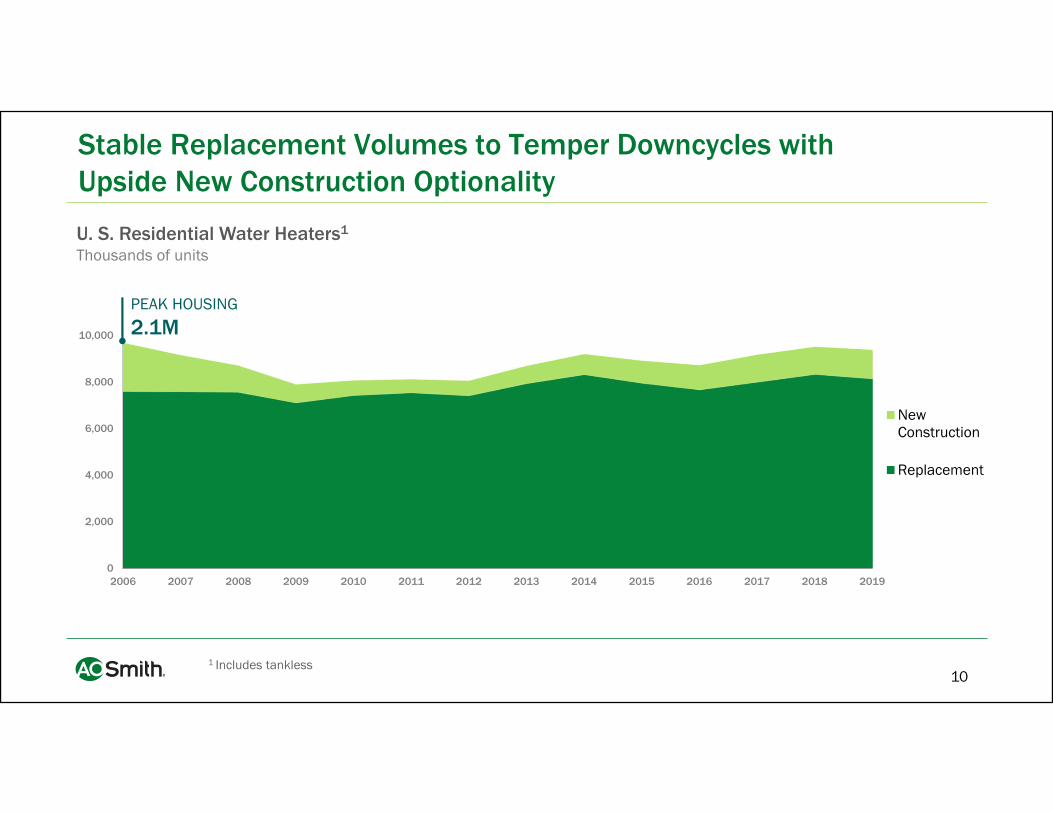
Stable Replacement Volumes to Temper Downcycles withUpside New Construction Optionality
0
2,000
4,000
6,000
8,000
10,000
2006 2007 2008 2009 2010 2011 2012 2013 2014 2015 2016 2017 2018 2019
NewConstruction
Replacement
PEAK HOUSING
2.1M
1 Includes tankless
U. S. Residential Water Heaters1
Thousands of units
11
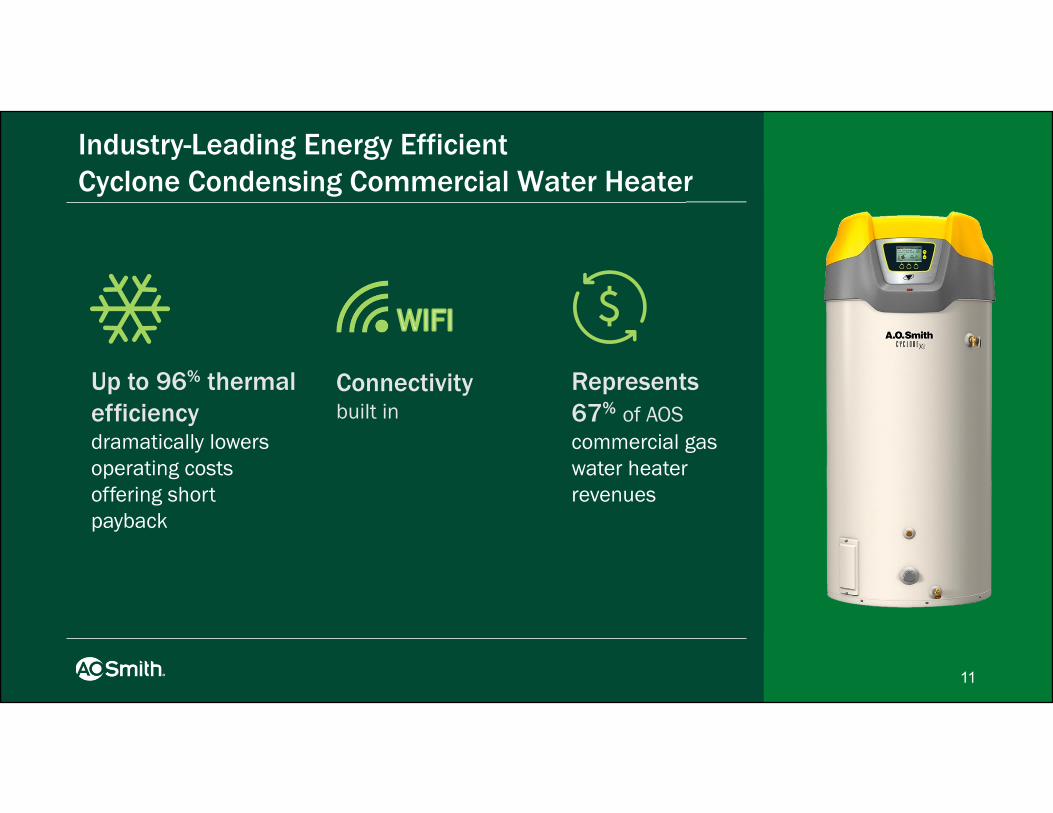
Industry-Leading Energy EfficientCyclone Condensing Commercial Water Heater
Up to 96% thermal efficiency dramatically lowers operating costs offering short payback
Represents 67% of AOS commercial gas water heater revenues
Connectivity built in
12
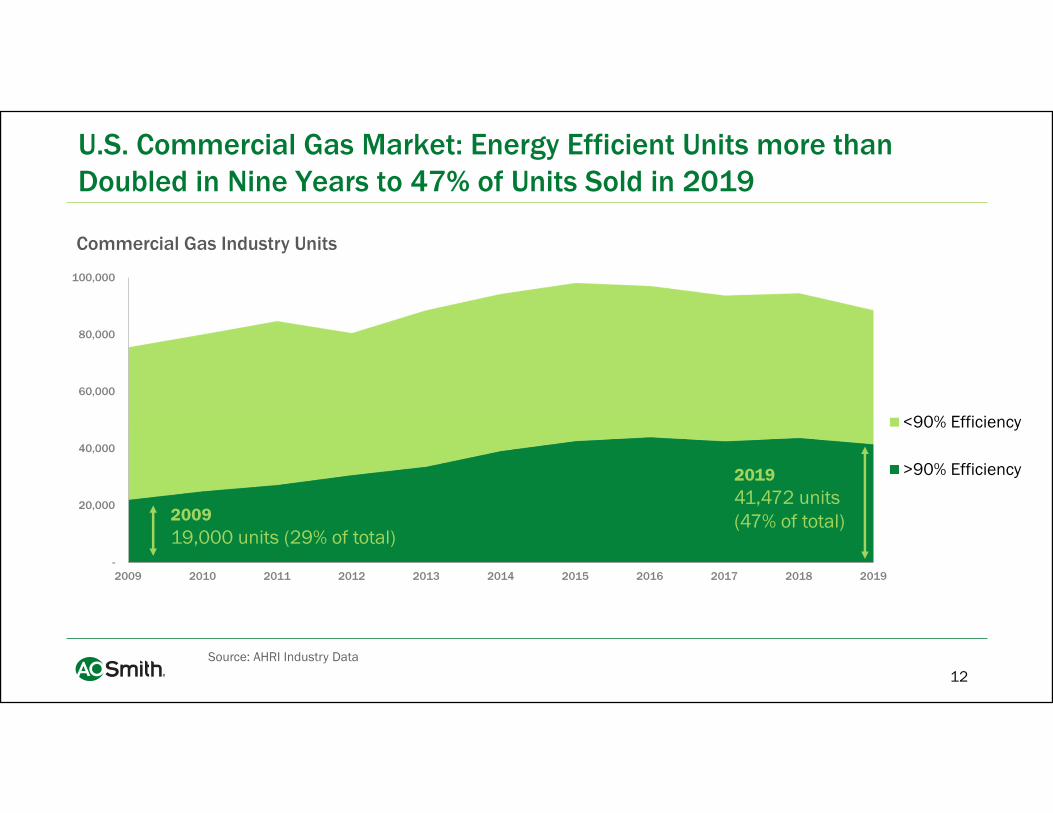
U.S. Commercial Gas Market: Energy Efficient Units more than Doubled in Nine Years to 47% of Units Sold in 2019
-
20,000
40,000
60,000
80,000
100,000
2009 2010 2011 2012 2013 2014 2015 2016 2017 2018 2019
<90% Efficiency
>90% Efficiency
200919,000 units (29% of total)
201941,472 units(47% of total)
Commercial Gas Industry Units
Source: AHRI Industry Data

13
Industry trending to Higher Efficiency Condensing Boilers Drives Past and Future Growth
90%
10%
Condensing Non-Condensing
0
10,000
20,000
30,000
40,000
50,000
60,000
70,000
80,000
90,000
100,000
2006 2007 2008 2009 2010 2011 2012 2013 2014 2015 2016 2017 2018 2019
Condensing Commercial Boilers Non-Condensing Commercial Boilers
NA Boiler Volumes
Source: 2006 to 2017: BRG Solutions; 2018-2019: AOS estimates
A. O. Smith Boiler Sales
14
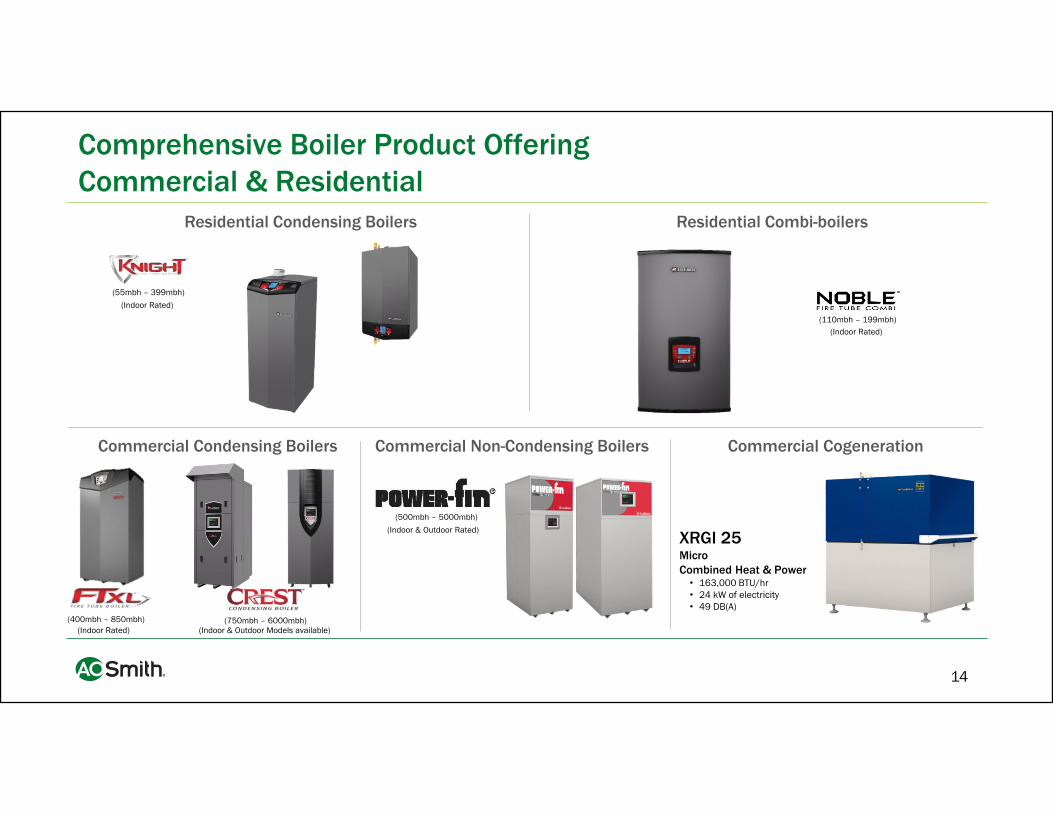
Comprehensive Boiler Product OfferingCommercial & Residential
Residential Condensing Boilers
(Indoor Rated)
(55mbh – 399mbh)
(110mbh – 199mbh)(Indoor Rated)
Residential Combi-boilers
(750mbh – 6000mbh)(Indoor & Outdoor Models available)
Commercial Condensing Boilers Commercial Non-Condensing Boilers
(500mbh – 5000mbh)
(Indoor & Outdoor Rated)XRGI 25MicroCombined Heat & Power• 163,000 BTU/hr• 24 kW of electricity• 49 DB(A)
Commercial Cogeneration
(400mbh – 850mbh)(Indoor Rated)
15
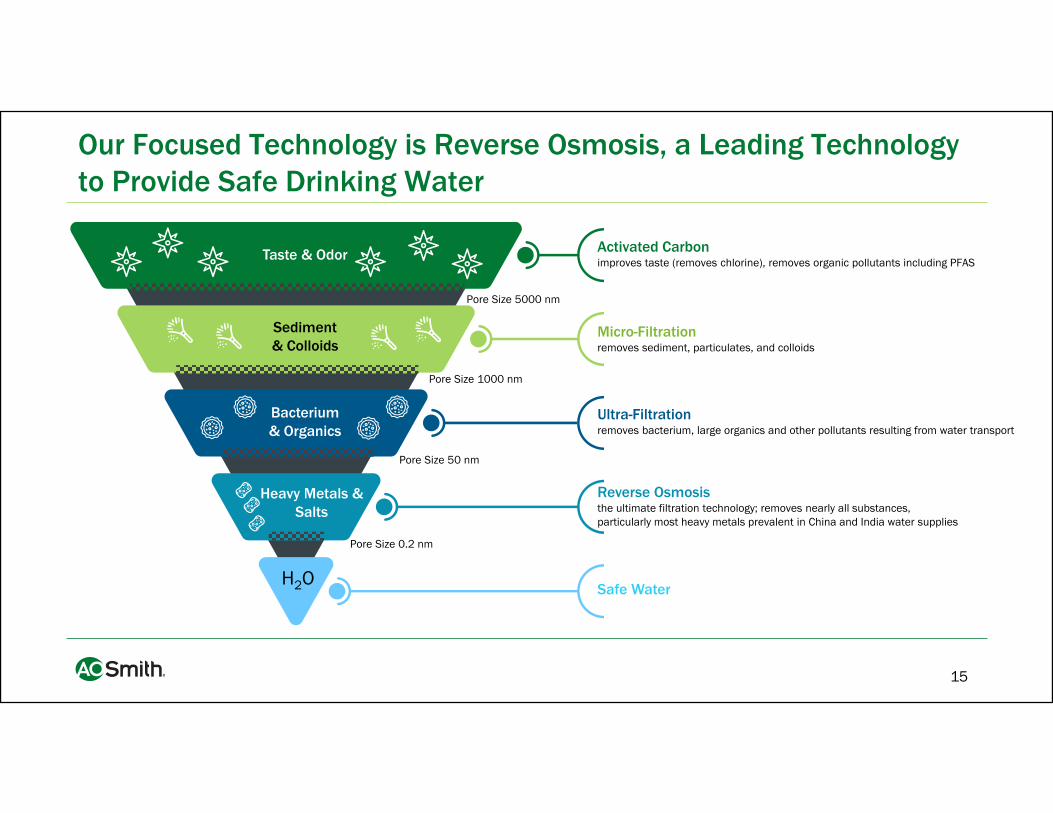
Our Focused Technology is Reverse Osmosis, a Leading Technology to Provide Safe Drinking Water
Taste & Odor
Pore Size 5000 nm
Activated Carbonimproves taste (removes chlorine), removes organic pollutants including PFAS
Sediment & Colloids
Pore Size 1000 nm
Micro-Filtration removes sediment, particulates, and colloids
Bacterium & Organics
Pore Size 50 nm
Ultra-Filtrationremoves bacterium, large organics and other pollutants resulting from water transport
Heavy Metals & Salts
Pore Size 0.2 nm
Reverse Osmosis the ultimate filtration technology; removes nearly all substances, particularly most heavy metals prevalent in China and India water supplies
Safe WaterH2O

16
2009 2010 2011 2012 2013 2014 2015 2016 2017 2018 2019
Inorganic Revenue
Organic Revenue
Evolution of AOS’ Global Water Treatment Business
35%CAGR over the last 10 years
Acquired Chanitex
Launched AOS branded WT in China
Purchased MIM, WT company in
Turkey
Launched AOS branded WT in India
Purchased Aquasana &
launched AOS branded WT in Vietnam
Purchased Hague
Launched AOS branded WT at
Lowe's
Purchased Water-Right
Revenue$ in millions
$20 $20 $35 $38$69
$97$134
$250
$322
$397
$458
17
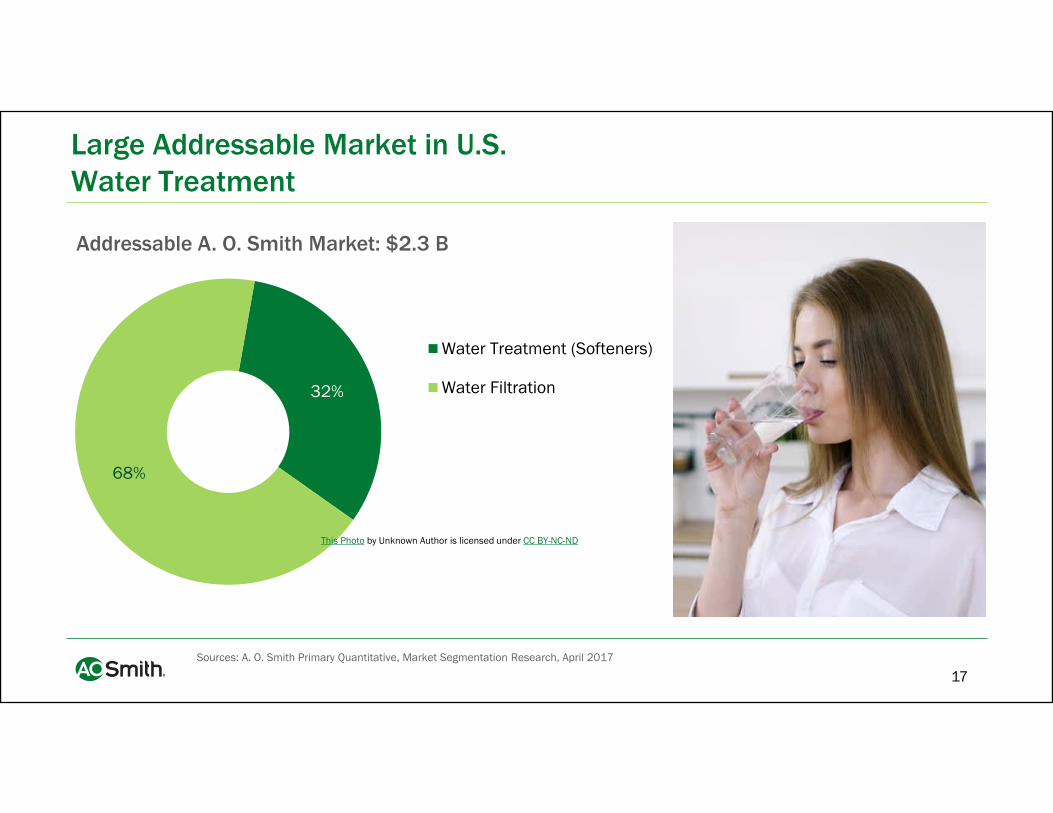
Large Addressable Market in U.S. Water Treatment
32%
68%
Water Treatment (Softeners)
Water Filtration
Addressable A. O. Smith Market: $2.3 B
Sources: A. O. Smith Primary Quantitative, Market Segmentation Research, April 2017
This Photo by Unknown Author is licensed under CC BY-NC-ND
18
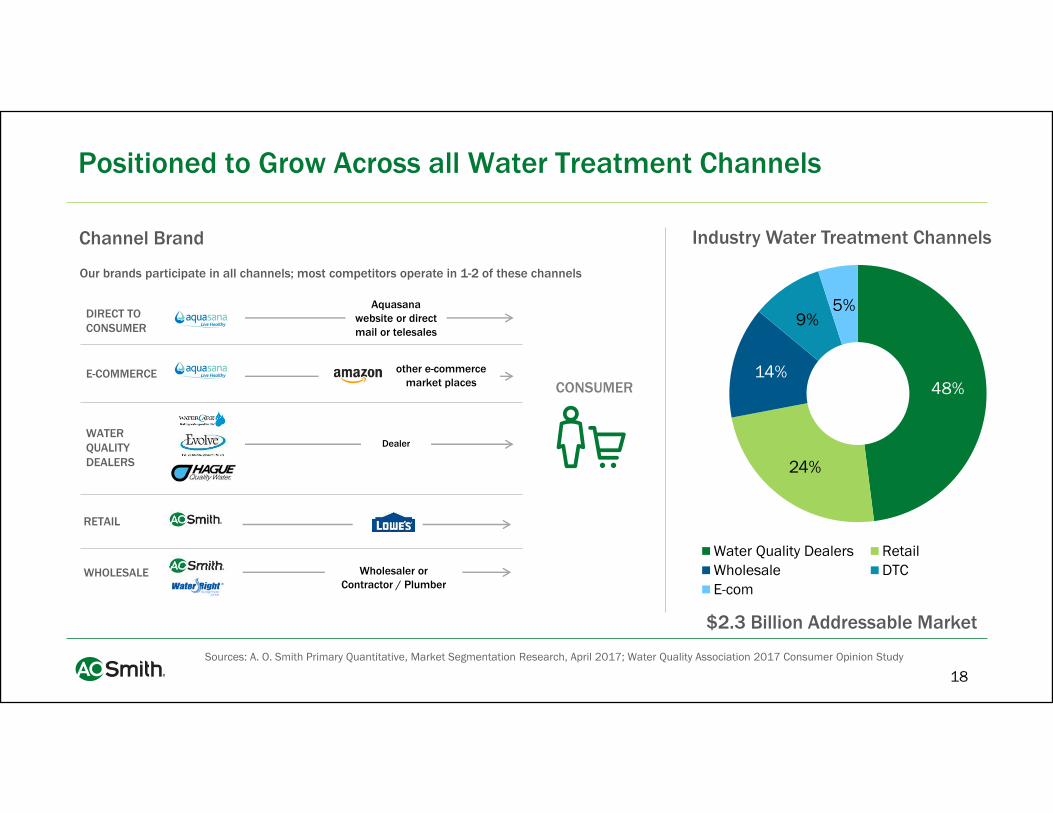
Positioned to Grow Across all Water Treatment Channels
Channel Brand Industry Water Treatment Channels
48%
24%
14%
9%5%
Water Quality Dealers RetailWholesale DTCE-com
Our brands participate in all channels; most competitors operate in 1-2 of these channels
CONSUMER
RETAIL
WHOLESALE Wholesaler orContractor / Plumber
DIRECT TO CONSUMER
E-COMMERCE
WATER QUALITY DEALERS
Aquasanawebsite or direct mail or telesales
other e-commerce market places
Dealer
Sources: A. O. Smith Primary Quantitative, Market Segmentation Research, April 2017; Water Quality Association 2017 Consumer Opinion Study
$2.3 Billion Addressable Market

19
Comprehensive Water Treatment Product Offering for the Entire Home
Whole Home Filtration
Tankless RO Systems
Traditional RO Systems
Under Sink Filtration
Point of Entry Products Point of Use Products
Whole Home Softeners
Whole Kitchen Filtration
Non-Installed Products
Clean Water Machine
On-the-Go Filter Bottles

20
AOS China Built On
Premium Brand
Extensive Distribution and Service Network
Innovative New Products and World Class Manufacturing
Local Management Team and Organizational Development

21
Growing Product Portfolio Developed in China for China
Electric & Gas Water Heaters Water Treatment Other Categories
Electric Water
Heaters
Gas Water Heater
Range Hood
Air Purifier
Water Purifiers
22
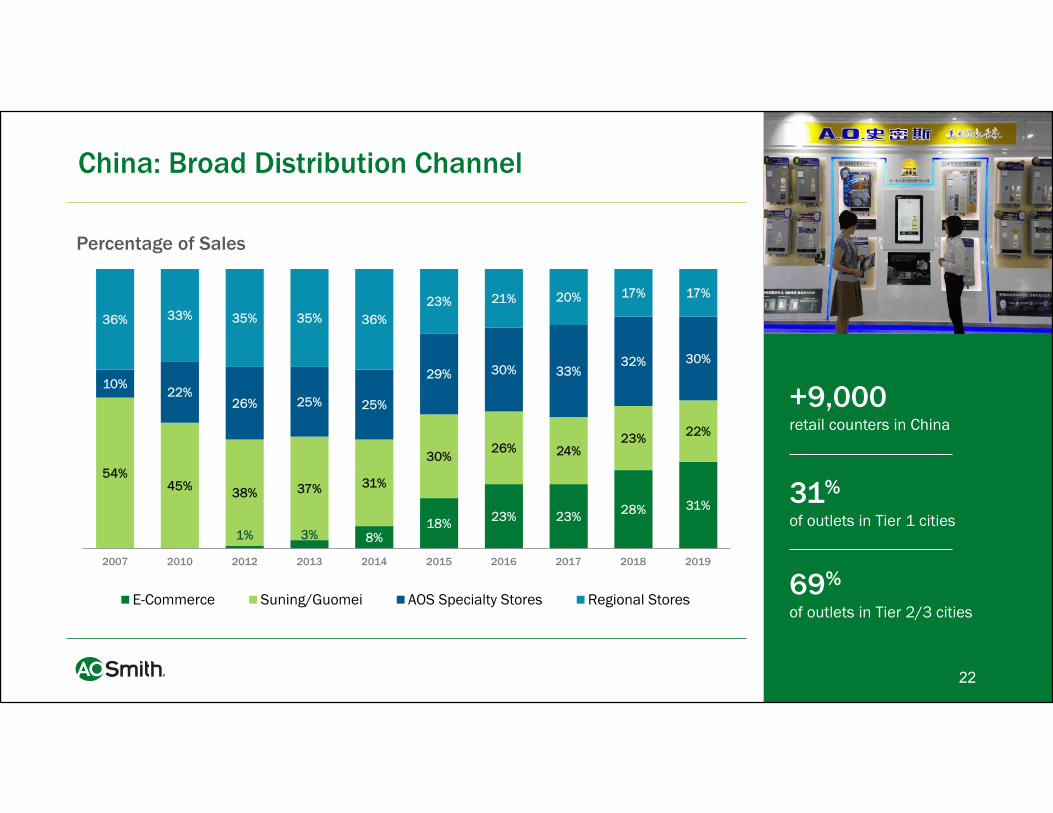
China: Broad Distribution Channel
Percentage of Sales
+9,000 retail counters in China
31%
of outlets in Tier 1 cities
69%
of outlets in Tier 2/3 cities
1% 3% 8%18% 23% 23% 28% 31%
54%45% 38% 37% 31%
30%26% 24%
23% 22%
10%22%
26% 25% 25%
29% 30% 33%32% 30%
36% 33% 35% 35% 36%23% 21% 20% 17% 17%
2007 2010 2012 2013 2014 2015 2016 2017 2018 2019
E-Commerce Suning/Guomei AOS Specialty Stores Regional Stores

23
China: Mega Trends Driving Growth
TRENDS A. O. SMITH
On-line shopping is growing in China
We are positioned to reach consumers using the internet
Middle and affluent classes are growing
Our Market Leading Premium Consumer brand is positioned for the middle and affluent classes
Urbanization in China projected to drive 28%1 of all global growth! A. O. Smith has manufacturing capacity and channel footprint
to capitalize on continued household formation
1 Source: IMF 2019 to 2024, October 2019

24
China: Market Leader in Water Heating and Water Treatment
0%
5%
10%
15%
20%
25%
30%
2009 2010 2011 2012 2013 2014 2015 2016 2017 2018 2019
A.O.Smith Haier Midea Macro Wanhe
Rinnai Noritz Ariston Sakura Siemens
Water Heater Market Share
Leading residential brands measured in currency; Tier One Market: 2009 - 2018 CMM; 2019 FEB – CMM data sampling several thousand largest retail stores, December 2018Data Source: 2012 - 2018 CMM; 2019 FEB retail
0%
10%
20%
30%
40%
50%
2011 2012 2013 2014 2015 2016 2017 2018 2019
A. O. Smith Midea Qinyuan
Angel 3M Haier
Water Treatment Market Share
25
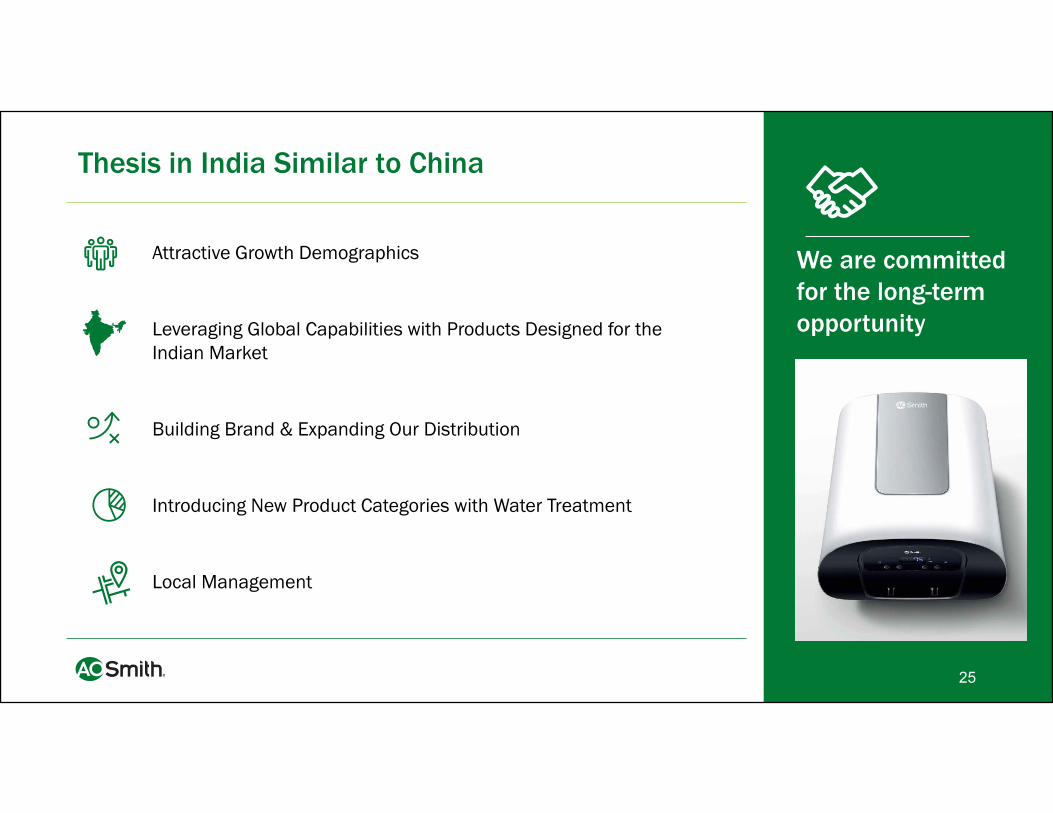
Attractive Growth Demographics
Leveraging Global Capabilities with Products Designed for the Indian Market
Building Brand & Expanding Our Distribution
Introducing New Product Categories with Water Treatment
Local Management
Thesis in India Similar to China
We are committed for the long-term opportunity

26
India: Geographic Presence Build out from 2008 through 2019
A Class Cities (pop >1.5 Mn)Distribution in 25 out of 25 cities
B Class Cities (pop .5 to 1.5 Mn)Distribution in 63 out of 68 cities
C Class Cities (pop .1 to.5 Mn)Distribution in 316 out of 400 cities
National Retailers
Regional Retailers
Headquarter & Manufacturing(Bengaluru)
High Distribution Location
New Delhi
Ludhiana
Agra
Kanpur LucknowGuwahati
Patna
Kolkata
Mumbai
Pune HyderabadVisakhapatnam
Chennai
AhmedabadSurat
Bhopal
Jaipur
Indore
Coimbatore
Bengaluru

27
Driving Financial Performance and Delivering Significant Growth
$0.0
$0.5
$1.0
$1.5
$2.0
$2.5
$3.0
$3.5
2010 2011 2012 2013 2014 2015 2016 2017 2018 2019
8%CAGR
$0
$100
$200
$300
$400
$500
$600
$700
2010 2011 2012 2013 2014 2015 2016 2017 2018 2019
Adjusted EBITDA2010 10.6% of Sales2019 18.7% of Sales
$0.0
$0.5
$1.0
$1.5
$2.0
$2.5
2010 2011 2012 2013 2014 2015 2016 2017 2018 2019
1 2010 through 2014 adjusted for non-operating pension costs and certain non-recurring items2 2010 through 2014 adjusted for non-operating pension costs and certain non-recurring items; 2017 adjusted for U.S. Tax Reform expense; 2018 adjusted for restructuring & impairment expenses
Sales GrowthSales in billions
Adjusted EBITDA1 Adjusted Earnings Per Share2
15%CAGR 21%
CAGR

28
Cash Returned to Shareholders:~$1.4B last Five Years
1 Subject to price, alternative investments and working capital requirements28
$0
$50
$100
$150
$200
$250
$300
$350
$400
$450
$500
2015 2016 2017 2018 2019
Dividends Share Repurchase
$195.9$219.4
$236
$332.7
$436.9
$ in millions

29
M&A Criteria and Focus
Accretive to earnings in the
first year
ROIC in excess of cost of capital by
third year
Meet risk adjusted IRR hurdle rates
Margin accretion with growth rates higher than U.S.
GDP
Geographic Growth High Growth Markets
Expand / Grow the CoreNew Products & New Technologies
Water Heating
Water Treatment
Adjacencies Water-themed
platforms for growth
Leverage channels and brands
29

30
Compelling Investment Thesis
Market leader Stable/growing U.S. replacement market; operating leverage from incremental new construction and replacement
Strength of premium brand, distribution, manufacturing and innovation provide clear market advantage in China
5 year adjusted EPS CAGR through 2019 = 12.7%
5 year dividend CAGR through 2019 = 24.5%
5 year cumulative cash returned to shareholders from dividends and shares repurchased = $1.4 billion
Strong balance sheet and cash flow to support future growth, share repurchase and acquisitions
31
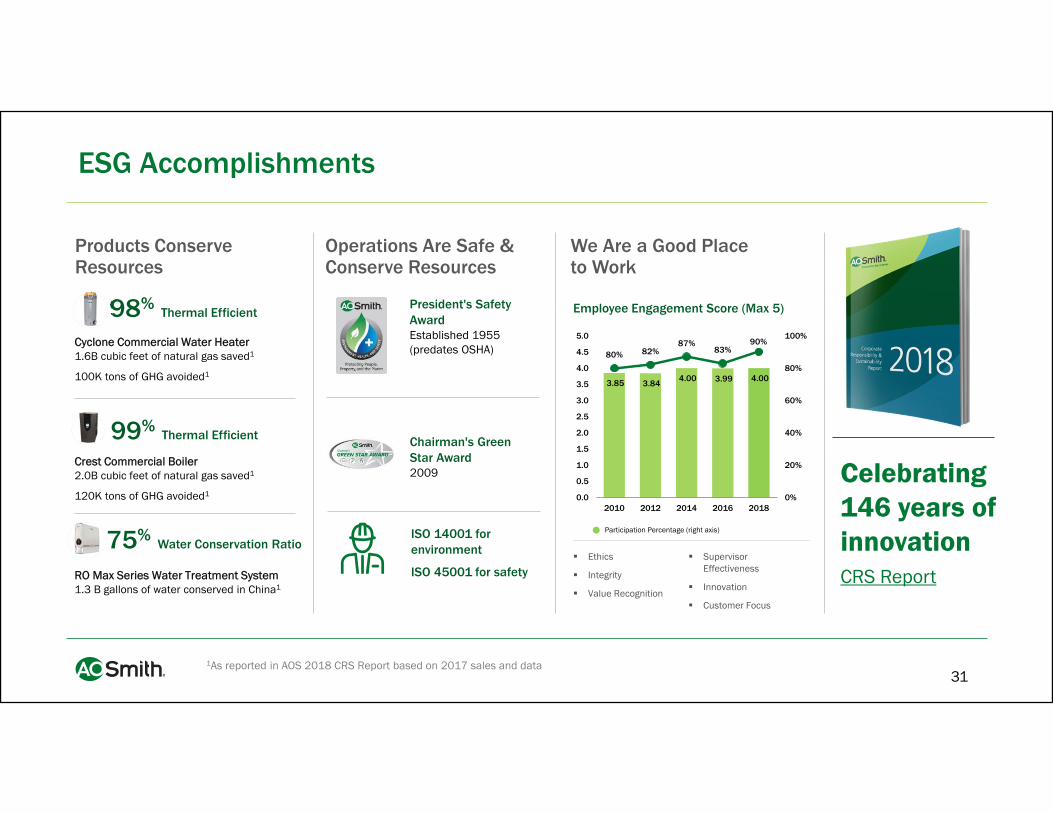
ESG Accomplishments
Celebrating 146 years of innovationCRS Report
Products Conserve Resources
Operations Are Safe & Conserve Resources
We Are a Good Place to Work
RO Max Series Water Treatment System1.3 B gallons of water conserved in China1
75%Water Conservation Ratio
Crest Commercial Boiler2.0B cubic feet of natural gas saved1
120K tons of GHG avoided1
99%Thermal Efficient
Cyclone Commercial Water Heater1.6B cubic feet of natural gas saved1
100K tons of GHG avoided1
98%Thermal Efficient
President's Safety Award Established 1955 (predates OSHA)
Chairman's Green Star Award2009
ISO 14001 for environment
ISO 45001 for safety
Employee Engagement Score (Max 5)
3.85 3.84 4.00 3.99 4.00
80% 82%87%
83%90%
0%
20%
40%
60%
80%
100%
0.0
0.5
1.0
1.5
2.0
2.5
3.0
3.5
4.0
4.5
5.0
2010 2012 2014 2016 2018
Participation Percentage (right axis)
Ethics
Integrity
Value Recognition
Supervisor Effectiveness
Innovation
Customer Focus
1As reported in AOS 2018 CRS Report based on 2017 sales and data

32
•Q3 20 Results
33
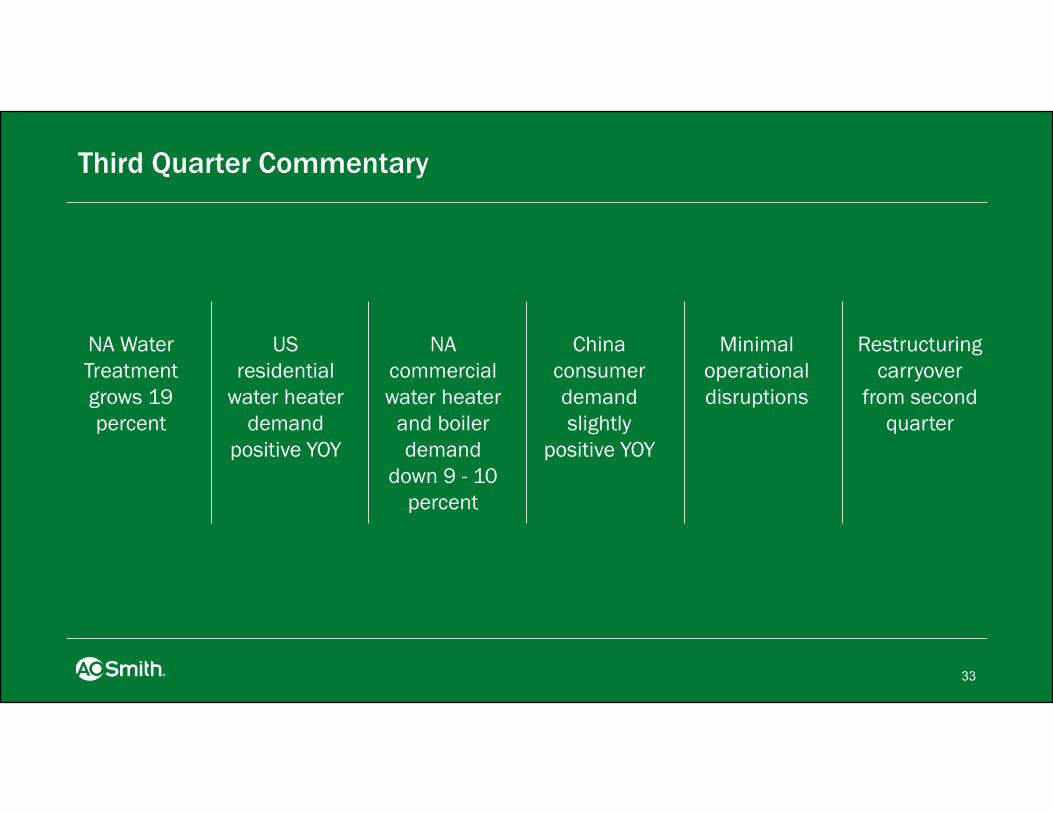
Third Quarter Commentary
US residential
water heater demand
positive YOY
NA Water Treatment grows 19 percent
NA commercial water heater
and boiler demand
down 9 - 10 percent
Minimal operational disruptions
China consumer demand slightly
positive YOY
Restructuring carryover
from second quarter

34
Third Quarter Results
2020 2019 Change % Change
Sales $ 760.0 $ 728.2 $ 31.8 4%
Net Earnings $ 105.4 $ 87.3 $ 18.1 21%
Severance and Restructuring Expenses 1.3 -
Adjusted Earnings $ 106.7 $ 87.3 $ 19.4 22%
EPS $ 0.65 $ 0.53 $ 0.12 23%
Severance and Restructuring Expenses 0.01 -
Adjusted EPS $ 0.66 $ 0.53 $ 0.13 25%
$ in millions except per share data
35
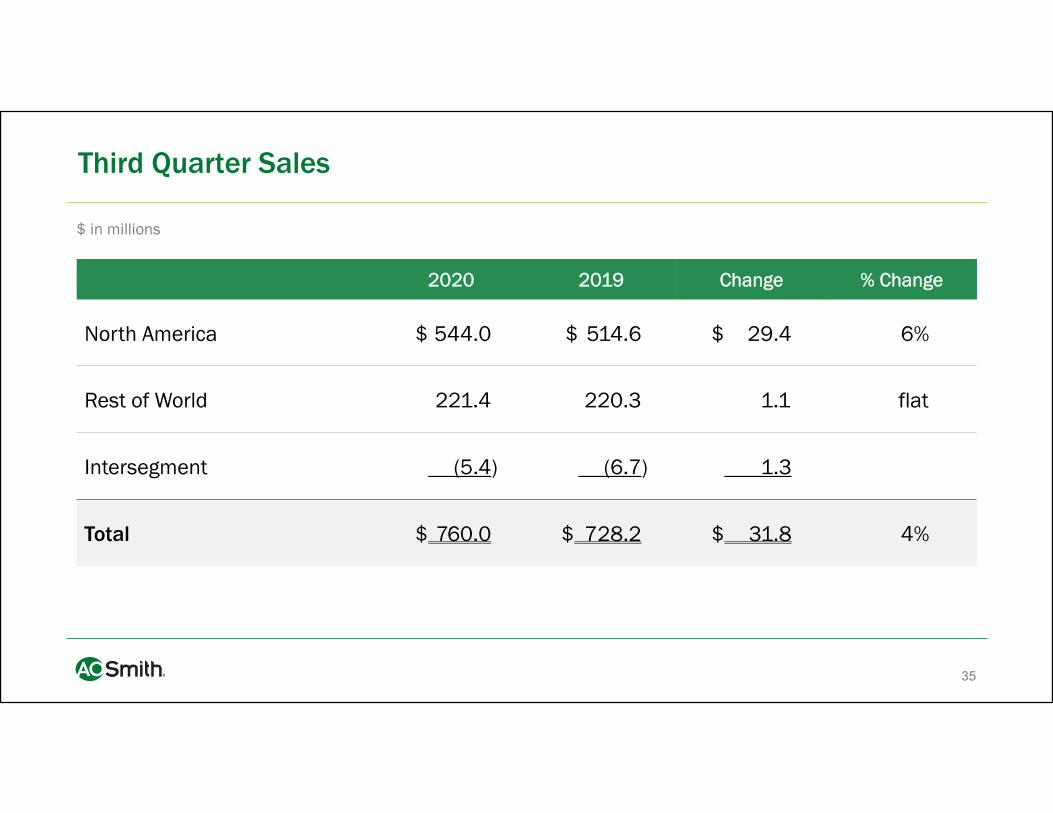
Third Quarter Sales
2020 2019 Change % Change
North America $ 544.0 $ 514.6 $ 29.4 6%
Rest of World 221.4 220.3 1.1 flat
Intersegment (5.4) (6.7) 1.3
Total $ 760.0 $ 728.2 $ 31.8 4%
$ in millions

36
Third Quarter Adjusted Earnings
2020 2019 Change % Change
Adjusted Segment Earnings
North America $ 133.6 $ 121.6 $ 12.0 10%
Rest of World 17.8 4.1 13.7 334%
Total Adjusted Earnings 151.4 125.7 25.7 20%
Corporate (10.9) (9.8) (1.1) -11%
Interest Expense (1.6) (3.1) 1.5 48%
Adjusted Pre-tax Earnings 138.9 112.8 26.1 23%
Adjusted Tax Provision (32.2) (25.5) (6.7)
Adjusted Earnings $ 106.7 $ 87.3 $ 19.4 22%
Adjusted Segment Margin
North America 24.6% 23.6 %
Rest of World 8.0% 1.9 %
$ in millions
Note: North America adjusted segment earnings and ROW adjusted segment earnings exclude $0.5 million and $1.1 million, respectively, of pre-tax severance and restructuring expenses.
37
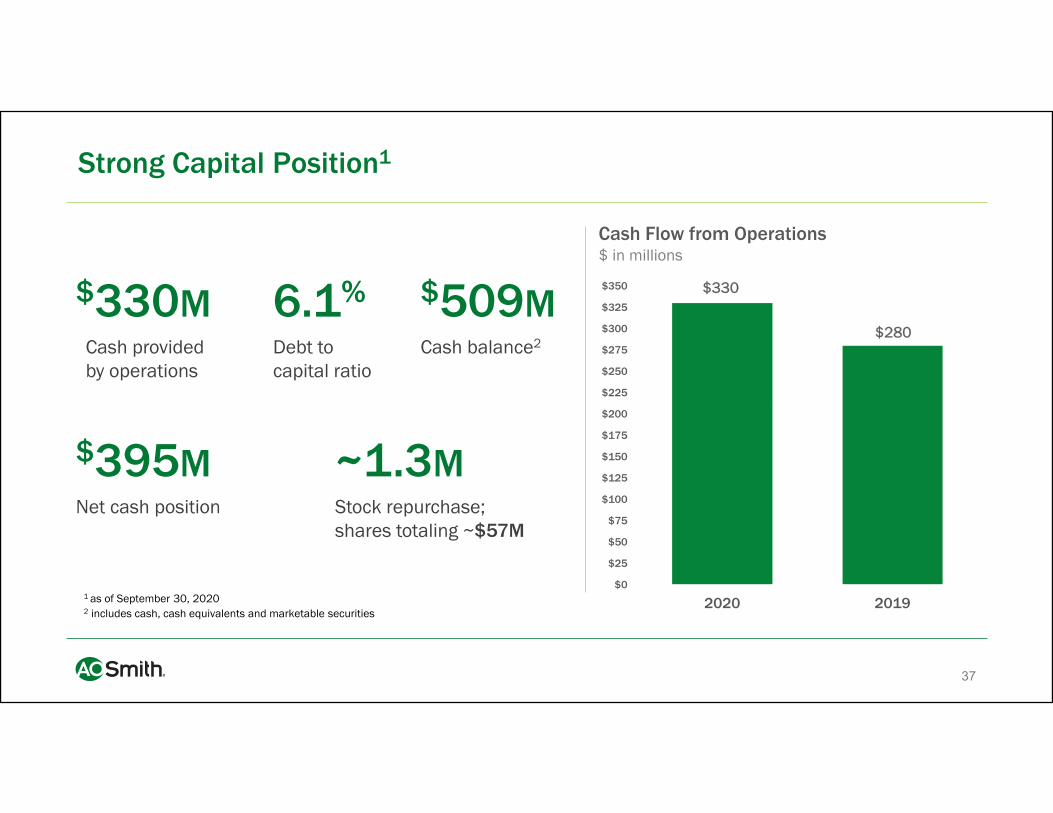
Strong Capital Position1
$330
$280
$0
$25
$50
$75
$100
$125
$150
$175
$200
$225
$250
$275
$300
$325
$350
2020 2019
$330MCash provided by operations
6.1%
Debt to capital ratio
$509MCash balance2
$395MNet cash position
~1.3MStock repurchase; shares totaling ~$57M
Cash Flow from Operations$ in millions
1 as of September 30, 20202 includes cash, cash equivalents and marketable securities
38
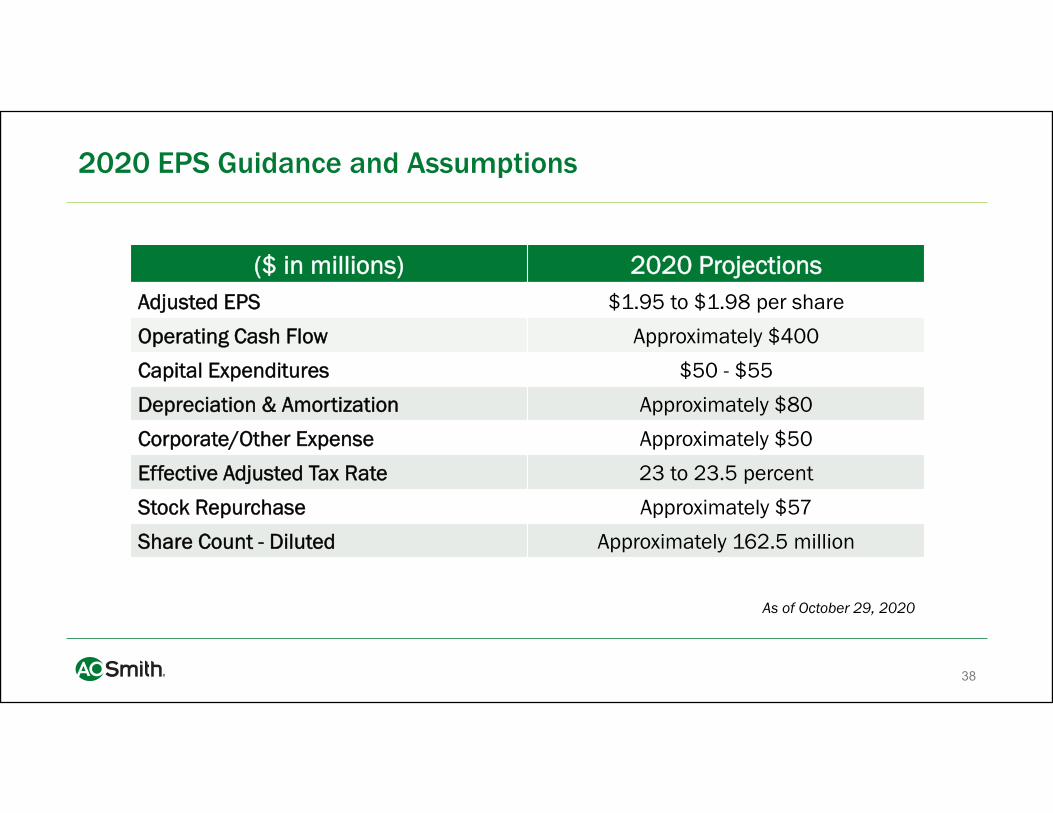
2020 EPS Guidance and Assumptions
As of October 29, 2020
($ in millions) 2020 ProjectionsAdjusted EPS $1.95 to $1.98 per share
Operating Cash Flow Approximately $400
Capital Expenditures $50 - $55
Depreciation & Amortization Approximately $80
Corporate/Other Expense Approximately $50
Effective Adjusted Tax Rate 23 to 23.5 percent
Stock Repurchase Approximately $57
Share Count - Diluted Approximately 162.5 million
39
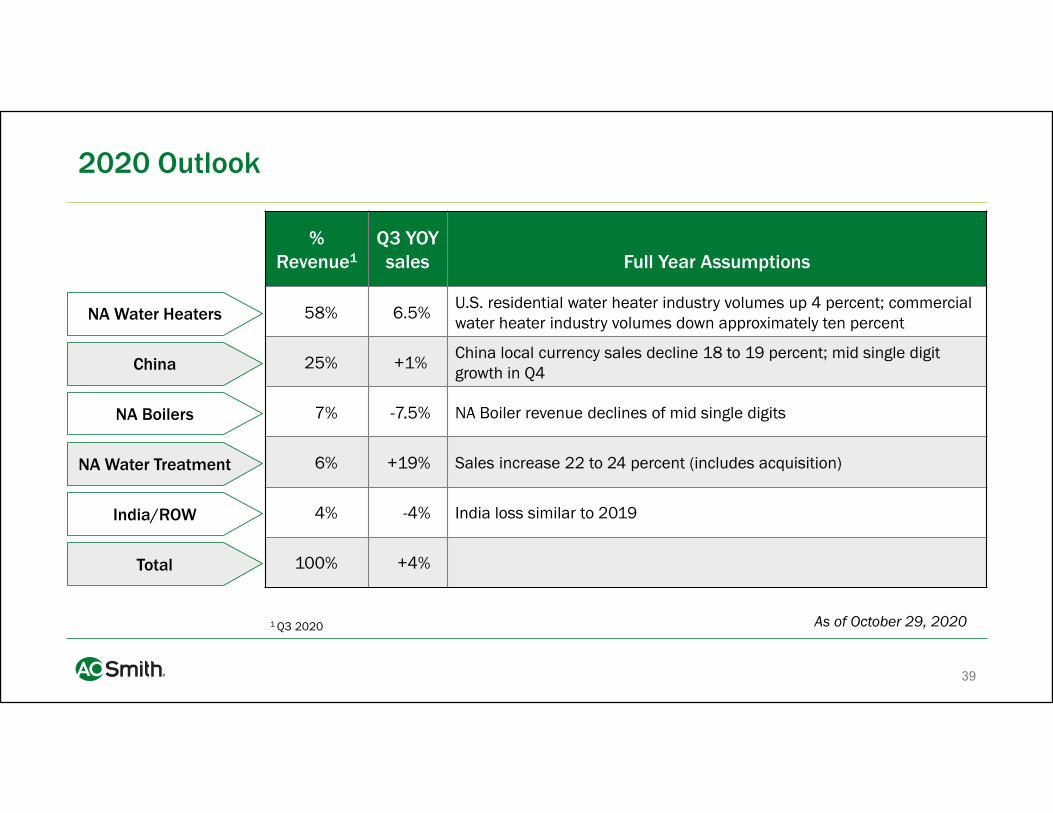
2020 Outlook
% Revenue1
Q3 YOY sales Full Year Assumptions
58% 6.5%U.S. residential water heater industry volumes up 4 percent; commercial water heater industry volumes down approximately ten percent
25% +1%China local currency sales decline 18 to 19 percent; mid single digit growth in Q4
7% -7.5% NA Boiler revenue declines of mid single digits
6% +19% Sales increase 22 to 24 percent (includes acquisition)
4% -4% India loss similar to 2019
100% +4%
NA Water Heaters
China
NA Boilers
NA Water Treatment
India/ROW
Total
1 Q3 2020 As of October 29, 2020

40
2020 Outlook
• Revenue declines of 6 to 7 percent
• North America segment margin expected to be 23 to 23.5 percent
• Rest of World segment margin expected to be -1 to -2 percent
As of October 29, 2020

41
Adjusted Earnings and Adjusted EPS
Net Earnings (GAAP) $ 105.4 $ 87.3 $ 224.9 $ 278.7Severance and restructuring expenses, before tax 1.6 - 7.7 -Tax effect of severance and restructuring expenses (0.3) - (1.4) -
Adjusted Earnings $ 106.7 $ 87.3 $ 231.2 $ 278.7
Diluted EPS (GAAP) $ 0.65 $ 0.53 $ 1.38 $ 1.66Severance and restructuring expenses per diluted share, before tax 0.01 - 0.05 -Tax effect of severance and restructuring expenses per diluted share - - (0.01) -
Adjusted EPS $ 0.66 $ 0.53 $ 1.42 $ 1.66
The following is a reconciliation of net earnings and diluted EPS to adjusted earnings (non-GAAP) and adjusted EPS (non-GAAP): 2020 2019
Three Months EndedSeptember 30,
2020 2019
Nine Months EndedSeptember 30,
(dollars in millions, except per share data)
42
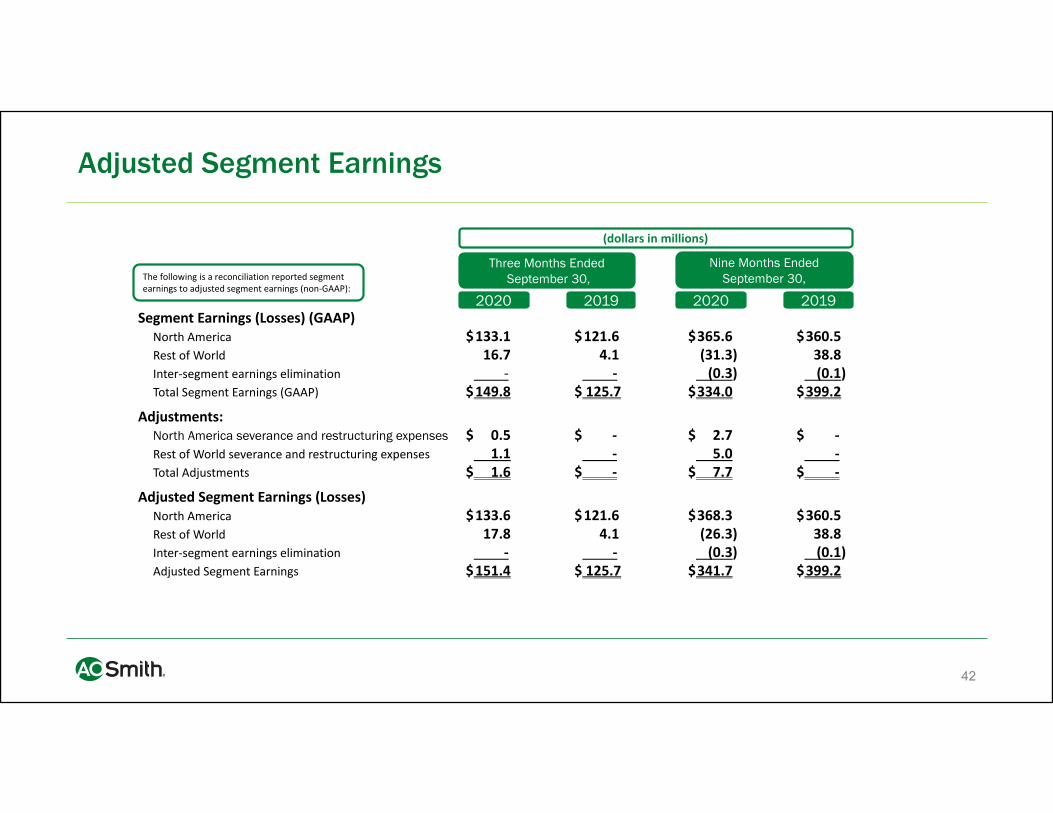
Adjusted Segment Earnings
The following is a reconciliation reported segment earnings to adjusted segment earnings (non‐GAAP):
2020 2019
Three Months EndedSeptember 30,
2020 2019
Nine Months EndedSeptember 30,
Segment Earnings (Losses) (GAAP)North America $133.1 $121.6 $365.6 $360.5Rest of World 16.7 4.1 (31.3) 38.8Inter‐segment earnings elimination ‐ ‐ (0.3) (0.1)Total Segment Earnings (GAAP) $149.8 $ 125.7 $334.0 $399.2
Adjustments:North America severance and restructuring expenses $ 0.5 $ ‐ $ 2.7 $ ‐Rest of World severance and restructuring expenses 1.1 ‐ 5.0 ‐Total Adjustments $ 1.6 $ ‐ $ 7.7 $ ‐
Adjusted Segment Earnings (Losses)North America $133.6 $121.6 $368.3 $360.5Rest of World 17.8 4.1 (26.3) 38.8Inter‐segment earnings elimination ‐ ‐ (0.3) (0.1)Adjusted Segment Earnings $151.4 $ 125.7 $341.7 $399.2
(dollars in millions)
43
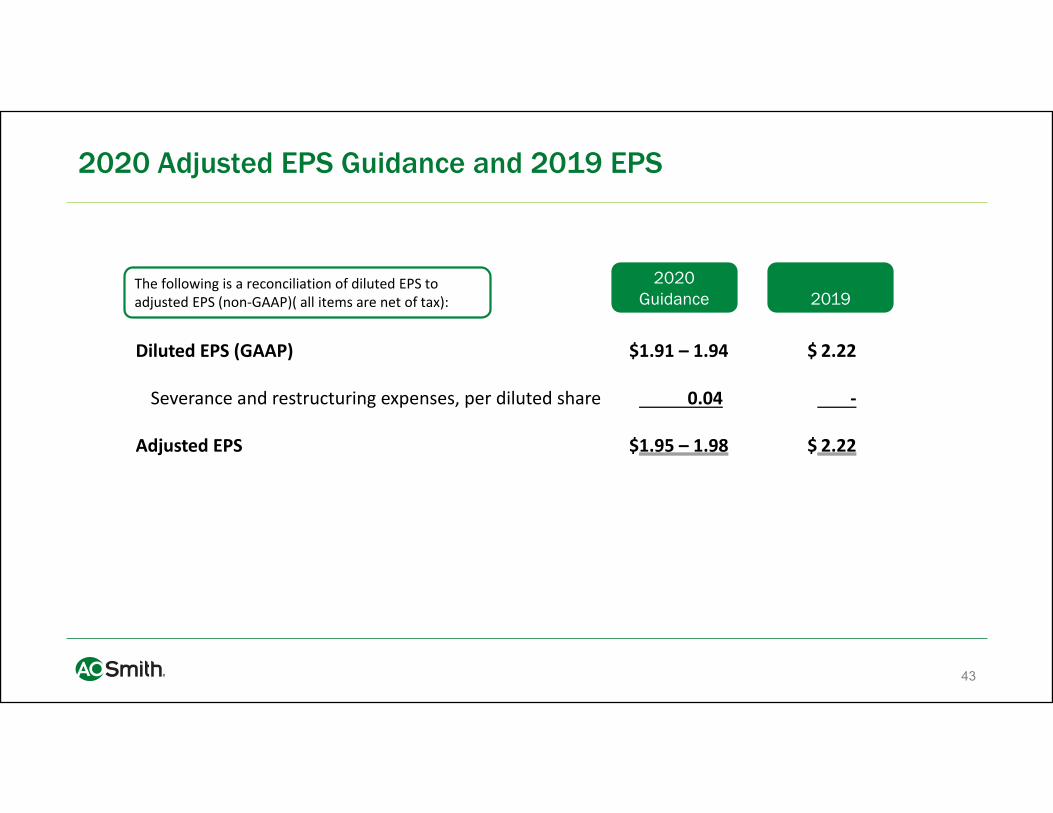
2020 Adjusted EPS Guidance and 2019 EPS
The following is a reconciliation of diluted EPS to adjusted EPS (non‐GAAP)( all items are net of tax):
2020 Guidance
Diluted EPS (GAAP) $1.91 – 1.94 $ 2.22
Severance and restructuring expenses, per diluted share 0.04 ‐
Adjusted EPS $1.95 – 1.98 $ 2.22
2019