Autumn 2007 Issue 17 What’s Under That Purple Haze? · Now NEXRAD page 2 Purple Haze (Cont.)...
34
NEXRAD Now Sheers, mesocyclones, bound- aries, and other meteorological struc- tures that were frequently obscured by range-folding in older volume cov- erage patterns (VCPs) are now revealed with the new SZ-2 (Sachidananda/Zrnic (8/64) Phase Coding Algorithm) VCPs developed by the National Severe Storms Lab. SZ-2, available in Build 9.0, is a tech- nique to ‘unfold’ range-folded signals by transmitting phase encoded pulses and by using that information to dis- tinguish first trip from second trip return. Overview of Purple Haze and Range-Folding After each transmitted pulse, the radar ‘listens’ for returns from that pulse. When transmitting with a high Pulse Repetition Frequency (PRF), or a short time between pulses, the first transmitted pulse’s returns are only sampled for a short total range (unambiguous range). Then a second pulse is transmitted and sampling of its returns begins. However, the first pulse continues to travel through the atmosphere with echoes returning from scatterers beyond the unambigu- ous range. These echoes are added to the second pulse’s returns. The returned echoes from the first pulse that are from beyond the unambigu- ous range are called second trip returns while the echoes from within the unambiguous range are called first trip returns. The combined first and second trip echoes are called overlaid or range-folded echoes (pur- ple haze). In scans with a high PRF, allowing for higher velocities to be measured, range-folding can be wide- spread. In situations of widespread range-folding, SZ-2 processing can be used to recover velocity data from range-folded areas. Overview of SZ-2 Implementing signal processing algorithms to support new science is now possible because the Radar Operations Center (ROC), through the National Weather Service Office of Science and Technology, and with the help of RS Information Systems, just completed upgrading the fleet of WSR-88Ds with the Open Radar Data Acquisition (ORDA) system. SZ-2 is the first RDA based signal processing solution to the range and velocity ambiguity problem. For a detailed overview of how the SZ-2 algorithm works, refer to Range and (Continued on Page 2) What’s Under That Purple Haze? Autumn 2007 What’s Inside? Issue 17 Page 6 An Award Winning Staff Page 7 We’re All Getting Older - Including the WSR-88D Network Page 8 Mesocyclone Detection Algorithm - An Update Page 10 The Clutter Mitigation Decision Algorithm Page 14 ORDA Clutter Suppression in a Nutshell Page 15 WSR-88D Technical Manual Management Page 17 And the Survey Says... Page 22 On the Comms Front Page 25 The Data Quality Dilemma - There’s No Free Lunch Page 30 Introducing the Applications Branch
Transcript of Autumn 2007 Issue 17 What’s Under That Purple Haze? · Now NEXRAD page 2 Purple Haze (Cont.)...

NEXRAD Now
Sheers, mesocyclones, bound-aries, and other meteorological struc-tures that were frequently obscured by range-folding in older volume cov-erage patterns (VCPs) are now revealed with the new SZ-2 (Sachidananda/Zrnic (8/64) Phase Coding Algorithm) VCPs developed by the National Severe Storms Lab. SZ-2, available in Build 9.0, is a tech-nique to ‘unfold’ range-folded signals by transmitting phase encoded pulses and by using that information to dis-tinguish first trip from second trip return. Overview of Purple Haze and Range-Folding
After each transmitted pulse, the radar ‘listens’ for returns from that pulse. When transmitting with a high Pulse Repetition Frequency (PRF), or a short time between pulses, the first transmitted pulse’s returns are only sampled for a short total range (unambiguous range). Then a second pulse is transmitted and sampling of its returns begins. However, the first pulse continues to travel through the atmosphere with echoes returning from scatterers beyond the unambigu-ous range. These echoes are added to the second pulse’s returns. The
returned echoes from the first pulse that are from beyond the unambigu-ous range are called second trip returns while the echoes from within the unambiguous range are called first trip returns. The combined first and second trip echoes are called overlaid or range-folded echoes (pur-ple haze). In scans with a high PRF, allowing for higher velocities to be measured, range-folding can be wide-spread. In situations of widespread range-folding, SZ-2 processing can be used to recover velocity data from range-folded areas. Overview of SZ-2
Implementing signal processing algorithms to support new science is now possible because the Radar Operations Center (ROC), through the National Weather Service Office of Science and Technology, and with the help of RS Information Systems, just completed upgrading the fleet of WSR-88Ds with the Open Radar Data Acquisition (ORDA) system. SZ-2 is the first RDA based signal processing solution to the range and velocity ambiguity problem. For a detailed overview of how the SZ-2 algorithm works, refer to Range and
(Continued on Page 2)
What’s Under That Purple Haze?Autumn 2007
What’sInside?
Issue 17
Page 6 An Award Winning Staff
Page 7We’re All Getting Older - Including the WSR-88D Network
Page 8Mesocyclone Detection Algorithm - An Update
Page 10The Clutter Mitigation Decision Algorithm
Page 14ORDA Clutter Suppression in a Nutshell
Page 15WSR-88D Technical Manual Management
Page 17 And the Survey Says...
Page 22On the Comms Front
Page 25The Data Quality Dilemma - There’s No Free Lunch
Page 30Introducing the Applications Branch

Now
NEXRAD
page 2
Purple Haze (Cont.)(Continued from Page 1)
Velocity Ambiguity Mitigation on the WSR-88D: Performance of the SZ-2 Phase Coding Algorithm (Torres, 2005). With this algorithm, almost all of the velocities and spectrum widths that were obscured by ‘purple haze’ are now revealed.New VCPs: 211 212 221
SZ-2 processing is implemented with the deployment of three new VCPs (211, 212 and 221). These new VCPs are simply copies of the existing VCPs with modifications for SZ-2 coding and processing for Doppler cut of the split cut ele-vations. When executing an SZ-2 VCP the reflectivity moment is calculated from the Sur-veillance scan and the velocity and spectrum width estimates are calculated from the SZ-2 Dop-pler scan. The SZ-2 algorithm requires 64 pulses for its processing. This requirement coupled with the desire to maintain current VCP times results in SZ-2 VCPs using fixed PRF selections.
SZ-2 is able to recover most of the second trip signal; however, in areas of strong overlaid clutter, such as at the beginning of second trip, obscura-tion remains, sometimes called the clutter ring. The different VCPs provide a different PRF allowing one to shift the location of the second trip obscuration. VCP 211 uses PRF 8 for the SZ-2 Doppler processing cut, VCP 212 uses PRF 6, and VCP 221 uses PRF 5. A future improvement in Build 10.0 combines SZ-2 with the Multiple PRF Dealiasing Algorithm (MPDA), almost com-pletely eliminating any clutter ring residue.Impact of Clutter Filtering
Real-time application of clutter filtering has long been a challenging process. With the addition of SZ-2 processing, prudent application of clutter filtering becomes even more important. For the SZ-2 algorithm to accurately separate the return
from both the first and second trips, areas of ground clutter contamination must be identified. The only way the implemented SZ-2 algorithm knows whether or not clutter is present in a partic-ular gate is for that gate to be identified by a clut-ter censor zone (bypass map or clutter suppression region). If “All Bins” clutter filtering is applied to the entire range of the radar, then the SZ-2 algo-rithm must test to see if clutter really exists in both the first and second trips. Ground clutter is not always reliably detected with this test so appropri-ate clutter filtering is not applied in some cases. This results in a velocity estimate that is biased towards zero. The best way to ensure good veloc-ity estimates with SZ-2 is to avoid using “All Bins” clutter filtering that extends into the sec-ond trip. An improved clutter identification and filter application solution, the Clutter Mitigation Decision algorithm (CMD), is currently in devel-opment (Ice et al., 2007).The Pictures Tell It All
The following images are from the last stages of a widespread stratiform rain event collected on March 19, 2006 at 02:27Z. ROC engineers col-lected this data using a modified test VCP exe-cuted on the KCRI test bed radar in Norman, OK. The modified VCP implemented an SZ-2 split cut at 0.5° elevation immediately following the stan-dard split cut completion at 0.5°. Therefore, pro-cessing of the ORDA and the SZ-2 scans, at the same elevation angle, are separated only by the time it takes to perform a split cut. All images in this paper were generated using a playback pro-cess that allows the ROC engineers to change pro-cessing parameters such as those for clutter filtering.
The widespread nature of this rain event shows SZ-2 at its best. Figure 1 is the Surveillance scan
(Continued on Page 3)

page 3
Now
NEXRAD
Purple Haze (Cont.)(Continued from Page 2)
reflectivity product. Figure 2 shows a baseline ORDA Doppler scan velocity product. Note the large amount of unrecoverable overlaid returns (indicated by ‘purple haze’) especially in the sec-ond trip. Figure 3 shows the SZ-2 processed velocity product with previously overlaid velocity data recovered. Spectrum width from SZ-2 pro-
cessing is shown in Figure 4. NOTE: All images referenced in this paragraph are processed using a bypass map for clutter filtering.
Earlier we discussed the effect improper clut-ter filtering has on SZ-2 processing. While the current solution is the best available at this time, improper clutter filtering has significant impacts
(Continued on Page 4)
Figure 2: ORDA Velocity, Bypass Map
Figure 3: SZ-2 Velocity, Bypass Map Figure 4: SZ-2 Spectrum Width, Bypass Map
Figure 1: ORDA Reflectivity, Bypass Map

Now
NEXRAD
page 4
(Continued from Page 3)
on the SZ-2 processing. It is important that mete-orologists understand how “All Bins” clutter fil-tering affects moment estimation. In Figures 5, 6, 7, 8, and 9, the images are generated from the
same data set from March 19, 2006, but pro-cessed with either a bypass map in control or “All Bins” clutter filtering. The impact of inappropri-ate clutter filtering on reflectivity estimates is the same for SZ-2 as for standard ORDA processing. The reflectivity estimate is reduced in areas of near zero velocities (Ice et al., 2007). Note that Figure 5 (bypass map in control) has areas with higher values for reflectivity in the northeast sec-tion compared to the “All Bins” processing pre-sented in Figure 6. This area of low values in Figure 6 corresponds with returns having veloci-ties near zero, so the clutter filter, assuming it is clutter, removes that signal, thus reducing the reflectivity estimates.
Inappropriate clutter filtering impacts SZ-2 velocity estimates more than it does ORDA pro-cessing because only one trip with overlaid clut-
ter can be recovered. Therefore, when clutter filtering is identified for both trips, SZ-2 attempts to decide if clutter actually exists in each identi-fied gate. This decision and subsequent process-ing can result in differences in the appropriately
and inappropriately filtered velocity fields. The first difference is an increased number of zero velocities. For example, compare Figures 7 and 8. In Figure 7, SZ-2 algorithm was executed with the bypass map in control. Note the number and placement of zero velocity gates. Figure 8 shows SZ-2 velocity processed with “All Bins” clutter filtering. In this figure, notice the increased num-ber of zero velocities near the radar; however, the number of zero velocities in the rest of the field is comparable to Figure 7.
For comparison purposes, Figure 9 shows the standard ORDA processed velocities with “All Bins” filtering. In standard ORDA processing, the clutter filter is applied to every bin without checking to see if clutter exists there or not. Note the clutter near the radar is removed; however, so
(Continued on Page 5)
Purple Haze (Cont.)
Figure 5: Reflectivity, Bypass Map Figure 6: Reflectivity, All Bins

page 5
Now
NEXRAD
(Continued from Page 4)
are many of the zero velocities in the rest of the field (note the Northeast section). This behavior has been observed and studied previously (Ice et al., 2007).
The other difference between SZ-2 data pro-cessed with “All Bins” and SZ-2 data processed
with the bypass map in control is the ring of pur-ple at the unambiguous range. This clutter ring is characteristic of SZ-2, and corresponds in the sec-ond trip to the first trip region of strong clutter near the radar. In Figure 7, the clutter ring is wider and the velocities surrounding it are spatially smooth. In Figure 8, the clutter ring is smaller, but there are noisy velocities interspersed. When a bin with clutter is not filtered, then it is not detected as overlaid, and the bin is not colored purple. In addi-tion, the algorithm estimates velocity from this clutter contaminated bin for weak trip which results in noisy estimates in that trip.
During widespread precipitation events (e.g., hurricanes, etc.,), operational meteorologists have always wanted and needed the ability to measure
high wind speeds and display valid velocity data at long ranges. The ability to achieve these two diametrically opposed goals has long been the bane of radar meteorologists and engineers. Recent upgrades to the RDA have enabled the fielding of a phase coded signal processing tech-
(Continued on Page 6)
Purple Haze (Cont.)
Figure 7: SZ-2 Velocity, Bypass Map Figure 8: SZ-2 Velocity, All Bins
Figure 9: ORDA Velocity, All Bins

Now
NEXRAD
page 6
(Continued from Page 5)
nique. Finally, we have an operationally viable reduction to the Doppler Dilemma - SZ-2 vol-ume coverage patterns.
ReferencesIce, R. L., R. Rhoton, D. S. Saxion, C. A. Ray,
N. K. Patel, D. A. Warde, A. D. Free, O. E. Boydstun, D. S. Berkowitz, J. N. Chrisman, J. C. Hubbert, C. Kessinger, M. Dixon, S. Torres, 2007: Optimizing Clutter Filtering in the WSR-88D, 23rd International Confer-ence on Interactive Information Processing Systems for Meteorology, Oceanography, and Hydrology.
Torres, S., 2005: Range and Velocity Ambigu-ity Mitigation on the WSR-88D: Perfor-mance of the SZ-2 Phase Coding Algorithm, 21st International Conference on Interactive Information Processing Systems for Meteo-rology, Oceanography, and Hydrology.
Darcy SaxionRSIS/ROC Engineering Branch
Rick RhotonRSIS/ROC Engineering Branch
Joe ChrismanROC Engineering Branch
Purple Haze (Cont.)An Award Winning StaffThe WSR-88D program is staffed by dedi-
cated professionals around the world. Here at the ROC we are proud of our employees, many of whom have been recognized for their outstanding work and commitment to excellence.
The Isaac M. Cline Award, given to NWS employees who excel in delivering the products and services of the National Weather Service, was awarded to Nancy Beck, ROC Administration.
Terrell “B” Ballard and Frank Hewins of the ROC Operations Branch received the Bronze Medal, the highest honor that can be granted by the Under Secretary of Commerce for Oceans and Atmosphere.
The Oklahoma Federal Executive Board Fed-eral Employee of the Year Award was established in an effort to recognize outstanding federal employees for their efforts, leadership and/or ini-tiative. This program encourages innovation and
excellence in govern-ment, reinforces pride in federal service, and helps call public atten-tion to the broad range of services provided by federal
employees. The 2007 Oklahoma Federal Executive Board
awards were presented to Russ Cook, Engineer-ing Branch, in the Supervisory; Civilian category; Lt. Colin Johnston, Engineering Branch for Tech-nical, Professional, Administration, DOD GS-9 and above; Erin Foster, ROC Administration for Technical, Professional, Administration, Civilian GS-9 or above; and Felicia Woolard, Operations Branch for Outstanding Customer Service.
The ROC Employee of the Quarter (EOQ) and Team Member of the Quarter (TMOQ) Awards
were established for the ROC Awards Program to recognize people who:
• Demonstrate exceptional performance• Exceed normal customer service• Perform a worthy non-duty related act • Accomplish a unique short-term project or
special assignment (Continued on Page 7)

page 7
Now
NEXRAD
(Continued from Page 6)
• Accomplish an office productivity and effi-ciency enhancement of procedures
• Produce an office morale enhancement through teamwork.
The ROC award team representatives, from each organization within the ROC, are a group of proac-tive volunteers dedicated to providing hard working individuals with the appreciation they deserve. This team consists of people who selflessly step up to implement the internal award program as desired by the ROC employees.
Winners of the EOQ and TMOQ are presented with a framed certificate signed by the ROC Direc-tor, the winner’s name is engraved on a plaque dis-played in the ROC facility, and are considered for NOAA Employee and Team Member of the Quarter and other awards.
The winner of the ROC Employee of the Quarter for the first quarter FY 2007 is Dan Frashier, ROC Operations Branch, and ROC Team Member of the Quarter is Adam Heck, Engineering Branch; second quarter FY 2007 EOQ winner is Tammy Buie of the ROC Program Branch, and Ryan Solomon, ROC Engineering Branch, is TMOQ.
For the third quarter FY 2007, Bill Haden, ROC Information Technology and Services (IT&S) Branch, is ROC Employee of the Quarter award win-ner, and ROC Team Member of the Quarter honors go to Al Ingle, also of the IT&S Branch.
Nancy BeckROC Administrative Officer
Staff (Cont.)We’re All Getting Older - Including the WSR-88D Network
As the end of 2007 draws near, it brings to mind the passage of time. And, as
with all things, the WSR-88D network is aging. The old-est radar in the WSR-88D fleet is
the Houston, TX facil-ity. This radar was accepted by the gov-ernment from the contractor on June 12, 1992. In contrast, the youngest radar in the network is the Northern Indiana site, which was accepted October 15, 1997. Thus, the average acceptance age for the entire network is 12.9 years.
Following acceptance, each radar operated for a period of time prior to com-missioning, when the radar officially became part of the network and began providing data to the public. The WSR-88D’s average commissioning age is 11.9 years, with the Altus AFB, OK radar com-missioned first on September 21, 1992, and Kamuela/Kohala, HI the last to be commissioned, October 19, 1998.
Vance MansurROC Program Branch

Now
NEXRAD
page 8
Mesocyclone Detection Algorithm (MDA)...An UpdateAs part of the continuing evolution of the
WSR-88D algorithm and product suite, the legacy Mesocyclone (MESO) algorithm is being phased out and is being replaced with a newer, more sen-sitive algorithm known as MDA. The major improvement offered by the MDA is that its robust detection techniques allow for the identifi-cation and classification of a broader spectrum of storm-scale circulations with different strength and spatial characteristics. The MDA also pro-vides tracking and trend data. (Refer to the Warn-ing Decision Training Branch training material at http://www.wdtb.noaa.gov/buildTraining/Build9/index.html for additional information.)
Background: This replacement is being implemented over three phases to ensure no deg-radation in operational services.
The first phase was implemented in Build 5.0 (released in the Spring of 2004) and continued through Build 8.0 (released in the Spring of 2006). This phase introduced the MDA and the new Mesocyclone Detection (MD) and Digital Meso-cyclone Detection (DMD) products into the RPG baseline software. For this phase, the MDA was added as a complement to the legacy MESO algo-rithm. This period was used to verify the MDA performance, identify and address deficiencies, and allow the opportunity to evaluate the MDA while still retaining the legacy MESO algorithm output for the Combined Attributes Table (CAT) and Alerting Function.
The second phase spans Builds 9.0 (released in the Summer of 2007) and 10.0 (currently sched-uled for release in the Summer of 2008). For this phase, the legacy MESO algorithm and product will still be available; however, the MDA output replaces the MESO output as the information source used to populate the CAT. Additionally, a
new alert category (MDA Strength Rank) was added in Build 9.0 to take advantage of the MDA’s more robust identification and classification pro-cessing.
In the final phase, which is planned for Build 11.0 (currently scheduled for release in early 2009) the legacy MESO algorithm and product are being considered for removal from the baseline RPG software. With the removal of the legacy MESO algorithm, the MDA will become the only storm-scale circulation identification algorithm in the RPG algorithm suite.
MDA and “False Alarms”: The MDA was designed to identify and classify all storm-scale circulations, not just large, well defined mesocy-clonic shear regions. This design allows the MDA to not only detect mesocyclones, but also detect smaller shear regions like those associated with low-topped tornadic shears and waterspouts.
To achieve the goal of identifying these small shear features, the MDA feature identification cri-teria are far more lenient than the legacy MESO algorithm. These more lenient criteria provide a significant operational advantage by being able to identify and classify weak, small-scale shear regions. However, this design also increases the likelihood of identifying shear regions that are not operationally significant (false alarms).
The majority of the operationally insignificant features (false alarms) appear to be caused by noisy velocity fields in weak reflectivity areas. Velocity estimates in weak return (low signal-to-noise ratio (SNR)) tend to be noisy. The noisiness is exacerbated by:
• Velocity dealiasing errors, especially near the radar, since the introduction of ORDA (e.g. highway traffic is more readily seen).
(Continued on Page 9)
page 9
Now
NEXRAD
(Continued from Page 8)
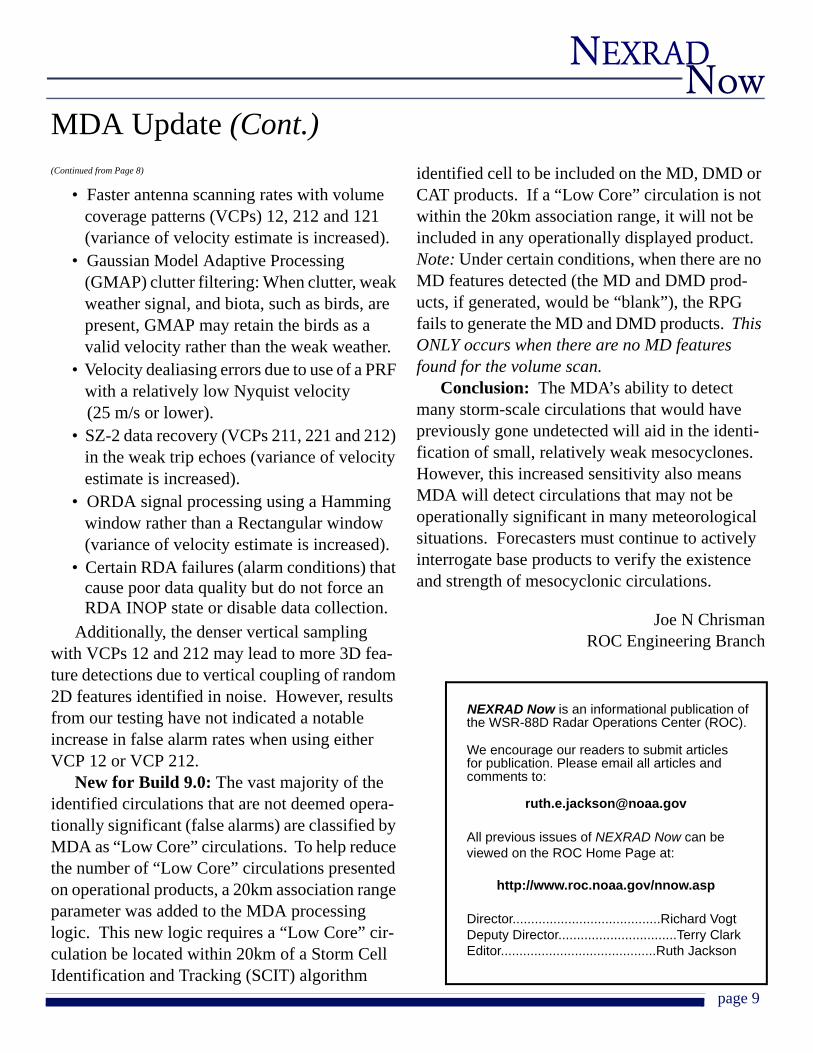
• Faster antenna scanning rates with volume coverage patterns (VCPs) 12, 212 and 121(variance of velocity estimate is increased).
• Gaussian Model Adaptive Processing (GMAP) clutter filtering: When clutter, weak weather signal, and biota, such as birds, are present, GMAP may retain the birds as a valid velocity rather than the weak weather.
• Velocity dealiasing errors due to use of a PRF with a relatively low Nyquist velocity
(25 m/s or lower).• SZ-2 data recovery (VCPs 211, 221 and 212)
in the weak trip echoes (variance of velocity estimate is increased).
• ORDA signal processing using a Hamming window rather than a Rectangular window (variance of velocity estimate is increased).
• Certain RDA failures (alarm conditions) that cause poor data quality but do not force an RDA INOP state or disable data collection.
Additionally, the denser vertical sampling with VCPs 12 and 212 may lead to more 3D fea-ture detections due to vertical coupling of random 2D features identified in noise. However, results from our testing have not indicated a notable increase in false alarm rates when using either VCP 12 or VCP 212.
New for Build 9.0: The vast majority of the identified circulations that are not deemed opera-tionally significant (false alarms) are classified by MDA as “Low Core” circulations. To help reduce the number of “Low Core” circulations presented on operational products, a 20km association range parameter was added to the MDA processing logic. This new logic requires a “Low Core” cir-culation be located within 20km of a Storm Cell Identification and Tracking (SCIT) algorithm
identified cell to be included on the MD, DMD or CAT products. If a “Low Core” circulation is not within the 20km association range, it will not be included in any operationally displayed product. Note: Under certain conditions, when there are no MD features detected (the MD and DMD prod-ucts, if generated, would be “blank”), the RPG fails to generate the MD and DMD products. This ONLY occurs when there are no MD features found for the volume scan.
Conclusion: The MDA’s ability to detect many storm-scale circulations that would have previously gone undetected will aid in the identi-fication of small, relatively weak mesocyclones. However, this increased sensitivity also means MDA will detect circulations that may not be operationally significant in many meteorological situations. Forecasters must continue to actively interrogate base products to verify the existence and strength of mesocyclonic circulations.
Joe N Chrisman
ROC Engineering Branch
MDA Update (Cont.)
NEXRAD Now is an informational publication of the WSR-88D Radar Operations Center (ROC).
We encourage our readers to submit articles for publication. Please email all articles and comments to:
All previous issues of NEXRAD Now can be viewed on the ROC Home Page at:
http://www.roc.noaa.gov/nnow.asp
Director........................................Richard VogtDeputy Director................................Terry ClarkEditor..........................................Ruth Jackson
Now
NEXRAD
page 10
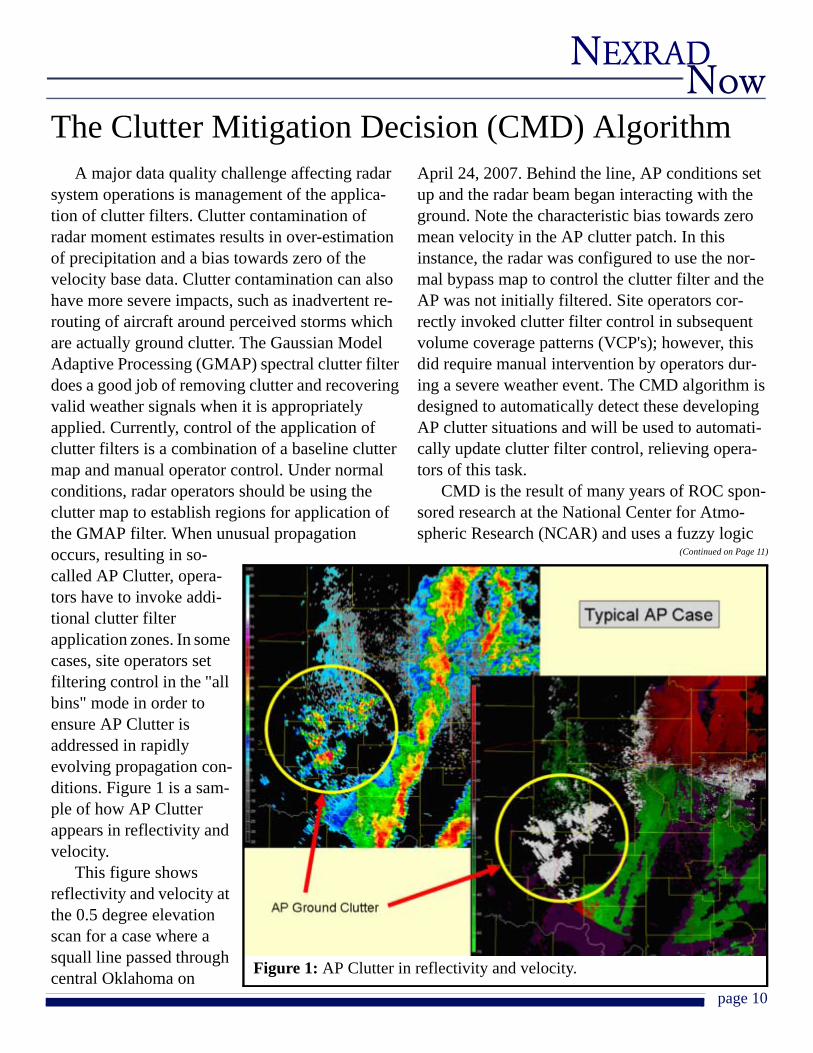
A major data quality challenge affecting radar system operations is management of the applica-tion of clutter filters. Clutter contamination of radar moment estimates results in over-estimation of precipitation and a bias towards zero of the velocity base data. Clutter contamination can also have more severe impacts, such as inadvertent re-routing of aircraft around perceived storms which are actually ground clutter. The Gaussian Model Adaptive Processing (GMAP) spectral clutter filter does a good job of removing clutter and recovering valid weather signals when it is appropriately applied. Currently, control of the application of clutter filters is a combination of a baseline clutter map and manual operator control. Under normal conditions, radar operators should be using the clutter map to establish regions for application of the GMAP filter. When unusual propagation occurs, resulting in so-called AP Clutter, opera-tors have to invoke addi-tional clutter filter application zones. In some cases, site operators set filtering control in the "all bins" mode in order to ensure AP Clutter is addressed in rapidly evolving propagation con-ditions. Figure 1 is a sam-ple of how AP Clutter appears in reflectivity and velocity.
This figure shows reflectivity and velocity at the 0.5 degree elevation scan for a case where a squall line passed through central Oklahoma on
April 24, 2007. Behind the line, AP conditions set up and the radar beam began interacting with the ground. Note the characteristic bias towards zero mean velocity in the AP clutter patch. In this instance, the radar was configured to use the nor-mal bypass map to control the clutter filter and the AP was not initially filtered. Site operators cor-rectly invoked clutter filter control in subsequent volume coverage patterns (VCP's); however, this did require manual intervention by operators dur-ing a severe weather event. The CMD algorithm is designed to automatically detect these developing AP clutter situations and will be used to automati-cally update clutter filter control, relieving opera-tors of this task.
CMD is the result of many years of ROC spon-sored research at the National Center for Atmo-spheric Research (NCAR) and uses a fuzzy logic
(Continued on Page 11)
The Clutter Mitigation Decision (CMD) Algorithm
Figure 1: AP Clutter in reflectivity and velocity.

page 11
Now
NEXRAD
(Continued from Page 10)
approach for automatic identification of clutter contaminated radar bins. The algorithm computes three major parameters: (1) Clutter Phase Align-ment, (2) Reflectivity Texture, and (3) Reflectivity Spin. Clutter Phase Alignment is computed directly from the time series data and is a measure of the coherency of the radar returns. Clutter tar-gets are fairly coherent from pulse-to-pulse while pure noise is essentially incoherent on a pulse-to-pulse basis. Weather signals fall in between these two extremes of coherency and the Clutter Phase Alignment parameter does a good job of discrimi-nating clutter from weather. Reflectivity Texture is a measure of the variability of reflectivity over a span of 9 gates in range. Clutter is variable while weather tends to be more smooth over these range
scales. Reflectivity Spin is a measure of how often the reflectivity gradient changes. A higher Spin value indicates increased probability of clutter. These three parameters are combined in a fuzzy logic algorithm which results in a probability of clutter contamination in each bin. If clutter proba-bility exceeds a set threshold, a CMD Clutter Flag is generated, which can be used to augment base-line clutter maps and clutter filter control automat-ically. Figure 2 shows a sample of a severe AP case from June 2006 captured at KCRI and used to analyze CMD. The reflectivity image on the left side is processed without clutter filtering and con-tains extensive AP clutter. Note the presence of the normal ground clutter around the radar. On the right are two representative clutter filter bypass maps. The top map on the right shows the original
baseline map used by the radar under normal conditions, and shows clutter region around the radar under nor-mal propagation conditions. The bottom right image shows the CMD generated map.
Over the past 1 - 2 years, ROC engineers have worked with NCAR scientists to refine the algo-rithm and have conducted perfor-mance evalua-tions. NCAR and
(Continued on Page 12)
CMD Algorithm (Cont.)
Figure 2: Severe AP case used to analyze CMD.

Now
NEXRAD
page 12
CMD Algorithm (Cont.)(Continued from Page 11)
ROC personnel provided several briefings to the NEXRAD Technical Advisory Committee (TAC), and the Software Recommendation and Evaluation Committee (SREC). In March 2007, the TAC endorsed CMD and recommended it be imple-mented as soon as possible. At the September 2007 meeting, the SREC approved CMD for software Build 11.0. Initially, CMD will be integrated with Build 11.0 for testing purposes. A deployment decision will be made later, pending evaluation of the production CMD performance by ROC Engi-neering and the Data Quality Team.
Since the Spring 2007 TAC meeting, ROC and NCAR team members have analyzed additional data. This past April, the engineering team was fortunate to capture an extensive time series data set from the KTLX radar during a squall line pas-
sage event. This established conditions favorable for AP clutter to form and made an ideal case for evaluating CMD. ROC engineers provided the data set to NCAR and their scientists processed the data through the latest version of CMD. A sample of their results is shown in Figure 3.
This figure shows the unfiltered reflectivity, the CMD generated clutter flags, and the filtered reflectivity. NCAR produced the filtered data using their version of a spectral clutter filter simi-lar to the operational GMAP filter, but there are some slight differences. The NCAR CMD imple-mentation and their filter generally do a good job of eliminating the clutter. Some of the bright spots seen in the filtered data are actually from wind tur-bine installations in Oklahoma and are not filtered by conventional means.
ROC engineers also processed the data set through their laboratory Open RDA RVP8 and RCP8 processors using playback capabilities. The team used the NCAR generated CMD flags to configure a WSR-88D compatible clutter map. The engi-neering team then used this map to apply clut-ter filtering appropri-ately and produced a reflectivity field. Results are shown in Figure 4. This demon-strates another key part of the overall evalua-tion capability. Note that CMD and GMAP
(Continued on Page 13)Figure 3: NCAR CMD results.

page 13
Now
NEXRAD
(Continued from Page 12)
do a very good job of identifying and eliminating the clutter.
The next step is to develop the operational soft-ware and integrate it with Build 11.0. The ROC engi-neering team began that effort in October 2007 and will work to meet the software release schedule. Initially, CMD will only be employed in the lowest Sur-veillance scan of any elevation seg-ment containing split cuts. This means for most VCP's, CMD will only run one time. The CMD augmented map will be used for all subsequent scans within the seg-ment. This design approach minimizes impacts to system performance and lends itself to a straight-forward integration. Because the algorithm is rela-tively compact, the engineering team does not expect a significant increase in processor loading, either for the RVP8 or the RCP8. The basic 5 seg-ment clutter map operation will not change with CMD so there are no impacts to end users. Opera-tors will be able to enable or disable CMD as needed. The team will also incorporate CMD into the off-line test software for generating baseline clutter maps. Using CMD to replace the classic map generation process will increase the efficiency
of that task and will result in improved quality baseline clutter maps.
The goal of the CMD project is to assist radar system operators in managing the clutter filtering process. Effective use of CMD will reduce instances of AP clutter contamination, and improve data quality while reducing the workload at opera-tional sites.
Rich IceRSIS/ROC Engineering Branch
David WardeSI International/ROC Engineering Branch
Dan BerkowitzROC Applications Branch
CMD Algorithm (Cont.)
Figure 4: ROC Engineering Re-play - Reflectivity.
Now
NEXRAD
page 14
ORDA Clutter Suppression in a NutshellDefinitions
GMAP - Gaussian Model Adaptive Processing (GMAP) is the algorithm that performs clutter sup-pression in Open Radar Data Acquisition (ORDA). This algorithm operates in the frequency spectrum and removes the power coefficients (from the spec-trum) that have a zero velocity and a spectrum width of less than .4 m/s. After suppression, if there is sufficient meteorological-like power return (return with velocity) available, GMAP will con-struct a Gaussian curve from that remaining power spectrum and “rebuild” any meteorological signal power that was removed (see, http://www.wdtb.noaa.gov/buildTraining/ORDA/PDFs/Final_Chrisman_Ray.pdf).
Bypass Map - A special map generated for each Elevation Segment that identifies the geo-graphic location of clutter targets (targets with near-zero radial velocity and a narrow spectrum width) present within the radar’s viewing horizon at the time the map was generated.
Elevation Segment - An Elevation Segment is the grouping of contiguous data collection eleva-tion angles. For the purpose of applying clutter sup-pression, each grouping (elevation segment) is treated as an individual entity. For more informa-tion see, http://www.wdtb.noaa.gov/buildTraining/Build9/pdfs/Joe_AMS_clutter_segments.pdf.
AP - Anomalous Propagation is the non-stan-dard bending of the radar beam, either more or less steeply than expected. AP may result in the beam being trapped in the boundary layer for long dis-tances resulting in significantly more return on the product displays.
Clutter - The broad definition of “clutter” is: Any return that interferes with the observation of desired signatures on a radar display.
However, we define “clutter” as stationary, hard (highly reflective), ground-based, non-meteorologi-
cal targets. Unlike the first definition, this more restrictive clutter definition does not include return from biological targets (insects, birds, etc.,) non-precipitable aerosols, and changes in refractive index, which may be implied in the broader definition, above. We use this more restrictive definition to distin-guish ground-based “clutter” targets from those tar-gets that can and do provide valuable boundary layer information.
From the radar’s signal processing point of view, yet another definition needs to be introduced here. Because of the nature of the clutter filtering process, the radar considers ALL returns that have a near-zero radial velocity and a narrow spectrum width as clutter. This definition is important because, when clutter suppression is invoked, the radar performs suppression on all returns that have these characteristics (near-zero radial velocity and a narrow spectrum width).
Clutter SuppressionGMAP ONLY operates where the operator, via
the Clutter Regions window, tells it there is clutter. Within each defined region either the Bypass Map or All Bins can be selected.
Bypass Map - with the Bypass Map selection, ONLY those gates identified on the Bypass Map (within the defined region) will be processed by GMAP. Use the Bypass Map selection to address routine, non-transient clutter.
All Bins – with All Bins selected, EVERY gate within the defined region will be processed by GMAP. Use operator-defined Clutter (Suppression) Regions with the All Bins selection to address tran-sient clutter return caused by AP.
Joe N. ChrismanROC Engineering Branch

page 15
Now
NEXRAD
WSR-88D Technical Manuals (TM) are written to assist operations and maintenance personnel in performing their duties. There are basically two phases of TM management, maintenance and dis-tribution.
TM MaintenanceThese manuals are continuously updated for soft-ware builds, new equipment installations, equip-ment modifications, and also to correct existing errors, with the majority of the updates being for software builds, new equipment, and equipment modifications. For instance, software Build 9.0 TM updates affected 14 separate manuals.
Correction of minor TM errors are included each time a TM is updated. Major TM error cor-rections (safety and equipment damage issues) are updated on a more urgent basis. Most of the updated TM information comes from Radar Oper-ations personnel (i.e., electronics technicians, meteorologists, and engineers).
The Radar Operations Center (ROC) Systems Documentation Team (SDT) does a good job of addressing updates for the software builds, new
equipment installations, and equipment modifica-tions, but could use some help identifying current TM errors. This is where WSR-88D site operators and technicians can really make a difference. All WSR-88D TM users are ROC SDT customers, and their input in identifying TM errors and providing correction submissions is valuable and encour-aged. The ROC Systems Documentation Team has made it easy to submit publication change requests by offering change request forms that can be sub-mitted via the ROC website. The steps for submit-ting a publication change request are as follows:
1. Open the ROC website and select Mod Docs/Manuals under the Products and Services menu on the left side of the web page, as shown in Figure 1.
2. When the WSR-88D Technical Manual Pub-lication Bulletin window opens, select On-line PCR Form under the PCRs menu on the left side of the page.
3. Complete the On-line Publication Change Request (PCR) Form with all pertinent information and select Submit.
(Continued on Page 16)
WSR-88D Technical Manual Management
Figure 1: Selecting Mod Docs/Manuals from the menu on the ROC web page.

Now
NEXRAD
page 16
(Continued from Page 15)
Once the submission is received, it will be pro-cessed into the ROC PCR database for evaluation and TM entry when approved.
TM DistributionThere are three methods by which WSR-88D
TMs are distributed: hard copy, TM CD, and PDF TMs on the ROC website. The hard copy TMs and TM CDs are sent to sites/offices that are on distribution to receive them. To change the method or quantity of TMs received, go to the ROC website and select Mod Docs/Manuals, and then select Site Controlled Tech Manual Inven-tory. To report problems or questions, contact Danny Green at [email protected].
TMs in PDF format can be accessed via the ROC website in the following manner:
1. Open the ROC website and select Mod Docs/Manuals under the Products and Services menu on the left side of the web page. When the WSR-88D Technical Manual Publication Bulletin window opens, select the TM type (i.e., Mainte-nance Manuals, OPUP Manuals, Operations Man-uals, etc.)
2. When the next window opens, select the desired PDF TM. Login to the secured server to receive the document.
If problems occur during this process, select Contact Us from the menu on the left side of the web page.
Danny GreenROC Program Branch
Tech Manual Management (Cont.)
Figure 2: Accessing Maintenance Manuals via the ROC web page.
page 17
Now
NEXRAD
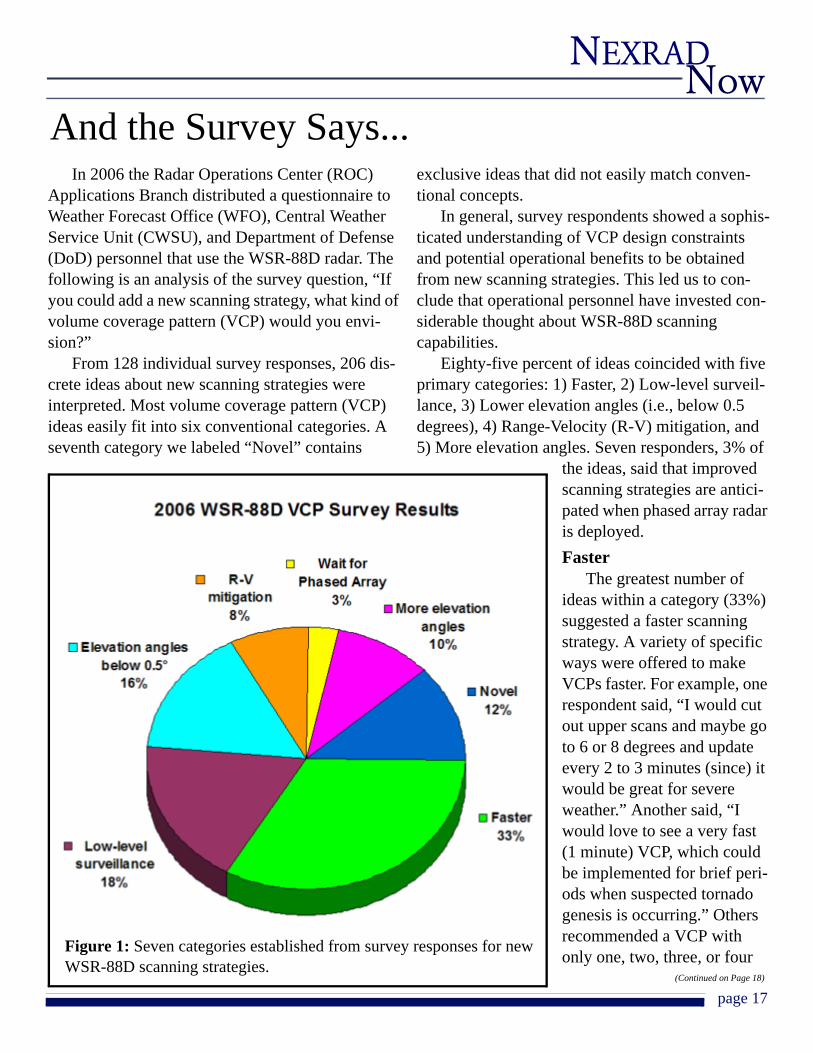
In 2006 the Radar Operations Center (ROC) Applications Branch distributed a questionnaire to Weather Forecast Office (WFO), Central Weather Service Unit (CWSU), and Department of Defense (DoD) personnel that use the WSR-88D radar. The following is an analysis of the survey question, “If you could add a new scanning strategy, what kind of volume coverage pattern (VCP) would you envi-sion?”
From 128 individual survey responses, 206 dis-crete ideas about new scanning strategies were interpreted. Most volume coverage pattern (VCP) ideas easily fit into six conventional categories. A seventh category we labeled “Novel” contains
exclusive ideas that did not easily match conven-tional concepts.
In general, survey respondents showed a sophis-ticated understanding of VCP design constraints and potential operational benefits to be obtained from new scanning strategies. This led us to con-clude that operational personnel have invested con-siderable thought about WSR-88D scanning capabilities.
Eighty-five percent of ideas coincided with five primary categories: 1) Faster, 2) Low-level surveil-lance, 3) Lower elevation angles (i.e., below 0.5 degrees), 4) Range-Velocity (R-V) mitigation, and 5) More elevation angles. Seven responders, 3% of
the ideas, said that improved scanning strategies are antici-pated when phased array radar is deployed.Faster
The greatest number of ideas within a category (33%) suggested a faster scanning strategy. A variety of specific ways were offered to make VCPs faster. For example, one respondent said, “I would cut out upper scans and maybe go to 6 or 8 degrees and update every 2 to 3 minutes (since) it would be great for severe weather.” Another said, “I would love to see a very fast (1 minute) VCP, which could be implemented for brief peri-ods when suspected tornado genesis is occurring.” Others recommended a VCP with only one, two, three, or four
(Continued on Page 18)
And the Survey Says...
Figure 1: Seven categories established from survey responses for new WSR-88D scanning strategies.

Now
NEXRAD
page 18
(Continued from Page 17)
lowest elevation angles for tornado outbreak situations.
The ROC has designed, and does recommend, a faster VCP because some short-lived, dam-aging wind events are not sam-pled frequently enough by
current operational WSR-88D scan-ning strategies. A National Research Council com-mittee reported, in Weather Radar Technology – Beyond NEXRAD, that a shortcoming of the WSR-88D system was the update cycle. The committee, remarking about the current WSR-88D system, said “…any mechanically scanning system, in condi-tions of rapidly evolving convective weather is a serious limitation.” NWS forecasters require more frequent radar sampling when rapidly evolving phe-nomena such as tornadoes, gustnadoes, and microbursts must be detected in order to effectively warn the public. The ROC prototype VCP com-pletes a volume in 2.3 minutes and has been submit-ted for consideration through the NWS Operations and Services Improvement Process (OSIP).
A fast VCP; however, is not a simple feat; a faster VCP usually means we must accept some combination of fewer elevation slices or greater sig-nal error estimates due to faster antenna rotation. Since the WSR-88D is a tri-agency radar, the FAA has an unyielding requirement to scan mid- and upper levels when using a precipitation-type VCP to support the National Airspace System. One promis-ing choice toward making a faster VCP is to slightly relax signal error estimates, especially scans from higher elevation angles. Another approach is to alternate between a very fast VCP and a 4-minute VCP to obtain rapid low-level updates while satis-fying FAA requirements. Low-level Surveillance
Forecasters and hydrologists saw a need for
denser vertical sampling near the earth. Meteoro-logically, respondents suggest tropical systems, sea breeze interaction, outflow boundaries, and low-top convection are better observed by radar with more low-level elevation angles. Some saw the need to combine fast VCPs with low-level surveillance in order to detect short-lived microbursts and help identify mid-level convergence and low-level diver-gence. One forecaster addressed regional differ-ences by suggesting “a VCP that would include more low-level angles at 0.7 and 1.2 degrees...because most of the mesos we deal with in northern Alabama are less deep than those seen in the Great Plains.” Others cited low-level surveil-lance as a better way to interrogate storms at long ranges or pulse storms at intermediate ranges.
Others combined more elevation angles with low-level surveillance while discounting the need for upper surveillance. Again, the FAA requirement for mid- and upper-surveillance severely restricts our ability to provide a VCP with smaller elevation increments at the lowest angles. Eighteen percent suggested better low-level surveillance was a desir-able VCP characteristic during some meteorological situations. Lower Elevation Angles
Forecasters at some WSR-88D sites have expe-rienced the severe limitation of radar beam over-shoot due to a minimum elevation angle of 0.5 degrees. Consequently, 32 respondents suggested a new VCP with lower elevation angles; that is 16% of the VCP ideas found in this survey. Of those requests for lower elevation angles, 9 respondents mentioned a specific need for negative elevation angles.
Concern about beam overshoot was not restricted to mountaintop or Great Lakes sites. One forecaster said, “A lower scanning angle would be quite ideal, especially east of the Rockies. And,
(Continued on Page 19)
And the Survey Says... (Cont.)

page 19
Now
NEXRAD
(Continued from Page 18)
perhaps in tornado outbreaks, offer a VCP with rapid update technology of the lowest four angles only. (If) we already know what is happening aloft, just concentrate on the lower levels for increased track/development of these vortices.”
Another respondent said, “A VCP with a 0.0 or 0.2 degree cut would be very helpful for both con-vection and lake effect snow in southeast Michi-gan.” One working with a WSR-88D in complex terrain defined a new VCP as “One with a first ele-vation angle slightly negative. KBHX is at an eleva-tion in excess of 2400 feet, with WFO Eureka office at 20 feet. Many features important to us are missed since the beam is above 3500 feet over our office, which is only 20 miles from the RDA.”
The beam overshoot problem is not new. Authors of a National Research Council study, Flash Flood Forecasting over Complex Terrain (NRC 2005), write that “A further constraint cur-rently imposed on the NEXRAD system limits the minimum elevation angle no lower than 0.5°.” Fur-ther, they say “This problem is of special concern for radars at high-altitude sites in mountainous areas,” and continue by saying, “similar difficulties arise in areas subject to intense precipitation from shallow cloud systems, such as places in the lee of the Great Lakes affected by lake-effect snow-storms.” The ROC has devised a field test plan for lower elevation angles and has submitted this project for consideration through the NWS OSIP. Executing the test plan will require funding for per-forming environmental assessments to operate the WSR-88D below 0.5 degrees, and the purchase of computers to process and display the data from the experimental angles. Implementing special low-angle VCPs operationally will require changes to user display software.
Lower elevation angles at some WSR-88D sites could provide operational benefits such as improv-
ing severe weather detection and prediction, precip-itation analysis, feature detection, tracking, and nowcast forecasting. Simulations of lower elevation angles for mountaintop WSR-88D sites imply dra-matic improvements by virtue of sampling low-alti-tude phenomenon. For example, a study that considered the Missoula, Montana WSR-88D (Brown et al. 2002) states, “Using the lowest eleva-tion angle (0.5°) of the current WSR-88D scanning strategies, simulated rainfall rates detected in val-leys progressively decrease from about 80% of the surface value near the radar to only 1% of the sur-face value at 220 km. However, using an elevation angle of -0.8°, simulated rainfall rates detected at ranges out to 220 km are about 80%-95% of the sur-face value.”Range-Velocity Mitigation
Respondents have obviously seen benefits from the deployment of VCP 121, a range-velocity miti-gation strategy that uses the Multi-PRF Dealiasing Algorithm (MPDA). Eight percent of survey ideas suggest the field wants additional options that improve velocity values and reduce range-folding. Some respondents combined other characteristics with an MPDA-like VCP. For instance, one asked for a 3-minute MPDA VCP. Similarly, one respon-dent said, “A VCP like 121…except it only scans the bottom 2 (or bottom 3) elevations. This would put an emphasis on low-level tornadic circulations.” Another offered that a new scan strategy could be “a VCP 121 hybrid with VCP 12 (elevation angles) where the range-folding mitigation of VCP 121 exists with more available scans in the vertical.”
As reflected in survey responses, more range-velocity mitigation is desired operationally. The ROC evaluated capabilities of a data processing technique called SZ-2 (Sachidan-anda/Zrnic (8/64) Phase Coding
(Continued on Page 20)
And the Survey Says... (Cont.)
Now
NEXRAD
page 20
(Continued from Page 19)
Algorithm), with quite promising results, and included three SZ-2 scanning strategies in the Build 9.0 software release. These three new VCPs have elevation angles matching VCPs 11, 12, & 21 and improved velocity fields. However, volumes of SZ-2 VCPs take slightly more time than each of the respective, angle-matching legacy VCPs.
The SZ-2 algorithm uses phase coding and relies on power and spectrum width estimates to resolve range and velocity ambiguities. Essentially, the algorithm tries to recover Doppler velocities associ-ated with strong- and weak-trip signals and the spectrum widths associated with strong-trip signal. The VCPs that use the SZ-2 algorithm scan with a long pulse repetition frequency (PRT) immediately followed by a scan with phase-coded signals using a short PRT at the same elevation angle. Wait for Phased Array
Phased Array technology has the promise of providing volume scans every 60 seconds. The Office of the Federal Coordinator of Meteorology has a Multifunction Phased Array Radar (MPAR) Working Group working in a multi-agency effort to determine the potential needs and benefits of phased array radar, with a goal of integrating the findings into a coordinated research and development plan. Additional information concerning phased array development efforts can be found at http://www.ofcm.gov/.More Elevation Angles
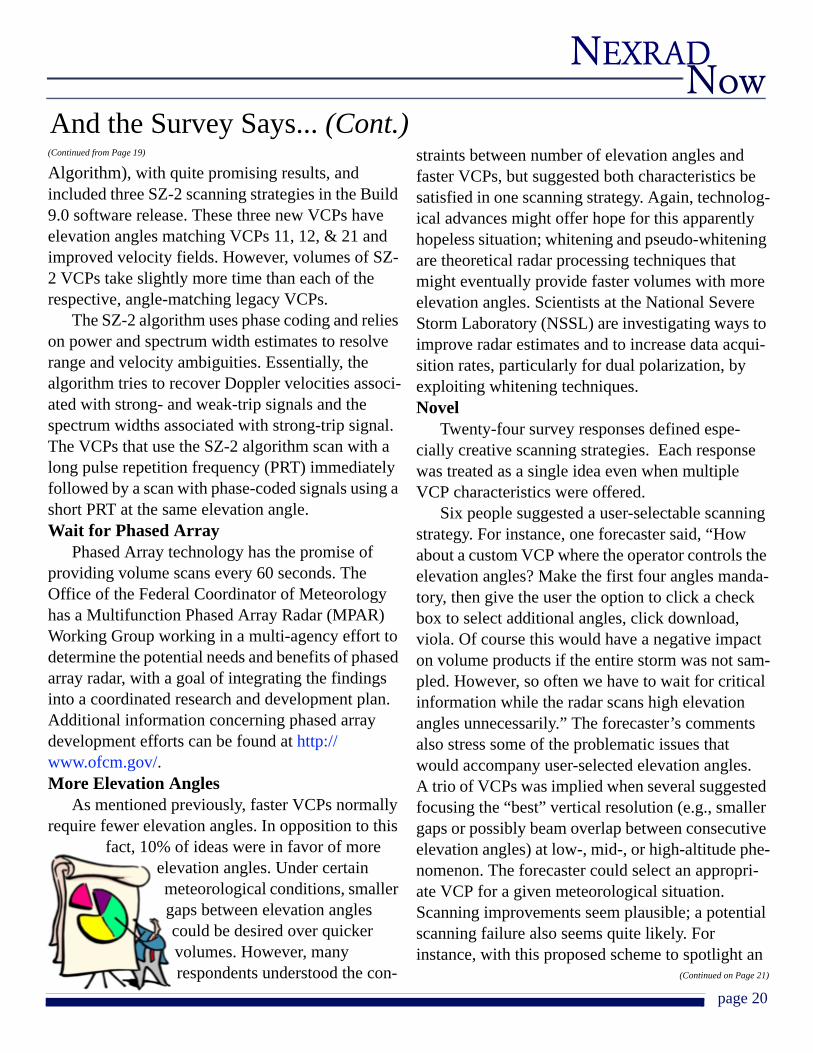
As mentioned previously, faster VCPs normally require fewer elevation angles. In opposition to this
fact, 10% of ideas were in favor of more elevation angles. Under certain meteorological conditions, smaller gaps between elevation angles could be desired over quicker volumes. However, many respondents understood the con-
straints between number of elevation angles and faster VCPs, but suggested both characteristics be satisfied in one scanning strategy. Again, technolog-ical advances might offer hope for this apparently hopeless situation; whitening and pseudo-whitening are theoretical radar processing techniques that might eventually provide faster volumes with more elevation angles. Scientists at the National Severe Storm Laboratory (NSSL) are investigating ways to improve radar estimates and to increase data acqui-sition rates, particularly for dual polarization, by exploiting whitening techniques.Novel
Twenty-four survey responses defined espe-cially creative scanning strategies. Each response was treated as a single idea even when multiple VCP characteristics were offered.
Six people suggested a user-selectable scanning strategy. For instance, one forecaster said, “How about a custom VCP where the operator controls the elevation angles? Make the first four angles manda-tory, then give the user the option to click a check box to select additional angles, click download, viola. Of course this would have a negative impact on volume products if the entire storm was not sam-pled. However, so often we have to wait for critical information while the radar scans high elevation angles unnecessarily.” The forecaster’s comments also stress some of the problematic issues that would accompany user-selected elevation angles. A trio of VCPs was implied when several suggested focusing the “best” vertical resolution (e.g., smaller gaps or possibly beam overlap between consecutive elevation angles) at low-, mid-, or high-altitude phe-nomenon. The forecaster could select an appropri-ate VCP for a given meteorological situation. Scanning improvements seem plausible; a potential scanning failure also seems quite likely. For instance, with this proposed scheme to spotlight an
(Continued on Page 21)
And the Survey Says... (Cont.)

page 21
Now
NEXRAD
(Continued from Page 20)
altitude, if the wrong scan strategy is selected or if weather sufficiently transforms to no longer apply to a selected VCP, an inappropriate coverage pattern would degrade the radar’s detection capabilities. An interesting derivation of this concept was to design an inverted VCP 12 with dense vertical sampling in the top regions of the scan.
A seasonal VCP was suggested. The parameters were not specified; however, the idea was to develop a wintertime VCP similar to VCP 12. To best interrogate stratiform precipitation, volume throughput may not be as important. The provision of additional scan time would release several VCP design constraints.
A VCP that scans every other elevation angle for one volume followed by scans of the missing elevation angles for the second volume was sug-gested. By recombining data from both volumes, complete vertical sampling could be achieved while increasing volume throughput. Positions of verti-cally stacked targets of recombined data might appear irregular. This lack of spatial and temporal continuity in the vertical might limit the usefulness of this scheme.
One responder asked for a VCP with a second scan of the lowest slice when the volume was about halfway completed. This concept is appealing for several reasons. For one, the FAA requirement for upper slices would be easily satisfied. In addition, more frequent scans of low-level phenomenon are possible without compromising signal error esti-mates or reducing the number of elevation angles. A purpose of faster VCPs is to allow detection of tar-get changes in rapidly evolving meteorological situ-ations; intermittent sampling at lower levels provides a solution.
Rich variations of this idea exist. Data from the lowest two or three slices could be refreshed once or twice before a volume completes in order to
increase sampling frequency and to allow algorithm output updates. Processing data in the Radar Prod-uct Generator (RPG) has always, by convention, started a volume with the lowest elevation angle and steadily increased to the highest elevation angle. A revision to RPG software would be required to han-dle intermittent lower level updates.
Another novel idea that several mentioned might be called “smart” VCPs. Of these so-called smart VCPs, some recommended a VCP that could detect the absence of radar echoes and terminate higher scans providing faster scans. With this scheme the radar would have to “determine” when higher scanning should resume. Consequently, cur-sory sampling of middle and high altitudes at all ranges would seem to be necessary.
Another “smart” VCP suggestion was to scan only where regions contained cells. Variations of this theme were provided. One forecaster defined a VCP that was, “a special single cell scan. A one-time request using the cell id” would cause the radar to scan “for suspected tornadic or very large hail storms. The scan would hopefully provide better quality data, i.e., reduce the FAR for tornado warnings.” Significant RPG software modifications would be required for this proposed scheme.
ReferencesNRC, 2005:Flash Flood Forecasting over Complex
Terrain: With an Assessment of the Sulphur Mountain NEXRAD in Southern California. National Research Council, The National Acade-mies Press, 191 pp.
Brown, R. A., V. T. Wood, and T. W. Barker, 2002: Improved detection using negative elevation angles for mountaintop WSR-88Ds: Simulation of KMSX near Missoula, Montana. /Wea. Fore-casting/, *17*, 223-237.
Randy SteadhamROC Applications Branch
And the Survey Says... (Cont.)
Now
NEXRAD
page 22
Air Force Weather Agency (AFWA) has multiple changes under-way. AFWA has recently submitted dis-
connect orders for the “Air Force Dial 2” line on 140
CONUS RPGs. Additionally, with the exception of Vandenberg AFB who will retain a dial-out capabil-ity, the dial-out line from 76 Small OPUPs is being disconnected. These CONUS Small OPUP Combat Weather Teams will no longer have x.25 dial backup and will instead rely on Internet or AFWA wide area network (WAN) provided radar data sources. No actions will be required on either the RPG or OPUP ends and no telecommunications technician visits will be required to support the line deactivations. Reference to the Air Force Dial 2 cir-cuit was removed from the ROC RPG communica-tions documentation over a year ago knowing this change was impending. The dial-out lines are being removed from the OPUP communications docu-mentation in parallel with the Provider taking the services down.
Further consolidation of the Shaw 28 Opera-tional Weather Squadron (OWS) in South Carolina is expected for the late 2007 to early 2008 time frame. Earlier this year five of Shaw’s WSR-88D connections were “transferred” to the Scott and Barksdale OWS. In the next round of consolidation, nearly all of Shaw’s Florida and Georgia WSR-88D connections will be transferred to Barksdale, eight RPGs in all. Telecommunications information will be forwarded to all eight locations as soon as the Provider’s ramp-up activities ensue.
In anticipation of the Elmendorf, Alaska 11 OWS being decommissioned during the summer of 2008, new dedicated connections to Anchorage (PAHG) and Fairbanks (PAPD) will be established to the Hickam 17 OWS Medium OPUP. The new
connections to Hickam are expected to be opera-tional in January 2008.
An OPUP digital transition will be supported with an RPG Build 11.0. Deployment of Build 11.0 is planned for the first half of 2009.
Terminal Doppler Weather Radar (TDWR)/Supplemental Product Generator (SPG) to Advanced Weather Interactive Processing System (AWIPS) Full-Scale Deployment long term sup-port infrastructures (telecommunications, hardware and logistics, connectivity procedures, documenta-tion, certification & accreditation, training) are being completed for 34 more TDWR to National Weather Service (NWS) connections. Eleven TDWR to NWS prototype connections are already in place in the field. NWS Office of Science & Technology (OS&T) projects the full-scale deploy-ment to begin in late winter 2007 to early spring 2008, and be completed by September 30, 2008.
Federal Aviation Administration (FAA) Tele-communications Infrastructure (FTI) WAN inter-net protocol (IP) service is now being employed by all but one of the 142 CONUS Weather and Radar Processor (WARP) to NEXRAD connections. Tele-communications for the 1st OCONUS WARP WSR-88D connection (San Juan), and the lone remaining CONUS location, are projected for late 2007 to early 2008. Projections for WARP transi-tions to IP service in Alaska via Alaska NAS Inter-facility Communication System (ANICS) have been given as June 2008. And, while all Integrated Terminal Weather System (ITWS) WSR-88D con-nections have been transitioned to FTI analog tele-coms, we await a firm date for ITWS transitions to WAN IP. However, RPG Build 9.0 was deployed with built-in adaptation changes to support the eventual ITWS WAN IP migration on Product Dis-tribution Comms Status screen line numbers 18, 19, and 20.
(Continued on Page 23)
On the Comms Front...

page 23
Now
NEXRAD
(Continued from Page 22)
In order to better support our FAA end users, a new FTI telecommunications network monitoring tool has been promised to the Hotline. Latest pro-jections are for a late 2007 to early 2008 delivery. The Hotline previously had no visibility into FAA end user system telecommunication issues via their old “LINCS” contracts. We expect the new tool to enable the WSR-88D Hotline to better coordinate telecommunications issues and scheduled and unscheduled WSR-88D outages with our respective FAA support center counterparts. The latter should preclude needless calls to operators in the field from the FAA support centers. Additionally, the Hotline has been invited to participate with an FAA Operational Control Centers summit at Harris (FTI) Corporation in December. We are certain monitor-ing and support topics will be of great interest.
RPG moves – The Camp Humphreys, Korea (RKSG) system was taken off-line in September 2007 as part of its relocation. RKSG was com-pletely reassembled and back on-line at its new location in mid-November 2007 as the "US Army Garrison (USAG) Humphreys" WSR-88D.
The Sterling WSR-88D (KLWX) is being moved a short distance from its current location to gain some spacing to a runway being expanded at Dulles International Airport. The KLWX RPG is expected to be moved to the new Weather Forecast Office (WFO) building around September 2008. Tri-agency telecommunication transition planning will likely begin in earnest approximately six months in advance, around March 2008.
NWS AWIPS and RPG communications changes associated with Build 9.0 were primarily in the form of hardware in the refreshed RPG, e.g., a new console server which facilitates automation of loading RPG and frame-relay hub router configura-tions. The respite in new operational comms con-
siderations affords the opportunity to revisit the topic of WAN Dedicated operations. All locations were provided with an AWIPS system-spe-cific radar file help sheet and guidance for orpgBack-ups.txt (which permits a WAN Dedicated connec-tion) by the WSR-88D Hotline with the Operational Build 6.0 roll-out. However, the operational guid-ance for WAN Dedicated operations continued to evolve long after the Operational Build 6.0 deploy-ment. The latest revision was incorporated as recently as August 2, 2007, and additional updates are a possibility. It was beyond our resources to generate and distribute new radar file help sheets to each office for tweaks, so we began posting the guidance to the Internet in August 2006. We are committed to keeping current the guidance posted on the Web and ask that sites download it and use that guidance to supersede that which was provided with the radar file help sheet. Please periodically check the Web site for updates. Radar file help sheet content for orpgBackups.txt will hereafter only provide system-specific radar access permis-sions and refer to the Web site URL: http://www.roc.noaa.gov/ops/orpgBackups_web.pdf.
The Hotline is working with the ROC Program Branch in an effort to make the AWIPS radar file help sheets available 24 hours a day, 7 days a week via a ROC secure server. The access process would be very much like that for the Web based WSR-88D Comms Documentation. We project having the server operational by the end this calendar year.
Updates for Super Resolution and other Build 10.0 and 11.0 changes in the pipeline will be addressed in the next Issue of NEXRAD Now.
(Continued on Page 24)
Comms Front (Cont.)

Now
NEXRAD
page 24
(Continued from Page 23)
WSR-88D Radar Operations Center (ROC) Electronic Telecommunications Event Monitor-ing & Emergency Restoral (ROCETEER) now has frame-relay permanent virtual circuits (PVCs) in place from the ROC frame-relay cloud and ROCE-TEER system to 94 RPGs, 25 of which were newly added this summer to coastal locations from south Texas to the northeast Atlantic coast. The ROCET-EER now has connectivity to all CONUS Depart-ment of Defense (DoD) systems, all FAA systems, and 61 NWS RPGs as noted in Table 1. This net-work management system and its architecture will enable the ROC to better support the complexities the field incurs in managing WSR-88D servers and network devices, especially during implementation of WSR-88D hardware and software build releases, security updates and project Modification Notes. The ROCETEER employs FCAPS (Fault, Configu-ration, Accounting, Performance, and Security) concepts to manage the exist-ing frame-relay WAN and to monitor mission-critical field devices using native Simple Network Management Protocol (SNMP) applications. The Net-work Management Servers poll mission-critical network devices by acting as SNMP server hosts for device faults (traps) for network events and performance, and thereby enable the ROC to remotely manage and troubleshoot cir-cuits and end-devices non-intrusively. The ROCETEER will also enable the ROC to remotely assist with diagnosing and restoring WAN connectiv-
ity and troubleshooting. Additionally, the system could be employed for emergency restoral or radar backup purposes by connecting the ROCETEER to the ROC AWIPS, and thereby to the AWIPS terres-trial WAN, to reroute radar data to central collection and the Satellite Broadcast Network (SBN) - think in terms of another Hurricane Katrina or other natu-ral or unnatural catastrophe. Near-term plans addi-tionally include connections to NOAAnet and a Satellite network. We envision the greatest day-in and day-out utility of this new tool will lie in improved network supportability for the ever-increasing number of TCP/IP connected users.
Questions about any of these initiatives can be directed to Mark Albertelly, WSR-88D Hotline Telecommunications & New Systems Interfacing POC at [email protected].
Mark AlbertellyROC Operations Branch
Comms Front (Cont.)
NWS EASTERN REGION
KAKQ KBOX KBUF KCAE KCCX KCLE KCLX KCXX KDIX
KGYX KLTX KLWX KMHX KOKX KRAX
NWS SOUTHERN REGION
KABX KAMX KBMX KBRO KBYX KCRP KDGX KEPZ KEWX
KFFC KFWS KHGX KHTX KINX KJAX KLCH KLIX KLZK
KMOB KMLB KMRX KNQA KOHX KSHV KSJT KSRX KTBW
KTLH KTLX
NWS WESTERN REGION
KDAX KESX KFSX KHNX KICX KMTX KNKX KSFX KSOX
KVTX
NWS CENTRAL REGION
KBIS KEAX KGJX KICT KLVX KPAH KVWX
Table 1: NWS RPG ROCETEER connections.

page 25
Now
NEXRAD
As meteorologists, the shared mantra of, “new techniques, more data and faster updates” has long been seen through the veil of Win-Win-Win, and is rarely filtered through the stark reality that every-thing in radar is a trade-off. We have all heard, “To get long unambiguous range (Rmax), one must give up high unambiguous velocity (Vmax),” and “For faster volume coverage pattern (VCP) updates, one must give up elevation cuts.” Even though these truths make sense, we still want long Rmax AND high Vmax. Operators want faster VCPs AND more elevation cuts…. Given these facts of human nature, the ROC and our partners strive to develop new algorithms, processes, and techniques to meet these desires. To this end, we now have faster VCPs, less range-folded velocity data and other initiatives to provide end users with “More, Newer, Faster.” These things are all good; however, they do come with a cost, and have some aspects that impact the overall quality of the data. It is important to present some lesser advertised aspects of data quality, focus on understanding data quality compromises, and help operators under-stand the trade-offs when making operational deci-sions.
Compromises? Surely there are none in NEXRAD data. Oh, but there are! To get the dis-cussion rolling, let’s start with an “oldie but goodie” - the Doppler Dilemma. Then we’ll move from this familiar topic through several others, and introduce some new radar-related dilemmas.
The Doppler Dilemma (DD) is best described by two simple equations, both of which depend on one variable: Pulse Repetition Frequency (PRF). The problem or “dilemma” in this case is the two equations have an inverse dependence on the vari-able. When considering Vmax, the PRF term is in the numerator, indicating that as PRF increases, so does Vmax. In the Rmax equation, the PRF term is
in the denominator so as PRF increases, unambiguous range decreases. That’s the dilemma. We simply can’t have it both ways … or can we? Let’s examine some of the “slight-of-hand” used to mitigate the impacts of the Doppler Dilemma.
Consider, for example, the WSR-88D VCP scan strategies. As alluded to in the introduction, when it comes to scan strategies it’s simple: we want more, newer, faster. No doubt operators are familiar with the WSR-88D “split cuts,” which are used for data collection in the lowest two tilts. It may be surpris-ing to know that the split cut concept is itself a compromise used to mitigate the DD. We want BOTH the capability to range distant storm cells as well as the ability to measure a large Nyquist co-interval. By invoking the “split cut” wave form, a low PRF in the first “cut” can be used to give long ranging capability. The Nyquist interval is neces-sarily very small because we’ve sought to maxi-mize Rmax. Then, another cut is done (hence the name “split cuts”) using a high PRF, optimizing the velocity calculations and giving a large Nyquist interval. Now we CAN have our cake and eat it, too, and without compromising - right? It seems that’s the case, but we have indeed compromised. Think about how much time could be shaved off a VCP if we use an intermediate PRF, and use both the surveillance and Doppler information from it? Neither Rmax or Vmax will be optimum, but it’s certainly doable. And, we’ll save quite a bit of time, thereby giving our operators faster VCP updates. So, there was indeed a compromise.
(Continued on Page 26)
The Data Quality Dilemma - There’s No Free Lunch

Now
NEXRAD
page 26
(Continued from Page 25)
OK...what about higher up in the volume scan? WSR-88D mid-level tilts use a wave formcalled “Batch Mode.” And, just like the split cuts we discussed, there are significant compromises in these tilts. In these middle elevations, data from beyond the first Doppler trip are expected, but ground clutter contamination is generally not a major problem. The Batch Mode technique uses a combination of low and high PRFs for each radial within the elevation scan. For each radial, the radar transmits a few pulses using a low PRF (long Rmax) to obtain reflectivity data and accurate range information. Then for the remainder of the 1° sweep, the transmitter switches to a high PRF (high Vmax) to obtain more accurate Doppler informa-tion. This series of a few (generally 3-8) low PRF pulses and several (25 or more) high PRF pulses per radial provides two complete Doppler power spectra data sets for each radial. The high PRF data are used to calculate the three base moment (reflec-tivity, velocity and spectrum width) estimates. The low PRF data are used to range-unfold the high PRF data and to calculate the reflectivity estimates for the range gates where the Doppler reflectivity estimates are not available (range-folded gates). Are there any compromises in this data collection philosophy? Sure... there are several. First of all, to save time, there are fewer total pulses. This increases variance, which in turn affects velocity estimates, and all down stream algorithms. Clutter suppression has also been seen to impact the data
harder in these upper tilts, due to fewer pulses sampling the targets.
So there are, and always have been, compromises in NEXRAD data quality. They exist because of physics, meteorology and
operational requirements, as well
as, equipment limitations (such as how fast the antenna can turn, elevation limits (both low and high), how fast the computers can process the radial-by-radial data, how much bandwidth is available, etc.).
Now, let’s switch gears a bit and look at some of the new data processing techniques and algorithms. A few years ago, one of the ROC Applications Branch scientists developed a way to mitigate the Doppler Dilemma using a new scan strategy called the Multi-PRF Dealiasing Algorithm or MPDA. MPDA makes use of a basic principle with which most meteorologists are familiar. Changing the PRF will change where the purple haze is located on radar products. The theory resulted in the cre-ation of a new VCP which made two extra rotations in the split cuts. Remember, there is already one Doppler rotation in the split cuts. So, two more high PRF rotations provide three different looks at the same data, using three different PRFs, each of which places the purple haze in a different area. Visualize overlaying these products (sort of like a composite reflectivity product) and it can be seen that by doing so, valid velocities will often be found where previously there was only purple haze. Voila! We’ve mitigated the Doppler Dilemma. Well, not so fast … what we’ve done is prove if we gather more data, the information can be used to our benefit. The cost? It takes more time to collect those extra cuts, a more complicated algorithm eats up more processing time, and there’s an increase in bandwidth required. But, the concept has proven itself, and many sites like and use VCP 121 exten-sively, especially during tropical situations.
Having discussed a few of the more familiar compromises associated with operating a net-worked weather warning radar, let’s move into a realm that’s more “obscure,” and which is actually
(Continued on Page 27)
There’s No Free Lunch (Cont.)

page 27
Now
NEXRAD
(Continued from Page 26)
the reason for this article. We call it the “Data Quality Dilemma” and here are some examples for consideration.
Clutter suppression is obviously important to data quality, so let’s take a close look at the old leg-acy technique and the new Gaussian Model Adap-tive Processing (GMAP) suppression algorithm. “Back in the day,” there were radar sites with so much clutter it couldn’t be removed, even when running on “high” with all bins invoked. And, there were some sites where, although the terrain could be removed, the algorithm often cut big chunks out of the data (Figure 1).
So, it seems suppression was either too aggres-sive, or not aggressive enough. At many of these sites, the compromise was to either use lower sup-pression to retain more weather signal, or use higher suppression to remove terrain. Enter the new era of suppression and GMAP. In its original form, in order to emulate legacy suppression, GMAP was extremely aggressive and also took large chunks
out of products, just as the legacy system did. This was especially noticeable along the zero isodop (Figure 2). However, there’s a silver lining. GMAP is adaptable enough that engineers are able to change the default settings, making it less aggres-sive, while still removing nearly all the clutter. And, GMAP offers logic which can detect the weather signal within the spectrum, and rebuild it after the clutter signal is removed, thereby replac-ing lots of weather-like data that was previously removed. That’s great! Or is it? By utilizing GMAP’s ability to rebuild weather signal, we now often see more traffic along highways during duct-ing situations, than we did earlier (Figure 3). The algorithm looks for velocity signatures with broad spectrum width; and, traffic fits those requirements just fine. So, again... another compromise.
Let’s take a look at the new SZ-2 VCPs. These VCPs use a pulse phase encoding technology which allows the radar to “know” when each pulse was transmitted. This allows the system to deter-
(Continued on Page 28)
There’s No Free Lunch (Cont.)
Figure 1: Data lost while attempting clutter suppression.
Figure 2: GMAP data in its original form.

Now
NEXRAD
page 28
(Continued from Page 27)
mine whether a returning pulse is from the first trip, the second, third, etc. This technique greatly reduces the amount range-folded data on the veloc-ity products. So far so good; this sounds like a win-win. But, the ROC has determined that clutter
filtering all bins when running SZ-2, can noticeably impact the data. The result of combining SZ-2 with all bin suppression is a slight decrease in both reflectivity and velocity fields. When running with the bypass map, this hasn’t been found to be an issue. So, we have yet another compromise. An operator must decide whether it is more important for the given situation to utilize the range-unfolding capabilities of an SZ-2 VCP, or the widespread sup-pression capability of “all bin” suppression. The ROC recommends using the bypass map most of
the time, so this shouldn’t affect most sites unless there’s strong AP in the vicinity, requiring the use of all bin suppression. Still, it is a compromise of which operators should be aware.
Since we’re talking about VCPs, it’s probably a good time to discuss a few more. We’ll start with the most familiar and move forward from there. Table 1 provides some key information pertaining to some popular VCPs. The “Cuts” column indi-cates the number of times the antenna turns around during a full VCP. The “Surv Cut Time” indicates how long it takes the antenna to make one revolu-tion while completing the first split cut. And, the “Total Time” column shows how long it takes to complete a full VCP.
The work horse VCPs for the WSR-88D have always been VCPs 11 and 21. Take a look at VCP 21. “Back in the day” when not in clear air mode, most sites operated the radar in VCP 21. It makes a total of 11 cuts, in 360 seconds. One surveillance scan took 31.7 seconds while sending out 28 pulses per radial. When things got hairy, operators moved to VCP 11 which makes 5 MORE cuts in one minute less time! The antenna was asked to spin nearly twice as fast in the surveillance cut, AND we only send out 17 pulses. So, we have a trend. To get more, faster, we can always spin the antenna faster and send out fewer pulses, right? Would a subjec-tive analysis of the data reveal any differences? Sure it would. When looking at VCP 11, we would notice more data density in the upper tilts, and we would also see that clutter suppression was a bit
harder on the data, due to fewer pulses. And, fewer pulses means the averages (both reflectivity and velocity) will have
(Continued on Page 29)
There’s No Free Lunch (Cont.)
Table 1: Information concerning “popular” VCPs.
Figure 3: Traffic along highways during ducting situations.

page 29
Now
NEXRAD
(Continued from Page 28)
higher variances. Was “more and faster” worth the trade-off? We think so, and if the use of the VCP is any indication, operators everywhere agreed.
Now, let’s move on to the new kid on the block: VCP 12. This VCP was also a direct result of oper-ators wanting more, better, faster. They wanted bet-ter vertical resolution in the lower elevation angles and they wanted faster update times (VCP comple-tion times). VCP 12 was the answer and it has become very popular for working through severe weather situations. It provides one more cut in the lower levels for better vertical resolution; two less pulses are transmitted per radial on the surveillance cut; and the total VCP time decreased by nearly a full minute to 250 seconds. All in all, VCP 12 was a significant step forward for severe weather opera-tions. But, these benefits do have costs. Clutter sup-pression is especially hard on VCP 12 data, due to the decreased number of pulses the signal proces-sor has to work with. The antenna is spinning quite fast which artificially increases the variance in the base data. This, in-turn, may affect downstream products. So again, compromises with the system are obvious.
In summary, the basic tenant of the Data Qual-ity Dilemma is: The faster data is collected, the lower the quality of the data. It’s a pretty intuitive concept. Imagine holding the radar still in “spot light” mode, the data would be excellent, contain lots of detail, and have low variance. As the antenna begins to spin, the data begins to degrade a bit since dwell time, which was unlimited in spot-light mode, begins to get smaller and smaller, which allows fewer and fewer pulses to resolve the target. Fewer pulses mean more variance in the base data estimates. More variance means that both the base products and algorithm-generated prod-ucts will be affected. And, this relationship appears
to be somewhat proportional. In other words, the faster data is collected, the more the data is degraded. And, considering clutter suppression: over-suppression degrades the data, and under-sup-pression degrades the data. That really is a dilemma!
The ROC and the Warning Decision Training Branch continually solicit ideas from the field con-cerning improvements to the radar which will help forecasters and technicians do their jobs. And, the ROC is always developing techniques and algo-rithms to fit specified needs. But, always remem-ber, there is no free lunch; any time more and/or faster data is received, the result will likely be a compromise. The best VCP for handling strong storms near the radar is not the best for handling those same storms at distance. The best VCP for peering into the clear air regime is neither best for measuring wind velocity or for working severe weather. And, a VCP which does all of these things adequately, isn’t necessary best at any one task.
All radars are full of compromises. They have always been there, and they always will be. Each radar focal point should continue working with their staff and the Unit Radar Committees to inves-tigate these new techniques as they’re developed and fielded. Be aware of the compromises, and for questions, call the ROC to get the explanations. URC meetings are a good time to have a ROC rep-resentative brief field sites on new technology and changes in the software.
Tony RayROC Operations Branch
Joe ChrismanROC Engineering Branch
There’s No Free Lunch (Cont.)
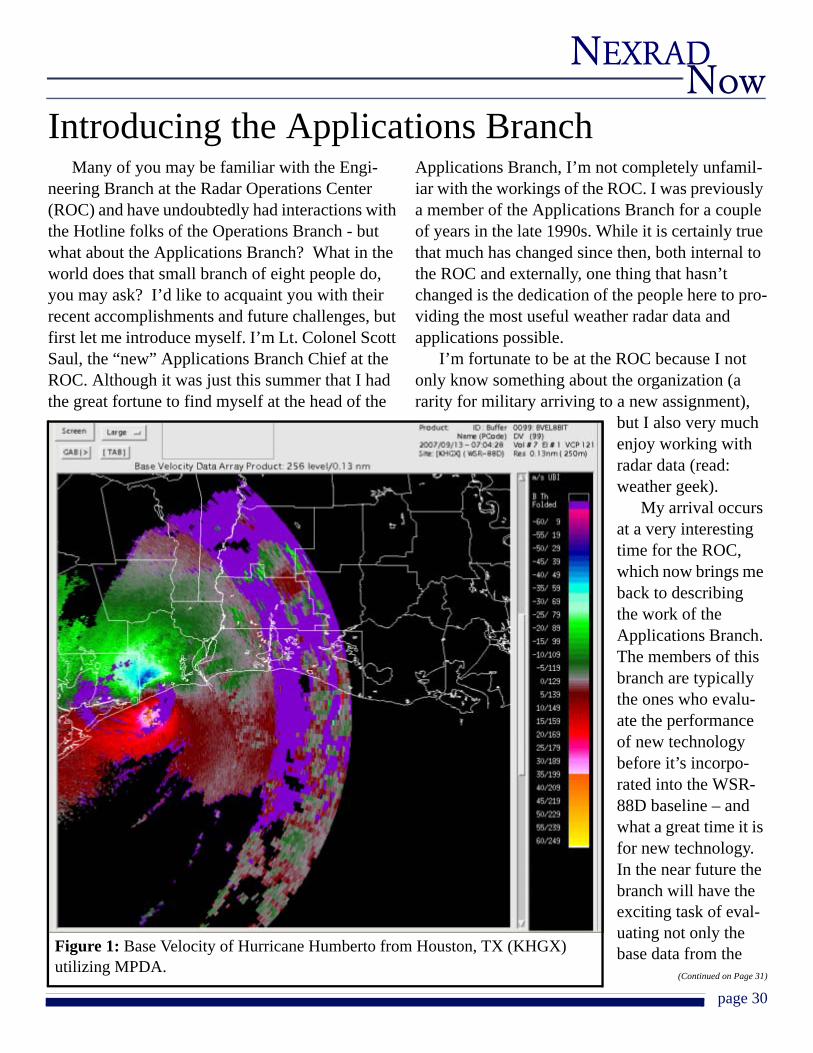
Now
NEXRAD
page 30
Many of you may be familiar with the Engi-neering Branch at the Radar Operations Center (ROC) and have undoubtedly had interactions with the Hotline folks of the Operations Branch - but what about the Applications Branch? What in the world does that small branch of eight people do, you may ask? I’d like to acquaint you with their recent accomplishments and future challenges, but first let me introduce myself. I’m Lt. Colonel Scott Saul, the “new” Applications Branch Chief at the ROC. Although it was just this summer that I had the great fortune to find myself at the head of the
Applications Branch, I’m not completely unfamil-iar with the workings of the ROC. I was previously a member of the Applications Branch for a couple of years in the late 1990s. While it is certainly true that much has changed since then, both internal to the ROC and externally, one thing that hasn’t changed is the dedication of the people here to pro-viding the most useful weather radar data and applications possible.
I’m fortunate to be at the ROC because I not only know something about the organization (a rarity for military arriving to a new assignment),
but I also very much enjoy working with radar data (read: weather geek).
My arrival occurs at a very interesting time for the ROC, which now brings me back to describing the work of the Applications Branch. The members of this branch are typically the ones who evalu-ate the performance of new technology before it’s incorpo-rated into the WSR-88D baseline – and what a great time it is for new technology. In the near future the branch will have the exciting task of eval-uating not only the base data from the
(Continued on Page 31)
Introducing the Applications Branch
Figure 1: Base Velocity of Hurricane Humberto from Houston, TX (KHGX) utilizing MPDA.

page 31
Now
NEXRAD
(Continued from Page 30)
dual polarization (dual pol) upgrade, but also the new derived products made possible by dual pol.
The Applica-tions Branch is also called when a Hotline inquiry requires particu-larly specialized meteorological or radar expertise. Branch members convert new algo-rithms from research code into production code to ensure implemen-tation in a stan-dard format. But best of all, the folks in the Appli-cations Branch understand the technical needs of the operations community, and work - often with research scientists - to develop better base data and increased algorithm performance.
One example of recent work, which will soon be seen in the field, is in the area of data quality improvement. A modified volume coverage pattern (VCP) will soon be available that combines the SZ-2 (Sachidananda/ Zrnic (8/64) Phase Coding Algo-rithm) technique utilized by the 200 series VCPs with the Multiple PRF Dealiasing Algorithm (MPDA). By combining the two techniques, this
newly modified VCP significantly reduces the amount of range-folded data, which mitigates the weaknesses inherent in each and capitalizes on their strengths. Figures 1 and 2 (Houston, TX and Lake Charles, LA) illustrate the base velocity of Hurricane Humberto utilizing MPDA and SZ-2 respectively. Each was able to reduce range-fold-ing, but issues remain with both. In Figure 3 the newly enhanced VCP utilizing both techniques is shown. The range-folding issues from the previous
(Continued on Page 32)
Figure 2: Base Velocity of Hurricane Humberto from Lake Charles, LA (KLCH) utilizing SZ-2.
Introducing (Cont.)

Now
NEXRAD
page 32
(Continued from Page 31)
figures are almost completely resolved. Of course this enhanced VCP will be useful in situations other than hurricanes, and will be available in soft-ware Build 10.0.
In the future, improvements in the coverage of the Velocity Azimuth Display (VAD) Winds Prod-uct (VWP) are expected as we utilize a high-order polynomial regression technique instead of simply a first order sine curve fit to develop the VAD. Fig-ures 4 and 5 dis-play the difference in the VWP product coverage utiliz-ing the existing VAD computa-tion and the polynomial regression tech-nique respec-tively. It only takes a cursory inspection to distinguish the dramatic decrease in the “no data” flags with the later technique.
The Appli-cations Branch personnel are also responsi-ble for leading and directing the WSR-88D Data Quality Working Group
(DQWG). The DQWG is composed of meteorolo-gists, researchers, radar engineers, and managers from the Radar Operations Center, Office of Sci-ence and Technology, National Severe Storms Laboratory, Weather Decision Training Branch, University of Oklahoma’s Atmospheric Radar Research Center, and other tri-agency organiza-tions. The primary purpose of the working group is to ensure the WSR-88D system the highest possi-
(Continued on Page 33)
Figure 3: Base Velocity of Hurricane Humberto from Lake Charles, LA (KLCH) uti-lizing enhanced VCP with both MPDA and SZ-2 processing.
Introducing (Cont.)
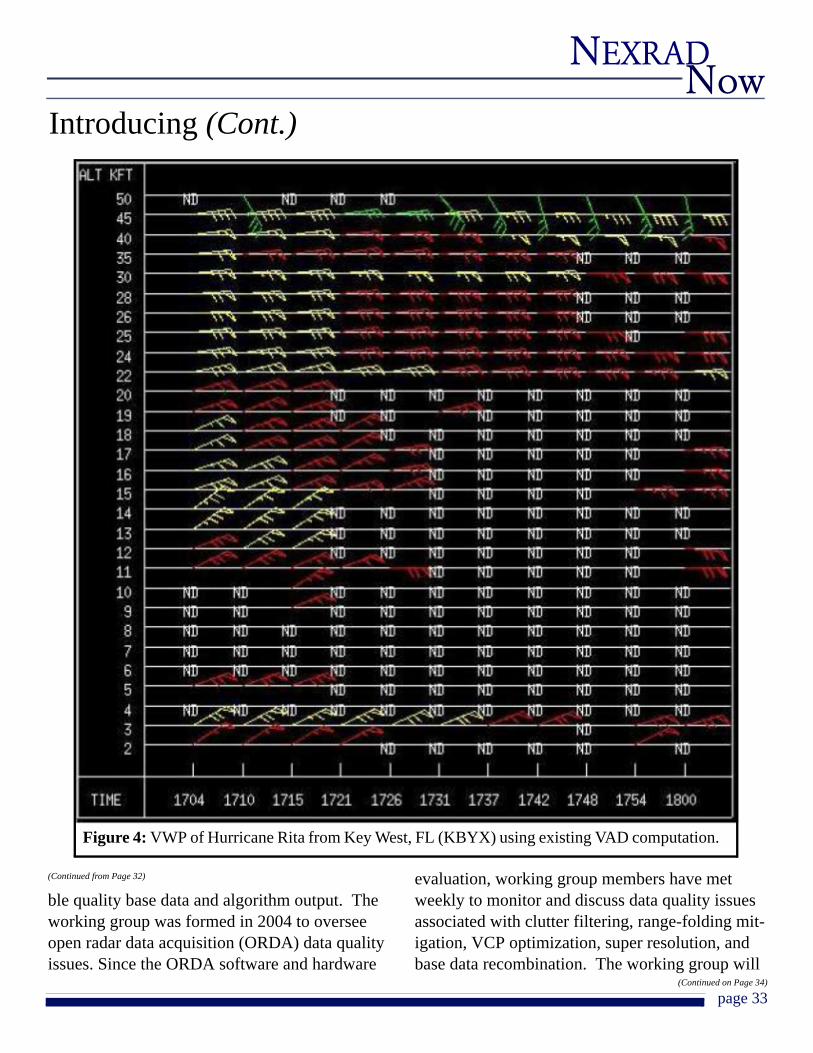
page 33
Now
NEXRAD
(Continued from Page 32)
ble quality base data and algorithm output. The working group was formed in 2004 to oversee open radar data acquisition (ORDA) data quality issues. Since the ORDA software and hardware
evaluation, working group members have met weekly to monitor and discuss data quality issues associated with clutter filtering, range-folding mit-igation, VCP optimization, super resolution, and base data recombination. The working group will
(Continued on Page 34)
Figure 4: VWP of Hurricane Rita from Key West, FL (KBYX) using existing VAD computation.
Introducing (Cont.)

Now
NEXRAD
page 34
(Continued from Page 33)
continue to address data quality issues in the future including staggered pulse repetition time (PRT) processing (a range mitigation solution for upper levels), advanced clutter mitigation, and dual polarization products and capabilities. The bottom
line is the Applications Branch consists of dedi-cated experts committed to delivering the best radar data possible.
Scott H. SaulChief, ROC Applications Branch
Figure 5: VWP of Hurricane Rita from Key West, FL (KBYX) using polynomial regression technique.
Introducing (Cont.)