AutoStack-CORE Automotive Fuel Cell Cluster for Europe II 2_Slot 6... · AutoStack-CORE Automotive...
16
Click to add title AutoStack-CORE Automotive Fuel Cell Cluster for Europe II Ludwig Jörissen Speaker Affiliation http://autostack.zsw-bw.de [email protected] Programme Review Days 2016 Brussels, 21-22 November
Transcript of AutoStack-CORE Automotive Fuel Cell Cluster for Europe II 2_Slot 6... · AutoStack-CORE Automotive...

Click to add title
AutoStack-COREAutomotive Fuel Cell Cluster for Europe II
Ludwig JörissenSpeaker Affiliation
http://[email protected]
Programme Review Days 2016Brussels, 21-22 November
PROJECT OVERVIEW
Project InformationCall topic SP1-JTI-FCH.2012.1.2
Grant agreement number 325335
Application area (FP7) orPillar (Horizon 2020) Transport and Refuelling Infrastructure
Start date 01/05/2013
End date 28/02/2017
Total budget (€) 14 673 625
FCH JU contribution (€) 7 757 273
Other contribution (€, source) -
Stage of implementation 91% project months elapsed vs total projectduration, at date of November 1, 2016
Partners ZSW, BMW, CEA, DANA, Fraunhofer, JRC-IET,Freudenberg, PSI, Powercell, Greenerity, VW,Volvo, Swiss Hydrogen

PROJECT SUMMARY
Objectives– Develop best of its class
automotive stack technology– Utilize industrial components
and materials– Establish platform concept to
enable additional vehicle andstationary applications
– Ensure scalability to addressvarious power levels
– Achieve highest power densityto address packaging and cost
– Reduce Pt-use while maintainingperformanceEvo1 Evo2

PROJECT PROGRESS/ACTIONS – Volume,Weight Related to Nominal Power
Aspectaddressed Parameter (KPI) Unit SoA
2016FCH JU Targets
Call topic 2017 2020
Weight Specific [email protected] A/cm2 kW/kg 2.9
(3.0 @ peak)> 2 - -
Volume Power Density @1.5 A/cm2 kW/l 3.5
(4.0 @ peak)> 2 - -
2 kW/kg2 kW/l
2.22.7
value
25% 50% 75%
Future steps:Goal achieved,further design optimizations are targeted to improve manufacturing and makeuse of improved peak power capabilities
Achievementto-date% stage ofimplement.
2.9 kW/kg 3.5 kW/l

PROJECT PROGRESS/ACTIONS –Weight,Volume Related to Nominal Power
2 kW/kg2 kW/l
2.22.7
value
25% 50% 75%
Achievementto-date% stage ofimplement.
2.9 kW/kg 3.5 kW/l
Specifications Unit Target EVO1Outcome
EVO2-AOutlook
Volume of the stack exterior dm3 <55 34.3 ~27.7
Weight without fluids an fullyhumidified membranes (netweight)
kg <44 46.3 33.1
Power density at nominal load kW/dm3 2.7 ~3.55
Power density at peak load kW/dm3 2.8 ~4.05

PROJECT PROGRESS/ACTIONS –Weight,Volume Related to Peak Power
2 kW/kg2 kW/l
2.22.7
value
25% 50% 75%
Achievementto-date% stage ofimplement.
2.9 kW/kg 3.5 kW/l
0.0
0.5
1.0
1.5
2.0
2.5
3.0
3.5
4.0
Nissan Honda Toyota ASCStack 2.5 3.1 3.1 4
Pow
erDe
nsity
/kW
l-1
Power Density related to Peak Power

PROJECT PROGRESS/ACTIONS – Performance
Aspectaddressed Parameter (KPI) Unit SoA
2016FCH JU Targets
Call topic 2017 2020Avg. Cell-
PerformanceAverage single cell
voltage @ mV
1.5 A cm-2 652 675 - -1.9 A cm-2 590 - - -
606 mV511 mV
675 mV600 mV
value
25% 50% 75%
Future steps:Improve operating conditionsImprove activation procedureOptimize material combination: CCM, GDL
Achievementto-date% stage ofimplement.
652 mV 590 mV

PROJECT PROGRESS/ACTIONS – Performance
606 mV511 mV
675 mV600 mV
25% 50% 75%
Achievementto-date% stage ofimplement.
652 mV 590 mV
0.50
0.55
0.600.65
0.70
0.75
0.800.85
0.90
0.95
1.00
0 500 1,000 1,500 2,000
U/
V
i / mA cm-2
Target Evo2-RNZ-020-002: 15 um; alloy 1
BEL-006 Evo1 Full Stack, 15 um, alloy 1 2012 state of the art
Stack Operating ConditionsReactants A/C: H2 / Air
Evo2-RNZ-020-002 30%N2 in H2 / AirTemperature Stackinlet: 68 °CPressure Stackoutlet A/C: 220 / 200 kPa absDew Point Stackinlet: 49 / 53 °C
2012 state of the art: 55 / 60 °CStöchiometry A/C : 1.4 / 1.8
2012 state of the art: 1.4 / 2.0
MEA: Evo1-alloy on 15µmCathode: 0.40 mg/cm2
Anode: 0.10 mg/cm2
GDL: H15Cx483

PROJECT PROGRESS/ACTIONS – Performance
606 mV511 mV
675 mV600 mV
25% 50% 75%
Achievementto-date% stage ofimplement.
638 mV 594 mV
0.50
0.55
0.60
0.65
0.70
0.75
0.80
0.85
0.90
0.95
1.00
0 500 1,000 1,500 2,000
U/
V
i / mA cm-2
Target Evo2-PCS-010-006, Evo2, 15 um Pt2, BOL Evo2-PCS-010-006, Evo2, 15 um Pt2, Break-In
MEA: Evo2-Pt on 15µmCathode: 0.25 mg/cm2
Anode: 0.10 mg/cm2
GDL: H15Cx483
BreakIn-Cond.: Reference-Cond.:T.Si.Cl 73°C 68°CDPT.A / C 72°C / 72°C 53°C / 48.4°CStoic.A / C 2.0 / 2.8 1.4 / 1.6p.So.A / C 1.2 / 1.0 barg 1.2 / 1.0 barg

PROJECT PROGRESS/ACTIONS – Cost
Aspectaddressed Parameter (KPI) Unit SoA
2016FCH JU Targets
Call topic 2017 2020
CostSpecific cost
comparable to DoEstudies
€/kW36,81@ 30 000p.a.
- ~48.1 * ~24.1*
> 100€/kW
30€/kW
25% 50% 75%
Future steps:Improve BPP-designImprove manufacturing processes
Achievementto-date% stage ofimplement.
36.81 €/kW
* Based on 48.1% system cost described in MAIP 2008-2013ratio taken from B.D. James et al.: Mass Production Costestimation of direct H2 PEM Fuel Cell Systems fortransport applications

PROJECT PROGRESS/ACTIONS – Cost
0 €
500 €
1,000 €
1,500 €
2,000 €
2,500 €
3,000 €
3,500 €
4,000 €
4,500 €
5,000 €
5,500 €
6,000 €
6,500 €
7,000 €
Material directand material
overhead costs
Manufacturingprocess
Aggregationcomparable toDOE studies
Organisationalcosts, profit
andscrap (Tier 2)
Organisationalcosts, profit
andscrap (Tier 1)
Logistic costs Costs
2,874
6663,540
780
919
22
5,261
²
0 €
500 €
1,000 €
1,500 €
2,000 €
2,500 €
3,000 €
3,500 €
4,000 €
4,500 €
5,000 €
5,500 €
6,000 €
6,500 €
7,000 €
Material directand material
overhead costs
Manufacturingprocess
Aggregationcomparable toDOE studies
Organisationalcosts, profit
andscrap (Tier 2)
Organisationalcosts, profit
andscrap (Tier 1)
Logistic costs Costs
3,812
700 4,512
1,005
1,172
22
6,711
²
¹ Pt content: 0,50 mg/cm² (EVO1) and 0.35 mg/cm² (EVO2) [Pt price = 1.500 $/tr.oz, similar to DOE study, 2014] {Exchange rate from 20.11.2014: 1 US Dollar (USD) = 0,798 Euro (EUR)}
² Incl. SG&A and R&D3 Incl. Logistic costs for components and stack (Tier1 and Tier2)
> 100€/kW
30€/kW
25% 50% 75%
Achievementto-date% stage ofimplement.
36.81 €/kW

SYNERGIES WITH OTHER PROJECTS ANDPROGRAMMES
Interactions with projects funded under EU programmes
Stack-Test Use of project results (test modules and test programs)
IMPACT Exchange of information
Interactions with national and international-level projects and initiatives
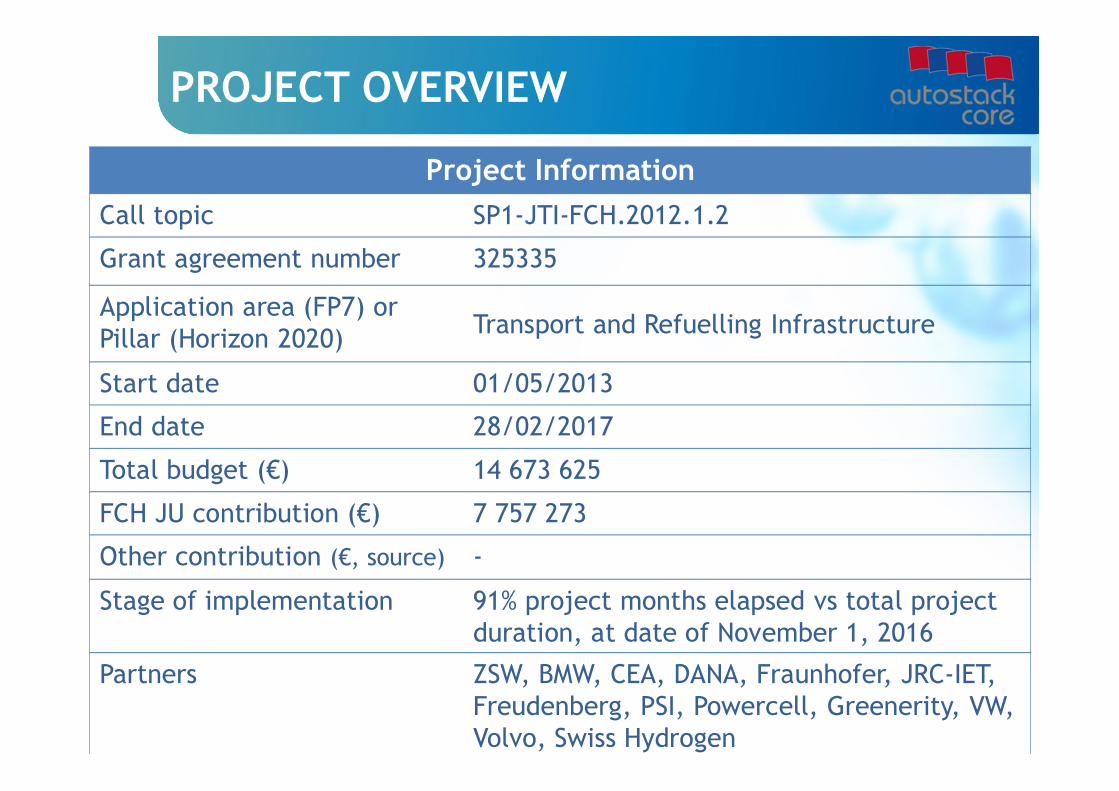
Social media
http:autostack.zsw-bw.de
DISSEMINATION ACTIVITIES
Conferences/Workshops
1 organised by the project
1 in which the project has participated
Public deliverables
1 « Stakeholder WorkshopDocumentation «
Publications: 2
A. Martin, L. Jörissen, ECS Transactions 42 (1) 31-38 (2012)
A. Martin, L. Jörissen, Hypothesis 2016 Provceedings Volume
Patents: 1 application
EXPLOITATION PLAN/EXPECTED IMPACT
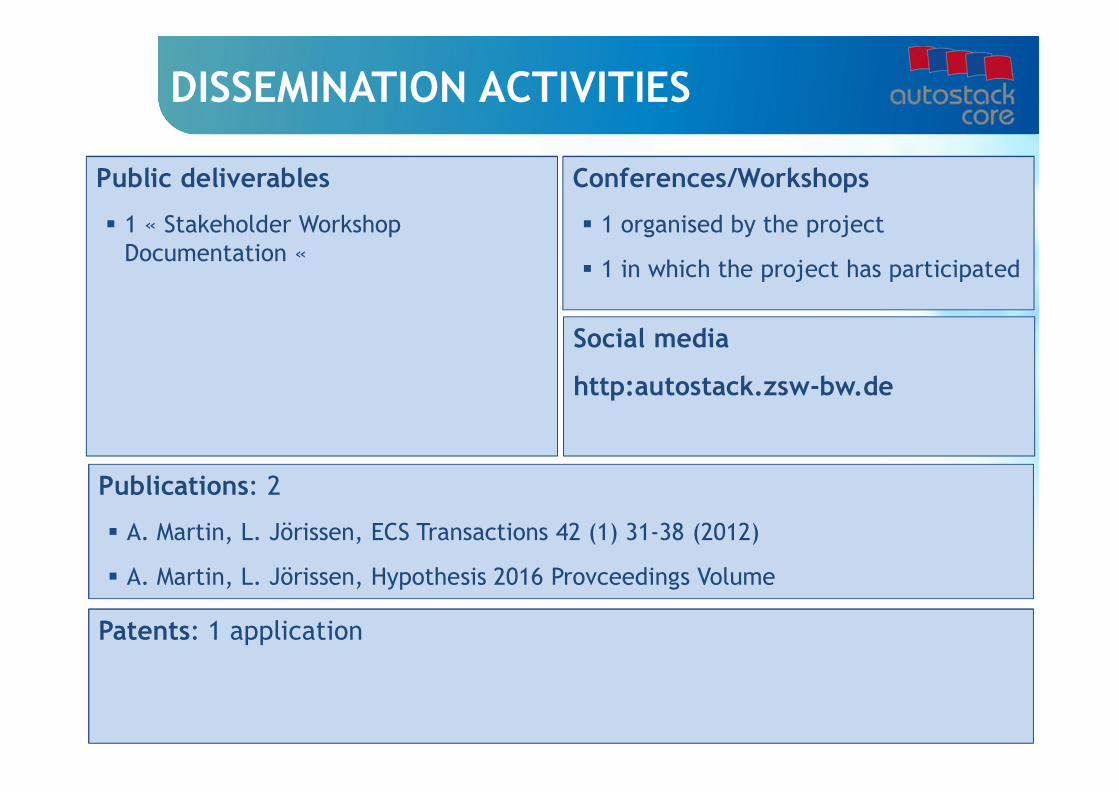
Exploitation
Several specific businessdiscussions with OEMs.
Test sample sold to third partyOEM.
One full size stack sold to avehicle demo project.
Stacks used in 2 new andprovided to 3 additional FCH-JU projects
Discussions on follow-upproject with 4 OEMsconsolidated.
Impact
Low stack numbers suppplyfor demo and testingcurrently.
Development is recognized inthe community.
Successful demonstration,feedback on stack robustnessin real world operation.
Limited production for demomarket launch in the next 12to 24 months.
Volume production intendedin 2020.

RISKS AND MITIGATION
Risk 1
Mitigation 1
ProjectLOGO
Voltage of 675 mV at 1.5 A not reached under the operatingconditions defined in the project.
Improve matching of CCM, GDL and flow field.Reconsider system requirements to operating conditions, pressure,humidity and flow.
Risk 2
Mitigation 2
Risk 3
Mitigation 3