Autonomous Science Agents and Sensor Webs: EO-1 and Beyond
10
1 Autonomous Science Agents and Sensor Webs: EO-1 and Beyond Rob Sherwood, Steve Chien, Daniel Tran, Benjamin Cichy, Rebecca Castano, Ashley Davies, Gregg Rabideau Jet Propulsion Laboratory, California Institute of Technology 4800 Oak Grove Dr. Pasadena, CA 91109 [email protected] Abstract—An Autonomous Science Agent, part of the New Millennium Space Technology 6 Project is currently flying onboard the Earth Observing One (EO-1) Spacecraft. This software enables the spacecraft to autonomously detect and respond to science events occurring on the Earth. The package includes software systems that perform science data analysis, deliberative planning, and run-time robust execution. This software has demonstrated the potential for space missions to use onboard decision-making to detect, analyze, and respond to science events, and to downlink only the highest value science data. As a result, ground- based mission planning and analysis functions have been greatly simplified, thus reducing operations cost. We will describe several technology infusions applications being developed. We will also describe how the software has been used in conjunction with other satellites and ground sensors to form an autonomous sensor-web. 12 TABLE OF CONTENTS 1. INTRODUCTION ..................................................... 1 2. THE EO-1 MISSION .............................................. 2 3. ONBOARD SCIENCE ANALYSIS ............................. 2 4. ONBOARD MISSION PLANNING ............................ 3 5. ONBOARD ROBUST EXECUTION ........................... 4 6. TECHNOLOGY VALIDATION & FLIGHT STATUS .. 4 7. EO-1 SENSORWEB ................................................ 5 8. TECHNOLOGY INFUSION ...................................... 8 9. RELATED WORK & SUMMARY............................. 8 REFERENCES............................................................. 9 BIOGRAPHY ............................................................ 10 ACKNOWLEDGEMENT ............................................ 10 1. INTRODUCTION Since January 2004, the Autonomous Sciencecraft Experiment (ASE) running on the EO-1 spacecraft has demonstrated several integrated autonomy technologies to enable autonomous science. Several science algorithms including: onboard event detection, feature detection, change detection, and unusualness detection are being used to analyze science data. These algorithms are used to downlink science data only on change, and detect features of 1 0-7803-9546-8/06/$20.00© 2006 IEEE 2 IEEEAC paper #1628, Version 3, Updated December 20, 2005 scientific interest such as volcanic eruptions, growth and retreat of ice caps, cloud detection, and crust deformation. These onboard science algorithms are inputs to onboard decision-making algorithms that modify the spacecraft observation plan to capture high value science events. This new observation plan is then executed by a robust goal and task oriented execution system, able to adjust the plan to succeed despite run-time anomalies and uncertainties. Together these technologies enable autonomous goal- directed exploration and data acquisition to maximize science return. This paper describes the specifics of the ASE and relates it to past and future flights to validate and mature this technology. The ASE onboard flight software includes several autonomy software components: • Onboard science algorithms that analyze the image data to detect trigger conditions such as science events, “interesting” features, changes relative to previous observations, and cloud detection for onboard image masking • Robust execution management software using the Spacecraft Command Language (SCL) [10] package to enable event-driven processing and low-level autonomy • The Continuous Activity Scheduling Planning Execution and Replanning (CASPER) [4] software that replans activities, including downlink, based on science observations in the previous orbit cycles The onboard science algorithms analyze the images to extract static features and detect changes relative to previous observations. This software has already been demonstrated on EO-1 Hyperion data to automatically identify regions of interest including land, ice, snow, water, and thermally hot areas. Repeat imagery using these algorithms can detect regions of change (such as flooding, ice melt, and lava flows). Using these algorithms onboard enables retargeting and search, e.g., retargeting the instrument on a subsequent orbit cycle to identify and capture the full extent of a flood. Although the ASE software is running on the Earth observing spacecraft EO-1, the long-term goal is to use this software on future interplanetary space missions. On these missions, onboard science analysis will enable capture of short-lived science phenomena. In addition, onboard science analysis will enable data be captured at the finest time- scales without overwhelming onboard memory or downlink
Transcript of Autonomous Science Agents and Sensor Webs: EO-1 and Beyond

1
Autonomous Science Agents and Sensor Webs: EO-1 and Beyond
Rob Sherwood, Steve Chien, Daniel Tran, Benjamin Cichy, Rebecca Castano, Ashley Davies, Gregg Rabideau Jet Propulsion Laboratory, California Institute of Technology
4800 Oak Grove Dr. Pasadena, CA 91109
Abstract—An Autonomous Science Agent, part of the New Millennium Space Technology 6 Project is currently flying onboard the Earth Observing One (EO-1) Spacecraft. This software enables the spacecraft to autonomously detect and respond to science events occurring on the Earth. The package includes software systems that perform science data analysis, deliberative planning, and run-time robust execution. This software has demonstrated the potential for space missions to use onboard decision-making to detect, analyze, and respond to science events, and to downlink only the highest value science data. As a result, ground-based mission planning and analysis functions have been greatly simplified, thus reducing operations cost. We will describe several technology infusions applications being developed. We will also describe how the software has been used in conjunction with other satellites and ground sensors to form an autonomous sensor-web.12
TABLE OF CONTENTS
1. INTRODUCTION ..................................................... 1 2. THE EO-1 MISSION .............................................. 2 3. ONBOARD SCIENCE ANALYSIS ............................. 2 4. ONBOARD MISSION PLANNING ............................ 3 5. ONBOARD ROBUST EXECUTION ........................... 4 6. TECHNOLOGY VALIDATION & FLIGHT STATUS.. 4 7. EO-1 SENSORWEB ................................................ 5 8. TECHNOLOGY INFUSION ...................................... 8 9. RELATED WORK & SUMMARY............................. 8 REFERENCES............................................................. 9 BIOGRAPHY ............................................................ 10 ACKNOWLEDGEMENT ............................................ 10
1. INTRODUCTION
Since January 2004, the Autonomous Sciencecraft Experiment (ASE) running on the EO-1 spacecraft has demonstrated several integrated autonomy technologies to enable autonomous science. Several science algorithms including: onboard event detection, feature detection, change detection, and unusualness detection are being used to analyze science data. These algorithms are used to downlink science data only on change, and detect features of
1 0-7803-9546-8/06/$20.00© 2006 IEEE 2 IEEEAC paper #1628, Version 3, Updated December 20, 2005
scientific interest such as volcanic eruptions, growth and retreat of ice caps, cloud detection, and crust deformation. These onboard science algorithms are inputs to onboard decision-making algorithms that modify the spacecraft observation plan to capture high value science events. This new observation plan is then executed by a robust goal and task oriented execution system, able to adjust the plan to succeed despite run-time anomalies and uncertainties. Together these technologies enable autonomous goal-directed exploration and data acquisition to maximize science return. This paper describes the specifics of the ASE and relates it to past and future flights to validate and mature this technology. The ASE onboard flight software includes several autonomy software components:
• Onboard science algorithms that analyze the image data to detect trigger conditions such as science events, “interesting” features, changes relative to previous observations, and cloud detection for onboard image masking
• Robust execution management software using the Spacecraft Command Language (SCL) [10] package to enable event-driven processing and low-level autonomy
• The Continuous Activity Scheduling Planning Execution and Replanning (CASPER) [4] software that replans activities, including downlink, based on science observations in the previous orbit cycles
The onboard science algorithms analyze the images to extract static features and detect changes relative to previous observations. This software has already been demonstrated on EO-1 Hyperion data to automatically identify regions of interest including land, ice, snow, water, and thermally hot areas. Repeat imagery using these algorithms can detect regions of change (such as flooding, ice melt, and lava flows). Using these algorithms onboard enables retargeting and search, e.g., retargeting the instrument on a subsequent orbit cycle to identify and capture the full extent of a flood. Although the ASE software is running on the Earth observing spacecraft EO-1, the long-term goal is to use this software on future interplanetary space missions. On these missions, onboard science analysis will enable capture of short-lived science phenomena. In addition, onboard science analysis will enable data be captured at the finest time-scales without overwhelming onboard memory or downlink

2
capacities by varying the data collection rate on the fly. Examples include: eruption of volcanoes on Io, formation of jets on comets, and phase transitions in ring systems. Generation of derived science products (e.g., boundary descriptions, catalogs) and change-based triggering will also reduce data volumes to a manageable level for extended duration missions that study long-term phenomena such as atmospheric changes at Jupiter and flexing and cracking of the ice crust on Europa. The onboard planner (CASPER) generates mission operations plans from goals provided by the onboard science analysis module. The model-based planning algorithms enable rapid response to a wide range of operations scenarios based on a deep model of spacecraft constraints, including faster recovery from spacecraft anomalies. The onboard planner accepts as inputs the science and engineering goals and ensures high-level goal-oriented behavior. The robust execution system (SCL) accepts the CASPER-derived plan as an input and expands the plan into low-level commands. SCL monitors the execution of the plan and has the flexibility and knowledge to perform event driven commanding to enable local improvements in execution as well as local responses to anomalies.
2. THE EO-1 MISSION
Earth Observing-1 (EO-1) is the first satellite in NASA's New Millennium Program Earth Observing series [8]. The primary focus of EO-1 is to develop and test a set of advanced technology land imaging instruments. EO-1 was launched on a Delta 7320 from Vandenberg Air Force Base on November 21, 2000. It was inserted into a 705 km circular, sun-synchronous orbit at a 98.7 degrees inclination. This orbit allows for 16-day repeat tracks, with 3 over flights per 16-day cycle with a less than 10-degree change in viewing angle. For each scene, between 13 to as much as 48 Gbits of data from the Advanced Land Imager (ALI), Hyperion, and Atmospheric Corrector (AC) are collected and stored on the onboard solid-state data recorder. EO-1 is currently in extended mission, having more than achieved its original technology validation goals. As an example, over 18,000 data collection events have been successfully completed, against original success criteria of 1,000 data collection events. The ASE described in this paper uses the Hyperion hyper-spectral instrument. The Hyperion is a high-resolution imager capable of resolving 220 spectral bands (from 0.4 to 2.5 µm) with a 30-meter spatial resolution. The instrument images a 7.7 km by 42 km land area per image and provides detailed spectral mapping across all 220 channels with high radiometric accuracy. The EO-1 spacecraft has two Mongoose M5 processors. The first M5 is used for the EO-1 command and data handling functions. The other M5 is part of the WARP (Wideband Advanced Recorder Processor), a large mass storage device.
Each M5 runs at 12 MHz (for ~8 MIPS) and has 256 MB RAM. Both M5’s run the VxWorks operating system. The ASE software operates on the WARP M5. This provides an added level of safety for the spacecraft since the ASE software does not run on the main spacecraft processor.
3. ONBOARD SCIENCE ANALYSIS
The first step in the autonomous science decision cycle is detection of interesting science events. In the complete experiment, a number of science analysis technologies have been flown including:
• Thermal anomaly detection – uses infrared spectra peaks to detect lava flows and other volcanic activity. (See Figure 3a.)
• Cloud detection [9] – uses intensities at six different spectra and thresholds to identify likely clouds in scenes. (See Figure 3b.)
• Flood scene classification – uses ratios at several spectra to identify signatures of water inundation as well as vegetation changes caused by flooding. (See Figure 3c.)
• Change detection – uses multiple spectra to identify regions changed from one image to another. This technique is applicable to many science phenomena including lava flows, flooding, freezing and thawing and is used in conjunction with cloud detection. (See Figure 3c.)
• Generalized Feature detection – uses trainable recognizers to detect such features as sand dunes and wind streaks (to be flown).
Figure 3a shows both the visible and the infrared bands of the same image of the Mt. Etna volcano in Italy. The infrared bands are used to detect hot areas that might represent fresh lava flows within the image. In this picture, these hot spots are circled with red dotted lines. The area of hot pixels can be compared with the count of hot pixels from a previous image of the same area to determine if change has occurred. If there has been change, a new image might be triggered to get a more detailed look at the eruption.
Figure 3b shows a Hyperion scene and the results of the cloud detection algorithm. This MIT Lincoln Lab developed algorithm is able to discriminate between cloud pixels and land pixels within an image. Specifically, the grey area in the detection results is clouds while the blue area is land. The results of this algorithm can be used to discard images that are too cloudy.
Figure 3c contains 4 EO-1 Hyperion images of the Diamantina River in Australia, along with their corre-sponding classification images to the right of each image. The first image is a baseline image of the river in a dry state. The black area of the corresponding represents all land pixels with no water. The second image two weeks later

3
shows a large flood area with blue representing water pixels. The final two images show the flood receding over time.
The onboard science algorithms are limited to using 12 bands of the hyperion instrument. Of these 12 bands, 6 are dedicated to the cloud detection algorithm. The other six are varied depending on which science algorithm is used. The images used by the algorithm are “Level 0.5,” an intermediate processing level between the raw Level 0, and the fully ground processed Level 1. Each of the science algorithms except the generalized feature detection use simple threshold checks on the spectral bands to classify the pixels.
Figure 3a - Thermal Anomalies associated with volcano activity at Mt. Etna, visual spectra at left and infra-red at right.
Figure 3b - Cloud Detection of a Hyperion Scene – visual image at left, grey in the image at right indicates detected cloud.
Initial experiments used the cloud detection triggers. The MIT Lincoln Lab developed cloud detection algorithm [10] uses a combination of spectral bands to discriminate between clouds and surface features. The Hyperion Cloud
Cover (HCC) algorithm was run on all images acquired during ASE experiments. In the event of high cloud cover, the image could be discarded and a new goal could be sent to CASPER to reimage the area or image another high priority area. Images with low cloud cover can either be downlinked or analyzed further by other ASE science algorithms.
Figure 3c - Flood detection time series imagery of Australia’s Diamantina River with visual spectra at left and flood detection map at right. The JPL developed thermal anomaly algorithms uses the infrared spectral bands to detect sites of active volcanism. There are two different algorithms, one for daytime images and one for nighttime images. The algorithms compare the number of thermally active pixels within the image with the count from a previous image to determine if new volcanism is present. If no new volcanism is present, the image can be discarded onboard. Otherwise, the entire image or the interesting section of the image can be downlinked.
The University of Arizona developed flood scene classification algorithm uses multiple spectral bands to differentiate between land and water. The results of the algorithm include are compared with land and water counts from a previous image to determine if flooding has occurred. If significant flooding has been detected, the image can be downlinked. In addition, a new goal can be sent to the CASPER planning software to image adjacent regions on subsequent orbits to determine the extent of the flooding. We have noticed a few problems when ground testing this algorithm with existing Hyperion data. The presence of clouds or heavy smoke within an image can cause the algorithm to fail.
The Arizona State University developed Snow-Water-
Ice-Land (SWIL) algorithm is used to detect lake freeze/thaw cycles and seasonal sea ice. The SWIL algorithm uses six spectral bands for analysis.
4. ONBOARD MISSION PLANNING
In order for the spacecraft to respond autonomously to the science event, it must be able to independently perform the mission planning function. This requires software that can model all spacecraft and mission constraints. The

4
Continuous Activity Scheduling Planning Execution and Replanning (CASPER) [4] software performs this function for ASE. CASPER represents the operations constraints in a general modeling language and reasons about these constraints to generate new operations plans that respect spacecraft and mission constraints and resources. CASPER uses a local search approach [15] to develop operations plans.
Because onboard computing resources are scarce, CASPER must be very efficient in generating plans. While a typical desktop or laptop PC may have 2000-3000 MIPS performance, 5-20 MIPS is more typical onboard a spacecraft. In the case of EO-1, the Mongoose V CPU has approximately 8 MIPS. Of the 3 software packages, CASPER is by far the most computationally intensive. For that reason, our optimization efforts were focused on CASPER. Since the software was already written and we didn’t have funding to make major changes in the software, we had to focus on developing an EO-1 CASPER model that didn’t require a lot of planning iterations. For that reason, the model has only a handful of resources to reason about. This ensures that CASPER is able to build a plan in tens of minutes on the relatively slow CPU.
CASPER is responsible for mission planning in response to both science goals derived onboard as well as anomalies. In this role, CASPER must plan and schedule activities to achieve science and engineering goals while respecting resource and other spacecraft operations constraints. For example, when acquiring an initial image, a volcanic event is detected. This event may warrant a high priority request for a subsequent image of the target to study the evolving phenomena. In this case, CASPER modifies the operations plan to include the necessary activities to re-image. This may include determining the next over flight opportunity, ensuring that the spacecraft is pointed appropriately, that sufficient power, and data storage are available, that appropriate calibration images are acquired, and that the instrument is properly prepared for the data acquisition.
5. ONBOARD ROBUST EXECUTION
ASE uses the Spacecraft Command Language (SCL) [10] to provide robust execution. SCL is a software package that integrates procedural programming with a real-time, forward-chaining, rule-based system. A publish/subscribe software bus, which is part of SCL, allows the distribution of notification and request messages to integrate SCL with other onboard software. This design enables both loose or tight coupling between SCL and other flight software as appropriate.
The SCL “smart” executive supports the command and control function. Users can define scripts in an English-like manner. Compiled on the ground, those scripts can be dynamically loaded onboard and executed at an absolute or relative time. Ground-based absolute time script scheduling is equivalent to the traditional procedural approach to
spacecraft operations based on time. In the EO-1 experiment, SCL scripts are planned and scheduled by the CASPER onboard planner. The science analysis algorithms and SCL work in a cooperative manner to generate new goals for CASPER. These goals are sent as messages on the software bus.
Many aspects of autonomy are implemented in SCL. For example, SCL implements many constraint checks that are redundant with those in the EO-1 fault protection software. Before SCL sends each command to the EO-1 command processor, it undergoes a series of constraint checks to ensure that it is a valid command. Any pre-requisite states required by the command are checked (such as the communications system being in the correct mode to accept a command). SCL also verifies that there is sufficient power so that the command does not trigger a low bus voltage condition and that there is sufficient energy in the battery. Using SCL to check these constraints and including them in the CASPER model provides an additional level of safety to the autonomy flight software. 6. TECHNOLOGY VALIDATION & FLIGHT STATUS
ASE started as a technology experiment. The technology was declared fully validated in May 2004 after all 20 onboard autonomy experiments were fully tested. The overall system performed as expected and was considered a success. The validation consisted of the following onboard autonomy experiments run 5 times each:
• Image planning and acquisition • Downlink • Data editing • Image acquisition followed by image
retargeting Since the completion of the technology validation, over
4000 more autonomous data acquisitions have been completed. In addition, we have run over 400 closed-loop executions where ASE autonomously analyzes science data onboard and triggers subsequent observations. The software has been running full-time onboard the EO-1 satellite for the past several months. ASE is now the primary mission planning and control system.
There were 2 important risks to our technology
validation approach – one technical and one political. The technical risk was related to spacecraft safety. If the EO-1 satellite was lost due to the ASE software, that would have been a huge setback for onboard spacecraft autonomy. This risk was mitigated using 3 different methods. First, we had an extensive testing program to ensure that the software would operate as expected. Second, we had triple redundancy built into the 3-layered architecture of this autonomy software. Lastly, we ran the software on the solid-state recorder CPU (WARP) rather than the main spacecraft CPU.
5
The second risk was political. We needed to ensure that the technology validation of our software was convincing enough that scientists would use it on future missions. We had a multi-faceted approach to achieve this goal. First and foremost, we involved (and funded) several scientists in the development of the experiment, software, and operations of the ASE software. The idea is that if the scientists are involved from the start, they will help us develop a useful system and they will promote it to their peers. Another method we employed to ensure future use was to go way beyond the minimal set of validation experiments to show that this software is durable, maintainable, and can achieve increased science. We also started technology infusion early. This effort has so far paid off with infusion underway into the Mars Odyssey and Mars Exploration Rover missions.
7. EO-1 SENSORWEB
The use of automated planning onboard EO-1 has enabled a new system-of-systems capability. We have networked the EO-1 satellite with other satellites and ground sensors. This network is linked by software and the internet to an autonomous satellite observation response capability. This system is designed with a flexible, modular, architecture to facilitate expansion in sensors, customization of trigger conditions, and customization of responses.
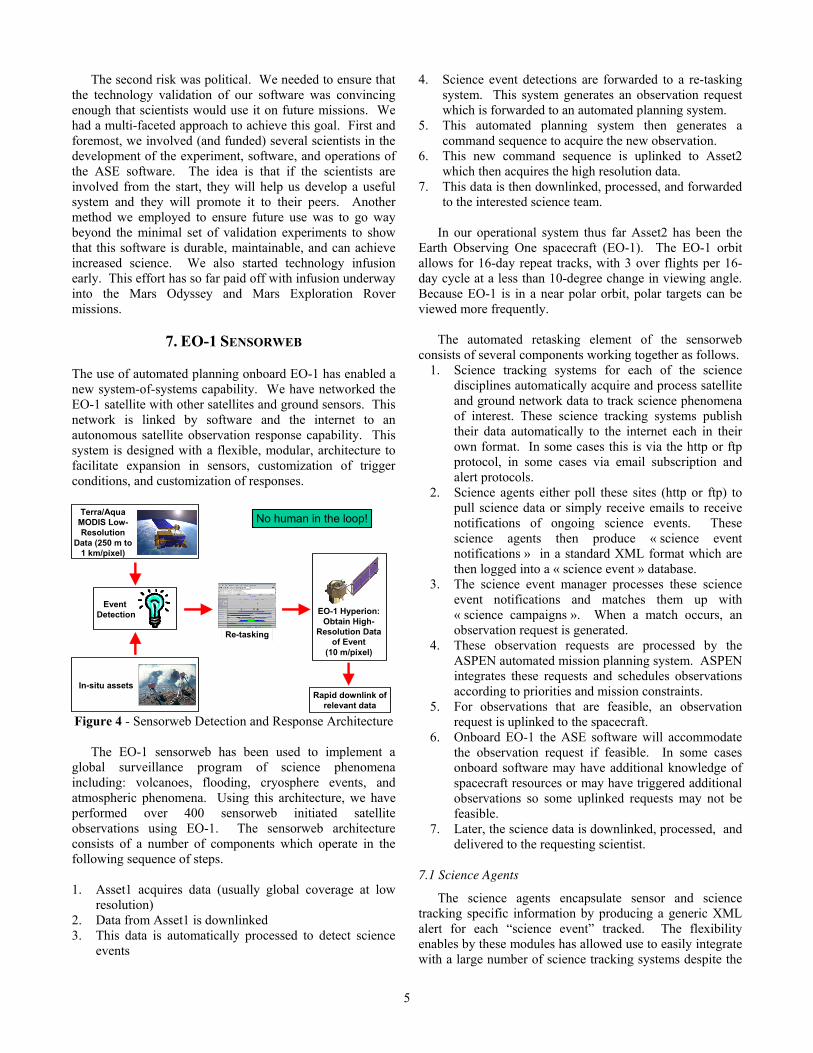
Figure 4 - Sensorweb Detection and Response Architecture
The EO-1 sensorweb has been used to implement a global surveillance program of science phenomena including: volcanoes, flooding, cryosphere events, and atmospheric phenomena. Using this architecture, we have performed over 400 sensorweb initiated satellite observations using EO-1. The sensorweb architecture consists of a number of components which operate in the following sequence of steps. 1. Asset1 acquires data (usually global coverage at low
resolution) 2. Data from Asset1 is downlinked 3. This data is automatically processed to detect science
events
4. Science event detections are forwarded to a re-tasking system. This system generates an observation request which is forwarded to an automated planning system.
5. This automated planning system then generates a command sequence to acquire the new observation.
6. This new command sequence is uplinked to Asset2 which then acquires the high resolution data.
7. This data is then downlinked, processed, and forwarded to the interested science team.
In our operational system thus far Asset2 has been the
Earth Observing One spacecraft (EO-1). The EO-1 orbit allows for 16-day repeat tracks, with 3 over flights per 16-day cycle at a less than 10-degree change in viewing angle. Because EO-1 is in a near polar orbit, polar targets can be viewed more frequently.
The automated retasking element of the sensorweb
consists of several components working together as follows. 1. Science tracking systems for each of the science
disciplines automatically acquire and process satellite and ground network data to track science phenomena of interest. These science tracking systems publish their data automatically to the internet each in their own format. In some cases this is via the http or ftp protocol, in some cases via email subscription and alert protocols.
2. Science agents either poll these sites (http or ftp) to pull science data or simply receive emails to receive notifications of ongoing science events. These science agents then produce « science event notifications » in a standard XML format which are then logged into a « science event » database.
3. The science event manager processes these science event notifications and matches them up with « science campaigns ». When a match occurs, an observation request is generated.
4. These observation requests are processed by the ASPEN automated mission planning system. ASPEN integrates these requests and schedules observations according to priorities and mission constraints.
5. For observations that are feasible, an observation request is uplinked to the spacecraft.
6. Onboard EO-1 the ASE software will accommodate the observation request if feasible. In some cases onboard software may have additional knowledge of spacecraft resources or may have triggered additional observations so some uplinked requests may not be feasible.
7. Later, the science data is downlinked, processed, and delivered to the requesting scientist.
7.1 Science Agents
The science agents encapsulate sensor and science tracking specific information by producing a generic XML alert for each “science event” tracked. The flexibility enables by these modules has allowed use to easily integrate with a large number of science tracking systems despite the
Event Detection
Re-tasking
EO-1 Hyperion: Obtain High-
Resolution Data of Event
(10 m/pixel)
Terra/Aqua MODIS Low-Resolution
Data (250 m to 1 km/pixel)
In-situ assets
No human in the loop!
Rapid downlink ofrelevant data

6
fact that each science tracking system has its own unique data and reporting format. These formats have ranged from near raw instrument data, to alerts in text format, to periodic updates to a wide range of text formats. The posting methods have included http, https, ftp, and email. Below we list the science tracking systems integrated into our system.
Figure 6 - Science Alert Systems
7.2 Science Event Manager and Science Campaigns
The Science Event Manager enables scientists to specify mappings from science events to observation requests. It enables them to track recency and count of events and do logical processing. It also enables them to track based on target names or locations, and other event specific parameters (for example, some tracking systems produce a confidence measure). As an example, a volcanologist might specify for the Kilauea site that several tracking systems would need to report activity with high confidence before an observation is requested. This is because Kilauea is quite often active. On the other hand, even a single low confidence activity notification might trigger observation of Piton de la Fournaise or other less active sites.
7.3 Automated Observation Planning
To automate mission planning we use the ASPEN/CASPER planning & scheduling system [3]3. ASPEN represents mission constraints in a declarative format and searches possible mission plans for a plan that satisfies many observation requests (respecting priorities) and also obeys mission operations constraints. ASPEN has been used in a wide range of space mission applications including spacecraft operations scheduling, rover planning, and ground communications station automation.
7.4 The Wildfire Sensorweb
We have demonstrated the sensorweb concept using the MODIS active fire mapping system. Both the Terra and Aqua spacecraft carry the MODIS instrument, providing morning, afternoon, and two night overflights of each location on the globe per day (cover near the poles is even more frequent). The active fire mapping system uses data from the GSFC Distributed Active Archive Center (DAAC), specifically the data with the predicted orbital ephemeris which is approximately 3-6 hours from acquisition.
Figure 7 shows the active fire map from October 2003
fires in Southern California. Figure 8 shows the context active fire map and a sensorweb trigger observation taken during this demonstration.
3 ASPEN is the ground, batch planner, CASPER is the embedded, flight planner. Both share the same core planning engine.
SEMProcess Alerts andPrioritize Response
Observations
AGENTSMonitor Sensors
Science Alerts
ASPENSchedule Observations
on EO-1
Observation Requests
Updates to Onboard Plan
ScienceCampaigns
EO-1 FlightDynamics
Tracks orbit, overflights, momentum management
SceneAcquired
Figure 5 - Sensorweb Response

7
Figure 7 - Active fire alerts for the recent October 2003 Southern California Fires. Red indicates active fires. The light blue box illustrates the background region used in the relative threshold detection.
Figure 8: Sensorweb trigger images for October 2003 Southern California Fires. Above is the MODIS Active Fire Map display. Below is the EO-1 Hyperion image acquired via sensorweb trigger of the Simi/Val Verde fire area used in Burned Area Emergency Reclamation (BAER).
7.5 The Flood Sensorweb
The flood sensorweb uses the Dartmouth Flood Observatory Global Active Flood Archive to identify floods in remote locations automatically based on satellite data. The DFO flood archive generates flood alerts based on both MODIS and QuikSCAT [16] satellite data. The flood sensorweb utilizes the DFO QuikSCAT atlas because it is not affected by cloud cover over flooded areas.
The DFO archive is produced by the DFO in
collaboration with JPL. In this process the QuikSCAT Scatterometer data is used to assess surface water conditions [1],[15]. Specifically the VV/HH ratio is used to assess surface water properties of the areas in 0.25 lat/lon degree bins. The 7 day running mean is used to dampen effects of short-duration rainfall over urban areas. These data are then compared to the seasonal (90 day) average of the previous year season to screen out seasonal wetlands. The screened alerts are then published to a DFO website. More recently MODIS and AMSR-E data has been incorporated into the triggering product.
In the flood sensorweb, active flooding alerts prime locations of known scientific interest trigger EO-1 observations at gauging reaches. Gauging reaches are river locations whose topography is well understood. Flood discharge measurements at gauging reaches can be used to measure the amount of water passing through a flooded region and can be compared with remotely sensed data. The end effect of the flood sensorweb is to increase the amount of high resolution remote sensing data available on flooding events in prime locations of interest (e.g., gauging reaches) and times of interest (e.g. when active flooding occurs). Imagery from an August 2003 flood sensorweb demonstration capturing flooding in the Brahmaputra River, India, is shown below.
Figure 9 - Dartmouth Flood Observatory Global Flood Alerts for October 2003.
7.6 The Volcano Sensorweb
In the volcano sensorweb, MODIS, GOES, and AVHRR sensor platforms are utilized to detect volcanic activity. These alerts are then used to trigger EO-1 observations. The EO-1 Hyperion instrument is ideal for study of volcanic processes because of its great sensitivity range in the infra-red spectrum.
The GOES [11] and AVHRR alert systems provide
excellent temporal resolution and rapid triggering based on thermal alerts. The GOES-based system looks for locations that are: hot, is high contrast from the surrounding area, and not visibly bright. Additionally, hits are screened for motion (to eliminate cloud reflections) and persistence (to remove instrument noise). The GOES alert can provide a web or email alert within 1 hour of data acquisition.
We have also linked into in-situ sensors to monitor
volcanoes. We are working with a number of teams to integrate such sensors into our sensorweb. The Hawaiian Volcano Observatory [HVO] has deployed numerous instruments on the Kilauea region in Hawaii. These instruments include tiltmeters, gas sensors, and seismic instrumentation. These sensors can provide indications that collectively point to a high-probability, near-term eruption thereby triggering a request for high-resolution, EO-1 imagery. The University of Hawaii has also deployed infra-red cameras [12] to a number of volcanic sites worldwide (e.g., Kilauea, Hawaii; Erte Ale, Ethiopia; Sourfiere Hills, Montserrat; Colima and Popocatepetl, Mexico). These infra-red cameras can provide a ground-based detection of

8
lava flows based on thermal signatures, thereby alerting the sensorweb.
Figure 10 - Examples of low-resolution MODIS imagery (left) and EO-1 imagery (right) from the Flood Sensorweb capturing Brahmaputra River flooding in India, August 2003.
7.7 Cryosphere Sensorweb
Many freeze/thaw applications are also of interest. This includes the phenomena of glacial ice breakup, sea ice breakup, melting, and freezing, lake ice freezing and thawing, and snowfall and snowmelt. Using QuikSCAT data we are tracking snow and ice formation and melting and automatically triggering higher resolution imaging such as with EO-1.
In collaboration with the Center for Limnology of the
University of Wisconsin at Madison, we have linked into data streams from the Trout Lake station to use temperature data to trigger imaging of the sites to capture transient freezing and thawing processes.
8. TECHNOLOGY INFUSION
The ASE software is currently under development for the Mars Exploration Rovers Mission to enable onboard detection and summarization of atmospheric events (dust devils and clouds). The ASE software is also under development for the Mars Odyssey Mission to enhance science return from the THEMIS instrument with planned operational capability in the 2nd extended mission (beginning in Fall 2006). In this application, the ASE software will:
• Track the seasonal variation in the CO2 ice caps • Detect thermal anomalies • Track dust storms • Tracki Martian clouds
In addition, we are researching applications for
magnetosphere events for space weather, change detection on Io and Europa, and storm tracking on Jupiter.
9. RELATED WORK & SUMMARY
In 1999, the Remote Agent experiment (RAX) [13] executed for a few days onboard the NASA Deep Space One mission. RAX is an example of a classic three-tiered architecture [8], as is ASE. RAX demonstrated a batch onboard planning capability (as opposed to CASPER’s continuous planning) and RAX did not demonstrate onboard science. More recent work from NASA Ames Research Center is focused on building the IDEA planning and execution architecture [12]. In IDEA, the planner and execution software are combined into a “reactive planner” and operate using the same domain model. A single planning and execution model can simplify validation, which is a difficult problem for autonomous systems. For EO-1, the CASPER planner and SCL executive use separate models. While this has the advantage of the flexibility of both procedural and declarative representations, a single model would be easier to validate. We have designed the CASPER modeling language to be used by domain experts, thus not requiring planning experts. Our use of SCL is similar to the “plan runner” in IDEA but SCL encodes more intelligence. The EO-1 science analysis software is defined as one of the “controlling systems” in IDEA. In the IDEA architecture, a communications wrapper is used to send messages between the agents, similar to the software bus in EO-1. In the description of IDEA there is no information about the deployment of IDEA to any domains, so a comparison of the performance or capabilities is not possible at this time.
ASE on EO-1 demonstrates an integrated autonomous mission using onboard science analysis, replanning, and robust execution. The ASE performs intelligent science data selection that leads to a reduction in data downlink. In addition, the ASE increases science return through autonomous retargeting. Demonstration of these capabilities onboard EO-1 will enable radically different missions with significant onboard decision-making leading to novel science opportunities. The paradigm shift toward highly autonomous spacecraft will enable future NASA missions to achieve significantly greater science returns with reduced risk and reduced operations cost. We have also described ongoing work to link together automated science event tracking system with an autonomous response capability based on automated planning technology. Demonstration of these sensorweb capabilities will enable fast responding science campaigns and increase the science return of spaceborne assets.

9
REFERENCES
[1] B. Brakenridge et al., Flood Warnings, Flood Disaster Assessments, and Flood Hazard Reduction: The Roles of Orbital Remote Sensing, Proc 30th Intl Symp on Remote Sensing of Environment, Honolulu, HI, Nov 2003.
[2] M.C. Burl, L. Asker, P. Smyth, U. Fayyad, P. Perona, J. Aubele, and L. Crumpler, “Learning to Recognize Volcanoes on Venus,” Machine Learning Journal, April 1998.
[3] S. Chien, B. Engelhardt, R. Knight, G. Rabideau, R. Sherwood, E. Hansen, A. Ortiviz, C. Wilklow, S. Wichman , "Onboard Autonomy on the Three Corner Sat Mission," Proc i-SAIRAS 2001, Montreal, Canada, June 2001.
[4] S. Chien, R. Sherwood, M. Burl, R. Knight, G. Rabideau, B. Engelhardt, A. Davies, P. Zetocha, R. Wainright, P. Klupar, P. Cappelaere, D. Surka, B. Williams, R. Greeley, V. Baker, J. Doan, "The TechSat 21 Autonomous Sciencecraft Constellation", Proc i-SAIRAS 2001, Montreal, Canada, June 2001.
[5] S. Chien, R. Knight, A. Stechert, R. Sherwood, and G. Rabideau, "Using Iterative Repair to Improve Responsiveness of Planning and Scheduling," Proceedings of the Fifth International Conference on Artificial Intelligence Planning and Scheduling, Breckenridge, CO, April 2000. (also casper.jpl.nasa.gov)
[6] A.G. Davies, R. Greeley, K. Williams, V. Baker, J. Dohm, M. Burl, E. Mjolsness, R. Castano, T. Stough, J. Roden, S. Chien, R. Sherwood, "ASC Science Report," August 2001. (downloadable from ase.jpl.nasa.gov)
[7] Davies, A. G., E.D. Mjolsness, A.G. Gray, T.F. Mann, R. Castano, T.A. Estlin and R.S. Saunders (1999) Hypothesis-driven active data analysis of geological phenomena using semi-autonomous rovers: exploring simulations of Martian hydrothermal deposits. EOS, Trans. Amer. Geophys. Union, 80, no. 17, S210.
[8] E. Gat et al., Three-Layer Architectures. in D. Kortenkamp et al. eds. AI and Mobile Robots. AAAI Press, 1998.
[9] Goddard Space Flight Center, EO-1 Mission page: http://EO-1.gsfc.nasa.gov
[10] M. Griffin, H. Burke, D. Mandl, & J. Miller, “Cloud Cover Detection Algorithm for the EO-1 Hyperion Imagery,” Proceedings of the 17th SPIE AeroSense 2003, Orlando, FL, April 21-25, 2003.
[11] Harris, A. et al., (2002) Web-Based Hot Spot Monitoring using GOES: What it is and How it Works, Advances in Environmental Monitoring and Modelling Vol. 1 No. 3 (2002) pp.5-36.
[12] Harris et al., Ground-based Infrared Monitoring Provides New Tool for Remote Tracking of Volcanic Activity, EOS,Vol. 84, No. 40, 7 October 2003
[13] Interface and Control Systems, SCL Home Page, sclrules.com
[14] M. C. Malin and K. S. Edgett, “Evidence for recent groundwater seepage and surface runoff on Mars,” Science, 288, 2330-2335, 2000.
[15] S. V. Nghiem, W. T. Liu, and X. Xie, "Polarization Reversal over Flooded Regions and Applications to Flood Mapping with Spaceborne Scatterometers," International Geoscience and Remote Sensing Symposium, Hamburg, Germany, June 28 - July 2, 1999.
[16] S. V. Nghiem, Advanced Scatterometry for Geophysical Remote Sensing, JPL Document D-23048, 40 pages, Jet Propulsion Laboratory, California Institute of Technology, Pasadena, California, March 2001.
[17] N. Muscettola, G. Dorais, C. Fry, R. Levinson, and C. Plaunt, “IDEA: Planning at the Core of Autonomous Reactive Agents,” Proceedings of the Workshops at the AIPS-2002 Conference, Tolouse, France, April 2002.
[18] NASA Ames, Remote Agent Experiment Home Page, http://ic.arc.nasa.gov/projects/remote-agent/.
[19] G. Rabideau, R. Knight, S. Chien, A. Fukunaga, A. Govindjee, "Iterative Repair Planning for Spacecraft Operations in the ASPEN System," International Symposium on Artificial Intelligence Robotics and Automation in Space, Noordwijk, The Netherlands, June 1999.
[20] B.C. Williams and P.P. Nayak, “A Reactive Planner for a Model-based Executive,” Proc. International Joint Conference on Artificial Intelligence, Nagoya, Japan, 1997.
[21] M. Griffin, Burke, H. Burke, D. Mandl, J. Miller, “Cloud Cover Detection Algorithm for EO-1 Hyperion Imagery,” 17th SPIE AeroSense 2003, Orlando FL, April 21-25, 2003.

10
BIOGRAPHY
Rob Sherwood is Manager, Earth Science Information Systems and the Autonomous Sciencecraft Experi-ment Manager at the Jet Propulsion Laboratory, California Institute of Technology. He holds a B.S. in Aerospace Engineering from University of Colorado at Boulder, a M.S. in Mechanical Engineering from the University of California at Los Angeles, and an M.B.A. at Loyola-Marymount University. Robert has received 7 NASA Achievement Awards for his work in Spacecraft Mission Operations and Mission Autonomy Applications. Dr. Rebecca Castaño, Supervisor, Machine Learning Systems group at JPL. She received her Ph.D. in Electrical Engineering from the University of Illinois with her dissertion in the area of computer vision. Dr. Castaño has been advancing the state of the art in onboard science analysis methods for the past five years and has been lead author on numerous publications in this field. She is currently the technology lead for science data processing for the ASE. Dr. Castaño is also the Team Lead of the Onboard Autonomous Science Investigation System (OASIS). Her research interests include machine learning, computer vision and pattern recognition. Steve Chien is Technical Group Supervisor of the Artificial Intelligence Group of the Jet Propulsion Laboratory, California Institute of Technology where he leads efforts in research and development of automated planning and scheduling systems. He is also an adjunct assistant professor in the Department of Computer Science at the University of Southern California. He holds a B.S., M.S., and Ph.D. in Computer Science from the University of Illinois. His research interests are in the areas of: planning and scheduling, operations research, and machine learning.
Benjamin Cichy is a Member of the Technical Staff in the Flight Software Development and Technology Group at the Jet Propulsion Laboratory, California Institute of Technology. He holds a B.S. and an M.Eng. in Computer Science from Cornell University where he focused on Artificial Intelligence. Ben develops, integrates, and tests autonomy software for NASA's New Millennium Program. Ashley Davies is a Research Scientist in the Earth and Space Sciences Division of the Jet Propulsion Laboratory, California Institute of Technology. His main research focus is the remote sensing of volcanism, especially on the Jovian satellite Io. He is the Lead Scientist of the Autonomous Sciencecraft Experiment. Ashley was a member of the Galileo Near-Infrared Mapping Spectrometer team from 1996-2003. He has a B.Sc in Geology and Astronomy, and a Ph.D from Lancaster University in the UK, where he specialized in extraterrestrial volcanism. Gregg Rabideau is a Member of the Technical Staff in the Artificial Intelligence Group at the Jet Propulsion Laboratory, California Institute of Technology. His main focus is in research and development of planning and scheduling systems for automated spacecraft commanding. Projects include planning and scheduling for the first deep-space mission of NASA’s New Millennium Program, and for design trades analysis for the Pluto Express project. Gregg holds both a B.S. and M.S. degree in Computer Science from the University of Illinois where he specialized in Artificial Intelligence.
ACKNOWLEDGEMENT
Portions of this work were performed at the Jet Propulsion Laboratory, California Institute of Technology, under a contract with the National Aeronautics and Space Administration. We would like to acknowledge the important contributions of Nghia Tang and Michael Burl of JPL, Dan Mandl, Stuart Frye, Seth Shulman, and Stephen Ungar of GSFC, Jerry Hengemihle and Bruce Trout of Microtel LLC, Jeff D’Agostino of the Hammers Corp., Robert Bote of Honeywell Corp., Jim Van Gaasbeck and Darrell Boyer of ICS, Michael Griffin and Hsiao-hua Burke of MIT Lincoln Labs, Ronald Greeley and Thomas Doggett of Arizona State University, and Victor Baker and James Dohm of the University of Arizona.