Automotive Industry Market Update - Western...
8
Automotive Industry Market Update www.wesrespartners.com Q1 2016 Inside this issue: Western Reserve Partners provides M&A, capital raising and other financial advisory services to middle market companies across a focused set of industry verticals. We deliver thoughtful advice, keen market insight and superior execution to our clients, both nationally and internationally, and our managing directors average nearly 30 years of experience and have directly executed more than 600 transactions throughout their careers. Western Reserve Partners is a member of M&A International, the world’s largest alliance of investment banking firms, as well as World Services Group, a global consortium of middle market focused law firms and other advisors, which provides unparalleled access to global companies and investors. The firm is a FINRA-member broker / dealer and member of SIPC. Valuation Metrics 2 Valuation Trends 4 Performance Trends 5 M&A Activity 6 Industry Metrics 7 Western Reserve Automotive Practice 8 Automotive Market Snapshot Mergers & Acquisitions ● Capital Raising ● Financial Opinions & Valuations ● Restructuring & Bankruptcy (35%) (25%) (15%) (5%) 5% 15% 25% Mar-15 Jun-15 Sep-15 Dec-15 Mar-16 Automotive Manufacturers Aftermarket Suppliers Domestic OEM Suppliers Retailers and Distributors International OEM Suppliers Dealers and Service Providers Metrics 1 2 3 Q1 % YoY Q1 % YoY Miles Driven (in Billions ) 4 735 3.6% OEM N.A. Production (in 000s ) 4,460 4.7% Avg. Retail Gasoline Price $2.00 (15.0%) M&A 5 Q1 LTM Q1 LTM Count 86 390 Value (in $Billions ) $8.6 $29,641 Public Market Performance 5 6 Q1 LTM Q1 LTM Automotive Manufacturers (7.3%) (23.0%) Aftermarket Suppliers 1.9% (0.7%) Domestic OEM Suppliers (4.2%) (17.9%) Retailers and Distributors 10.3% 17.2% International OEM Suppliers 0.4% (1.5%) Dealers and Service Providers (5.2%) (17.6%)
Transcript of Automotive Industry Market Update - Western...

Metrics 1 2 3
Q3 % YoY YTD % YoYYTD Miles Driven (in Billions ) 4 2,098 3.4% OEM N.A. Production (in 000s ) 14,749 2.8%Avg. Retail Gasoline Price $2.69 (24.9%)
M&A 5
Q3 LTM Q3 LTMCount 108 408 Value (in $Billions ) $2.2 $27,989
Public Market Performance 5 6
Q3 LTM Q3 LTMAutomotive Manufacturers (8.0%) 2.0% Aftermarket Suppliers 3.7% 21.1%Domestic OEM Suppliers (6.2%) 9.5% Retailers and Distributors 9.8% 30.1%International OEM Suppliers 0.2% 23.4% Dealers and Service Providers (3.7%) 16.0%
First Quarter | 2013
Automotive Industry Market Update
www.wesrespartners.com
Q1 2016
Inside this issue:
Western Reserve Partners providesM&A, capital raising and otherfinancial advisory services to middlemarket companies across a focused setof industry verticals. We deliverthoughtful advice, keen market insightand superior execution to our clients,both nationally and internationally,and our managing directors averagenearly 30 years of experience and havedirectly executed more than 600transactions throughout their careers.
Western Reserve Partners is amember of M&A International, theworld’s largest alliance of investmentbanking firms, as well as WorldServices Group, a global consortium ofmiddle market focused law firms andother advisors, which providesunparalleled access to globalcompanies and investors. The firm is aFINRA-member broker / dealer andmember of SIPC.
Valuation Metrics 2
Valuation Trends 4
Performance Trends 5
M&A Activity 6
Industry Metrics 7
Western ReserveAutomotive Practice
8 Automotive Market Snapshot
Mergers & Acquisitions ● Capital Raising ● Financial Opinions & Valuations ● Restructuring & Bankruptcy
(35%)
(25%)
(15%)
(5%)
5%
15%
25%
Mar-15 Jun-15 Sep-15 Dec-15 Mar-16
Automotive Manufacturers Aftermarket Suppliers
Domestic OEM Suppliers Retailers and Distributors
International OEM Suppliers Dealers and Service Providers
Metrics 1 2 3
Q1 % YoY Q1 % YoYMiles Driven (in Billions ) 4 735 3.6% OEM N.A. Production (in 000s ) 4,460 4.7%Avg. Retail Gasoline Price $2.00 (15.0%)
M&A 5
Q1 LTM Q1 LTMCount 86 390 Value (in $Billions ) $8.6 $29,641
Public Market Performance 5 6
Q1 LTM Q1 LTMAutomotive Manufacturers (7.3%) (23.0%) Aftermarket Suppliers 1.9% (0.7%)Domestic OEM Suppliers (4.2%) (17.9%) Retailers and Distributors 10.3% 17.2%International OEM Suppliers 0.4% (1.5%) Dealers and Service Providers (5.2%) (17.6%)

2 Automotive Industry Market Update | Q1 2016
Mergers & Acquisitions ● Capital Raising ● Financial Opinions & Valuations ● Restructuring & Bankruptcy
Public Company Valuation Metrics 5
Price % of 52 Net Debt /Company 03/31/16 Wk Hi Mkt Cap EV Revenue EBIT EBITDA Gross EBITDA EBITDA LTM NTM LTM NTM
Automotive ManufacturersToyota Motor Corporation $52.97 68.4% $160,909 $296,461 $237,523 $24,471 $37,956 20.2% 16.0% 3.2x 10.2x 12.3x 6.8x 9.3x
Daimler AG $76.73 72.7% $82,085 $180,984 $171,150 $13,833 $25,278 20.0% 14.8% 3.8x 12.2x 11.2x 6.9x 8.2x
Ford Motor Co. $13.50 83.8% $53,758 $163,154 $153,376 $9,639 $17,605 13.2% 11.5% 6.6x 16.6x 22.0x 9.2x 13.5x
Volkswagen AG $127.38 43.9% $68,949 $162,775 $231,650 $8,035 $18,011 15.3% 7.8% 5.3x 13.0x 12.0x 6.6x 5.7x
Bayerische Motoren Werke Aktiengesellschaft $92.36 68.8% $59,989 $146,510 $104,904 $10,499 $14,516 18.4% 13.8% 6.1x 13.1x 13.1x 9.7x 8.8x
Nissan Motor Co. Ltd. $9.27 77.1% $41,144 $103,808 $101,745 $6,373 $13,317 0.0% 0.0% 4.1x 13.5x 15.2x 6.9x 8.6x
Honda Motor Co., Ltd. $27.47 68.6% $49,500 $98,286 $124,612 $5,808 $8,069 20.7% 6.5% 5.4x 13.4x 15.0x 10.1x 8.4x
General Motors Company $31.43 83.9% $48,653 $91,915 $153,909 $8,016 $15,493 12.6% 10.1% 3.4x 10.1x 8.8x 5.8x 5.8x
Hyundai Motor Company $134.16 84.3% $24,067 $64,327 $78,146 $5,403 $7,111 19.9% 9.1% 4.8x 8.8x 11.1x 7.1x 7.5x
Tesla Motors, Inc. $229.77 80.2% $30,343 $32,063 $4,253 ($862) ($411) 21.5% (9.7%) NM NM 154.5x NM 37.8x
Fiat Chrysler Automobiles N.V. $8.09 44.8% $10,423 $17,814 $126,569 $4,530 $8,919 12.8% 7.0% 1.0x 4.5x 2.9x 2.1x NM
Kia Motors Corp. $42.49 81.3% $16,958 $15,118 $42,083 $2,001 $2,827 19.8% 6.7% NM 4.6x 6.8x 3.6x 4.1x
Peugeot S.A. $17.15 76.4% $13,670 $13,985 $59,382 $2,958 $4,882 18.4% 8.2% NM 3.9x 4.3x 2.5x 2.4x
AUDI AG $714.42 73.1% $30,720 $11,246 $63,448 $6,613 $8,705 19.5% 13.7% NM NM NM NM NM
Mazda Motor Corporation $15.54 63.5% $9,292 $10,303 $30,319 $2,018 $2,721 24.6% 9.0% 0.1x 4.7x NM 3.6x 3.8x
Mean $46,698 $93,917 $112,205 $7,289 $12,333 17.1% 8.3% 4.0x 9.9x 22.2x 6.2x 9.5x
Median $41,144 $91,915 $104,904 $6,373 $8,919 19.5% 9.0% 4.1x 10.2x 12.0x 6.8x 8.2x
Domestic OEM Suppliers
Johnson Controls Inc. $38.97 71.5% $25,262 $33,149 $36,317 $2,389 $3,265 18.2% 9.0% 2.0x 12.8x 10.8x 9.6x 8.4x
Delphi Automotive PLC $75.02 82.8% $20,718 $24,674 $15,419 $1,975 $2,535 20.2% 16.4% 1.5x 12.5x 10.9x 9.9x 8.6x
Magna International Inc. $43.05 74.9% $17,318 $17,179 $33,262 $2,388 $3,362 14.3% 10.1% 0.8x 6.3x 6.6x 4.7x 4.8x
BorgWarner Inc. $38.40 61.2% $8,379 $10,445 $8,308 $1,058 $1,395 20.9% 16.8% 1.6x 9.7x 9.4x 7.4x 7.0x
Lear Corp. $111.17 87.5% $8,157 $9,005 $18,211 $1,260 $1,608 10.4% 8.8% 0.5x 6.9x 6.5x 5.4x 5.1x
Gentex Corp. $15.69 84.6% $4,533 $4,213 $1,580 $472 $554 39.2% 35.1% NM 9.2x 8.4x 7.8x 7.0x
Tenneco Inc. $51.51 83.4% $2,963 $3,971 $8,322 $598 $785 17.3% 9.4% 1.3x 6.8x 6.4x 5.1x 4.8x
Linamar Corp. $48.19 69.9% $3,141 $3,302 $4,166 $465 $684 16.5% 16.4% 1.6x 7.3x 5.9x 5.0x 4.0x
Metaldyne Performance Group Inc. $16.81 68.3% $1,145 $2,864 $3,047 $270 $500 17.1% 16.4% 3.4x 10.6x 10.7x 5.7x 5.5x
Dana Holding Corporation $14.09 62.0% $2,097 $2,822 $5,901 $420 $592 13.9% 10.0% 1.3x 6.9x 6.3x 4.8x 4.4x
American Axle & Manufacturing Holdings Inc. $15.39 58.7% $1,177 $2,274 $3,903 $372 $567 16.8% 14.5% 2.0x 6.3x 6.2x 4.1x 3.9x
Cooper-Standard Holdings Inc. $71.84 89.1% $1,235 $1,651 $3,405 $265 $383 18.1% 11.3% 1.2x 6.6x 6.6x 4.5x 4.2x
Gentherm Incorporated $41.59 71.8% $1,511 $1,464 $865 $124 $156 32.2% 18.1% NM 12.0x 11.1x 9.6x 8.8x
Martinrea International Inc. $7.91 71.1% $683 $1,214 $3,076 $144 $246 13.5% 8.0% 2.3x 8.8x 7.5x 5.2x 4.6x
Tower International, Inc. $27.20 86.6% $576 $893 $1,971 $86 $165 11.2% 8.4% 2.1x 10.2x 7.8x 5.3x 4.3x
Visteon Corporation $79.59 65.4% $3,093 $844 $3,231 $196 $269 13.6% 8.3% NM 4.4x 3.6x 3.2x 2.6x
Superior Industries International, Inc. $22.08 94.3% $557 $504 $740 $62 $95 12.7% 12.8% NM 10.4x 10.8x 6.2x 6.1x
Stoneridge Inc. $14.56 92.5% $405 $482 $645 $33 $55 27.7% 8.5% 1.3x 16.6x 11.0x 9.4x 6.9x
Shiloh Industries Inc. $5.13 35.6% $89 $366 $1,114 $18 $52 7.6% 4.7% 5.3x 20.2x NM 7.1x NM
STRATTEC Security Corporation $57.39 63.8% $209 $214 $391 $20 $30 15.3% 7.5% NM 10.4x 6.5x 7.1x 5.2x
Mean $5,162 $6,077 $7,694 $631 $865 17.8% 12.5% 1.9x 9.8x 8.1x 6.4x 5.6x
Median $1,804 $2,548 $3,318 $321 $527 16.6% 10.1% 1.6x 9.4x 7.5x 5.6x 5.1x
International OEM Suppliers
Continental Aktiengesellschaft $227.55 86.3% $45,512 $50,126 $45,002 $4,828 $6,848 26.2% 15.2% 0.5x 10.4x 9.4x 7.4x 6.7x
Valeo SA $155.80 87.3% $12,223 $12,477 $15,796 $1,133 $1,689 17.7% 10.7% 0.0x 10.0x 9.2x 6.8x 5.5x
Autoliv, Inc. $118.48 89.6% $10,449 $10,667 $9,426 $913 $1,244 20.4% 13.2% 0.3x 13.1x 11.7x 9.4x 8.4x
GKN plc $4.16 76.9% $7,130 $8,270 $10,664 $736 $1,175 56.1% 11.0% 1.0x 10.3x 8.1x 6.7x 6.1x
Faurecia S.A. $37.92 71.9% $5,201 $6,528 $20,386 $896 $1,302 9.3% 6.4% 0.8x 6.8x 6.3x 4.7x 3.7x
Compagnie Plastic Omnium SA $34.42 96.6% $5,059 $5,485 $5,441 $439 $606 16.7% 11.1% 0.6x 11.0x 9.4x 8.1x 6.6x
Brembo SpA $51.76 98.8% $3,366 $3,557 $2,269 $265 $368 45.3% 16.2% 0.5x 12.3x 12.2x 9.0x 8.4x
Cie Automotive, S.A. $10.00 55.1% $2,329 $3,493 $2,858 $285 $417 42.3% 14.6% 1.9x 11.6x 10.9x 8.0x 7.4x
ElringKlinger AG $10.00 30.0% $1,753 $2,345 $1,732 $141 $233 24.7% 13.5% 2.4x 16.0x 12.3x 9.9x 7.9x
Autoneum Holding AG $257.70 95.7% $1,194 $1,405 $2,083 $141 $206 52.2% 9.9% 0.5x 9.4x 7.7x 6.5x 5.5x
Tupy S.A. $4.65 76.2% $670 $966 $865 $81 $149 19.0% 17.2% 1.8x 10.7x 7.5x 5.8x 4.9x
Grammer AG $39.84 91.0% $447 $637 $1,707 $44 $89 11.1% 5.2% 0.4x 13.9x 9.5x 7.1x 5.5x
Mean $7,944 $8,830 $9,852 $825 $1,194 28.4% 12.0% 0.9x 11.3x 9.5x 7.4x 6.4x
Median $4,213 $4,521 $4,150 $362 $512 22.6% 12.2% 0.6x 10.8x 9.4x 7.2x 6.3x
LTM Margin EV/EBIT EV/EBITDA

3 Automotive Industry Market Update | Q1 2016
Public Company Valuation Metrics 5
Mergers & Acquisitions ● Capital Raising ● Financial Opinions & Valuations ● Restructuring & Bankruptcy
Price % of 52 Net Debt /Company 03/31/16 Wk Hi Mkt Cap EV Revenue EBIT EBITDA Gross EBITDA EBITDA LTM NTM LTM NTM
Aftermarket Suppliers
The Goodyear Tire & Rubber Company $32.98 93.4% $8,813 $13,315 $16,110 $1,662 $2,363 26.8% 14.7% 2.1x 8.1x 6.8x 5.7x 5.1x
Snap-on Incorporated $156.99 90.0% $9,125 $9,948 $3,593 $764 $833 50.6% 23.2% 1.0x 13.0x 11.8x 11.9x 10.7x
Allison Transmission Holdings, Inc. $26.98 82.9% $4,617 $6,771 $1,944 $477 $661 46.8% 34.0% 3.2x 13.3x 15.8x 9.7x 11.1x
Federal-Mogul Holdings Corporation $9.88 70.6% $1,670 $4,670 $7,481 $272 $617 14.9% 8.2% 4.6x 16.1x 12.4x 7.4x 6.8x
Cooper Tire & Rubber Co. $37.02 84.3% $2,056 $1,898 $2,959 $454 $578 24.2% 19.5% NM 4.4x 5.3x 3.4x 3.9x
Dorman Products, Inc. $54.42 98.9% $1,895 $1,816 $823 $151 $169 38.4% 20.5% NM 12.4x 11.4x 11.2x 10.4x
Meritor, Inc. $8.06 55.1% $736 $1,689 $3,392 $213 $277 13.5% 8.2% 3.3x 6.8x 7.2x 5.4x 5.2x
Standard Motor Products Inc. $34.65 75.8% $784 $813 $983 $99 $116 29.5% 11.8% 0.3x 8.7x 8.7x 7.4x 7.4x
Motorcar Parts of America, Inc. $37.98 92.6% $696 $712 $355 $31 $34 27.5% 9.6% 0.5x 22.8x 8.4x 20.8x 8.1x
Fox Factory Holding Corp $15.81 80.6% $585 $627 $367 $43 $56 30.8% 15.3% 0.7x 14.6x 12.0x 11.2x 9.0x
Modine Manufacturing Company $11.01 80.5% $528 $604 $1,372 $52 $102 16.9% 7.4% 0.7x 11.5x 8.7x 5.9x NM
Horizon Global Corporation $12.58 79.2% $228 $393 $579 $35 $52 26.1% 9.0% 3.7x 12.7x 10.3x 8.2x 7.1x
Mean $2,645 $3,605 $3,330 $355 $488 28.8% 15.1% 2.0x 12.0x 9.9x 9.0x 7.7x
Median $1,227 $1,753 $1,658 $182 $223 27.1% 13.2% 1.5x 12.5x 9.5x 7.8x 7.4x
Aftermarket Retailers and Distributors
AutoZone, Inc. $796.69 98.4% $23,788 $28,423 $10,427 $2,004 $2,288 52.5% 21.9% 2.0x 14.2x 13.3x 12.4x 11.7x
O'Reilly Automotive Inc. $273.66 98.5% $26,553 $27,827 $8,161 $1,601 $1,809 52.4% 22.2% 0.6x 18.2x 16.4x 16.0x 14.5x
Genuine Parts Company $99.36 99.8% $14,856 $15,320 $15,262 $1,119 $1,260 29.8% 8.3% 0.4x 13.6x 13.1x 12.1x 11.5x
Advance Auto Parts Inc. $160.34 79.7% $11,756 $12,898 $9,737 $964 $1,233 45.4% 12.7% 0.9x 13.4x 11.6x 10.5x 9.5x
LKQ Corp. $31.93 99.0% $9,779 $11,270 $7,340 $732 $863 39.4% 11.8% 3.0x 15.7x 13.5x 13.3x 11.7x
Uni-Select Inc. $43.14 78.1% $928 $915 $1,208 $86 $95 29.7% 7.9% 0.8x 10.8x 11.3x 9.6x 9.5x
U.S. Auto Parts Network, Inc. $2.56 78.0% $87 $106 $291 ($2) $6 28.7% 2.0% 2.8x NM 159.4x 17.9x 8.2x
Mean $12,535 $13,823 $7,489 $929 $1,079 39.7% 12.4% 1.5x 14.3x 34.1x 13.1x 10.9x
Median $11,756 $12,898 $8,161 $964 $1,233 39.4% 11.8% 0.9x 13.9x 13.3x 12.4x 11.5x
Dealers and Service Providers
CarMax Inc. $51.10 67.8% $10,002 $20,573 $15,150 $1,059 $1,196 15.9% 7.9% 8.9x 19.6x 18.9x 17.5x 16.6x
AutoNation, Inc. $46.68 69.2% $4,813 $10,832 $21,037 $865 $999 15.6% 4.7% 6.7x 12.4x 11.8x 10.9x 10.1x
KAR Auction Services, Inc. $38.14 95.7% $5,227 $8,146 $2,752 $453 $672 43.2% 24.4% 4.4x 18.9x 16.5x 12.7x 11.2x
Penske Automotive Group, Inc. $37.90 69.7% $3,269 $7,916 $19,627 $575 $655 14.8% 3.3% 7.3x 13.1x 13.3x 11.6x 11.8x
Copart, Inc. $40.77 97.5% $4,566 $5,083 $1,168 $360 $402 44.3% 34.4% 1.3x 14.1x 13.0x 12.7x 11.7x
Lithia Motors Inc. $87.33 69.0% $2,493 $4,407 $8,058 $346 $389 15.0% 4.8% 5.0x 13.2x 12.1x 11.7x 10.9x
Group 1 Automotive Inc. $58.69 60.3% $1,322 $4,117 $10,808 $372 $420 14.4% 3.9% 6.8x 11.2x 11.3x 9.9x 10.1x
Asbury Automotive Group, Inc. $59.84 62.0% $1,494 $3,237 $6,597 $300 $330 16.1% 5.0% 5.4x 10.7x 10.9x 9.7x 9.9x
Sonic Automotive Inc. $18.48 71.7% $851 $3,191 $9,623 $233 $305 14.8% 3.2% 7.5x 13.3x 13.6x 10.3x 10.5x
Monro Muffler Brake Inc. $71.47 92.8% $2,301 $2,597 $934 $119 $158 40.4% 16.9% 1.9x 21.9x 18.7x 16.5x 14.2x
Boyd Group Income Fund $58.88 97.5% $1,075 $1,138 $846 $54 $73 45.7% 8.6% 0.8x 19.7x 17.5x 14.6x 12.2x
AutoCanada Inc. $14.05 38.5% $385 $1,034 $2,265 $77 $93 16.8% 4.1% 7.0x 13.7x 13.7x 11.5x 12.3x
America's Car-Mart Inc. $25.00 44.2% $204 $327 $551 $28 $32 22.2% 5.8% 3.8x 11.7x 9.8x 10.2x 8.3x
Mean $2,923 $5,584 $7,647 $372 $440 24.6% 9.8% 5.1x 14.9x 13.9x 12.3x 11.5x
Median $2,301 $4,117 $6,597 $346 $389 16.1% 5.0% 5.4x 13.3x 13.3x 11.6x 11.2x
LTM Margin EV/EBIT EV/EBITDA
4 Automotive Industry Market Update | Q1 2016
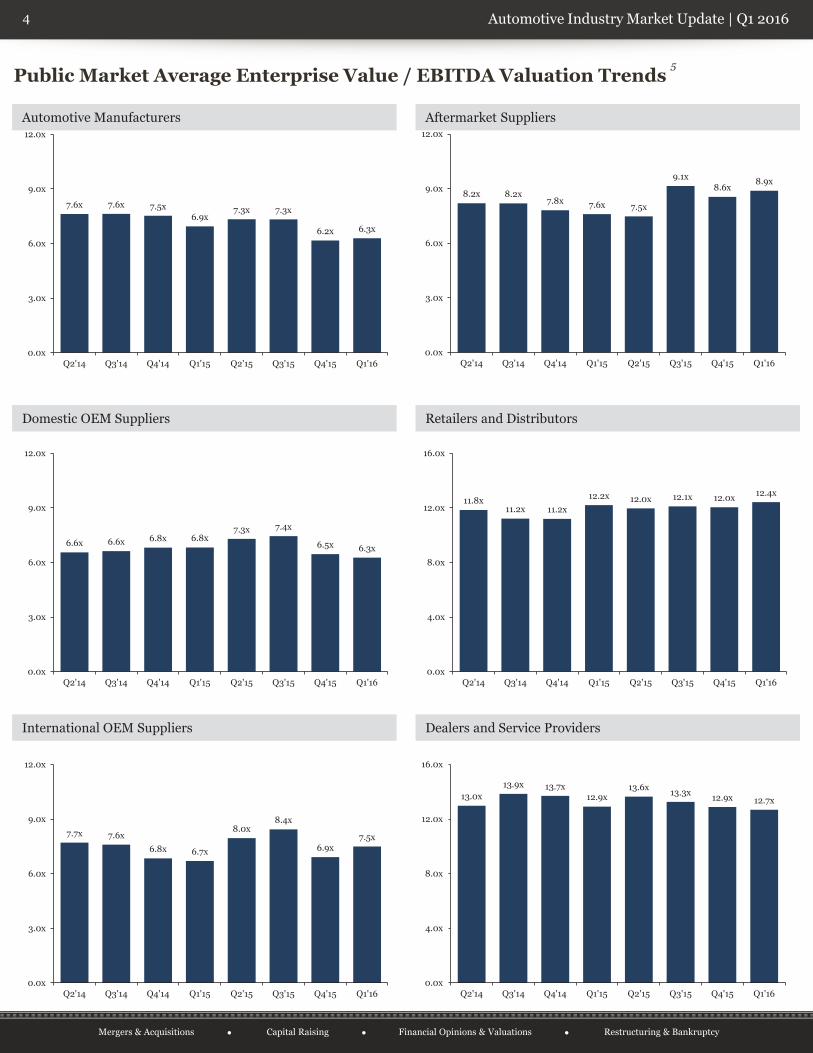
Public Market Average Enterprise Value / EBITDA Valuation Trends 5
Automotive Manufacturers Aftermarket Suppliers
Retailers and Distributors
Dealers and Service Providers
Domestic OEM Suppliers
International OEM Suppliers
Mergers & Acquisitions ● Capital Raising ● Financial Opinions & Valuations ● Restructuring & Bankruptcy
7.6x 7.6x 7.5x6.9x
7.3x 7.3x
6.2x 6.3x
0.0x
3.0x
6.0x
9.0x
12.0x
Q2'14 Q3'14 Q4'14 Q1'15 Q2'15 Q3'15 Q4'15 Q1'16
7.7x 7.6x6.8x 6.7x
8.0x8.4x
6.9x7.5x
0.0x
3.0x
6.0x
9.0x
12.0x
Q2'14 Q3'14 Q4'14 Q1'15 Q2'15 Q3'15 Q4'15 Q1'16
6.6x 6.6x 6.8x 6.8x7.3x 7.4x
6.5x 6.3x
0.0x
3.0x
6.0x
9.0x
12.0x
Q2'14 Q3'14 Q4'14 Q1'15 Q2'15 Q3'15 Q4'15 Q1'16
8.2x 8.2x7.8x 7.6x 7.5x
9.1x8.6x
8.9x
0.0x
3.0x
6.0x
9.0x
12.0x
Q2'14 Q3'14 Q4'14 Q1'15 Q2'15 Q3'15 Q4'15 Q1'16
11.8x11.2x 11.2x
12.2x 12.0x 12.1x 12.0x 12.4x
0.0x
4.0x
8.0x
12.0x
16.0x
Q2'14 Q3'14 Q4'14 Q1'15 Q2'15 Q3'15 Q4'15 Q1'16
13.0x13.9x 13.7x
12.9x13.6x 13.3x 12.9x 12.7x
0.0x
4.0x
8.0x
12.0x
16.0x
Q2'14 Q3'14 Q4'14 Q1'15 Q2'15 Q3'15 Q4'15 Q1'16
5 Automotive Industry Market Update | Q1 2016
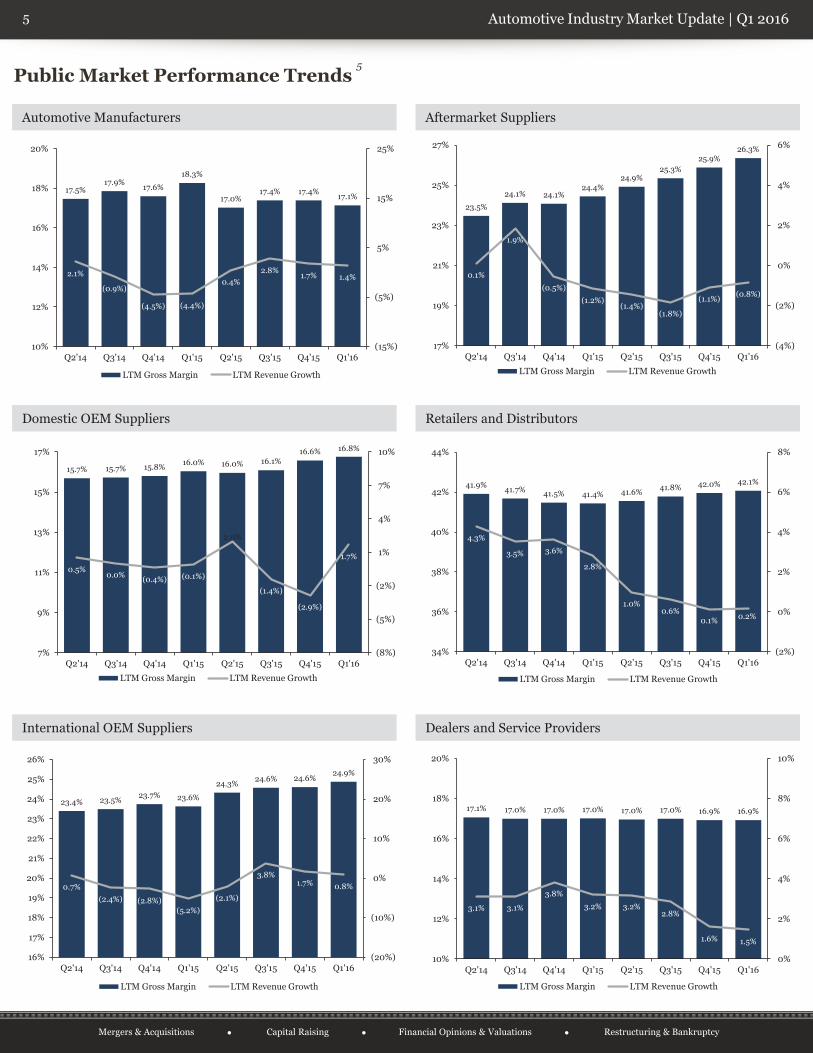
Public Market Performance Trends 5
Automotive Manufacturers Aftermarket Suppliers
Retailers and Distributors
Dealers and Service Providers
Domestic OEM Suppliers
International OEM Suppliers
Mergers & Acquisitions ● Capital Raising ● Financial Opinions & Valuations ● Restructuring & Bankruptcy
17.5%17.9%
17.6%
18.3%
17.0%17.4% 17.4% 17.1%
2.1%
(0.9%)
(4.5%) (4.4%)
0.4% 2.8%
1.7% 1.4%
(15%)
(5%)
5%
15%
25%
10%
12%
14%
16%
18%
20%
Q2'14 Q3'14 Q4'14 Q1'15 Q2'15 Q3'15 Q4'15 Q1'16
LTM Gross Margin LTM Revenue Growth
15.7% 15.7% 15.8% 16.0% 16.0% 16.1%16.6% 16.8%
0.5% 0.0% (0.4%) (0.1%)
2.0%
(1.4%)
(2.9%)
1.7%
(8%)
(5%)
(2%)
1%
4%
7%
10%
7%
9%
11%
13%
15%
17%
Q2'14 Q3'14 Q4'14 Q1'15 Q2'15 Q3'15 Q4'15 Q1'16
LTM Gross Margin LTM Revenue Growth
23.4% 23.5% 23.7% 23.6%
24.3% 24.6% 24.6%24.9%
0.7% (2.4%) (2.8%)
(5.2%)(2.1%)
3.8% 1.7% 0.8%
(20%)
(10%)
0%
10%
20%
30%
16%
17%
18%
19%
20%
21%
22%
23%
24%
25%
26%
Q2'14 Q3'14 Q4'14 Q1'15 Q2'15 Q3'15 Q4'15 Q1'16
LTM Gross Margin LTM Revenue Growth
23.5%
24.1% 24.1%24.4%
24.9%25.3%
25.9%26.3%
0.1%
1.9%
(0.5%)(1.2%)
(1.4%)(1.8%)
(1.1%) (0.8%)
(4%)
(2%)
0%
2%
4%
6%
17%
19%
21%
23%
25%
27%
Q2'14 Q3'14 Q4'14 Q1'15 Q2'15 Q3'15 Q4'15 Q1'16
LTM Gross Margin LTM Revenue Growth
41.9% 41.7% 41.5% 41.4% 41.6% 41.8% 42.0% 42.1%
4.3%
3.5% 3.6%
2.8%
1.0% 0.6%
0.1% 0.2%
(2%)
0%
2%
4%
6%
8%
34%
36%
38%
40%
42%
44%
Q2'14 Q3'14 Q4'14 Q1'15 Q2'15 Q3'15 Q4'15 Q1'16
LTM Gross Margin LTM Revenue Growth
17.1% 17.0% 17.0% 17.0% 17.0% 17.0% 16.9% 16.9%
3.1% 3.1%
3.8%
3.2% 3.2%2.8%
1.6% 1.5%
0%
2%
4%
6%
8%
10%
10%
12%
14%
16%
18%
20%
Q2'14 Q3'14 Q4'14 Q1'15 Q2'15 Q3'15 Q4'15 Q1'16
LTM Gross Margin LTM Revenue Growth
6 Automotive Industry Market Update | Q1 2016
Mergers & Acquisitions ● Capital Raising ● Financial Opinions & Valuations ● Restructuring & Bankruptcy
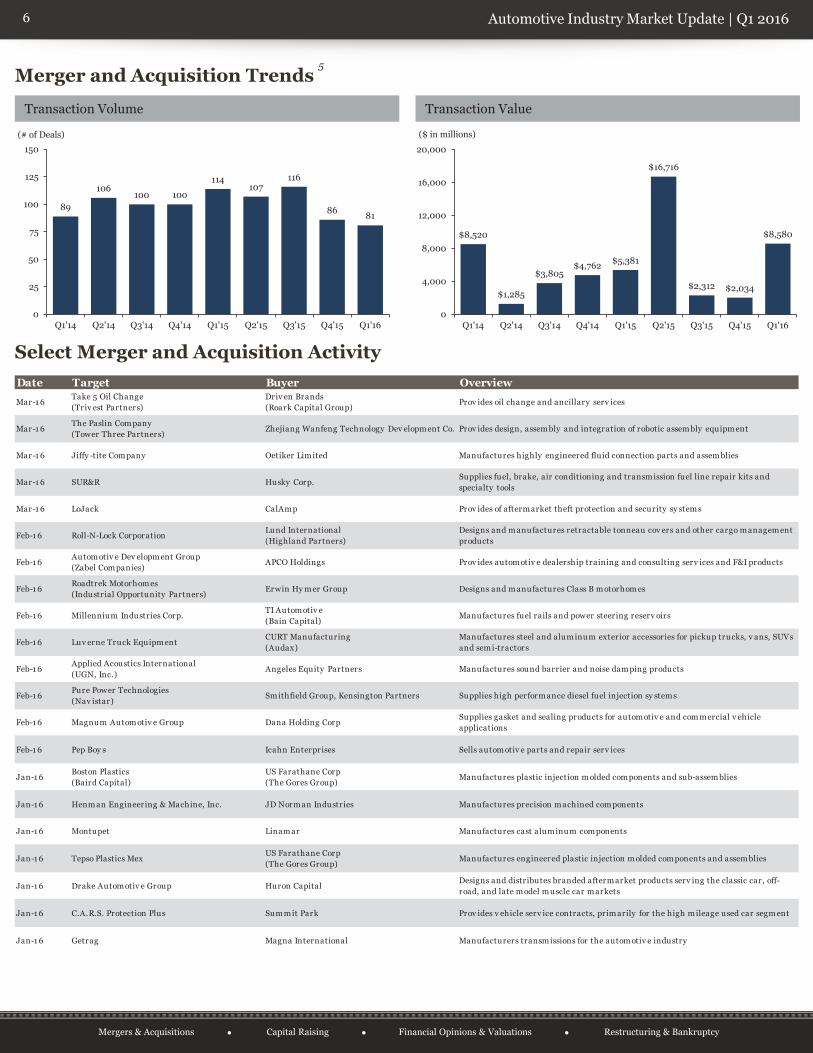
Merger and Acquisition Trends 5
Select Merger and Acquisition Activity
Transaction Volume Transaction Value
89
106100 100
114107
116
86 81
0
25
50
75
100
125
150
Q1'14 Q2'14 Q3'14 Q4'14 Q1'15 Q2'15 Q3'15 Q4'15 Q1'16
(# of Deals)
$8,520
$1,285
$3,805$4,762 $5,381
$16,716
$2,312 $2,034
$8,580
0
4,000
8,000
12,000
16,000
20,000
Q1'14 Q2'14 Q3'14 Q4'14 Q1'15 Q2'15 Q3'15 Q4'15 Q1'16
($ in millions)
Date Target Buyer Overview
Mar-1 6Take 5 Oil Change (Triv est Partners)
Driv en Brands (Roark Capital Group)
Prov ides oil change and ancillary serv ices
Mar-1 6The Paslin Company(Tower Three Partners)
Zhejiang Wanfeng Technology Dev elopment Co. Prov ides design, assembly and integration of robotic assembly equipment
Mar-1 6 Jiffy -tite Company Oetiker Limited Manufactures highly engineered fluid connection parts and assemblies
Mar-1 6 SUR&R Husky Corp.Supplies fuel, brake, air conditioning and transmission fuel line repair kits and specialty tools
Mar-1 6 LoJack CalAmp Prov ides of aftermarket theft protection and security sy stems
Feb-1 6 Roll-N-Lock CorporationLund International (Highland Partners)
Designs and manufactures retractable tonneau cov ers and other cargo management products
Feb-1 6Automotiv e Dev elopment Group (Zabel Companies)
APCO Holdings Prov ides automotiv e dealership training and consulting serv ices and F&I products
Feb-1 6Roadtrek Motorhomes (Industrial Opportunity Partners)
Erwin Hy mer Group Designs and manufactures Class B motorhomes
Feb-1 6 Millennium Industries Corp.TI Automotiv e (Bain Capital)
Manufactures fuel rails and power steering reserv oirs
Feb-1 6 Luv erne Truck Equipment CURT Manufacturing (Audax)
Manufactures steel and aluminum exterior accessories for pickup trucks, v ans, SUVs and semi-tractors
Feb-1 6Applied Acoustics International (UGN, Inc.)
Angeles Equity Partners Manufactures sound barrier and noise damping products
Feb-1 6Pure Power Technologies (Nav istar)
Smithfield Group, Kensington Partners Supplies high performance diesel fuel injection sy stems
Feb-1 6 Magnum Automotiv e Group Dana Holding CorpSupplies gasket and sealing products for automotiv e and commercial v ehicle applications
Feb-1 6 Pep Boy s Icahn Enterprises Sells automotiv e parts and repair serv ices
Jan-1 6Boston Plastics (Baird Capital)
US Farathane Corp (The Gores Group)
Manufactures plastic injection molded components and sub-assemblies
Jan-1 6 Henman Engineering & Machine, Inc. JD Norman Industries Manufactures precision machined components
Jan-1 6 Montupet Linamar Manufactures cast aluminum components
Jan-1 6 Tepso Plastics MexUS Farathane Corp (The Gores Group)
Manufactures engineered plastic injection molded components and assemblies
Jan-1 6 Drake Automotiv e Group Huron CapitalDesigns and distributes branded aftermarket products serv ing the classic car, off-road, and late model muscle car markets
Jan-1 6 C.A.R.S. Protection Plus Summit Park Prov ides v ehicle serv ice contracts, primarily for the high mileage used car segment
Jan-1 6 Getrag Magna International Manufacturers transmissions for the automotiv e industry

7 Automotive Industry Market Update | Q1 2016
Industry Metrics
U.S. Light Vehicle Sales and Market Share 3
North American Light Vehicle Production 3
Retail Gasoline Price 2
Miles Traveled 1
This newsletter is published solely for the general information of clients and friends of Western Reserve Partners LLC. Informationcontained in this publication may not be used or redistributed without expressed written permission from Western Reserve Partners LLC.This publication is not a research report, as such term is defined by applicable law and regulations, and is provided for informationalpurposes only. Information contained in this publication is based on data obtained from sources we deem to be reliable; however, we donot guarantee or represent that it is accurate or complete, and it should not be relied upon as such. This report may contain references toregistered trademarks, service marks and copyrights owned by third-party information providers. Opinions expressed are our currentopinions as of the date appearing on this material only. This material should not be read as advice or recommendations, and we are notsoliciting any action based upon receipt of this information. Nothing in this publication is intended to be an offer to buy or sell or thesolicitation of an offer to buy or sell any specific security or company. The testimonials presented are applicable to the individuals depictedand may not be representative of the experience of others. The testimonials are not paid and are not indicative of future performance orsuccess.
1. St. Louis Federal Reserve2. U.S. Department of Energy3. Wards4. Q1 represents three months ended February 20165. Capital IQ6. Indices weighted by market capitalization
Citations and Sources
Mergers & Acquisitions ● Capital Raising ● Financial Opinions & Valuations ● Restructuring & Bankruptcy
% Share2016 2015 % Change 2016 2015
U.S. Car 1,016,369 1,048,171 (3.0%) 59.5% 58.7%U.S. Light Truck 2,009,808 1,829,338 9.9% 73.1% 73.9%U.S. Light Vehicle 3,026,177 2,877,509 5.2% 67.9% 67.5%
Canada Car 220,248 227,906 (3.4%) 12.9% 12.8%Canada Light Truck 410,577 309,991 32.4% 14.9% 12.5%Canada Light Vehicle 630,825 537,897 17.3% 14.1% 12.6%
Mexico Car 472,891 509,328 (7.2%) 27.7% 28.5%Mexico Light Truck 330,039 335,413 (1.6%) 12.0% 13.6%Mexico Light Vehicle 802,930 844,741 (4.9%) 18.0% 19.8%
North America Car 1,709,508 1,785,405 (4.3%) 38.3% 41.9%North America Light Truck 2,750,424 2,474,742 11.1% 61.7% 58.1%North America LV 4,459,932 4,260,147 4.7% 100.0% 100.0%
Production, YTD March
2.2%
3.2% 3.1%
2.2%
3.3%3.5%
1.6%
3.6%
1.7%
3.6% 3.4%
2.0%
5.6%
0.0%
1.0%
2.0%
3.0%
4.0%
5.0%
6.0%
F-15 M-15 A-15 M-15 J-15 J-15 A-15 S-15 O-15 N-15 D-15 J-16 F-16
YoY Monthly Change Miles Traveled
2016 2015 % Change 2016 2015
General Motors 431,570 434,164 (0.6%) 17.4% 18.1%
Ford 378,830 349,730 8.3% 15.3% 14.6%
Toyota 349,237 349,661 (0.1%) 14.1% 14.6%
FCA 335,510 307,068 9.3% 13.5% 12.8%
Nissan 236,645 222,543 6.3% 9.6% 9.3%
Honda 219,482 207,650 5.7% 8.9% 8.7%
Hyundai 98,020 97,010 1.0% 4.0% 4.0%
Kia Motors 88,042 82,329 6.9% 3.6% 3.4%
Subaru 83,112 82,170 1.1% 3.4% 3.4%
Daimler 52,616 52,400 0.4% 2.1% 2.2%
Other 204,013 214,596 (4.9%) 8.2% 8.9%
Total 2,477,077 2,399,321 3.2% 100.0% 100.0%
% ShareUnit Sales, YTD March
$2.56
$2.80$2.89 $2.88
$2.73
$2.46 $2.39$2.26
$2.14$2.06
$1.87$2.07
(40%)
(20%)
0%
20%
$1.00
$1.50
$2.00
$2.50
$3.00
$3.50
A-15 M-15 J-15 J-15 A-15 S-15 O-15 N-15 D-15 J-16 F-16 M-16
Retail Gasoline Price (All Grades) YOY Change

8 Automotive Industry Market Update | Q1 2016
Matthew J. MuellerAutomotive Practice Leader
Automotive Practice Overview Western Reserve’s professionals have extensive experience in the automotive industry, having
completed 70 transactions at a collective value of nearly $6 billion
We have worked with clients across the automotive industry, including:
Segments□ Aftermarket□ Original Equipment□ Distribution□ Manufacturing□ Automation□ Retail and Services□ Specialty Vehicles
Systems□ Air and Fluid□ Drivetrain and
Powertrain□ Electrical□ Exterior and Body □ Interior Components and
Assemblies
Materials□ Metal□ Rubber□ Plastic□ Electronics□ Engineered Materials
Please email us at [email protected] to subscribe to our market update
Mergers & Acquisitions ● Capital Raising ● Financial Opinions & Valuations ● Restructuring & Bankruptcy
Recent Automotive Industry Transactions
Sell-Side Advisor
has been acquired by
a portfolio company of
&
a portfolio company of
Defiance Partners
has been acquired by
a portfolio company of
Sell-Side Advisor
and has sold its Wiring Business segment to
Sell-Side Advisor
has been acquired by
a subsidiary of
a portfolio company of
Sell-Side Advisor
Overview of Western Reserve PartnersWestern Reserve Partners provides M&A, capital raising and other financial advisory services to middle market companies across a focused set ofindustry verticals. We deliver thoughtful advice, keen market insight and superior execution to our clients, both nationally and internationally, andour partners average nearly 30 years of experience and have executed more than 600 transactions throughout their careers.
Financial Advisory Services Focused Industry Verticals
• Sell-Side Advisory• Buy-Side Advisory• Capital Raising• Financial Opinions and
Valuations• Restructuring and
Bankruptcy
• Industrial• Consumer• Healthcare and Technology• Distribution• Services• Real Estate
Dedicated Senior Attention Global Reach
• Partners average nearly 30 years of experience and have collectively executed more than 600 transactions
• We are a member of M&A International Inc., a premier alliance of nearly 50 investment banking firms in over 40 countries
What We Do Why We’re Different