
Automatic Updating of Times Remaining in Surgical … · Economics, Education, and Policy Section...
12
Economics, Education, and Policy Section Editor: Franklin Dexter Automatic Updating of Times Remaining in Surgical Cases Using Bayesian Analysis of Historical Case Duration Data and “Instant Messaging” Updates from Anesthesia Providers Franklin Dexter, MD, PhD* Richard H. Epstein, MD† John D. Lee, PhD‡ Johannes Ledolter, PhD§ BACKGROUND: Operating room (OR) whiteboards (status displays) communicate times remaining for ongoing cases to perioperative stakeholders (e.g., postanesthe- sia care unit, anesthesiologists, holding area, and control desks). Usually, sched- uled end times are shown for each OR. However, these displays are inaccurate for predicting the time that remains in a case. Once a case scheduled for 2 h has been on-going for 1.5 h, the median time remaining is not 0.5 h but longer, and the amount longer differs among procedures. METHODS: We derived the conditional Bayesian lower prediction bound of a case’s duration, conditional on the minutes of elapsed OR time. Our derivations make use of the posterior predictive distribution of OR times following an exponential of a scaled Student t distribution that depends on the scheduled OR time and several parameters calculated from historical case duration data. The statistical method was implemented using Structured Query Language (SQL) running on the anesthesia information management system (AIMS) database server. In addition, AIMS workstations were sent instant messages displaying a pop-up dialog box asking for anesthesia providers’ estimates for remaining times. The dialogs caused negotiated interruptions (i.e., the anesthesia provider could reply immediately, keep the dialog displayed, or defer response). There were no announcements, education, or efforts to promote buy-in. RESULTS: After a case had been in the OR longer than scheduled, the median remaining OR time for the case changes little over time (e.g., 35 min left at 2:30 pm and also at 3:00 pm while the case was still on-going). However, the remaining time differs substan- tially among surgeons and scheduled procedure(s) (16 min longer [10th percentile], 35 min [50th], and 86 min [90th]). We therefore implemented an automatic method to estimate the times remaining in cases. The system was operational for 119 of each day’s 120 5-min intervals. When instant message dialogs appearing on AIMS work- stations were used to elicit estimates of times remaining from anesthesia providers, acknowledgment was on average within 1.2 min (95% confidence interval [CI] 1.1–1.3 min). The 90th percentile of latencies was 6.5 min (CI: 4.4 –7.0 min). CONCLUSIONS: For cases taking nearly as long as or longer than scheduled, each 1 min progression of OR time reduces the median time remaining in a case by 1 min. We implemented automated calculation of times remaining for every case at a 29 OR hospital. (Anesth Analg 2009;108:929 –40) Operating room (OR) whiteboards (status displays) are ubiquitous for communicating the times remain- ing in ongoing cases to the many stakeholders in- volved in perioperative patient care. 1,2 Typically, the cases scheduled in each OR are represented by a linear series of bars or circles, with the OR times of com- pleted cases determined by the actual OR times, and the times remaining in ongoing cases determined by the scheduled durations. 3,4 Thus, a case scheduled for From the Division of Management Consulting, Departments of Anes- thesia and Health Management and Policy, University of Iowa, Iowa City, Iowa; †Department of Anesthesiology, Jefferson Medical College, Phila- delphia, Pennsylvania; Departments of ‡Mechanical and Industrial Engi- neering, and §Management Sciences, University of Iowa, Iowa. Accepted for publication October 6, 2008. FD is the Director of the Division of Management Consulting of the Department of Anesthesia of the University of Iowa. He receives no funds personally other than his salary from the State of Iowa, including no travel expenses or honoraria, and has tenure with no incentive program. Franklin Dexter is editor of Economics, Education, and Policy for the Journal. This manuscript was handled by Steven L. Shafer, Editor-in-chief, and Dr. Dexter was not involved in any way with the editorial process or decision. Presented at the American Society of Anesthesiologists’ meeting in Orlando, FL, on October 19, 2008. A presentation was also given at the Institute for Operations Research and the Management Sciences’ meeting in Washington, DC, October 12, 2008. Address correspondence and reprint requests to Franklin Dexter, MD, PhD, Division of Management Consulting, Department of Anes- thesia, University of Iowa, Iowa City, IA 52242. Address e-mail to [email protected] or go to web site www.FranklinDexter.net. Copyright © 2009 International Anesthesia Research Society DOI: 10.1213/ane.0b013e3181921c37 Vol. 108, No. 3, March 2009 929
Transcript of Automatic Updating of Times Remaining in Surgical … · Economics, Education, and Policy Section...
Economics, Education, and PolicySection Editor: Franklin Dexter
Automatic Updating of Times Remaining in SurgicalCases Using Bayesian Analysis of Historical CaseDuration Data and “Instant Messaging” Updates fromAnesthesia Providers
Franklin Dexter, MD, PhD*
Richard H. Epstein, MD†
John D. Lee, PhD‡
Johannes Ledolter, PhD§
BACKGROUND: Operating room (OR) whiteboards (status displays) communicatetimes remaining for ongoing cases to perioperative stakeholders (e.g., postanesthe-sia care unit, anesthesiologists, holding area, and control desks). Usually, sched-uled end times are shown for each OR. However, these displays are inaccurate forpredicting the time that remains in a case. Once a case scheduled for 2 h has beenon-going for 1.5 h, the median time remaining is not 0.5 h but longer, and theamount longer differs among procedures.METHODS: We derived the conditional Bayesian lower prediction bound of a case’sduration, conditional on the minutes of elapsed OR time. Our derivations make useof the posterior predictive distribution of OR times following an exponential of ascaled Student t distribution that depends on the scheduled OR time and severalparameters calculated from historical case duration data. The statistical methodwas implemented using Structured Query Language (SQL) running on theanesthesia information management system (AIMS) database server. In addition,AIMS workstations were sent instant messages displaying a pop-up dialog boxasking for anesthesia providers’ estimates for remaining times. The dialogs causednegotiated interruptions (i.e., the anesthesia provider could reply immediately,keep the dialog displayed, or defer response). There were no announcements,education, or efforts to promote buy-in.RESULTS: After a case had been in the OR longer than scheduled, the median remainingOR time for the case changes little over time (e.g., 35 min left at 2:30 pm and also at 3:00pm while the case was still on-going). However, the remaining time differs substan-tially among surgeons and scheduled procedure(s) (16 min longer [10th percentile], 35min [50th], and 86 min [90th]). We therefore implemented an automatic method toestimate the times remaining in cases. The system was operational for �119 of eachday’s 120 5-min intervals. When instant message dialogs appearing on AIMS work-stations were used to elicit estimates of times remaining from anesthesia providers,acknowledgment was on average within 1.2 min (95% confidence interval [CI] 1.1–1.3min). The 90th percentile of latencies was 6.5 min (CI: 4.4–7.0 min).CONCLUSIONS: For cases taking nearly as long as or longer than scheduled, each 1 minprogression of OR time reduces the median time remaining in a case by �1 min. Weimplemented automated calculation of times remaining for every case at a 29 OR hospital.(Anesth Analg 2009;108:929–40)
Operating room (OR) whiteboards (status displays)are ubiquitous for communicating the times remain-ing in ongoing cases to the many stakeholders in-volved in perioperative patient care.1,2 Typically, thecases scheduled in each OR are represented by a linearseries of bars or circles, with the OR times of com-pleted cases determined by the actual OR times, and
the times remaining in ongoing cases determined bythe scheduled durations.3,4 Thus, a case scheduled for
From the Division of Management Consulting, Departments of Anes-thesia and Health Management and Policy, University of Iowa, Iowa City,Iowa; †Department of Anesthesiology, Jefferson Medical College, Phila-delphia, Pennsylvania; Departments of ‡Mechanical and Industrial Engi-neering, and §Management Sciences, University of Iowa, Iowa.
Accepted for publication October 6, 2008.FD is the Director of the Division of Management Consulting of the
Department of Anesthesia of the University of Iowa. He receives no fundspersonally other than his salary from the State of Iowa, including no travelexpenses or honoraria, and has tenure with no incentive program.
Franklin Dexter is editor of Economics, Education, and Policy forthe Journal. This manuscript was handled by Steven L. Shafer,Editor-in-chief, and Dr. Dexter was not involved in any way withthe editorial process or decision.
Presented at the American Society of Anesthesiologists’ meetingin Orlando, FL, on October 19, 2008. A presentation was also givenat the Institute for Operations Research and the ManagementSciences’ meeting in Washington, DC, October 12, 2008.
Address correspondence and reprint requests to Franklin Dexter,MD, PhD, Division of Management Consulting, Department of Anes-thesia, University of Iowa, Iowa City, IA 52242. Address e-mail [email protected] or go to web site www.FranklinDexter.net.
Copyright © 2009 International Anesthesia Research SocietyDOI: 10.1213/ane.0b013e3181921c37
Vol. 108, No. 3, March 2009 929
2 h that has been in the OR for 1.5 h is listed as having0.5 h remaining, even though most of these cases willtake longer than their scheduled 2 h. Once a case’s ORtime exceeds the scheduled duration, many facilitiesmake arbitrary decisions for the display of the timeremaining (e.g., 15 min is added to the current timewhenever the screen is refreshed).
Although anesthesia providers can be called andasked for estimates of the times remaining in cases,there are limitations. Since interruptions may ad-versely affect OR team performance,5,6 such calls aremade sparingly, resulting in updates being madeinfrequently. The intervals at which additional callsshould be placed to update these estimates (e.g., 30min) are unknown. The estimates often are not addedto the whiteboards. Even if added, each successive 1min the displays typically reduce 1 min from theestimate, and whether the estimate then remains ac-curate is unknown.
Video cameras in ORs can be used to transmitimages that are degraded to mitigate patient or staffidentification but sufficient to allow a viewer to dis-cern progress in the case.7 However, the resultingvisual information needs to be interpreted by a personknowledgeable in many types of procedures. We arenot aware of those data being used for on-line decisionsupport.
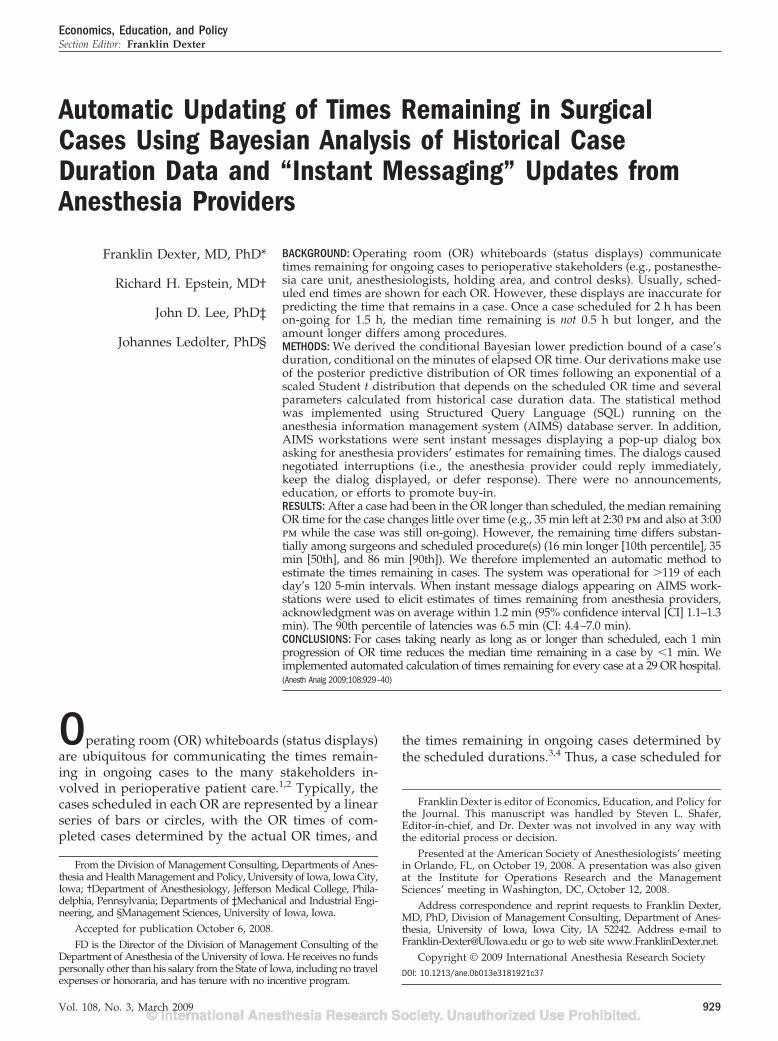
In this article, we study the statistical properties oftimes remaining in late running cases. We modify thepreviously developed Bayesian method to estimateOR times to update automatically the remaining timesof ongoing cases.8 The method relies on the scheduledcase durations, historical case duration data, andelapsed times determined9 by using anesthesia infor-mation management system (AIMS) data. The patientstatus is displayed at the anesthesia control desk andis updated automatically every 5 min for every case.The method is not dependent on the amount ofhistorical data that are available, including situationswhere a case has never been done before by a givensurgeon, and there is no requirement for human dataentry. In addition, anesthesia providers are occasion-ally sent “instant messages” that appear on their AIMSworkstation. These are transmitted via a pop-up dia-log box containing a digital clock control throughwhich they notify the OR control desk of their estimateof the time of OR exit (Fig. 1). The anesthesia provid-er’s estimate is substituted in the Bayesian method toreplace the initial (scheduled) OR time. Thus, 5 minlater, 10 min later, etc., displays for the time remainingin the case accurately reflect the estimated time re-maining 5 min, 10 min, etc., after the provider made anestimate.
METHODSAppendix 1 describes the mathematics pro-
grammed using structured query language (SQLServer, Microsoft, Redmond, WA). That Appendix is
the part of the article that describes the underlyingmathematical basis of the intervention. The Appendixis presented in sufficient detail that other facilities canimplement our methods.
Every 5 min, a stored procedure on the AIMSdatabase server calculates the elapsed time in eachcase from patient entry into the OR, for every casecurrently running in all 29 ORs of four physicallydistributed suites. The OR director’s status display(whiteboard) and the managerial decision supportsystem are updated automatically with these times.The time of patient entry into each OR is obtainedfrom the AIMS (see Discussion).9 The surgeon andscheduled procedure(s) are obtained from the hospi-tals’ operating room information management system(ORIMS). Those data are used to choose parametersfrom lookup tables that are regenerated using a SQLprocedure that is run quarterly using all data fromJanuary 1, 2001 to the current date. The Resultspresented here are based on cases from 2001 to 2007applied to forecasts for February and March 2008.
The Bayesian method to estimate OR times isapplied regardless of whether the case is of a combi-nation of surgeon and procedure(s) with no, a few, ormany historical cases of the same type.8 When a caseis of a rare combination with little or no historicaldata,10,11 the scheduled OR time is the principal or solebasis for future predictions of OR time. When a casehas substantial historical data, the scheduled OR time has anegligible effect on OR time as compared to theinformation from the historical OR times. At thestudied hospital, the schedulers add an estimate ofthe turnover time to the estimate of the OR time
Figure 1. Unanchored version of the dialog requesting theremaining time in the case seen by anesthesia providers. Thesmall arrows changed the clock in 5 min increments, whilethe large arrows made changes of 15 min. The minimumtime allowed was the current time, rounded up to thenearest 5 min. If users attempted to enter the time directlyinto the digital area, this was prevented and the text in reddisplayed. A message was also displayed if the providerattempted to change the clock to earlier than the minimumtime allowed. The red text disappeared when any arrowcontrol was clicked subsequently.
930 Automatic Updating of Case Durations ANESTHESIA & ANALGESIA
provided by the surgeon. Therefore, the scheduled ORtime used in the Bayesian method is estimated fromthe scheduled case duration (see Appendix 2).
Equation 11 in Appendix 1 gives the automaticallyupdated estimate of the time remaining in each case.However, the Bayesian method only uses data avail-able before the case started and the automaticallydetermined7,9,12 time from case start. The longer thateach case proceeds, the greater is the expected incre-mental value of the knowledge of the providers in theOR. Therefore, occasionally an instant message is sentto the AIMS workstation to elicit an update from theanesthesia provider of the remaining OR time (Fig. 1)(Appendix 3). The elicited time replaces the scheduledOR time for status displays, the decision supportsystem, and future elicited times. Appendix 4 de-scribes how we used the data from 560 such cases toassess the “up-time” of the system and how longanesthesia providers took to respond to the dialogs.
RESULTSFigure 2 shows an example of how the predicted
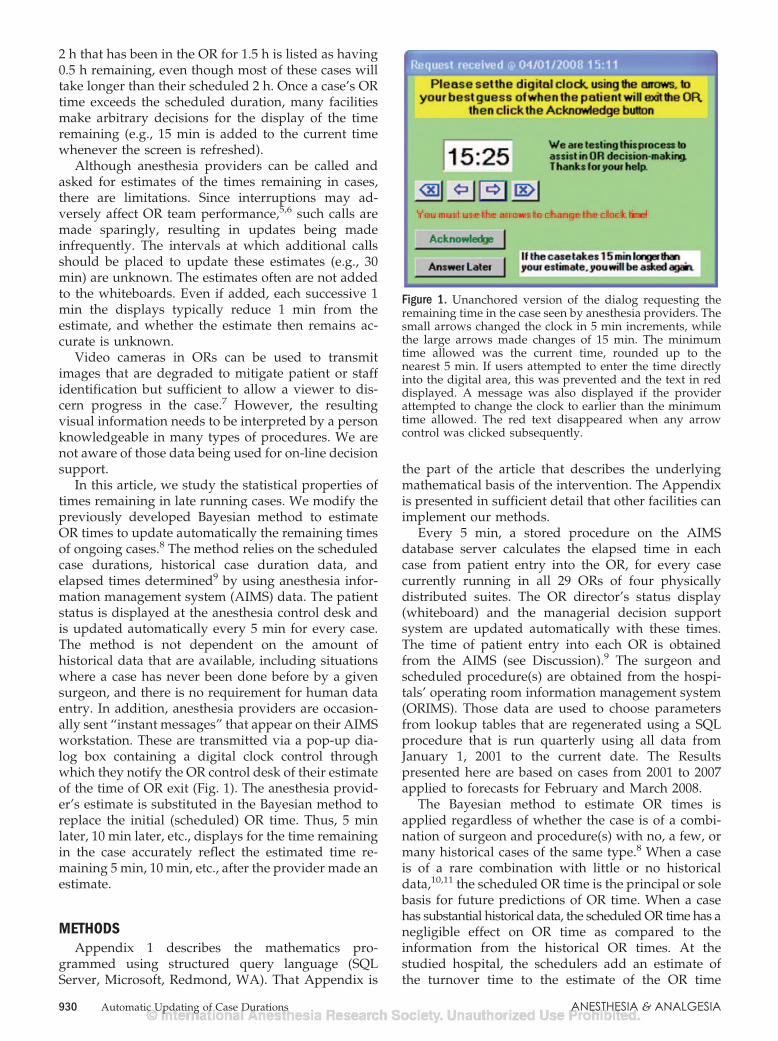
OR time remaining in cases differs among cases de-pending on the parameter values of the combinationsof surgeon and procedure(s). Both lines are for caseswith a scheduled OR time of 1 h and a median ofhistorical OR time of 1 h. After 1 h in the OR, theupdated median time remaining for the two cases are9 min and 27 min, respectively. Later (e.g., at 1.5 h inthe OR), the median times remaining are persistentlyclose to a constant of 7 min (12% of 60 min) (– – –) or28 min (47% of 60 min) (—), respectively. For the lattercase (—), if the surgeon was asked at 1.5 h “how muchlonger,” a likely answer would be “a half hour.” At2.0 h, if the case were still ongoing, a likely answerwould still be “a half hour.” Figure 2 shows that thiscommonplace opinion about surgeons’ updated esti-mates is reasonable, but that the additional OR timethat is needed differs among cases. See the last threeparagraphs of Appendix 2 for statistical details.
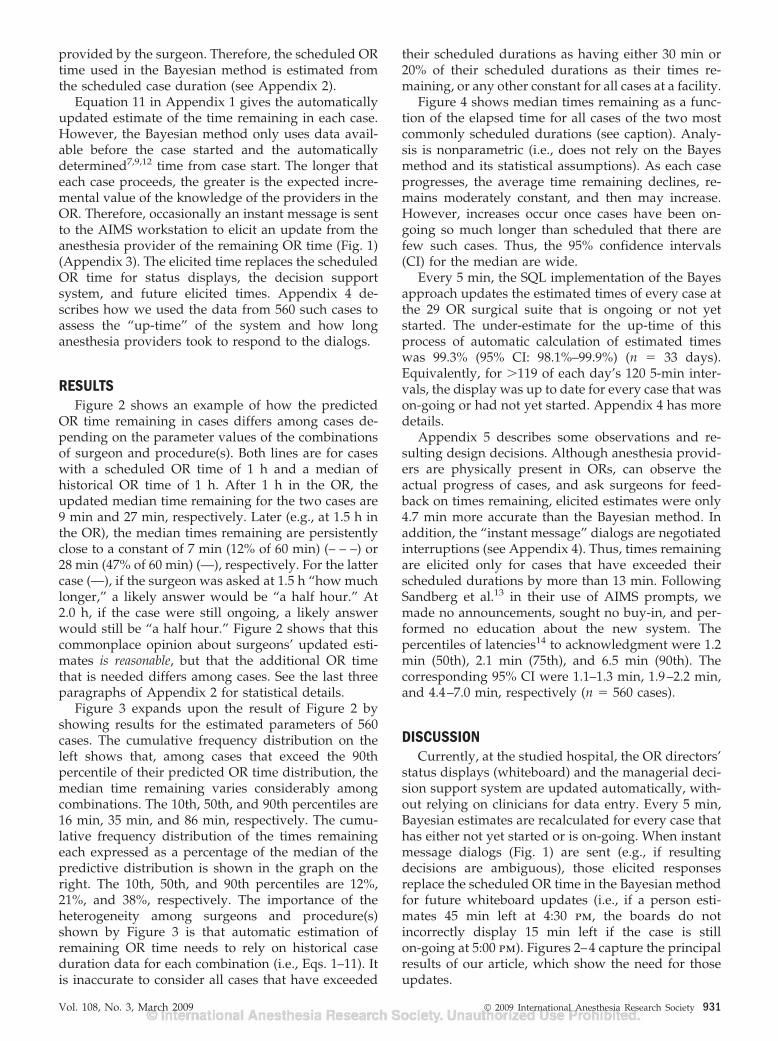
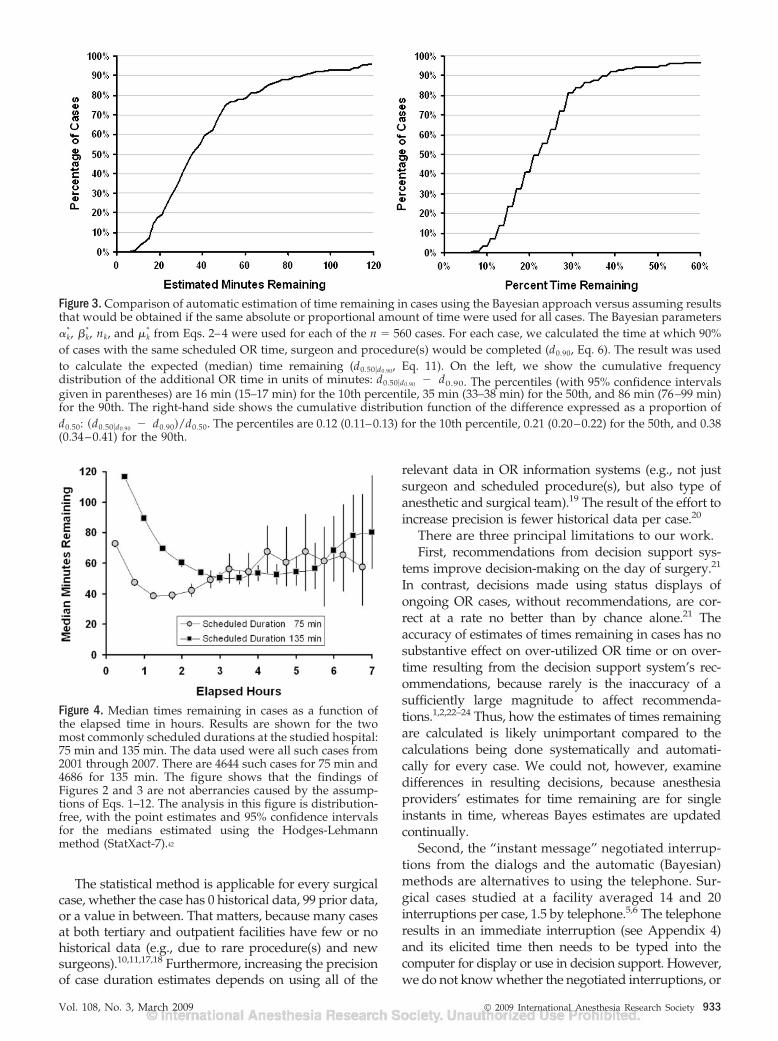
Figure 3 expands upon the result of Figure 2 byshowing results for the estimated parameters of 560cases. The cumulative frequency distribution on theleft shows that, among cases that exceed the 90thpercentile of their predicted OR time distribution, themedian time remaining varies considerably amongcombinations. The 10th, 50th, and 90th percentiles are16 min, 35 min, and 86 min, respectively. The cumu-lative frequency distribution of the times remainingeach expressed as a percentage of the median of thepredictive distribution is shown in the graph on theright. The 10th, 50th, and 90th percentiles are 12%,21%, and 38%, respectively. The importance of theheterogeneity among surgeons and procedure(s)shown by Figure 3 is that automatic estimation ofremaining OR time needs to rely on historical caseduration data for each combination (i.e., Eqs. 1–11). Itis inaccurate to consider all cases that have exceeded
their scheduled durations as having either 30 min or20% of their scheduled durations as their times re-maining, or any other constant for all cases at a facility.
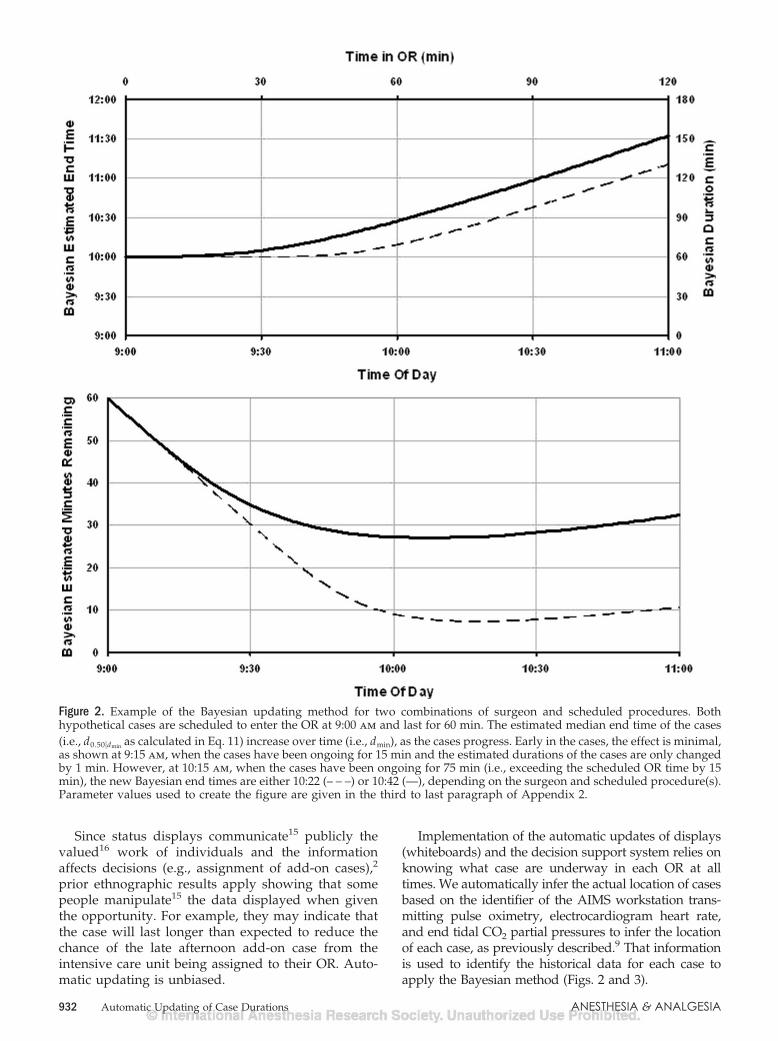
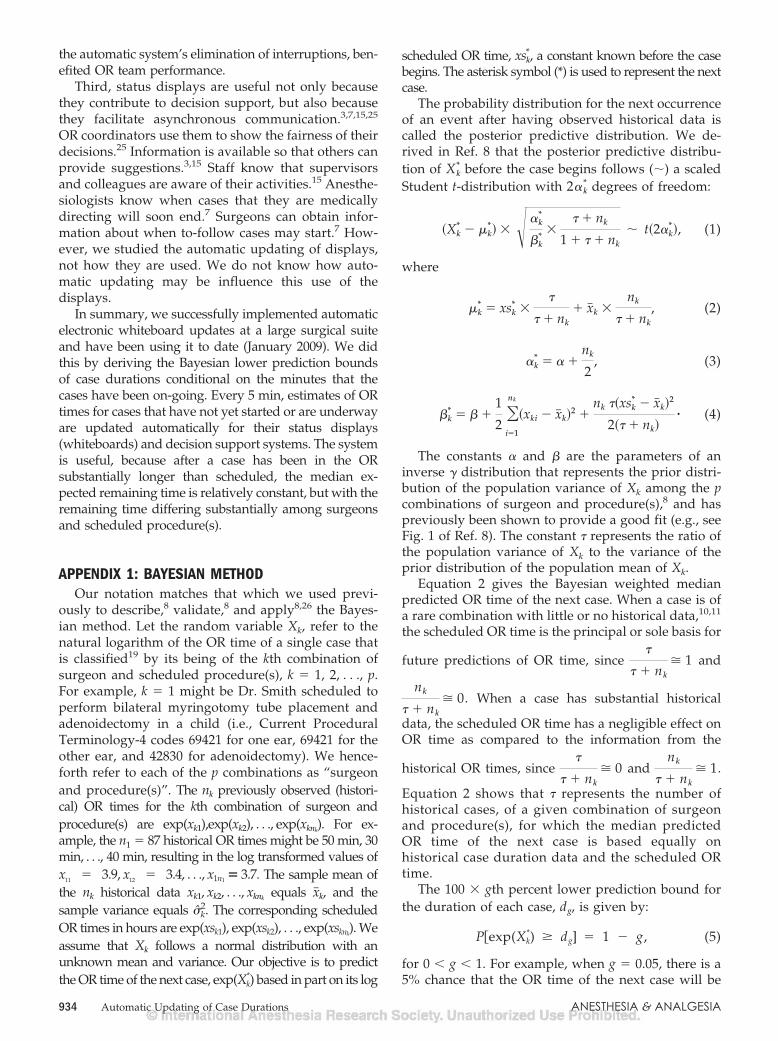
Figure 4 shows median times remaining as a func-tion of the elapsed time for all cases of the two mostcommonly scheduled durations (see caption). Analy-sis is nonparametric (i.e., does not rely on the Bayesmethod and its statistical assumptions). As each caseprogresses, the average time remaining declines, re-mains moderately constant, and then may increase.However, increases occur once cases have been on-going so much longer than scheduled that there arefew such cases. Thus, the 95% confidence intervals(CI) for the median are wide.
Every 5 min, the SQL implementation of the Bayesapproach updates the estimated times of every case atthe 29 OR surgical suite that is ongoing or not yetstarted. The under-estimate for the up-time of thisprocess of automatic calculation of estimated timeswas 99.3% (95% CI: 98.1%–99.9%) (n � 33 days).Equivalently, for �119 of each day’s 120 5-min inter-vals, the display was up to date for every case that wason-going or had not yet started. Appendix 4 has moredetails.
Appendix 5 describes some observations and re-sulting design decisions. Although anesthesia provid-ers are physically present in ORs, can observe theactual progress of cases, and ask surgeons for feed-back on times remaining, elicited estimates were only4.7 min more accurate than the Bayesian method. Inaddition, the “instant message” dialogs are negotiatedinterruptions (see Appendix 4). Thus, times remainingare elicited only for cases that have exceeded theirscheduled durations by more than 13 min. FollowingSandberg et al.13 in their use of AIMS prompts, wemade no announcements, sought no buy-in, and per-formed no education about the new system. Thepercentiles of latencies14 to acknowledgment were 1.2min (50th), 2.1 min (75th), and 6.5 min (90th). Thecorresponding 95% CI were 1.1–1.3 min, 1.9–2.2 min,and 4.4–7.0 min, respectively (n � 560 cases).
DISCUSSIONCurrently, at the studied hospital, the OR directors’
status displays (whiteboard) and the managerial deci-sion support system are updated automatically, with-out relying on clinicians for data entry. Every 5 min,Bayesian estimates are recalculated for every case thathas either not yet started or is on-going. When instantmessage dialogs (Fig. 1) are sent (e.g., if resultingdecisions are ambiguous), those elicited responsesreplace the scheduled OR time in the Bayesian methodfor future whiteboard updates (i.e., if a person esti-mates 45 min left at 4:30 pm, the boards do notincorrectly display 15 min left if the case is stillon-going at 5:00 pm). Figures 2–4 capture the principalresults of our article, which show the need for thoseupdates.
Vol. 108, No. 3, March 2009 © 2009 International Anesthesia Research Society 931
Since status displays communicate15 publicly thevalued16 work of individuals and the informationaffects decisions (e.g., assignment of add-on cases),2
prior ethnographic results apply showing that somepeople manipulate15 the data displayed when giventhe opportunity. For example, they may indicate thatthe case will last longer than expected to reduce thechance of the late afternoon add-on case from theintensive care unit being assigned to their OR. Auto-matic updating is unbiased.
Implementation of the automatic updates of displays(whiteboards) and the decision support system relies onknowing what case are underway in each OR at alltimes. We automatically infer the actual location of casesbased on the identifier of the AIMS workstation trans-mitting pulse oximetry, electrocardiogram heart rate,and end tidal CO2 partial pressures to infer the locationof each case, as previously described.9 That informationis used to identify the historical data for each case toapply the Bayesian method (Figs. 2 and 3).
Figure 2. Example of the Bayesian updating method for two combinations of surgeon and scheduled procedures. Bothhypothetical cases are scheduled to enter the OR at 9:00 am and last for 60 min. The estimated median end time of the cases(i.e., d0.50�dmin as calculated in Eq. 11) increase over time (i.e., dmin), as the cases progress. Early in the cases, the effect is minimal,as shown at 9:15 am, when the cases have been ongoing for 15 min and the estimated durations of the cases are only changedby 1 min. However, at 10:15 am, when the cases have been ongoing for 75 min (i.e., exceeding the scheduled OR time by 15min), the new Bayesian end times are either 10:22 (– – –) or 10:42 (—), depending on the surgeon and scheduled procedure(s).Parameter values used to create the figure are given in the third to last paragraph of Appendix 2.
932 Automatic Updating of Case Durations ANESTHESIA & ANALGESIA
The statistical method is applicable for every surgicalcase, whether the case has 0 historical data, 99 prior data,or a value in between. That matters, because many casesat both tertiary and outpatient facilities have few or nohistorical data (e.g., due to rare procedure(s) and newsurgeons).10,11,17,18 Furthermore, increasing the precisionof case duration estimates depends on using all of the
relevant data in OR information systems (e.g., not justsurgeon and scheduled procedure(s), but also type ofanesthetic and surgical team).19 The result of the effort toincrease precision is fewer historical data per case.20
There are three principal limitations to our work.First, recommendations from decision support sys-
tems improve decision-making on the day of surgery.21
In contrast, decisions made using status displays ofongoing OR cases, without recommendations, are cor-rect at a rate no better than by chance alone.21 Theaccuracy of estimates of times remaining in cases has nosubstantive effect on over-utilized OR time or on over-time resulting from the decision support system’s rec-ommendations, because rarely is the inaccuracy of asufficiently large magnitude to affect recommenda-tions.1,2,22–24 Thus, how the estimates of times remainingare calculated is likely unimportant compared to thecalculations being done systematically and automati-cally for every case. We could not, however, examinedifferences in resulting decisions, because anesthesiaproviders’ estimates for time remaining are for singleinstants in time, whereas Bayes estimates are updatedcontinually.
Second, the “instant message” negotiated interrup-tions from the dialogs and the automatic (Bayesian)methods are alternatives to using the telephone. Sur-gical cases studied at a facility averaged 14 and 20interruptions per case, 1.5 by telephone.5,6 The telephoneresults in an immediate interruption (see Appendix 4)and its elicited time then needs to be typed into thecomputer for display or use in decision support. However,we do not know whether the negotiated interruptions, or
Figure 3. Comparison of automatic estimation of time remaining in cases using the Bayesian approach versus assuming resultsthat would be obtained if the same absolute or proportional amount of time were used for all cases. The Bayesian parameters�k
*, �k*, nk, and �k
* from Eqs. 2–4 were used for each of the n � 560 cases. For each case, we calculated the time at which 90%of cases with the same scheduled OR time, surgeon and procedure(s) would be completed (d0.90, Eq. 6). The result was usedto calculate the expected (median) time remaining (d0.50�d0.90, Eq. 11). On the left, we show the cumulative frequencydistribution of the additional OR time in units of minutes: d0.50�d0.90 � d0.90. The percentiles (with 95% confidence intervalsgiven in parentheses) are 16 min (15–17 min) for the 10th percentile, 35 min (33–38 min) for the 50th, and 86 min (76–99 min)for the 90th. The right-hand side shows the cumulative distribution function of the difference expressed as a proportion ofd0.50: �d0.50�d0.90 � d0.90�/d0.50. The percentiles are 0.12 (0.11–0.13) for the 10th percentile, 0.21 (0.20–0.22) for the 50th, and 0.38(0.34–0.41) for the 90th.
Figure 4. Median times remaining in cases as a function ofthe elapsed time in hours. Results are shown for the twomost commonly scheduled durations at the studied hospital:75 min and 135 min. The data used were all such cases from2001 through 2007. There are 4644 such cases for 75 min and4686 for 135 min. The figure shows that the findings ofFigures 2 and 3 are not aberrancies caused by the assump-tions of Eqs. 1–12. The analysis in this figure is distribution-free, with the point estimates and 95% confidence intervalsfor the medians estimated using the Hodges-Lehmannmethod (StatXact-7).42
Vol. 108, No. 3, March 2009 © 2009 International Anesthesia Research Society 933
the automatic system’s elimination of interruptions, ben-efited OR team performance.
Third, status displays are useful not only becausethey contribute to decision support, but also becausethey facilitate asynchronous communication.3,7,15,25
OR coordinators use them to show the fairness of theirdecisions.25 Information is available so that others canprovide suggestions.3,15 Staff know that supervisorsand colleagues are aware of their activities.15 Anesthe-siologists know when cases that they are medicallydirecting will soon end.7 Surgeons can obtain infor-mation about when to-follow cases may start.7 How-ever, we studied the automatic updating of displays,not how they are used. We do not know how auto-matic updating may be influence this use of thedisplays.
In summary, we successfully implemented automaticelectronic whiteboard updates at a large surgical suiteand have been using it to date (January 2009). We didthis by deriving the Bayesian lower prediction boundsof case durations conditional on the minutes that thecases have been on-going. Every 5 min, estimates of ORtimes for cases that have not yet started or are underwayare updated automatically for their status displays(whiteboards) and decision support systems. The systemis useful, because after a case has been in the ORsubstantially longer than scheduled, the median ex-pected remaining time is relatively constant, but with theremaining time differing substantially among surgeonsand scheduled procedure(s).
APPENDIX 1: BAYESIAN METHODOur notation matches that which we used previ-
ously to describe,8 validate,8 and apply8,26 the Bayes-ian method. Let the random variable Xk, refer to thenatural logarithm of the OR time of a single case thatis classified19 by its being of the kth combination ofsurgeon and scheduled procedure(s), k � 1, 2, . . ., p.For example, k � 1 might be Dr. Smith scheduled toperform bilateral myringotomy tube placement andadenoidectomy in a child (i.e., Current ProceduralTerminology-4 codes 69421 for one ear, 69421 for theother ear, and 42830 for adenoidectomy). We hence-forth refer to each of the p combinations as “surgeonand procedure(s)”. The nk previously observed (histori-cal) OR times for the kth combination of surgeon andprocedure(s) are exp(xk1),exp(xk2), . . ., exp(xknk). For ex-ample, the n1 � 87 historical OR times might be 50 min, 30min, . . ., 40 min, resulting in the log transformed values ofx11 � 3.9, x12 � 3.4, . . ., x1n1 � 3.7. The sample mean ofthe nk historical data xk1, xk2, . . ., xknk equals x�k, and thesample variance equals �̂k
2. The corresponding scheduledOR times in hours are exp(xsk1), exp(xsk2), . . ., exp(xsknk). Weassume that Xk follows a normal distribution with anunknown mean and variance. Our objective is to predictthe OR time of the next case, exp(Xk
*) based in part on its log
scheduled OR time, xsk*, a constant known before the case
begins. The asterisk symbol (*) is used to represent the nextcase.
The probability distribution for the next occurrenceof an event after having observed historical data iscalled the posterior predictive distribution. We de-rived in Ref. 8 that the posterior predictive distribu-tion of Xk
* before the case begins follows (�) a scaledStudent t-distribution with 2�k
* degrees of freedom:
�Xk* � �k
*� � � �k*
�k* �
� nk
1 � nk
� t�2�k*�, (1)
where
�k* � xsk
* ��
� nk
x�k �nk
� nk
, (2)
�k* � �
nk
2, (3)
�k* � �
1
2�i�1
nk
�xki � x�k�2
nk ��xsk* � x�k�
2
2�� nk�� (4)
The constants � and � are the parameters of aninverse distribution that represents the prior distri-bution of the population variance of Xk among the pcombinations of surgeon and procedure(s),8 and haspreviously been shown to provide a good fit (e.g., seeFig. 1 of Ref. 8). The constant � represents the ratio ofthe population variance of Xk to the variance of theprior distribution of the population mean of Xk.
Equation 2 gives the Bayesian weighted medianpredicted OR time of the next case. When a case is ofa rare combination with little or no historical data,10,11
the scheduled OR time is the principal or sole basis for
future predictions of OR time, since�
� nk
� 1 and
nk
� nk
� 0. When a case has substantial historical
data, the scheduled OR time has a negligible effect onOR time as compared to the information from the
historical OR times, since�
� nk
� 0 andnk
� nk
� 1.
Equation 2 shows that � represents the number ofhistorical cases, of a given combination of surgeonand procedure(s), for which the median predictedOR time of the next case is based equally onhistorical case duration data and the scheduled ORtime.
The 100 � gth percent lower prediction bound forthe duration of each case, dg, is given by:
P�exp(Xk*) � dg] � 1 � g, (5)
for 0 � g � 1. For example, when g � 0.05, there is a5% chance that the OR time of the next case will be
934 Automatic Updating of Case Durations ANESTHESIA & ANALGESIA

briefer than the value of dg. This is known as the 5%lower prediction bound for the duration of the nextcase.2,8,27 From Eq. 1, this bound satisfies theexpression8:
dg � exp��k* T�1�g, 2�k
* � ��k*
�k* �
1 � nk
� nk� ,
(6)
where T�.,2�k* is the cumulative distribution function
of the Student t-distribution with 2�k* degrees of
freedom and T � 1�g, 2�k* is its 100 � gth percentile.
For example, for g � 0.05, T � 1�0.05, 2�k* � 1.65 for
large �k*. When g � 0.05, there is a 95% chance that
the OR time will be at least as long as the value ofEq. 6. This lower 5% prediction bound is almostalways less than the scheduled OR time and isuseful for deciding when the next patient in thesame OR on the same day needs to be ready.2,8,28 Alow percentage is used to mitigate delays due topatient unavailability.
We previously published an empirical study of theaccuracy of Eq. 6.8 For g � 0.05, the result d0.05
exceeded the actual duration of 4.9% of the studiedcases.8 For g � 0.90, d0.90 was exceeded by the actualduration of 9.7% of cases.8 The absolute errors of theexpected values averaged 3.0 min less than the abso-lute errors of the scheduled OR times (P � 0.0001). Theterm under the square root of Eq. 6 expresses theuncertainty in the prediction. As we address atthe start of the Results and at the end of Appendix 2,the term varies substantively among combinations ofsurgeon and procedure.8
We next expand upon our prior work.8 Consider acase that has been on-going for time dmin � 0. The100 � gth percent conditional lower prediction bounddg�dmin satisfies
P�exp(Xk*) � dg�dmin �exp(Xk
*) � dmin] � 1 � g.
(7)
From the definition of conditional probability and thefact that dg�dmin � dmin, we find
P�exp(Xk*) > dg�dmin � exp(Xk
*) > dmin
�P[exp(Xk
*) > dg�dmin]
P[exp(Xk*) � dmin]
. (8)
Combining Eqs. 7 and 8,
P�exp(Xk*) � dg�dmin
� (1�g) � P[exp(Xk*) � dmin].
� �1 � g� � P�Xk* � ln(dmin)].
Substituting Eq. 1 into the right-hand side,
P�exp�Xk*� � dg�dmin
� �1 � g� � P �Xk* � �k
*�
� ��k*
�k* �
� nk
1 � nk
� �ln�dmin� � �k*�
� ��k*
�k* �
� nk
1 � nk
� �1 � g� � �1 � T �ln�dmin� � �k*�
� ��k*
�k* �
� nk
1 � nk
, 2�k*�
� 1 � �,
where,2,28
� � g �1 � g� � pk�dmin, (9)
pk�dmin � T �ln�dmin� � �k*� � ��k
*
�k* �
� nk
1 � nk
, 2�k* ,
(10)
and 100 � pk�dmin is the expected percentage of caseswith the same parameters (Eqs. 2–4) that would haveended by time dmin. Applying Eqs. 5 and 6, the 100gpercent conditional lower prediction bound is givenby the 100� percent lower prediction bound for theduration of the case before it started:
dg�dmin � exp��k* T � 1��, 2�k
* � ��k*
�k* �
1 � nk
� nk� .
(11)
For example, there is a 50% chance that the OR time ofa case that has been on-going for dmin units of time willbe smaller than the value d0.50�dmin in Eq. 11.
Figure 2 shows two examples of d0.50�dmin as afunction of dmin. There are four reasons why we useg � 0.50 (i.e., the median time remaining). First, usingthe median minimizes the mean absolute error.17
Second, when provided anchored values, participantsin experimental studies provide unbiased estimatesfor the median.29 Unbiased estimators have the prop-erty that the sum among cases of the differencesbetween the actual and estimated values equals zero(i.e., there is no bias). Third, over 3 yr at the hospitalwith previously published results, schedulers whowere supposed to estimate the OR times of cases didso by providing unbiased estimators for the median
Vol. 108, No. 3, March 2009 © 2009 International Anesthesia Research Society 935

OR times.8 Fourth, the method is simpler to explainbecause the initial estimate is simply exp(�k
*) fromEq. 2.
APPENDIX 2: IMPLEMENTATION OFBAYESIAN METHOD
OR information system data at the studied hospitalwere available from January 1, 2001 onwards. Wecreated a lookup table of nk, x� k, and the sum ofsquared terms in �k
*, while limiting consideration tothe most recent 99 cases27 of each combination ofsurgeon and procedure(s). However, the historical(2001–2007) raw data contained obvious errors (e.g.,negatively valued or missing OR times). Therefore,when setting up the table, we excluded cases forwhich the actual OR time divided by the scheduledcase duration was �0.25 or greater than 4.0. Using the129,380 historical cases, the criteria corresponded totrimming data 3.1 and 3.3 standard deviations belowand above the mean difference, respectively. Thenumbers of cases excluded were 416 cases (0.3%) formissing (zero valued) actual or scheduled times, 546cases (0.4%) with ratios �0.25, and 362 cases (0.3%)with ratios greater than 4.0. The histogram of thedifference of the logarithms of actual and scheduledOR times in Figure 5 uses 99.0% of all cases. Theinformation from these 128,056 cases from 2001 to2007 was used to obtain the forecasts for the Results(from February and March 2008). However, in prac-tice, the lookup table is recalculated using a SQLserver procedure that is run quarterly using all datafrom January 1, 2001 to the current date.
The nurse manager of the OR information manage-ment system reported that the schedulers add anestimate of the turnover time to the estimate of the ORtime provided by the surgeon. If an estimated caseduration is not provided by the surgeon, the sched-uled duration that they use is the trimmed mean of the
most recent 15 historical OR times for the surgeonperforming the procedure, plus an estimated turn-over. We therefore needed to analyze the resultingscheduled case durations and actual OR times todetermine how to estimate scheduled OR times (i.e.,time in the OR for Eq. 2) from scheduled case dura-tions (i.e., that from the preceding paragraph). Fromamong the 128,056 cases, there were 8045 cases (6.3%)that were combinations of surgeon and procedure(s)observed only once (i.e., singletons) and 3370 (2.6%)only observed twice (i.e., doubletons). The scheduledOR time was set at 96.3% of the scheduled caseduration, because doing so resulted in an unbiasedestimator for the 50th percentile of OR time for these11,415 cases (for details see Limitations section of Ref.8). We limited focus on these cases because the impactof the scheduled OR time is progressively less in Eqs.2 and 6 for each increase in nk. To check our use of thescheduled OR times, we then limited consideration tothe 560 singletons and 470 doubletons for which othersurgeons had scheduled the procedure(s) at least 30times. The mean OR times from the other surgeonswere used as the estimate of the OR time for thesingletons and doubletons.2,30 The mean � se of theabsolute error was just 2.9 � 1.4 min less than foruse of the resulting scheduled OR times. As for thepreviously studied hospital, use of scheduled ORtimes was essentially no worse than use of othersurgeons’ times, but offered the advantage of therebeing a value for every case.8
To estimate the � and � in Eqs. 1–11, we followedthe approach described in the Appendix of Ref. 8 Theactual OR times were obtained and their logarithmswere calculated for the 50,559 cases of 773 combina-tions of surgeon and procedure(s) with at least 30cases. The sample variance was determined for eachcombination. The inverses of the 773 sample varianceswere fit to a distribution using Systat 12 (SYSTATSoftware, San Jose, CA). From the method of mo-ments, the shape parameter was 2.33 and the scaleparameter was 5.68, giving estimates � � 2.33 and � �0.176. Those values are close to the � � 2.32 and � �0.142 published from another hospital.8
Application of the estimated � was an implemen-tation challenge. The decision support system repeat-edly calculates percentiles from t-distributions withnoninteger degrees of freedom (i.e., 2�k
* in Eq. 6).2,8–11
We wrote the SQL code to calculate the cumulativedistribution function of the t-distribution using itsrelationship with the Incomplete Beta Function.31 Theinverse is obtained iteratively using bisection over abracketed interval from values stored in a lookuptable. For example, for g � 0.26 and 2�k
* � 5.72, weaim to estimate T � 1�0.26, 5.72. We know a priorithat T�1�0.25, 5 T�1 �0.26, 5.72 T�1�0.30, 6.The lower and upper bounds both are stored in thelookup table and are used as the limits of the brack-eted interval.
Figure 5. Histogram of the difference �xk* � xsk
*�, where xk* is the
natural logarithm of the actual operating room (OR) time and xsk*
is the natural logarithm of the scheduled OR time. The graph islimited to the 99.0% of cases for which the differences range fromln(1/4) to ln(4). The graph is symmetric and centered close to zero,showing conceptually why xsk
* is a reasonable prior estimate for xk*.
936 Automatic Updating of Case Durations ANESTHESIA & ANALGESIA
To estimate the �, we again used the actual andscheduled OR times for the 50,559 cases of combina-tions of surgeon and procedure(s) with at least 30cases. The sample variance of the differences of thelogarithms of the actual and scheduled OR timesequaled 0.158. The variance of a t distribution with 2�
degrees of freedom equals322�
2� � 2. Setting nk � 0 in
Eq. 2, resulting in �k* � xsk
* in that equation, and
substituting into Eq. 1, Var�Xk* � xsk
*� ��
��
� 1
�
�2�
2� � 2�
�
� � 1�
� 1
�. Solving the equation
Var�Xk* � xsk
*� � 0.158 for � leads to � � 5.14 cases. Incomparison, we found � � 8.68 cases at the previoushospital studied.8 The accuracy of the Bayesian estimateswas insensitive to these relatively small differences in thevalue of � (see last section of Appendix of Ref. 8). Esti-mation of � was unaffected by the proportional correc-tion for bias, because the correction shifted only themean of �Xk
* � xsk*�, not the Var�Xk
* � xsk*�.
Figure 2 shows an example of the impact of differ-ences in parameter values among surgeons and proce-dure(s) on the relationship between d0.50�dmin and dmin. Forsimplicity, we set �k
* � ln(60 min). We used nk � �, andconsequently �k
* � � nk/2 � 2.33 5.14/2 �
4.90. For �k*, we used the two values 0.18 and 1.27, which
corresponded to the 10th and 90th percentiles of thedistribution of �k
* for cases with 0 nk 9.Figure 2 can be interpreted as a survival or reliabil-
ity analysis. The bottom pane shows that after thepatient has been in the OR for exp��k
*� time, themedian residual lifetime is nearly constant. Let�k
* � ���k*/�k
*� � ��� nk/�1 � nk�. For �k* �
0.18, �k* � 0.20. For �k
* � 1.27, �k* � 0.53. Generally, the
hazard rate of the lognormal distribution increases toa peak and then declines.33,34 However, for our rangeof �k
*,18 the time of the peak in the hazard ratesubstantially exceeds the median OR time.33,34 Conse-quently, for times from exp��k
*� to exp��k*�, the hazard
rate usually increases to a peak,34 and if it declines thatis for a vanishingly small percentages of cases. Thehazard rate can be examined using a statistics pack-ages by generating log normally distributed randomnumbers with parameters �k
* and �k*, and then apply-
ing the package’s parametric (lognormal) or nonpara-metric survival analysis.
There were n � 560 cases studied as part ofAppendices 3 and 4. We used the estimated posteriorparameters ��k
*, �k*, nk, and �k
*) from these cases toexplore simpler (non-Bayesian) estimation of the timeremaining in surgical cases (Fig. 4). In addition, weused the estimated posterior parameters to generalizeFigure 2 to all cases (Fig. 3). For each case, the 90%lower prediction bound �d0.90� was calculated using
Eq. 6 and then substituted into Eq. 11 to calculate themedian time remaining conditional on the case al-ready having taken as long as its 90% lower predictionbound �d0.50�d0.90�. Figure 3 shows cumulative histo-grams reporting the difference between d0.50�d0.90 andd0.90 and the difference reported as a percentage ofd0.50.
APPENDIX 3: “INSTANT MESSAGES” ANDTHEIR IMPLEMENTATION
The mean time from the end of surgery to exit fromthe OR was determined from an analysis of the 6 yr ofhistorical data in the hospital’s ORIMS. Conveniently,the mean was 15 min. Every 5 min, a SQL storedprocedure calculates the elapsed time in each case inprogress from patient entry into the OR. If the elapsedtime exceeds the scheduled case duration plus 10 min,and the “end of surgery” event has not been docu-mented by the anesthesia provider, the stored proce-dure writes a message, addressed to the recipientworkstation, to a database table. Each workstationqueries the database at 1 min intervals and displaysnew messages directed to its attention using the dialogshown in Figure 1. This process resulted in a meantime from the end of surgery to the message of 12.5min, since the query interval was 5 min. Becauseworkstations queried the database for messages every1 min, there was an additional mean latency of 0.5min. Together, the earliest that the message could besent was 10 min after the scheduled case duration, thelatest was 16 min, and the mean was 13 min.14
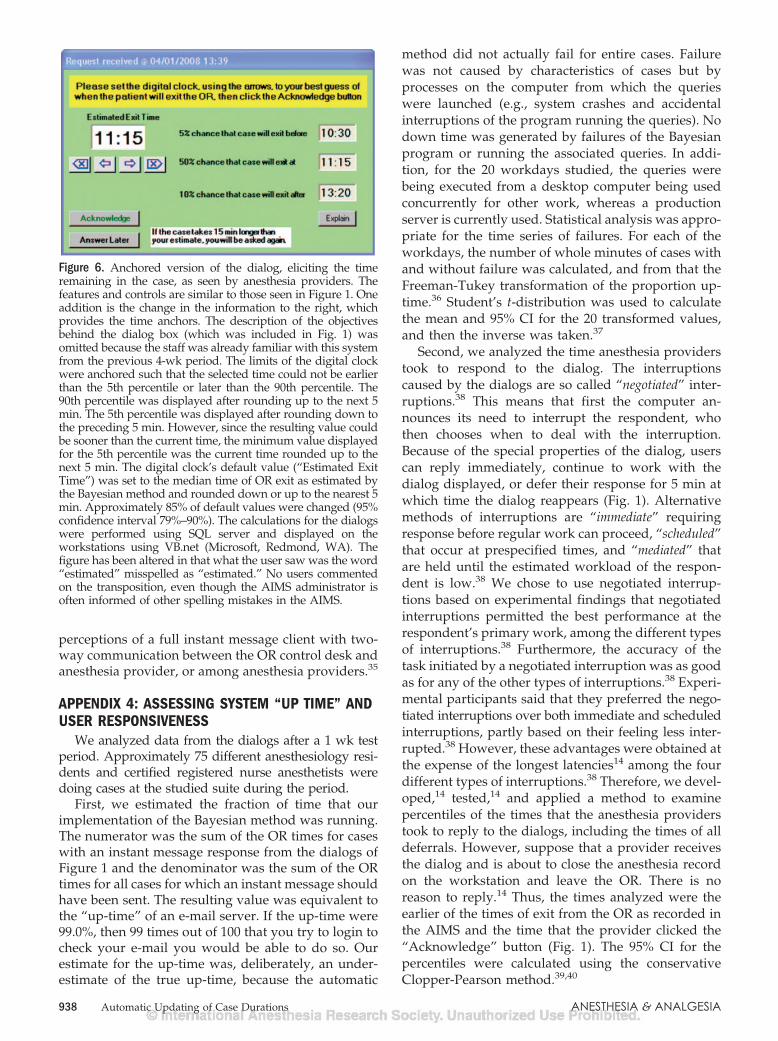
When asked, respondents use a digital clock torespond with an estimate of the time when the patientwill exit from the OR (Fig. 1). The clock is set to thecurrent time plus 15 min. Buttons are provided toadjust the clock forward or backward in 5 or 15 minincrements, with the minimum value accepted beingthe current time. The properties of this dialog box arethat it remains in front of all other applications, ispartially transparent (i.e., objects behind the dialog areviewable), and all controls on the screen canbe activated while the dialog remained displayed. Thedialog included a note telling the provider: “If the casetakes 15 min longer than your estimate, you will beasked again” (Fig. 1). The elicited time is sent back tothe database and replaces the scheduled case durationfor status displays, the decision support system, andfuture elicited times.
Our instant messages appeared as dialogs withforced responses (Figs. 1 and 6). Based on responses toad hoc messages sent by the OR director using theinstant messaging system, we expected that availabil-ity of a free text option would sometimes result inanswers about the time of patient exit that are re-ported not in units of time (e.g., “as soon as the x-rayis taken for the missing sponge” instead of “2:35 pm”).Thus, we do not know what would have been the
Vol. 108, No. 3, March 2009 © 2009 International Anesthesia Research Society 937
perceptions of a full instant message client with two-way communication between the OR control desk andanesthesia provider, or among anesthesia providers.35
APPENDIX 4: ASSESSING SYSTEM “UP TIME” ANDUSER RESPONSIVENESS
We analyzed data from the dialogs after a 1 wk testperiod. Approximately 75 different anesthesiology resi-dents and certified registered nurse anesthetists weredoing cases at the studied suite during the period.
First, we estimated the fraction of time that ourimplementation of the Bayesian method was running.The numerator was the sum of the OR times for caseswith an instant message response from the dialogs ofFigure 1 and the denominator was the sum of the ORtimes for all cases for which an instant message shouldhave been sent. The resulting value was equivalent tothe “up-time” of an e-mail server. If the up-time were99.0%, then 99 times out of 100 that you try to login tocheck your e-mail you would be able to do so. Ourestimate for the up-time was, deliberately, an under-estimate of the true up-time, because the automatic
method did not actually fail for entire cases. Failurewas not caused by characteristics of cases but byprocesses on the computer from which the querieswere launched (e.g., system crashes and accidentalinterruptions of the program running the queries). Nodown time was generated by failures of the Bayesianprogram or running the associated queries. In addi-tion, for the 20 workdays studied, the queries werebeing executed from a desktop computer being usedconcurrently for other work, whereas a productionserver is currently used. Statistical analysis was appro-priate for the time series of failures. For each of theworkdays, the number of whole minutes of cases withand without failure was calculated, and from that theFreeman-Tukey transformation of the proportion up-time.36 Student’s t-distribution was used to calculatethe mean and 95% CI for the 20 transformed values,and then the inverse was taken.37
Second, we analyzed the time anesthesia providerstook to respond to the dialog. The interruptionscaused by the dialogs are so called “negotiated” inter-ruptions.38 This means that first the computer an-nounces its need to interrupt the respondent, whothen chooses when to deal with the interruption.Because of the special properties of the dialog, userscan reply immediately, continue to work with thedialog displayed, or defer their response for 5 min atwhich time the dialog reappears (Fig. 1). Alternativemethods of interruptions are “immediate” requiringresponse before regular work can proceed, “scheduled”that occur at prespecified times, and “mediated” thatare held until the estimated workload of the respon-dent is low.38 We chose to use negotiated interrup-tions based on experimental findings that negotiatedinterruptions permitted the best performance at therespondent’s primary work, among the different typesof interruptions.38 Furthermore, the accuracy of thetask initiated by a negotiated interruption was as goodas for any of the other types of interruptions.38 Experi-mental participants said that they preferred the nego-tiated interruptions over both immediate and scheduledinterruptions, partly based on their feeling less inter-rupted.38 However, these advantages were obtained atthe expense of the longest latencies14 among the fourdifferent types of interruptions.38 Therefore, we devel-oped,14 tested,14 and applied a method to examinepercentiles of the times that the anesthesia providerstook to reply to the dialogs, including the times of alldeferrals. However, suppose that a provider receivesthe dialog and is about to close the anesthesia recordon the workstation and leave the OR. There is noreason to reply.14 Thus, the times analyzed were theearlier of the times of exit from the OR as recorded inthe AIMS and the time that the provider clicked the“Acknowledge” button (Fig. 1). The 95% CI for thepercentiles were calculated using the conservativeClopper-Pearson method.39,40
Figure 6. Anchored version of the dialog, eliciting the timeremaining in the case, as seen by anesthesia providers. Thefeatures and controls are similar to those seen in Figure 1. Oneaddition is the change in the information to the right, whichprovides the time anchors. The description of the objectivesbehind the dialog box (which was included in Fig. 1) wasomitted because the staff was already familiar with this systemfrom the previous 4-wk period. The limits of the digital clockwere anchored such that the selected time could not be earlierthan the 5th percentile or later than the 90th percentile. The90th percentile was displayed after rounding up to the next 5min. The 5th percentile was displayed after rounding down tothe preceding 5 min. However, since the resulting value couldbe sooner than the current time, the minimum value displayedfor the 5th percentile was the current time rounded up to thenext 5 min. The digital clock’s default value (“Estimated ExitTime”) was set to the median time of OR exit as estimated bythe Bayesian method and rounded down or up to the nearest 5min. Approximately 85% of default values were changed (95%confidence interval 79%–90%). The calculations for the dialogswere performed using SQL server and displayed on theworkstations using VB.net (Microsoft, Redmond, WA). Thefigure has been altered in that what the user saw was the word“estimated” misspelled as “estimated.” No users commentedon the transposition, even though the AIMS administrator isoften informed of other spelling mistakes in the AIMS.
938 Automatic Updating of Case Durations ANESTHESIA & ANALGESIA

APPENDIX 5: OBSERVATIONS AND RESULTINGDESIGN DECISIONS
Appendix 1 describes the deletion of 1.0% of casesbased on xsk
* and xk* applied to the historical data of
128,056 cases from 2001 to 2007, not to the new datafrom 2008. For new cases, we considered using proac-tive alerts. The Bayesian method can detect whether anew case has a statistically significant (P � 0.05)chance of taking less or more time than scheduled8,26:
�xsk* � �k
*�
��k*
�k* �
1 � nk
� nk
� T�1�1 � 0.05/2, 2�k*�. (12)
For example, there was a 99.8% chance that thelaparoscopic Nissen fundoplication scheduled for 75min would take longer than scheduled, based on thesurgeon’s average of 203 min for the previous 97 timesthe procedure was scheduled. However, for only 2.7%of the 129,380 cases was Eq. 12 satisfied (i.e., aberrantscheduled durations are rare). Furthermore, amongthose occurrences, the nk � 16 cases, the 5th percentileof nk was 30 cases (95% CI 30–30), and the 10thpercentile of nk was 41 cases (95% CI 35–45). Thus, asfor the other hospital at which we applied Eq. 12,26 thenk sufficiently exceeded � in Eqs. 2 and 4 that the xsk
*
had negligible influence on the resulting predictionbound of Eq. 11. Therefore, our Results are based onno alerts being used about the data entered includingoutliers in the scheduled duration. Instead, the systemsimply ignores scheduled durations of �15 min, set-tingxsk
* � �k* for xsk
* � ln(15 min).There were n � 373 acknowledgments from the
dialog of Figure 1. We calculated the median pairwisedifference between: i) the absolute error betweenthe actual time of patient exit and Eq. 11’s estimate ofthe median time of patient exit at the time of acknowl-edgment and ii) the absolute error between the actualtime of patient exit and the time elicited by the dialoginquiry. The median was used, because there weresome (� 3%) large outliers. As described in thepreceding paragraph, outliers were not excluded be-cause they do not affect the decision support system’srecommendations. The absolute error, and not theproportional error, was used because the absoluteerror measures the cost of the forecast error (e.g., foradd-on, moving case, and relief decisions2).17 The CIfor the median was calculated using the Clopper-Pearson method.39,40
Since the anesthesia providers’ estimates weremore accurate than the Bayesian method, we contin-ued the use of the dialogs, despite the resultinginterruption. However, because the difference wasonly 4.7 min (1.8% of median OR time, 95% CI: 2.0–9.4min) we limited use of the instant messages to casesexceeding the scheduled duration plus 13 min (see
Appendix 3). If the studied hospital had been classi-fying its cases not just based on surgeon and sched-uled procedure(s), but also based on type of anestheticand surgical team,19,20,41 likely the Bayesian methodwould have been more accurate.
Spearman rank correlation was tested between theproportion of like cases completed at the acknowl-edged time (pk�dmin, Eq. 10) and the case’s differencebetween the absolute errors. The CI for the rankcorrelation was calculated from the 373 paired values.There was no significant association between i) thedifference in absolute errors and ii) the number ofhistorical OR times (Spearman r � 0.09, 95% CI 0.09to 0.27). Thus, we based use of the instant messagessolely on exceedance of the scheduled duration plus13 min (see Appendix 3), not on characteristics of thecase’s estimated parameters.
We used least absolute values regression to estimatethe linear combination of intercept, Bayesian estimate,and elicited time remaining that minimized the absoluteerror in OR time remaining from the time of acknowl-edgment (Systat 12, simplex method). The use of leastabsolute values regression matches the rationale de-scribed two paragraphs above. The 95% CI of parame-ters were consistent with a model of the estimate being1/3rd Bayesian � 2/3rd elicited time. There was only a0.6 min reduction in error achieved by calculated aweighted combination of the elicited time and Bayesianestimate (0.2% of median OR time, 95% CI 0.4 to 1.5min). Thus, we decided that each elicited time wouldfully replace its case’s (original) scheduled OR time.
The median pairwise difference in absolute errorwas calculated between the regression estimate andthat of elicited time alone. The estimated proportionsof cases of the same combination of surgeon andprocedure(s) that were expected to have finishedbefore the times of acknowledgment were 0.47 (25thpercentile), 0.65 (50th), and 0.80 (75th), respectively.There was no pairwise association between i) theproportions of like cases that would be finished by thetime of acknowledgment and ii) the difference inabsolute errors (Spearman r � 0.03, 95% CI 0.07 to0.13, n � 373).
For the last 2 wk of the trial period (n � 187 cases),we tried to elicit more accurate estimates by usingwhat we thought was a more sophisticated dialog(Fig. 6). The new display included Bayesian estimates8
for the 5th and 90th percentiles of the time of OR exitfrom equation. These were obtained, respectively, bysetting g � 0.05 and g � 0.90 in Eq. 11. The limits of thedigital clock were anchored such that the selected timecould not be earlier than the 5th percentile or laterthan the 90th percentile, with times selectable to thenearest 5 min. The clock’s default value was set equalto the g � 0.50 Bayesian estimate of the time of ORexit. We calculated the Hodges-Lehmann estimate forthe median difference in the anesthesia provider’sabsolute errors with (Fig. 6) versus without (Fig. 1) the
Vol. 108, No. 3, March 2009 © 2009 International Anesthesia Research Society 939

anchors (StatXact-7, Cytel Software Corporation,Cambridge, MA).42 There was a trend toward largerabsolute errors as when compared with the use ofunanchored dialogs (difference 1.3 min, 95% CI 1.6to 4.1 min). Being a process improvement project, wepromptly returned to the use of Figure 1. Perhapsfuture experimental studies with OR managementdisplays21,43 could omit the default value or omit theanchors while keeping the provided information.
REFERENCES
1. Dexter F, Macario A, O’Neill L. A strategy for deciding operat-ing room assignments for second-shift anesthetists. AnesthAnalg 1999;89:920–4
2. Dexter F, Epstein RD, Traub RD, Xiao Y. Making managementdecisions on the day of surgery based on operating roomefficiency and patient waiting times. Anesthesiology 2004;101:1444–53
3. Nemeth C, O’Connor M, Klock PA, Cook R. Discoveringhealthcare cognition: the use of cognitive artifacts to revealcognitive work. Organ Stud 2006;27:1011–35
4. Xiao Y, Strader M, Hu P, Wasei M, Wieringa P. Visualizationtechniques for collaborative trajectory management. ACM Con-ference on Human Factors in Computing Systems 2006;1547–52
5. Healey AN, Sevdalis N, Vincent CA. Measuring intra-operativeinterference from distraction and interruption observed in theoperating theatre. Ergonomics 2006;49:589–604
6. Healey AN, Primus CP, Koutantji M. Quantifying distractionand interruption in urological surgery. Qual Saf Health Care2007;16:135–9
7. Xiao Y, Dexter F, Hu P, Dutton RP. Usage of distributeddisplays of operating room video when real-time occupancystatus was available. Anesth Analg 2008;106:554–60
8. Dexter F, Ledolter J. Bayesian prediction bounds and compari-sons of operating room times even for procedures with few orno historical data. Anesthesiology 2005;103:1259–67
9. Epstein RH, Dexter F, Piotrowski E. Automated correction ofroom location errors in anesthesia information managementsystems. Anesth Analg 2008;107:965–71
10. Dexter F, Macario A. What is the relative frequency of uncom-mon ambulatory surgery procedures in the United States withan anesthesia provider? Anesth Analg 2000;90:1343–7
11. Dexter F, Traub RD, Fleisher LA, Rock P. What sample sizes arerequired for pooling surgical case durations among facilities todecrease the incidence of procedures with little historical data?Anesthesiology 2002;96:1230–6
12. Xiao Y, Hu P, Hao H, Ho D, Dexter F, Mackenzie CF, Seagull FJ,Dutton R. Algorithm for processing vital sign monitoring datato remotely identify operating room occupancy in real-time.Anesth Analg 2005;101:823–9
13. Sandberg WS, Sandberg EH, Seim AR, Anupama S, EhrenfeldJM, Spring SF, Walsh JL. Real-time checking of electronicanesthesia records for documentation errors and automaticallytext messaging clinicians improves quality of documentation.Anesth Analg 2008;106:192–201
14. Epstein RH, Dexter F, Ehrenfeld JM, Sandberg WS. Implicationsof event entry latency on anesthesia information managementsystem decision support systems. Anesth Analg 2009;108:941–7
15. Riley R, Forsyth R, Manias E, Iedema R. Whiteboards: mediat-ing professional tensions in clinical practice. Commun Med2007;4:165–75
16. Dexter F, Lee JD, Dow AJ, Lubarsky DA. A psychological basisfor anesthesiologists’ operating room managerial decision-making on the day of surgery. Anesth Analg 2007;105:430–4
17. Dexter F, Traub RD, Qian F. Comparison of statistical methodsto predict the time to complete a series of surgical cases. J ClinMonit Comput 1999;15:45–51
18. Zhou J, Dexter F, Macario A, Lubarsky DA. Relying solely onhistorical surgical times to estimate accurately future surgicaltimes is unlikely to reduce the average length of time casesfinish late. J Clin Anesth 1999;11:601–5
19. Strum DP, Sampson AR, May JH, Vargas LG. Surgeon and typeof anesthesia predict variability in surgical procedure times.Anesthesiology 2000;92:1454–67
20. Dexter F, Dexter EU, Masursky D, Nussmeier NA. Systematicreview of general thoracic surgery articles to identify predictors ofoperating room case durations. Anesth Analg 2008;106:1232–41
21. Dexter F, Willemsen-Dunlap A, Lee JD. Operating room mana-gerial decision-making on the day of surgery with and withoutcomputer recommendations and status displays. Anesth Analg2007;105:419–29
22. Dexter F, Macario A, Traub RD. Which algorithm for schedulingadd-on elective cases maximizes operating room utilization?Use of bin packing algorithms and fuzzy constraints in operat-ing room management. Anesthesiology 1999;91:1491–500
23. Dexter F, Traub RD. How to schedule elective surgical cases intospecific operating rooms to maximize the efficiency of use ofoperating room time. Anesth Analg 2002;94:933–42
24. McIntosh C, Dexter F, Epstein RH. Impact of service-specificstaffing, case scheduling, turnovers, and first-case starts onanesthesia group and operating room productivity: tutorialusing data from an Australian hospital. Anesth Analg 2006;103:1499–516
25. Xiao Y, Kiesler S, Mackenzie CF, Kobayashi M, Plasters C,Seagull FJ, Fussell S. Negotiation and conflict in large scalecollaboration: a preliminary field study. Cogn Tech Work2007;9:171–6
26. Dexter F, Macario A, Ledolter J. Identification of systematicunder-estimation (bias) of case durations during case schedul-ing would not markedly reduce over-utilized operating roomtime. J Clin Anesth 2007;19:198–203
27. Wachtel RE, Dexter F. Simple method for deciding what timepatients should be ready on the day of surgery withoutprocedure-specific data. Anesth Analg 2007;105:127–40
28. Dexter F, Traub RD. Statistical method for predicting whenpatients should be ready on the day of surgery. Anesthesiology2000;93:1107–14
29. Peterson C, Miller A. Mode, median, and mean as optimalstrategies. J Exp Psychol 1964;68:363–7
30. Macario A, Dexter F. Estimating the duration of a case when thesurgeon has not recently performed the procedure at thesurgical suite. Anesth Analg 1999;89:1241–5
31. Press WH, Teukolsky SA, Vetterling WT, Flannery BP. Numeri-cal recipes in FORTRAN. The Art of scientific computing. 2nded. New York: Cambridge University Press, 1992:207,220–222
32. Johnson NL, Kotz S, Balakrishnan N. Continuous univariatedistributions. Vol 2. 2nd ed. New York: John Wiley & Sons,1995:366
33. Chang DS. Critical time of the lognormal distribution. Micro-electron Reliab 1994;34:261–6
34. Chang DS. Optimal burn-in decision for products with anunimodal failure rate function. Eur J Oper Res 2000;126:534–40
35. Garrett RK, Danziger JN. IM�Interruption management? In-stant messaging and disruption in the workplace. J ComputMediat Commun 2007;13:article 2
36. Mosteller F, Youtz C. Tables of the Freeman-Tukey transforma-tions for the binomial and Poisson distributions. Biometrika1961;48:433–40
37. Dexter F, Marcon E, Epstein RH, Ledolter J. Validation ofstatistical methods to compare cancellation rates on the day ofsurgery. Anesth Analg 2005;101:465–73
38. McFarlane DC. Comparison of four primary methods for coor-dinating the interruption of people in human–computer inter-action. Hum Comput Interact 2002;17:63–139
39. Clopper CJ, Pearson ES. The use of confidence or fiduciallimits illustrated in the case of the binomial. Biometrika1934;26:404 –13
40. Hahn GJ, Meeker WQ. Statistical intervals. A guide for practi-tioners. New York: Wiley, 1991:82–4,100–5
41. Combes C, Meskens N, Rivat C, Vandamme JP. Using a KDDprocess to forecast the duration of surgery. Int J Prod Econ2008;112:279–93
42. Maritz JS, Wu M, Stuadte RG Jr. A location estimator based ona U-statistic. Ann Stat 1977;5:779–86
43. Dexter F, Xiao Y, Dow AJ, Strader MM, Ho D, Wachtel RE.Coordination of appointments for anesthesia care outside ofoperating rooms using an enterprise-wide scheduling system.Anesth Analg 2007;105:1701–10
940 Automatic Updating of Case Durations ANESTHESIA & ANALGESIA