
Automatic interpretation of salt geobodies Adam Halpert ExxonMobil CEES Visit 12 November 2010...
22
Automatic interpretation of salt geobodies Adam Halpert ExxonMobil CEES Visit 12 November 2010 anford Exploration Project
-
Upload
chester-fisher -
Category
Documents
-
view
217 -
download
1
Transcript of Automatic interpretation of salt geobodies Adam Halpert ExxonMobil CEES Visit 12 November 2010...
Automatic interpretation of salt geobodies
Adam Halpert
ExxonMobil CEES Visit12 November 2010
Stanford Exploration Project

Why automate?
• Save time• Manual salt-picking is tedious, time-consuming
• Major bottleneck for iterative imaging/model-building
• Maximize expertise• Allow experienced interpreters to focus on more complex
geological problems
• Improve health?• Manual picking contributes to ergonomic strain

Automation strategies
1. “Traditional” horizon auto-trackers

Example image

Auto-tracking
SEED POINTS

Auto-tracking

Auto-tracking
SEED POINTS

Auto-tracking

Automation strategies
1. “Traditional” horizon auto-trackers- Still requires significant user input- Can get “lost” at local horizon discontinuities
2. Global image segmentation

Graph segmentation• Any image (seismic or otherwise) can be thought of as
a graph– Each pixel is a node or vertex of the graph– Vertices are connected by edges
• Each edge is assigned a weight– Usually, a measure of similarity or dissimilarity between
pixels
• A segmentation (or graph partition) groups these edges into subsets of the image– Edges between vertices in the same subset (segment)
will have low weights– Edges between vertices in different segments will have
higher weights– (or vice versa)

Pairwise Region Comparison• Felzenszwalb and Huttenlocher (2004):
Efficient graph-based image segmentation
• Two major goals• Capture global aspects of the image• Be highly efficient (~linear with number
of pixels)
• Construct edges between each pixel and its neighboring pixels• Weight the edges based on the highest-
intensity pixel between the two endpoints

The algorithm
1. Create the edges and store their location and weight value
2. Sort the m graph edges by increasing edge weight
3. For initial segmentation S0, each pixel/vertex is its own segment
4. For each graph edge q in the sorted list from Step 1, if the difference criterion is met, Sq is created by merging the two pixels or regions the edge connects
• Otherwise, do nothing
5. Sm is the segmented image
[C++ implementation]

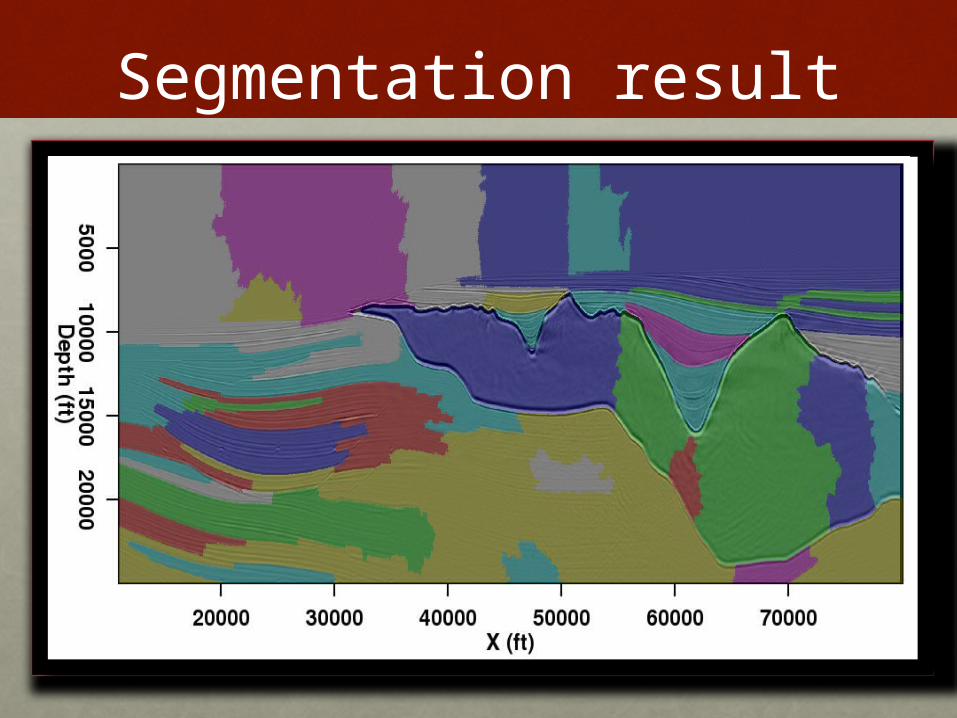
Example 1: 2D Field

Segmentation result
150 x 500:1 sec

Example 2: 2D Synthetic
Segmentation result

Pick segments to merge

Merged result
1000 x 2760:41 sec

Example 3: 3D Field

Segmentation result
114 x 534 x 51:39 sec

Automation strategies
1. “Traditional” horizon auto-trackers- Still requires significant user input- Can get “lost” at local horizon discontinuities
2. Global image segmentation- PRC method requires little user input, but can
offer flexibility- Accurately and efficiently segments 2D and 3D
images

Planned enhancements
• Segmentation with multiple seismic attributes
• Increased opportunity for user input/prior knowledge inclusion
• Ultimately: link segmentation results with velocity updates and imaging